Article

Effects on Crop Development, Yields and Chemical Composition of Celeriac (Apium graveolens L. var. rapaceum) Cultivated Underneath an Agrivoltaic System

1
Department of Plant Ecology and Ecotoxicology, Institute of Landscape and Plant Ecology, University of Hohenheim, 70599 Stuttgart, Germany
2
Department of Biobased Resources in the Bioeconomy, Institute of Crop Science, University of Hohenheim, 70599 Stuttgart, Germany
3
Center for Organic Farming, University of Hohenheim, 70599 Stuttgart, Germany
*
Author to whom correspondence should be addressed.
Agronomy 2021, 11(4), 733; https://doi.org/10.3390/agronomy11040733
Submission received: 3 March 2021 / Revised: 3 April 2021 / Accepted: 7 April 2021 / Published: 10 April 2021
(This article belongs to the Special Issue Photovoltaics and Electrification in Agriculture)

Abstract

:
Agrivoltaic (AV) systems increase land productivity through the combined production of renewable energy and food. Although several studies have addressed their impact on crop production, many aspects remain unexplored. The objective of this study was to determine the effects of AV on the cultivation of celeriac, a common root vegetable in Central Europe. Celeriac was cultivated in 2017 and 2018 as part of an organically managed on-farm experiment, both underneath an AV system and in full-sun conditions. Under AV, photosynthetic active radiation was reduced by about 30%. Monitoring of crop development showed that in both years, plant height increased significantly under AV. Fresh bulb yield decreased by about 19% in 2017 and increased by about 12% in 2018 in AV, but the changes were not significant. Aboveground biomass increased in both years under AV, but only increased significantly in 2018. As aboveground biomass is a determinant of root biomass at harvest in root vegetables, bulb yields may be further increased by a prolonged vegetation period under AV. Compound analysis of celeriac bulbs did not show any clear effects from treatment. As harvestable yields were not significantly reduced, we concluded that celeriac can be considered a suitable crop for cultivation under AV.

1. Introduction

Agrivoltaic (AV) systems are currently being implemented in a number of countries as an approach for the dual use of arable land for renewable energy and agricultural production [1,2]. It has been shown that both land productivity and farm income can be increased by the additional energy generated through AV [1,2,3,4,5]. Recently, first concepts for the integration of AV into prospective farming systems—e.g., in combination with farming robots—have been proposed [6]. However, considering the land use conflict between food and energy production, a sustained adequate agricultural yield needs to be guaranteed if AV systems are to be used. This necessitates further field studies on the performance of agricultural crops under AV. The implementation of AV is currently being investigated in field trials by several researchers [2,5,7,8,9]. So far, a number of crops have been assessed for their suitability for cultivation underneath AV, including lettuce [8], corn [10], potatoes, winter wheat [9], and fruit vegetables (such as cherry tomatoes and chili peppers) [7]. Additionally, grass-clover has been investigated as a perennial forage crop [9]. These studies have shown that sufficient crop yields can be achieved in the partial shade of the photovoltaic (PV) modules of AV systems, but agricultural yield reductions of up to 20% can occur [8,9,11]. By contrast, in hot and dry weather conditions, reduced solar radiation and microclimatic alterations under AV (e.g., lower soil [8,9] and air temperatures [9] and potential advantages in water use efficiency [12]) can be beneficial for crop production and lead to increased yields [7,9].
The present study was conducted on-farm within a field trial with four different crops (celeriac, grass-clover, potato and winter wheat) cultivated underneath an AV system. The crops were cultivated as part of a crop rotation under organic management. This setup was chosen because, to date, no AV studies have been conducted under organic field management conditions. Furthermore, organic farming generally strives to reduce external inputs “by reuse, recycling and efficient management of materials and energy in order to maintain and improve environmental quality and conserve resources”, as a matter of principle—as described by the International Federation of Organic Agriculture Movements (IFOAM) [13]. Thus, organic farming also addresses energetic self-sufficiency and the replacement of fossil energy resources. As such, AV would appear an appropriate approach in this context. Further details on the field trial were reported by Weselek et al. [9]. Harvestable crop yields decreased by 18.7% (wheat), 18.2% (potatoes) and 5.3% (grass-clover) in 2017, but increased by 2.7% (wheat) and 11% (potatoes) in 2018. Grass-clover yields in 2018 were reduced by 7.8% [9]. The results were linked to quite distinct climatic differences between the years; 2018 brought lower precipitation, higher temperatures and greater solar irradiance. In the same time frame, 246 MWh of energy were generated by the AV facility in the first cropping year, which corresponds to about 83% of the electrical yield a conventional ground-mounted PV installation covering the same area would have achieved [14]. Hence, even with a reduction of harvestable crop yield of 18.7% for winter wheat in 2017, overall land productivity was increased by about 56% in comparison to single crop and PV production [14]. The results further emphasized findings from previous studies [3] on the benefits of AV regarding land use and land productivity.
As a recent study showed, long term land productivity and market certainty are often seen as the main arguments favoring the implementation of AV from farmers’ perspective [15]. This emphasizes the need for agricultural field trials. However, experimental data on the impact of AV on crop production are scarce; few data are available for field vegetables and, in particular, root vegetables. In 2017, vegetables were cultivated on a total area of 2.2 million hectares in Europe [16]. As comparatively high market revenues can be achieved with vegetables, the impacts of AV on cultivation and harvestable crop yields will be of major interest. Celeriac (Apium graveolens L. var. rapaceum), also known as turnip-rooted celery or knob celery, is a celery variety cultivated primarily in Central and Eastern Europe [17,18]. In contrast to common celery (Apium graveolens var. graveolens) and leaf celery (Apium graveolens var. secalinum), this biennial crop forms large bulbs in the first cropping year—which consist of hypocotyl, tap root and stem in equal proportions [17]. Celeriac bulbs have white flesh and can be used both cooked and raw. In 2018, organic celeriac was cultivated on a total of about 219 hectares in Germany, producing 6853 tons of harvested celeriac bulbs [19].
The aim of our study was to investigate how celeriac (a common field vegetable) would be affected if it were cultivated underneath the solar panels of an AV system (Figure 1). In addition to examining parameters such as crop development and yields, the study examined, for the first time, how altered microclimatic conditions in the partial shade of the AV facility affected the chemical composition—and consequently, the quality—of celeriac.

2. Material & Methods

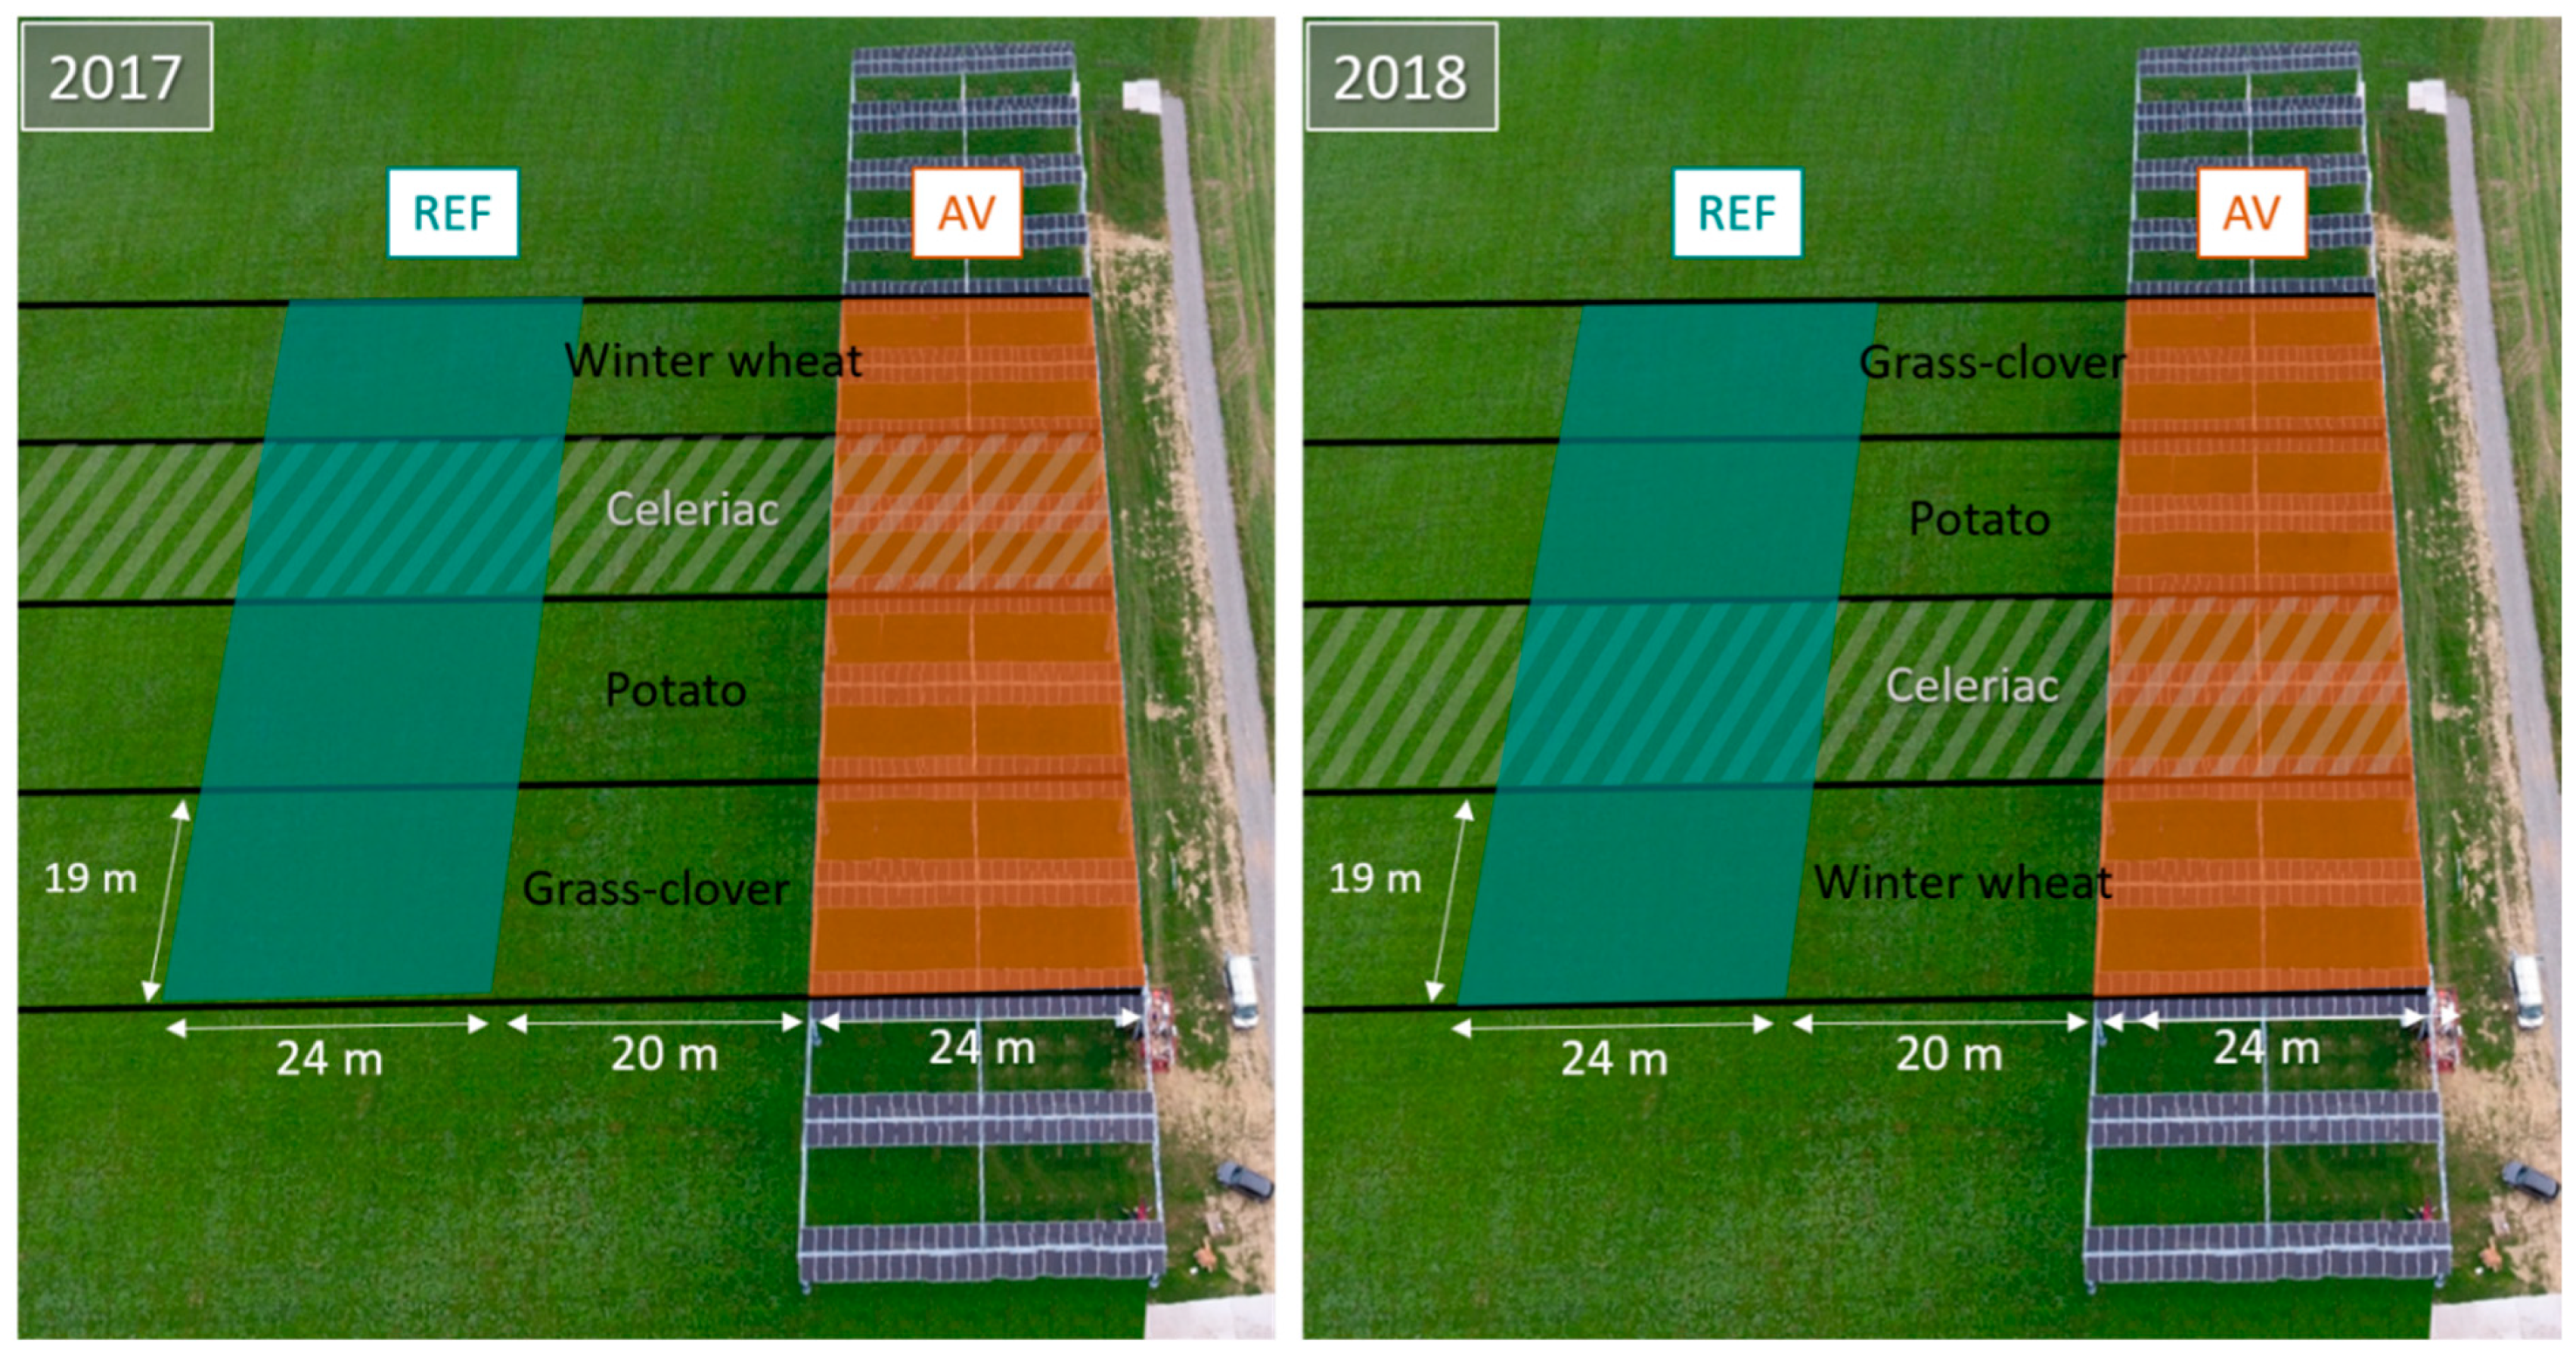
2.1. Site Description & Field Experiment
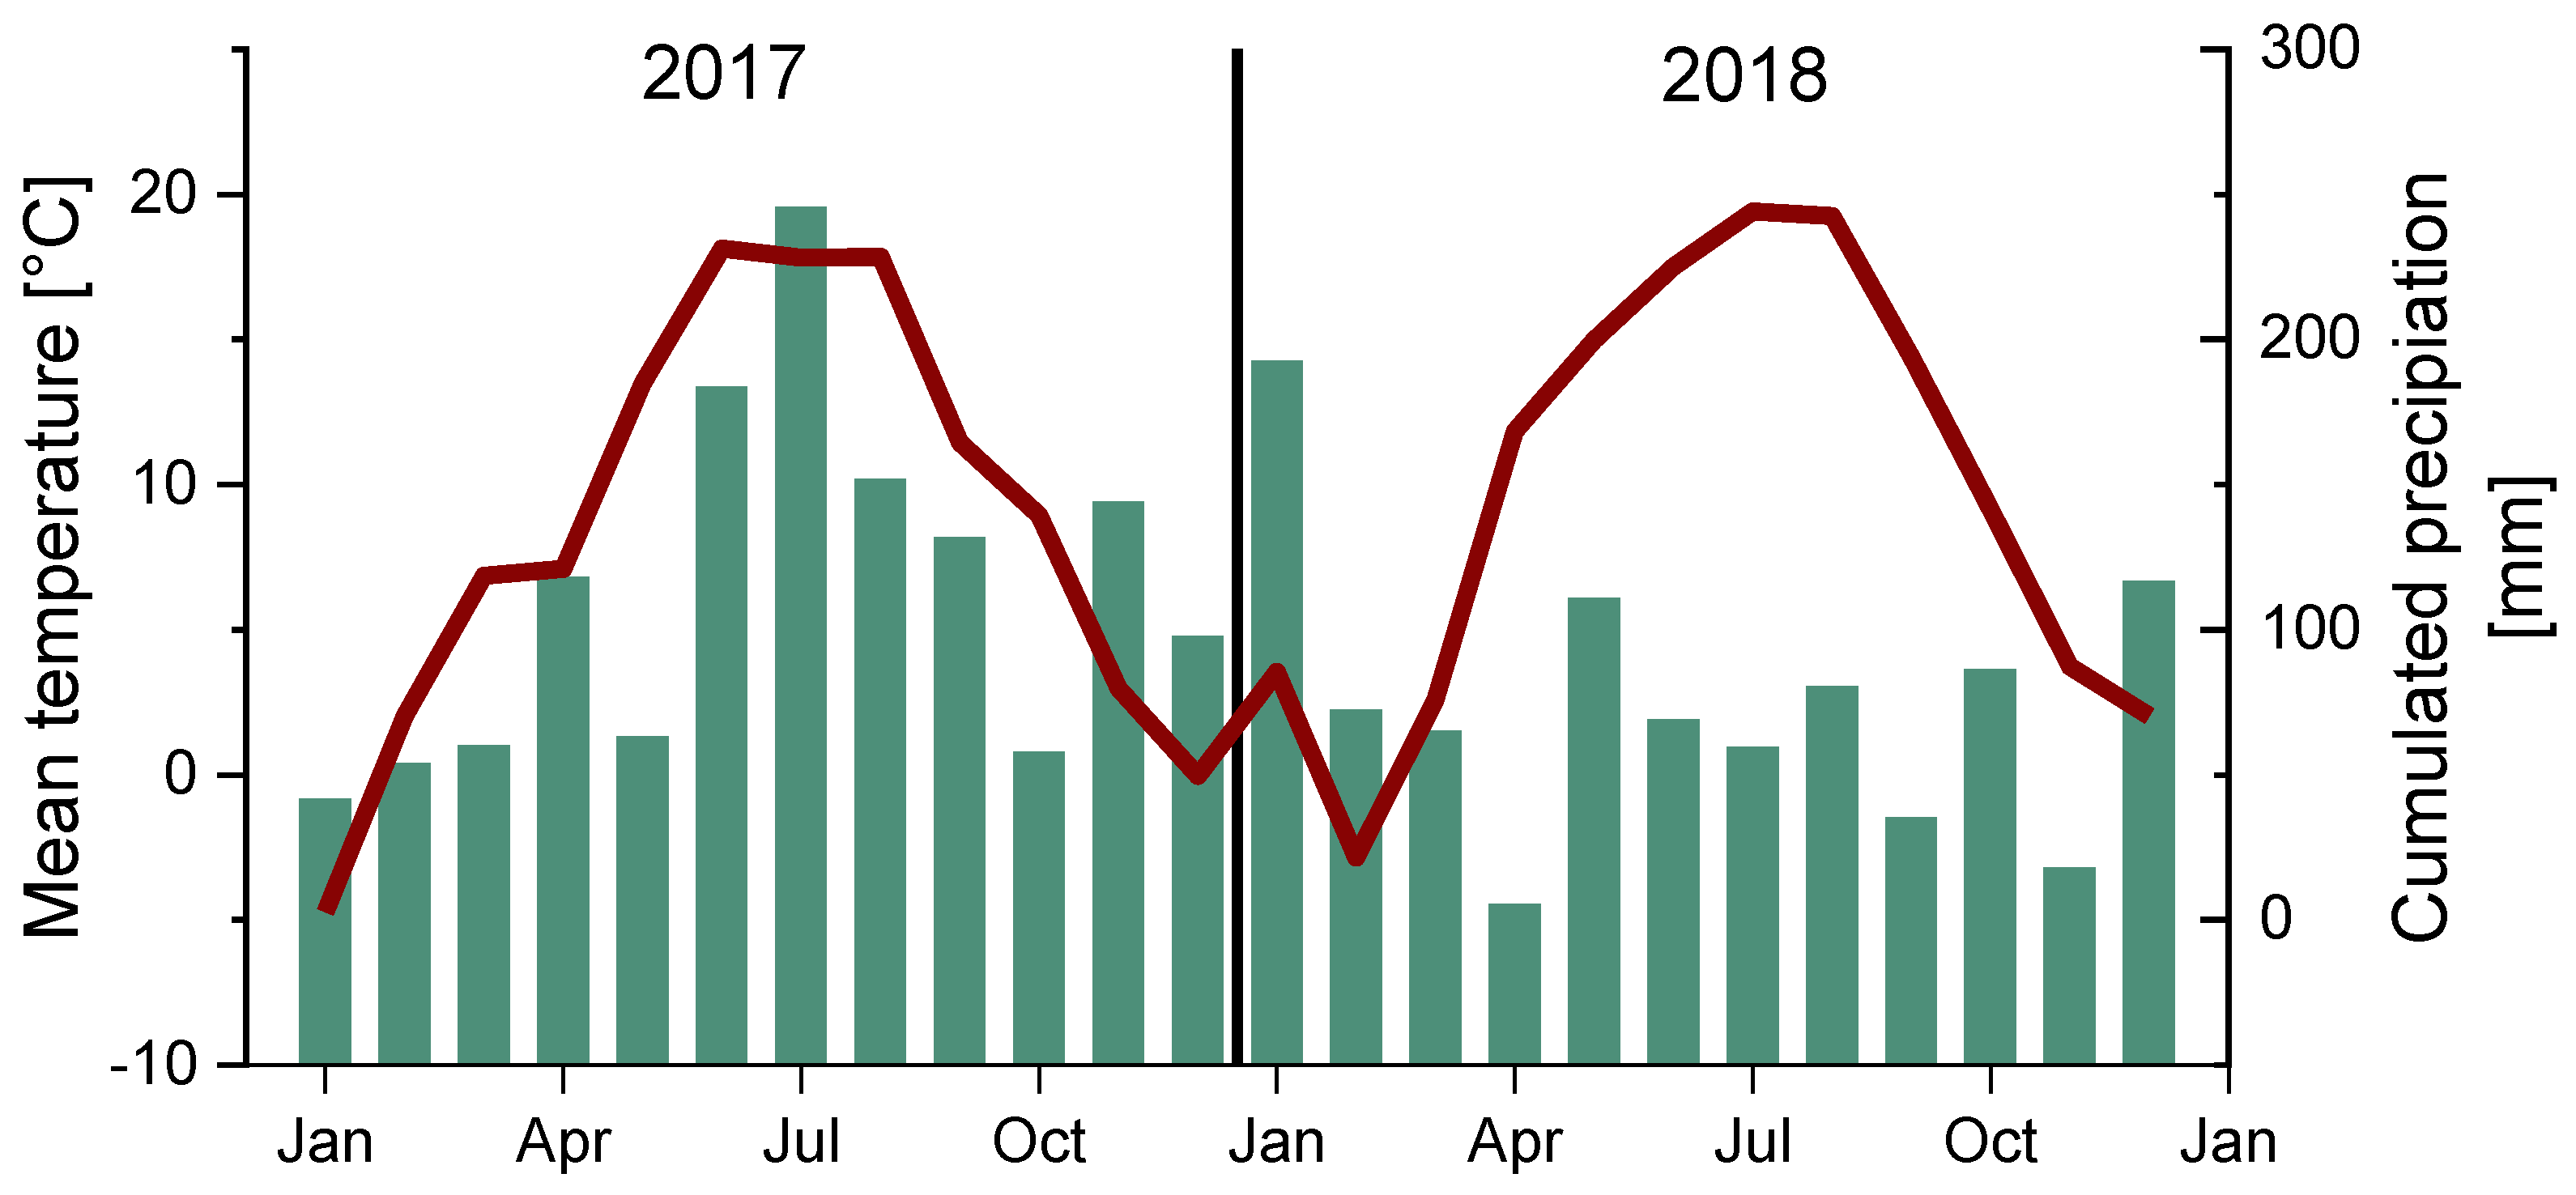
Celeriac was cultivated as part of an on-farm field experiment using a four-year crop rotation (along with winter wheat (Tricticum aestivum), potato (Solanum tuberosum) and grass-clover) [9]. The field trial was performed on a commercial farm managed according to biodynamic principles (Demeter) as described in [9]. Details on the design of the AV facility were described by Trommsdorff et al. [14]. In both 2017 and 2018, celeriac was grown on a strip 24 m long and 19 m wide under an AV system, with a total size of 0.3 ha. Additional celeriac was grown on an adjacent reference area (REF) without solar panels (Figure 2). To avoid any shading of the REF site, it was located at a distance of 20 m from the AV facility. On both sites, four trial plots of 1 m² were defined. To reduce border effects—in particular under the AV facility—the plots were located at least 4 m from the sites′ borders. Celeriac plantlets (Apium graveolens L. var. rapaceum, Goliath variety) were sown in seed trays and planted out around development stage 13 (according to BBCH (Biologische Bundesanstalt, Bundessortenamt und CHemische Industrie) scale for root and stem vegetables [20]) at a density of 45,000 plants per hectare. In both years, planting took place on 5 May. The celeriac cropping area was fertilized with 15 t composted cow manure per hectare between mid-February and mid-March. Biodynamic preparations (20 l per hectare each of horn manure and horn silica) were sprayed according to Demeter guidelines twice a year. Weed control was mainly conducted by currycombing before planting (twice) and hoeing after planting (up to four times). Additional hand weeding was performed if weed pressure became high within the rows. In 2017, the preceding crop was perennial grass-clover; in 2018, it was potato. For further information on field management, see [9].

2.2. Microclimate

Microclimate was monitored via eight microclimate stations (i.e., four per treatment) on the celeriac cropping area, each assigned to one of the trial plots. Each microclimate station was equipped with different sensors and recorded various microclimatic parameters. Air temperature and humidity were measured at a height of 2 m using a VP-4 sensor. Soil temperature and moisture were measured at a depth of approximately 25 cm using a 5TM sensor. Due to tillage operations, soil sensors were only installed during the celeriac cropping period from 8 June to 10 October in 2017, and from 9 May to 22 October 2018. Photosynthetic active radiation (PAR) was estimated by photosynthetically active photon flux density (PPFD) using a QSO-S sensor. All parameters were recorded with data loggers (EM50G). Data loggers (and the sensors mentioned above) were obtained from METER Group AG (Munich, Germany). In addition to the data collected in the field trial, meteorological data for comparison were obtained from Agricultural Meteorology Baden-Wuerttemberg, published by the Agricultural Technology Centre Augustenberg (LTZ) [21]. The weather station nearest to the field trial was located at Billafingen (47.83° latitude 9.13° longitude), 2 kilometers away. Mean monthly temperature and accumulated precipitation are shown in Figure 3 (data taken from Billafingen weather station [21]). Note that values recorded in the field trial cannot be directly compared with those recorded at the weather station, as they are located at different spots and their instruments have not been calibrated. Furthermore, in 2018, no values were recorded at our field trial from 11 to 13 December due to a power outage.
Climatic conditions varied greatly between the two years. In 2017, annual accumulated precipitation was 1351 mm, annual solar was radiation 1180 kWh/m2, and mean annual temperature was 8.6 °C. In 2018, accumulated precipitation was 916 mm, annual solar radiation was 1204 kWh/m², and mean annual temperature was 9.7 °C.

2.3. Crop Monitoring & Harvest

Crop development was monitored over two growing seasons, beginning in May (both years) immediately after the celeriac was planted and lasting until shortly before final harvest. The last monitoring dates were 26 September in 2017 and 18 October in 2018. In each of the defined plots, 12 individual plants were selected and tagged. Of these, 10 plants were monitored and two were kept as backup in case of plant losses. Crop development was monitored every two weeks. Crop height was measured using a folding rule. Leaf area index (LAI) was measured using a plant canopy analyzer (LAI-2200C, LI-COR Biosciences, Lincoln, Dearborn, MI, USA). On each monitoring date, twelve single measurements were taken per plot: six measurements between plants within the rows, and six measurements between rows. The final harvest was performed on the farm’s actual harvest dates. The 12 selected plants in each plot were harvested manually. Each celeriac plant was separated into aboveground and belowground biomass. Remaining roots were roughly removed from the bulbs. The aboveground biomass from each plot was weighed and subsequently dried for 48 h at 60°C to determine dry matter yield. Diameter and weight of each celeriac bulb was measured. For the analysis of chemical composition, bulbs were peeled, washed with distilled water and ground (Thermomix, Vorwerk, Wuppertal, Germany). The resulting fibrous pulp was freeze-dried at 0.34 mbar and −32°C until completely dry and then stored at −20°C for further analysis.

2.4. Analysis of Chemical Composition

For chemical analysis, the freeze-dried samples were ground to a fine powder (MM400, Retsch, Haan, Germany) using ceramic grinding jars to avoid any heavy metal contamination. Before analysis by ICP-OES and ICP-MS, samples were digested by microwave pressure digestion (UltraCLAVE III, MLS, Leutkirch, Germany) according to method 10.8.1.2 of the Association of German Agricultural Analytic and Research Institutes (VDLUFA) [22]. For analysis of Al and Si, samples were additionally digested with 0.5 M hydrofluoric acid to avoid silicate formation. The minerals Al, B, Ba, Ca, Cu, Fe, K, Mg, Mn, Na, P, Zn, and Si were analyzed by ICP-OES (5100 ICP-OES, Agilent, Santa Clara, USA) according to EN standard 15621:2017-10 [23]. The trace elements and heavy metals Cd, Co, Cr, Mo, Ni, Pb, Se, Fe, Cl, and I were analyzed by Inductively Coupled Plasma Mass Spectrometry ICP-MS (NexION 300X ICP-MS, PerkinElmer, Waltham, MA, USA) according to the VDLUFA (Verband deutscher landwirtschaftlicher Untersuchungs- und Forschungsanstalten) method 17.9.1 [24]. For Cl analysis, samples were extracted in simmering water according to VDLUFA method 2.2.2.2 [25]. For iodine analysis, samples were extracted with 0.5% ammonium hydroxide according to VDLUFA method 2.2.2.3 [26]. Carbon and sulfur were analyzed based on the Dumas combustion method [27]. Crude protein, crude fat and crude fiber were determined (using a Fibertherm apparatus, C. Gerhardt, Königswinter, Germany) following the European Commission (EC) regulation No. 152/2009 III [28]. For the calculation of crude protein, the N concentration was multiplied by a conversion factor of 6.25. Neutral detergent fiber (amylase treated, after ashing; aNDFom), acid detergent fiber (after ashing; ADFom), and acid detergent lignin (ADL) were determined according to VDLUFA methods 6.5.1, 6.5.2 and 6.5.3 [29,30,31], respectively, using a Fibertherm apparatus (Fibertherm, C. Gerhardt, Königswinter, Germany). In 2017, aNDFom, ADFom and ADL were not analyzed due to insufficient sample material.

2.5. Statistical Analysis

Statistical analysis was conducted according to the method of Weselek et al. [9]. The experimental setup can be considered a single replicate of a strip-plot design with two treatments, AV and REF. Note that a true replicate for the treatment would require another AV system. The data analysis was carried out with SAS software version 9.4 (SAS Institute Inc., Cary, NC, USA) using the following model for crop development:
y i j k l = μ + b k i j + τ i + φ j + ( τ φ ) i j + e i j k l ,
where b k i j is the fixed effect of lane k in treatment i at day j, τ i is the i-th treatment effect,   φ j is the j-th day effect and ( τ φ ) i j is the interaction effect of day j and treatment i. e i j k l is the repeated measurement error of observation y i j k l with a first-order autoregressive variance-covariance structure of error effects from the same measuring point. Note that the variance of repeated measurements on the same plot underestimates the true error variance, and thus all tests are too liberal.
As harvestable crop yield was measured in two successive years but only once per year, an analogous model to (1) can be fitted replacing day j by year n:
y i n k l = μ + b k i n + τ i + ρ n + ( τ ρ ) i n + e i n k l ,
where ρ n and ( τ ρ ) i n are the effects of the n-th year and its interaction effects with treatment. All other effects are defined analogously to model (1).
Analysis of chemical composition was conducted accordingly for each parameter:
y i n k l = μ + b k i n + τ i + ρ n + ( τ ρ ) i n + e i n k l
where significant differences were found via an F test, a multiple t-test (Fisher′s LSD test) was performed. Results of multiple t-tests are presented as a letter display.

3. Results & Discussion

3.1. Microclimate

An overview of the results of microclimate monitoring is presented in Table 1. Photosynthetic active radiation was, on average, reduced by about 29.5% under AV, which is within the range of the results from previous modeling and field studies, where reductions of irradiance ranged from 12% up to more than 60%, depending on the setup of the AV system [3,32,33]. Soil temperature was reduced by 1.2 °C in 2017 and 1.4 °C in 2018. This is in accordance with findings from Marrou et al. [32], who also found soil temperature to be reduced under AV. In 2017, yearly mean soil moisture was 1.9% higher under AV, while it decreased by about 3.1% in 2018. In both years, yearly mean air humidity was 2.8% higher in AV compared to REF. No differences between the treatments were found in yearly mean air temperature. In contrast, Marrou et al. [32] did not find any differences in aerial microclimate (temperature and humidity) between AV and unshaded control. The results also reflect the differences between the years—as also shown by the weather data recorded at the weather station in Billafingen (see Section 2.2.)—with comparably high temperatures and dry conditions in 2018. The yearly mean air temperature was 1.7 °C higher in 2018 compared to 2017. Air humidity and soil moisture were lower in both treatments compared to 2017. Additionally, photosynthetic photon flux density was slightly increased in 2018. Further details on microclimate monitoring have been reported [9].

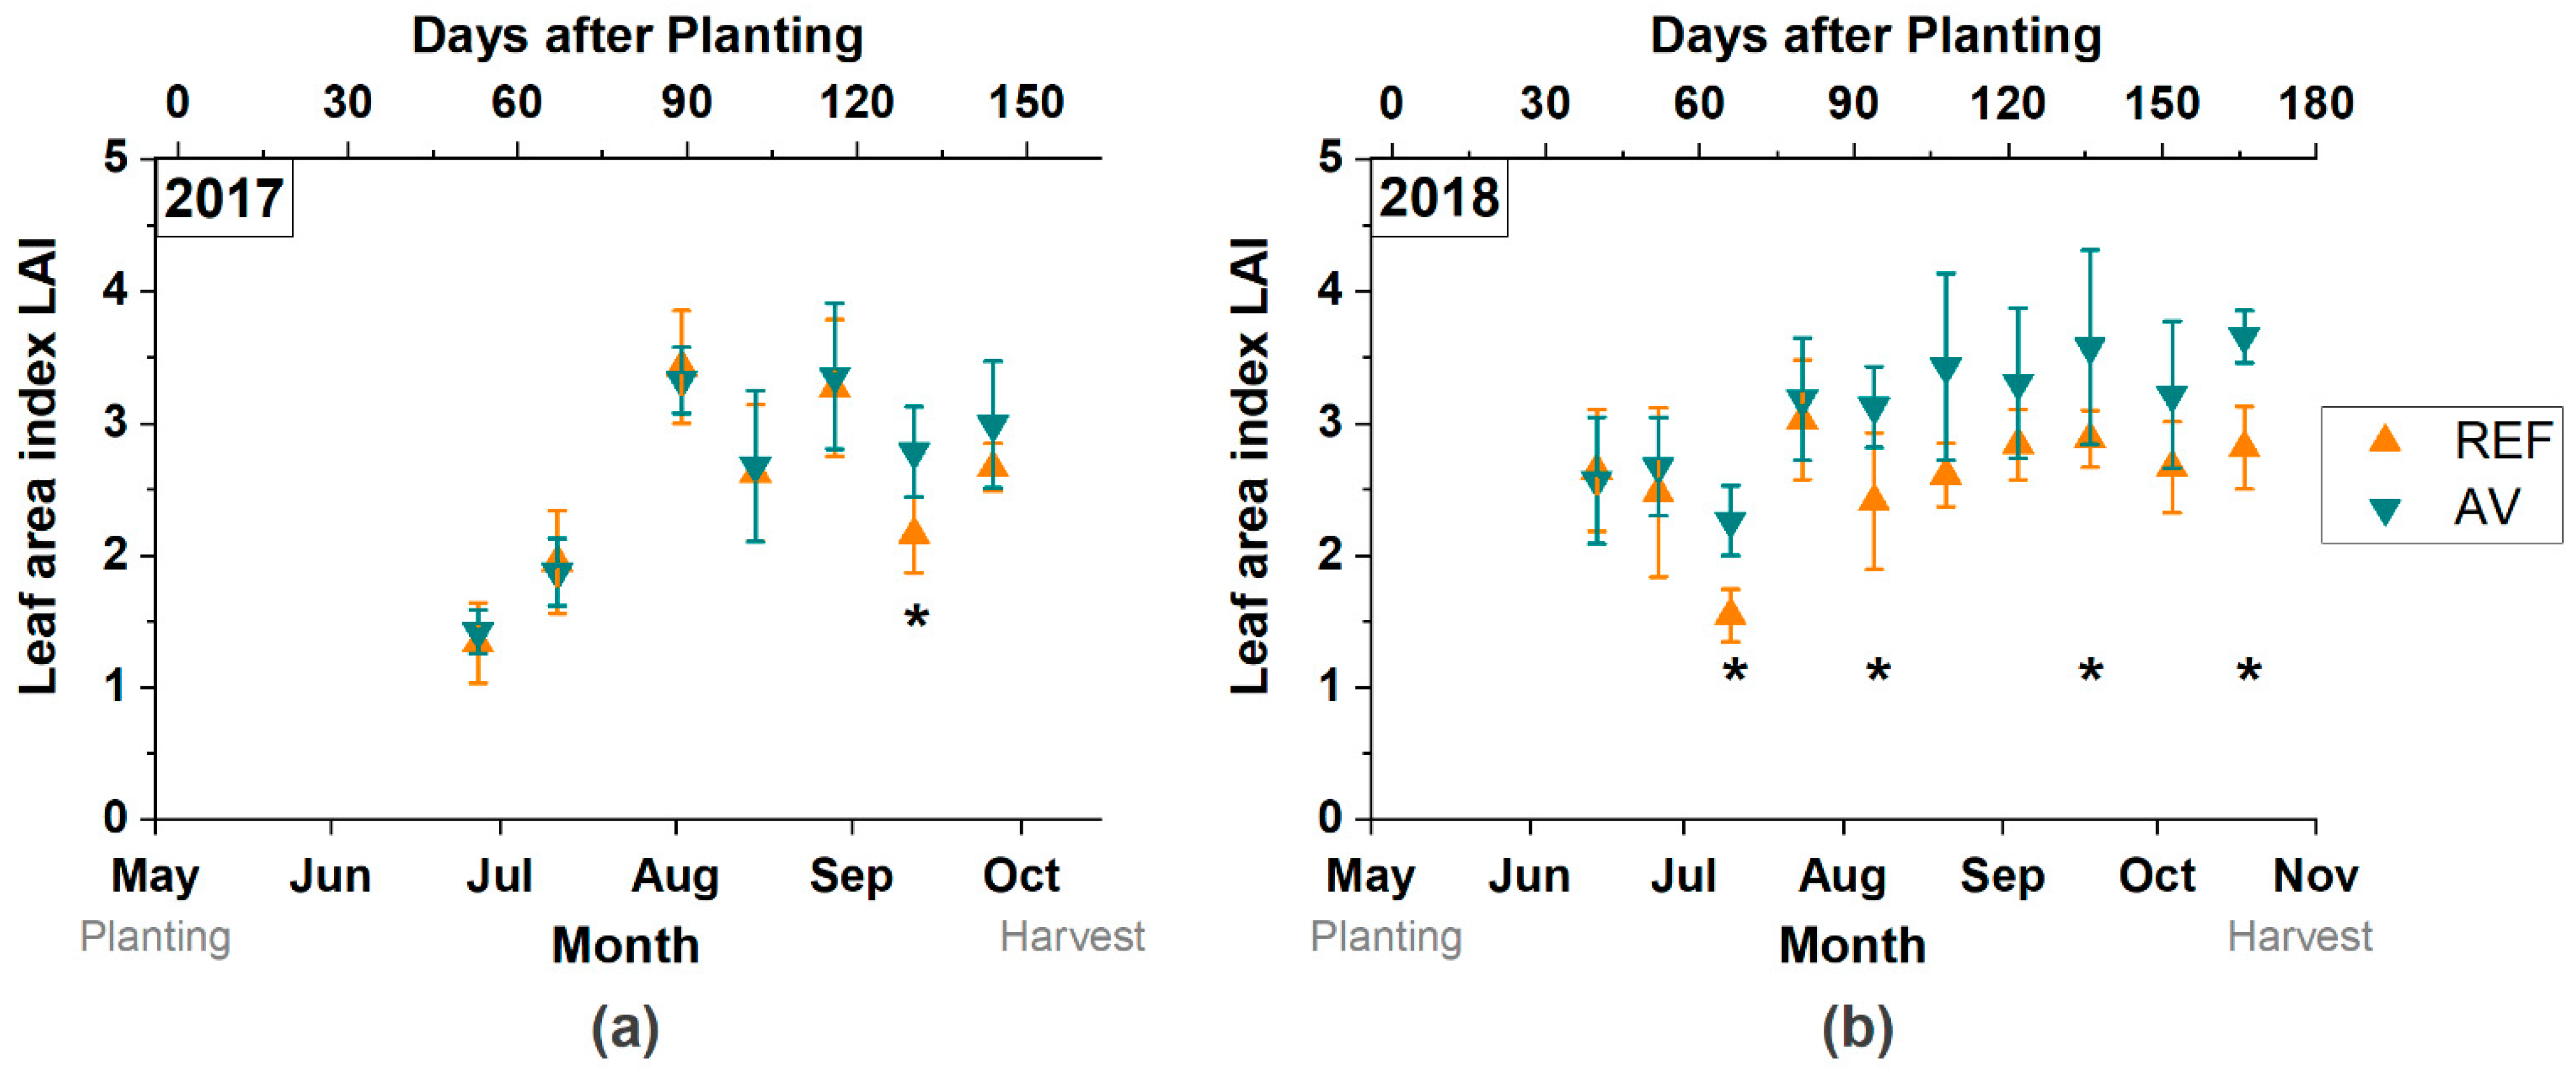
3.2. Crop Development

Celeriac growth and development was monitored on 10 days in 2017 and 11 days in 2018 (due to later harvest date).
After planting in May, the plantlets established quite slowly in 2017 in both treatments, which may be explained by the subsequent low precipitation of about 50 mm in May (Figure 4a). This also led to a certain amount of plant loss (not quantified). Consequently, crop development was delayed for several weeks until shoot growth started: mean plant height remained constant on the first four monitoring days and had even decreased slightly at the end of June. After the pronounced period of drought in May, monthly precipitation was between 150 and 250 mm from June to August. Nevertheless, it took until the middle of July before the celeriac plantlets had recovered, at which point shoot height gradually increased, reaching a maximum crop height of 35.7 cm under AV and 29.4 cm for REF 130 days after planting (DAP).
By contrast, in 2018, plants had already doubled their height by the second monitoring date in mid-June (Figure 4b). At this point, the celeriac cultivated under AV was 30% higher than on the REF site, while in 2017 growth had just begun in both treatments. The mean maximum crop height of 26.6 cm in AV and 16.7 cm in REF was recorded at 66 DAP. Plant height then decreased until final harvest. In May 2018, accumulated precipitation was 100 mm—more than twice as high as in May 2017. After that, however, monthly precipitation in 2018 remained below 100 mm until December (Figure 2) and consequently aboveground plant growth had stopped by mid-July in both treatments.
As a result, final plant development was better in 2017 than in 2018, although plantlet establishment was less problematic in 2018. The potatoes, which were planted shortly before the celeriac, were also found to have a lower initial plant height during the first weeks after emergence in 2017 than in 2018 [9].
In addition to year-related effects, crop height was also affected by treatment: celeriac plants were significantly higher under AV than in REF on three monitoring dates in 2017 and ten of the eleven dates in 2018 (Figure 4a,b). Differences in crop height between the treatments were more pronounced in 2018 than in 2017: averaged over all monitoring dates, crop height in AV was 30.6% higher than REF in 2018, but only 14% higher in 2017. In 2017, the mean difference in crop height between the treatments slowly increased from the 5th monitoring date (67 DAP) onwards, reaching a maximum (at final harvest, 144 DAP) of +7.2 cm in AV. In 2018, mean difference in crop height between the treatments was highest on the 6th monitoring date (94 DAP) at +9.5 cm in AV and then slowly decreased to +5.4 cm at final harvest (166 DAP). These treatment-related differences within the years corresponded to the general crop development, as described above. In 2017, crop height (and also difference between the treatments) increased from July onwards; meanwhile, in 2018, the crop reached maximum height by the middle of the growing season and then decreased until final harvest. However, the results show that crop height was increased by AV in both years. Similar results have been found for potatoes and winter wheat [9], where crop height was significantly increased by AV in both 2017 and 2018. As discussed by [9], increases in crop height are most probably due to shading; under AV, PAR was reduced by 30% on average in both years [9] (Table 1). These findings are in line with results from experiments with artificial shading, in which the canopy height of wheat [34,35] and potato [36] was increased by shading. Increased elongation growth under decreased light intensities can be interpreted as a shade-adaptive response by the plants in order to capture more light [37,38].
Leaf area index (LAI) was measured on seven monitoring days in 2017 and ten monitoring days in 2018. In 2017, no measurements were possible until the end of June as the plantlets were too small. LAI values differed only slightly between the years (Figure 5). As discussed above, the LAI values also indicated delayed development of the plantlets in 2017, which began to grow slowly from the end of June onwards (Figure 5a). On the other hand, in 2018, LAI values of approximately 2.5 had already been recorded in June (Figure 5b). Variations in LAI between the monitoring dates may be explained as an artifact caused by the occasional occurrence of weeds and the senescence of outer leaves—which may have led to lower LAI values being recorded from time to time. In 2017 in particular, leaves showed clear signs of Septoria leaf spot infection caused by the fungus Septoria apiicola, which led to early leaf senescence and consequently to a certain amount of loss of outer, older leaves. This explained the trend of declining LAI values from September onwards. As a similar effect of premature leaf senescence was observed in both treatments, the impact of uneven rain distribution under AV [9] can be excluded as the cause of the infestation by fungal leaf disease, based on the present data. However, infestation and pathogenesis were not monitored explicitly, and should be addressed in more detail in future—particularly as humidity was shown to be slightly higher under AV (Table 1). In 2018, celeriac leaves were still green at final harvest and did not show any signs of Septoria leaf spot infection. This can be seen from the LAI values, which were more or less constant until harvest. Similarly to crop height, LAI increased under AV, but the increase was only significant on one monitoring date in 2017 (166DAP) and four monitoring dates in 2018 (66, 94, 136 and 166 DAP). An increased leaf area under AV has also been found in lettuce [8], winter wheat, potatoes and grass-clover [9]. In lettuce, changes in total leaf area were linked to an increment in individual leaf area (width and length), as well as to altered leaf angles. However, the number of leaves was reduced by shading and depended on the level of shading applied [8]. In our experiment, the determinants of increased LAI could not be clearly specified, as leaf number and other leaf morphology characteristics were not monitored. In general, an increase in leaf area can be interpreted as a further physiological adaptation to diminished light availability under AV, in addition to increased crop height. Both strategies focus on intercepting more light to maintain sufficient photosynthetic performance [37].
As discussed above, both crop height and LAI of celeriac cultivated under AV were increased. Enhanced vegetative growth, as a consequence of decreased light intensities, can be interpreted as a shade-adaptive response aimed at enhancing light adsorption [37,38]. At the same time, increased elongation growth in response to shading is considered a shade-avoidance strategy, predominantly found in species less adapted to shaded environments [37,38]. Increased specific leaf area and leaf area ratio—both of which describe the relation of leaf area to plant biomass—can enhance the shade tolerance of plants [37,39]. Although the specific leaf area and leaf area ratio could not be deduced from the LAI measurements in our trial, the results indicated that the celeriac—and also crops like potatoes and wheat [9] —adapted to the reduced irradiation underneath the PV panels of the AV facility through a combination of shade-adaptive mechanisms.

3.3. Bulb Yields and Yield Components

The celeriac was harvested on 10 October in 2017 and 22 October in 2018 in both treatments. The early harvest date in 2017 was due to the fact that no further yield increases were to be expected on account of early leaf senescence (see also Section 3.2.). However, the date was still within the common celeriac harvest period. Aboveground biomass was increased by AV in both years, but only significantly in 2018 (Figure 6a). Dry matter yield of aboveground biomass was 0.37 t ha−1 in REF and 0.55 t ha−1 in AV (+48%; p = 0.082) in 2017, and 1.1 t ha−1 in REF and 1.4 t ha−1 in AV in 2018 (+31.9%; p = 0.0045). Interestingly, aboveground biomass was higher in 2018, although crop height was higher in 2017. We postulate that this was caused by the very distinct weather conditions in the two years, which affected both aboveground biomass and crop height in different ways. First, initial shoot growth was virtually zero in the first few weeks after planting in 2017. We assume that this period conferred a crucial growth advantage in 2018, leading to higher final shoot biomass in that year. Second, the dry weather conditions in summer 2018 may have led to a decrease in turgor pressure as a response to drought stress, leading to more wilting of leaves. As crop height was measured without lifting up individual leaves, this will also have led to lower crop heights being recorded. This explanation is supported by the finding that, in 2018, crop heights had decreased by the middle of July with the onset of drought stress. Furthermore, hanging leaves will also have led to an enlarged leaf rosette, explaining why LAI was higher in 2018 despite lower crop heights. The third—and presumably most crucial—factor was disease; aboveground biomass was lower in 2017 due to infection with Septoria leaf spot, leading to early leaf senescence and consequently a certain loss of matured leaves.
Celeriac bulb yield was 11.9 t ha-1 in REF and 9.7 t ha−1 in AV (−18.9%; p = 0.15) (Figure 4) in 2017, and 9.6 t ha−1 in REF and 10.8 t ha-1 in AV (+11.8%; p = 0.49) in 2018 (Figure 6b). Neither the differences between the treatments nor those between the years were significant. The yields in both years and treatments were low in comparison with the national average for organically cultivated celeriac, which was 29.6 t ha−1 in 2017 and 31.1 t ha−1 in 2018 [19]. In general, celeriac is considered drought-sensitive, with drought stress leading to small, poorly developed bulbs [17,18]. Therefore, it can be assumed that the dry weather conditions in spring 2017 and especially summer 2018 probably led to comparatively low bulb yields. This is particularly probable given that the celeriac plants in our trial were not irrigated. The bulbs were poorly developed in both years and treatments (Figure 7). Average individual bulb weight was 196 g (REF) and 158 g (AV) in 2017, and 186 g (REF) and 197 g (AV) in 2018. Average bulb diameter was 7.3 cm (REF) and 6.6 cm (AV) in 2017 and 7.5 cm (REF and AV) in 2018. Both average weights and diameters can be considered undersized. To meet the criteria of the wholesaler the farm supplies, celeriac must fulfill the class 1 UNECE (United Nations Economic Commission for Europe) standard for root and tubercle vegetables [40]. In addition, the bulbs must have a minimum weight of 350 g if only the bulbs are sold, or a minimum size of 60 mm if whole plants (bulb including leaves) are sold. Taking these criteria into consideration and assuming only bulbs (without leaves) are sold: of the 48 bulbs harvested from each treatment in 2017, only one (AV) and four (REF) were actually marketable. In 2018, the respective numbers were zero (AV) and one (REF). Extrapolated to a hectare, marketable bulb yields would consequently have been only 0.5 t ha−1 (AV) and 2 t ha−1 (REF) in 2017, and 0 t ha−1 (AV) and 3.6 t ha−1 (REF) in 2018. If sold as whole plants, marketable bulb yield would have been 7.8 t ha−1 (AV) and 10.6 t ha−1 (REF) in 2017, and 10.3 t ha−1 (AV) and 8.8 t ha−1 (REF) in 2018.
As mentioned above, yield variations within the years differed between the treatments. Averaged over both treatments, bulb yield was higher in 2017 (10.8 t ha−1) than 2018 (10.2 t ha−1). While bulb yields from the REF site were 2.3 t ha−1 lower in 2018 than 2017, yields on the AV site actually increased by about 1.1 t ha−1. Lower yields under AV in 2017 were most probably caused by the reduction in solar radiation (about 30%) (Table 1). In contrast, the yield increases under AV in 2018 indicate that the celeriac plants benefitted from shading that year. It can be assumed that, in 2018, drought, intensive solar radiation, and high temperatures counterbalanced the adverse effects of shading on celeriac productivity. However, it remains unclear whether this was caused directly (by attenuating irradiation) or indirectly (by altering microclimatic conditions to provide a more favorable microclimatic environment for celeriac growth). It was expected that soil moisture would increase under AV, as a reduction in evapotranspiration in the partial shade of AV panels was already reported [12]. However, soil moisture under AV only increased in 2017; it was actually reduced in 2018 (Table 1). Therefore, soil moisture can be excluded as a potential explanation for increased crop yields under AV in 2018.
As shown, soil temperature was reduced by AV (Table 1). Although this was the case in both years, we assumed that reduced soil temperature and a direct reduction in solar radiation under AV were the determining factors that diminished the adverse effects of excessive irradiation, heat, and drought on crop yields in 2018. Furthermore, increases in aboveground biomass, as mentioned above, may also have led to higher bulb yields in 2018 through higher amounts of assimilates being translocated from the shoots to the bulbs.
While no comparable data is available for celeriac, studies with other root vegetables (e.g., carrot, parsnip, radish and beetroot) have shown that shoot and storage-root weights are linearly correlated, with slight differences between species [41,42,43]. Biologically, celeriac is comparable to beetroot and radish, species in which the storage organ also develops from the hypocotyl. We therefore hypothesized that the significantly higher aboveground biomass under AV in 2018 was a determining factor for the higher bulb yield compared to REF. As the vegetation period in 2018 was prolonged due to the later harvest date, the period for the translocation of assimilates from the shoot to the storage root was also extended. This raises the question of whether delaying the harvest could have facilitated mobilization of the full assimilate potential stored in the shoot, increasing bulb weights and yields under AV. A study with lettuce cultivated underneath an AV system found that a delayed harvest date led to yields comparable to the unshaded control [44]. However, in the case of celeriac, a further increase in bulb yields through a prolonged vegetation period would be limited by environmental conditions. Mild autumnal temperatures are required for translocation of assimilates to the storage organ to continue. In addition, the 2017 results showed that infestation with fungal diseases can also become a limiting factor, leading to premature leaf senescence and preventing further yield increases.
Relative changes in harvestable yields of winter wheat and potatoes cultivated under AV were comparable to those of celeriac in the present study. While in 2017, yields decreased by about 18–19%, they increased by about 3% (wheat) and 11% (potato) in 2018 [9]. Accordingly, all annual crop species investigated in the field trial showed comparable responses to cultivation in the altered environment underneath the AV facility. Moreover, yield fluctuations between the years were less pronounced under AV, as was the case with celeriac. This supports the hypothesis that cultivation under AV can be advantageous in dry weather conditions and may have yield-stabilizing effects in the long term [9,33], but further trial years are needed for validation. The results indicated that—outside of dry climates where a general reduction in sun exposure can be beneficial and certain crops adapted to shaded conditions—leaf vegetables may be particularly suitable for cultivation under AV [2]. The increases found in above ground biomass and in growth parameters like crop height and LAI will become directly relevant for harvestable yields. This is supported by findings in lettuce, where cultivation under AV led to increased yields of some cultivars, and was also linked to increased leaf area [8].

3.4. Chemical Composition

Chemical composition analysis of celeriac bulbs revealed that most of the parameters analyzed were affected more by year than by treatment (Table 2 and Table 3). The test of fixed effects revealed that all determined parameters were significantly affected by year, except S, Mg, Mn, and Se. No significant differences were found for Si, Co, and I, as the concentrations were below the detectable thresholds of 150 mg kg−1 (Si), 0.02 mg kg−1 (Co), and 0.5 mg kg−1 (I) given in Table 3. Dry matter (DM) content was significantly lower (p < 0.0005) in 2017 than in 2018 (9.9% (both AV and REF) in 2017 compared to 14.4% (AV) and 13.6% (REF) in 2018). In 2018, DM content was significantly lower in REF (p = 0.002) than in AV. No significant differences between treatments were found for crude protein and crude fat (Table 2). Crude protein was slightly higher in AV than in REF in 2017. However, crude protein in AV was lower than in REF in 2018, which may be explained by a dilution effect, as yields in AV were lower in 2017 and higher in 2018. Crude fat was affected by year, but virtually unaffected by treatment. Both crude fat and protein were significantly higher in 2018 than in 2017. Fresh matter (FM) protein content (2017: 0.99% AV, 0.94% REF; 2018: 1.17% AV, 1.20% REF, data not shown) was lower than the reference values of 1.2–1.5% stated in the literature [17,18]. FM crude fat content (2017: 0.22%, AV and REF; 2018: 0.28% AV and REF) was also slightly lower than literature values (0.3–0.4%) [17,18]. Carbon content was significantly lower under AV in both years, indicating that less carbon was allocated from the shoots to the bulbs, despite higher shoot biomass. This may be due to generally lower photosynthetic assimilation of carbon dioxide as a consequence of lower irradiance and/or diminished translocation to the storage organs, which would support the hypothesis that maturation is delayed under AV (see Section 3.3). This would also explain the higher C content in 2018: prolongation of the vegetation period, increased irradiation (and consequently photosynthetic performance), and increased aboveground biomass (and consequently translocation potential) may have led to higher amounts of assimilates being translocated to the bulbs. The C/N ratio was higher in 2017 than in 2018 in both treatments (data not shown), which can be explained by the higher N content in 2018. The C/N ratio under AV was at 24.7, significantly lower (p = 0.012) than in REF (26.6), in 2017, and at 21.7, slightly higher (p = 0.45) than REF (21.3) in 2018.
Fiber content (aNDFom, ADFom, ADL) was lower under AV, but only significantly for ADFom (1.0% absolute decrease). For aNDFom and ADL, the standard error between the plots was comparatively high. As data on aNDFom, ADFom and ADL only exist for one year, the results should be treated with care; year or yield effects cannot be excluded. However, this may provide further evidence that carbon metabolism is affected by AV through altered carbon assimilation as well as delayed translocation to the bulbs. Apart from Na and Ca, none of the macroelements were significantly affected by treatment. Concentration of Ca was increased by 0.03% (absolute) in 2017 and Na by 0.06% (absolute) in 2018 on the REF site. Concentration of all macroelements was higher in 2017 than 2018 in both treatments. This effect was significant for all elements, except S and Mg. As the trace elements Si, Co, I, and Mo (2018 only) were under the detectable thresholds (Table 3), no differences were detected. Al, B, Ba, Cu, Fe, Zn, Cr, Mo, and Cl were affected by year, but not by treatment. In 2018, lower concentrations were found throughout, except for Fe, which increased. No differences were found in Se concentrations. Mn content was lower in AV in both years but only significantly so in 2017. Ni decreased in AV in both years. Both Cd and Pb content were significantly lower under AV in both years. In general, celery is known to accumulate heavy metals such as Cd and Pb [45]. However, the detected concentrations were far below the acceptable maximum concentrations (0.20 mg kg−1 FM (Cd) and 0.1 mg kg−1 FM (Pb)) [46]. The treatment-related differences in Cd and Pb concentrations may be explained by differences in soil levels. Soil sample analyses showed that Cd and Pb soil levels were slightly lower on the AV site (data not shown). Overall, concentrations of most minerals and elements analyzed for both treatments were within the range stated in the literature [18].
However, this was only the case in 2017; in 2018 significant reductions were found, as described above. It is generally known that nutrient uptake (and, consequently, concentrations of various minerals and trace elements) is reduced under drought [47]. Hence, the significantly lower mineral content in 2018 was most probably caused by low soil water status as a consequence of dry weather conditions in summer, leading to impaired root uptake and translocation to the shoots.
The results show that cultivation underneath an AV system had only a slight effect on the chemical composition of celeriac. Concentrations of C, Ni and Mn were decreased by AV; all other parameters were mainly affected by year. The fiber fractions aNDFom, ADFom and ADL were only measured in 2018. Apart from the results shown here, no comparable data on the effects of microclimatic alterations (particularly shading) on the quality characteristics of celeriac are available. Most studies featuring celeriac and celery focus on the accumulation of furanocoumarins [48,49,50] and quality parameters such as content of vitamins and secondary plant metabolites [51,52,53,54]. These were not the subject of our study. In general, celery is considered to be nitrate-accumulating [55]. Nitrate is thought to have a negative effect on human health [55,56]. Nitrate concentrations in crops are affected by a number of factors, including N fertilization and environmental factors (e.g., light intensities) [55,57,58]. In several crops, including blade celery (Apium graveolens L. var. dulce), nitrate concentrations have been shown to be correlated with shading intensity [57,58,59]. In celeriac, nitrate accumulation is also cultivar-dependent [60]. Therefore, future trials should investigate whether nitrate concentrations in vegetables like celeriac are affected by cultivation underneath AV. Our results show that crude protein content was affected by AV, indicating that protein and N metabolism were altered in some way. However, this effect was not significant and differed between the years. Carbohydrate concentration, as a relevant constituent with respect to the nutritional quality of celeriac bulbs, should also be analyzed in the future. This could offer further evidence on how carbon assimilation is affected by AV. According to the values stated in the literature, total carbohydrate content in celeriac ranges from approximately 2.0% to 3.0% of fresh matter [18,61]. Apart from celeriac, no other studies on the effects of AV on crop production have addressed their impact on the chemical composition of the harvested crops. In wheat, cultivation under AV was found to shift grain size distribution towards smaller classes [9]. Although the chemical composition of the grains was not analyzed, alterations in quality parameters can be assumed to be a consequence of an altered bran/endosperm ratio [9].

4. Conclusions

The production of celeriac was found to be affected in several ways by cultivation underneath an AV system. Under AV, photosynthetic active radiation was reduced by about 30% in both years studied. Both crop height and leaf area index increased in response to shaded conditions, leading to significantly higher aboveground biomass in 2018. Neither bulb yields nor their chemical composition were significantly affected by AV. In 2017, yields tended to be lower under AV, whereas in 2018 they increased slightly. The results were linked to lower soil temperatures and reduced PAR under AV, which may have become advantageous in the hot and dry weather conditions of 2018. We therefore conclude that celeriac can be considered a suitable crop for cultivation under AV. However, as climatic conditions were quite extreme in both years, leading to comparably low yield levels in general, further field trials are necessary to investigate how yields would develop under more optimal conditions and over a longer term. Chemical analysis of C and fiber content provided evidence of an altered carbon metabolism and potentially delayed ripening under AV. Thus, further studies are required to examine whether a prolongation of the celeriac vegetation period can be beneficial for final bulb yields through exploitation of the full potential stored in the increased shoot biomass under AV. Furthermore, quality parameters such as carbohydrate and nitrate content should be assessed. The impact of altered water distribution and increased humidity under AV on infestations with fungal disease should be examined. As a coproductive system, the advantages of AV clearly predominate: increased income through additional energy production, conservation of limited land resources through increased land productivity, and potential benefits for crop production in dry climates. Nevertheless, in view of the land use conflict between energy and food production, these benefits need to be weighed up against potential losses in agricultural productivity. This emphasizes the need to define criteria for assessing the extent to which potential drawbacks in agricultural use can be tolerated in such dual-use systems.

Author Contributions

Conceptualization, A.W., P.H., S.Z. and I.L.; Investigation, A.W. and A.B.; Formal analysis, A.W.; Data curation, A.W.; Visualization, A.W.; Writing—Original Draft, A.W., Writing—Review & Editing, A.W., A.B., S.Z., I.L., P.H.; Supervision, P.H. and I.L, Project administration, P.H.; Funding acquisition, P.H. All authors read and approved the final manuscript.

Funding

This work was carried out within the APV-RESOLA project, which received funding from the German Federal Ministry for Education and Research (BMBF) under grant no. 033L098G. In addition, the corresponding author was supported by a state graduate scholarship received from the Ministry of Science, Research and Arts (MWK) Baden-Württemberg.

Institutional Review Board Statement

Not applicable.

Informed Consent Statement

Not applicable.

Data Availability Statement

Data available on request due to restrictions eg privacy or ethical.

Acknowledgments

The authors are grateful to Florian Reyer and his colleagues from Heggelbachhof for managing the field experiment, and to Moritz Krug for assistance with data loggers and rain gauges. Particular thanks go to Nicole Gaudet for revising the manuscript and to all scientific and practical partners within the APV-RESOLA project: Stephan Schindele and Maximilian Trommsdorff from Fraunhofer Institute for Solar Energy Systems ISE, BayWa r.e., EWS Schönau and the Institute for Technology Assessment and Systems Analysis (ITAS) of Karlsruhe Institute of Technology (KIT).

Conflicts of Interest

The authors declare that they have no conflict of interest.

References

  1. Schindele, S.; Trommsdorff, M.; Schlaak, A.; Obergfell, T.; Bopp, G.; Reise, C.; Braun, C.; Weselek, A.; Bauerle, A.; Högy, P.; et al. Implementation of agrophotovoltaics: Techno-economic analysis of the price-performance ratio and its policy implications. Appl. Energy 2020, 265, 114737. [Google Scholar] [CrossRef]
  2. Weselek, A.; Ehmann, A.; Zikeli, S.; Lewandowski, I.; Schindele, S.; Högy, P. Agrophotovoltaic systems: Applications, challenges, and opportunities. A review. Agron. Sustain. Dev. 2019, 39, 545. [Google Scholar] [CrossRef]
  3. Dupraz, C.; Marrou, H.; Talbot, G.; Dufour, L.; Nogier, A.; Ferard, Y. Combining solar photovoltaic panels and food crops for optimising land use: Towards new agrivoltaic schemes. Renew. Energy 2011, 36, 2725–2732. [Google Scholar] [CrossRef]
  4. Dinesh, H.; Pearce, J.M. The potential of agrivoltaic systems. Renew. Sustain. Energy Rev. 2016, 54, 299–308. [Google Scholar] [CrossRef] [Green Version]
  5. Valle, B.; Simonneau, T.; Sourd, F.; Pechier, P.; Hamard, P.; Frisson, T.; Ryckewaert, M.; Christophe, A. Increasing the total productivity of a land by combining mobile photovoltaic panels and food crops. Appl. Energy 2017, 206, 1495–1507. [Google Scholar] [CrossRef]
  6. Gorjian, S.; Minaee, S.; M.Mirchegini, L.; Trommsdorff, M.; Shamshiri, R. Applications of solar PV systems in agricultural automation and robotics. In Photovoltaic Solar Energy Conversion; Academic Press: Cambridge, MA, USA, 2020; pp. 191–235. ISBN 978-0-12-819610-6. [Google Scholar]
  7. Barron-Gafford, G.A.; Pavao-Zuckerman, M.A.; Minor, R.L.; Sutter, L.F.; Barnett-Moreno, I.; Blackett, D.T.; Thompson, M.; Dimond, K.; Gerlak, A.K.; Nabhan, G.P.; et al. Agrivoltaics provide mutual benefits across the food–energy–water nexus in drylands. Nat. Sustain. 2019, 2, 848–855. [Google Scholar] [CrossRef]
  8. Marrou, H.; Wery, J.; Dufour, L.; Dupraz, C. Productivity and radiation use efficiency of lettuces grown in the partial shade of photovoltaic panels. Eur. J. Agron. 2013, 44, 54–66. [Google Scholar] [CrossRef]
  9. Weselek, A.; Bauerle, A.; Hartung, J.; Zikeli, S.; Lewandowski, I.; Högy, P. Microclimate, crop development and harvestable crop yield of grass-clover, potatoes and winter wheat in an agrivoltaic system under organic management in south-west Germany. Agron. Sustain. Dev. 2021. under review. [Google Scholar]
  10. Sekiyama, T.; Nagashima, A. Solar Sharing for Both Food and Clean Energy Production: Performance of Agrivoltaic Systems for Corn, A Typical Shade-Intolerant Crop. Environments 2019, 6, 65. [Google Scholar] [CrossRef] [Green Version]
  11. Homma, M.; Doi, T.; Yoshida, Y. A Field Experiment and the Simulation on Agrivoltaic-systems regarding to Rice in a Paddy Field. J. Jpn. Soc. Energy Resour. 2016, 37, 23–31. [Google Scholar] [CrossRef]
  12. Marrou, H.; Dufour, L.; Wery, J. How does a shelter of solar panels influence water flows in a soil–crop system? Eur. J. Agron. 2013, 50, 38–51. [Google Scholar] [CrossRef]
  13. International Federation of Organic Agriculture Movements. Principles of Organic Agriculture. Available online: https://www.ifoam.bio/sites/default/files/2020-03/poa_english_web.pdf (accessed on 6 February 2021).
  14. Trommsdorff, M.; Kang, J.; Reise, C.; Schindele, S.; Bopp, G.; Ehmann, A.; Weselek, A.; Högy, P.; Obergfell, T. Combining food and energy production: Design of an agrivoltaic system applied in arable and vegetable farming in Germany. Renew. Sustain. Energy Rev. 2021, 140, 110694. [Google Scholar] [CrossRef]
  15. Pascaris, A.S.; Schelly, C.; Pearce, J.M. A First Investigation of Agriculture Sector Perspectives on the Opportunities and Barriers for Agrivoltaics. Agronomy 2020, 10, 1885. [Google Scholar] [CrossRef]
  16. Eurostat. The Fruit and Vegetable Sector in the EU—A Statistical Overview. Available online: https://ec.europa.eu/eurostat/statistics-explained/index.php/The_fruit_and_vegetable_sector_in_the_EU_-_a_statistical_overview (accessed on 2 April 2021).
  17. Lim, T.K. Apium graveolens var. rapaceum. In Edible Medicinal and Non Medicinal Plants: Volume 9, Modified Stems, Roots, Bulbs; Lim, T.K., Ed.; Springer: Dordrecht, The Netherlands, 2015; pp. 367–373. ISBN 978-94-017-9511-1. [Google Scholar]
  18. Hadley, P.; Fordham, R. Vegetables of Temperate Climates. Miscellaneous Root Crops. In Encyclopedia of Food Sciences and Nutrition, 2nd ed.; Caballero, B., Ed.; Academic Press: Oxford, UK, 2003; pp. 5948–5951. ISBN 978-0-12-227055-0. [Google Scholar]
  19. Destatis. Anbauflächen und Erntemengen von Ökologisch Angebautem Gemüse. Available online: https://www.destatis.de/DE/Themen/Branchen-Unternehmen/Landwirtschaft-Forstwirtschaft-Fischerei/Obst-Gemuese-Gartenbau/Tabellen/oekologisches-gemuese.html (accessed on 11 February 2020).
  20. Feller, C.; Bleiholder, H.; Buhr, L.; Hack, H.; Hess, M.; Klose, R. Phänologische Entwicklungsstadien von Gemüsepflanzen: II. Fruchtgemüse und Hülsenfrüchte. In Compendium of Growth Stage Identification Keys for Mono- and Dicotyledonous Plants, Extended BBCH Scale; German Federal Biological Research Centre for Agriculture and Forestry: Berlin, Germany, 1995; Volume 47, pp. 109–111. [Google Scholar]
  21. LTZ Augustenberg. Agrarmeterologie Baden-Württemberg. Available online: www.wetter-bw.de (accessed on 7 February 2021).
  22. VDLUFA. 10.8.1.2 Mikrowellenbeheizter Druckaufschluss, 8. Ergänzung; Darmstadt, Band III Futtermittel; VDLUFA: Darmstadt, Germany, 2012. [Google Scholar]
  23. European Committee for Standardization. Animal Feeding Stuffs—Methods of Sampling and Analysis—Determination of Calcium, Sodium, Phosphorus, Magnesium, Potassium, Sulphur, Iron, Zinc, Copper, Manganese and Cobalt after Pressure Digestion by ICP-AES; EN 15621:2017-10; European Committee for Standardization: Brussels, Belgium, 2017. [Google Scholar]
  24. VDLUFA. 17.9.1 Bestimmung von Ausgewählten Elementen in Pflanzen Sowie in Grund- und Mischfuttermitteln Mittels Messenspektromie mit Induktiv Gekoppeltem Plasma, 8. Ergänzung; Darmstadt, Band III Futtermittel; VDLUFA: Darmstadt, Germany, 2012. [Google Scholar]
  25. VDLUFA. 2.2.2.2 Bestimmung von Nitrat in Pflanzlichem Material Mittels Ionenchromatographie; Darmstadt, Band VII Umweltanalytik; VDLUFA: Darmstadt, Germany, 1983. [Google Scholar]
  26. VDLUFA. 2.2.2.3 Bestimmung des Gehaltes von Extrahierbarem Jod in Futtermitteln Mittels Induktiv Gekoppeltem Plasma und Massenspektrometrie (ICP-MS); Darmstadt, Band VII Umweltanalytik; VDLUFA: Darmstadt, Germany, 1983. [Google Scholar]
  27. VDLUFA. 4.1.2 Bestimmung von Rohprotein mittels DUMAS-Verbrennungsmethode, 5. Ergänzung; Darmstadt, Band III Futtermittel; VDLUFA: Darmstadt, Germany, 2004. [Google Scholar]
  28. Regulation (EC) No 152/2009. Laying down the Methods of Sampling and Analysis for the Official Control of Feed. Annex III: Methods of Analysis to Control the Composition of Feed Materials and Compounds Feed; CR (EC) No. 152/2009 III; European Union: Brussels, Belgium, 2009. [Google Scholar]
  29. VDLUFA. 6.5.1 Bestimmung der Neutral-Detergenzien-Faser nach Amylasebehandlung (aNDF) Sowie Nach Amylasebehandlung und Veraschung (aNDFom), 8. Ergänzung; Darmstadt, Band III Futtermittel; VDLUFA: Darmstadt, Germany, 2012. [Google Scholar]
  30. VDLUFA. 6.5.2 Bestimmung der Säure-Detergenzien-Faser (ADF) und der Säure-Detergenzien-Faser nach Veraschung (ADFom), 8. Ergänzung; Darmstadt, Band III Futtermittel; VDLUFA: Darmstadt, Germany, 2012. [Google Scholar]
  31. VDLUFA. 6.5.3 Bestimmung des Säure-Detergenzien-Lignins (ADL), 8. Ergänzung; Darmstadt, Band III Futtermittel; VDLUFA: Darmstadt, Germany, 2012. [Google Scholar]
  32. Marrou, H.; Guilioni, L.; Dufour, L.; Dupraz, C.; Wery, J. Microclimate under agrivoltaic systems: Is crop growth rate affected in the partial shade of solar panels? Agric. For. Meteorol. 2013, 177, 117–132. [Google Scholar] [CrossRef]
  33. Amaducci, S.; Yin, X.; Colauzzi, M. Agrivoltaic systems to optimise land use for electric energy production. Appl. Energy 2018, 220, 545–561. [Google Scholar] [CrossRef]
  34. McMaster, G.S.; Morgan, J.A.; Willis, W.O. Effects of Shading on Winter Wheat Yield, Spike Characteristics, and Carbohydrate Allocation1. Crop Sci. 1987, 27, 967–973. [Google Scholar] [CrossRef]
  35. Li, H.; Jiang, D.; Wollenweber, B.; Dai, T.; Cao, W. Effects of shading on morphology, physiology and grain yield of winter wheat. Eur. J. Agron. 2010, 33, 267–275. [Google Scholar] [CrossRef]
  36. Kuruppuarachchi, D.S.P. Intercropped potato (Solanum spp.) Effect of shade on growth and tuber yield in the northwestern regosol belt of Sri Lanka. Field Crops Res. 1990, 25, 61–72. [Google Scholar] [CrossRef]
  37. Gommers, C.M.M.; Visser, E.J.W.; Onge, K.R.S.; Voesenek, L.A.C.J.; Pierik, R. Shade tolerance: When growing tall is not an option. Trends Plant Sci. 2013, 18, 65–71. [Google Scholar] [CrossRef] [PubMed]
  38. Ruberti, I.; Sessa, G.; Ciolfi, A.; Possenti, M.; Carabelli, M.; Morelli, G. Plant adaptation to dynamically changing environment: The shade avoidance response. Biotechnol. Adv. 2012, 30, 1047–1058. [Google Scholar] [CrossRef]
  39. Valladares, F.; Niinemets, Ü. Shade Tolerance, a Key Plant Feature of Complex Nature and Consequences. Annu. Rev. Ecol. Evol. Syst. 2008, 39, 237–257. [Google Scholar] [CrossRef] [Green Version]
  40. United Nations. UNECE Standard FFV-59 Concerning the Marketing and Commercial Quality Control of Root and Tubercle Vegetables. Available online: https://www.unece.org/fileadmin/DAM/trade/agr/standard/fresh/FFV-Std/English/59_RootandTubercleVeg.pdf (accessed on 13 December 2020).
  41. Hole, C.C.; Thomas, T.H.; Barnes, A.; Scott, P.A.; Rankin, W.E.F. Dry Matter Distribution between Shoot and Storage Root of Carrot, Parsnip, Radish and Red Beet. Ann. Bot. 1984, 53, 625–631. [Google Scholar] [CrossRef]
  42. Suojala, T. Growth of and partitioning between shoot and storage root of carrot in a northern climate. AFSci 2000, 9. [Google Scholar] [CrossRef]
  43. Hole, C.C.; Morris, G.E.L.; Cowper, A.S. Distribution of dry matter between shoot and storage root of field-grown carrots. I. Onset of differences between cultivars. J. Hortic. Sci. 1987, 62, 335–341. [Google Scholar] [CrossRef]
  44. Elamri, Y.; Cheviron, B.; Lopez, J.-M.; Dejean, C.; Belaud, G. Water budget and crop modelling for agrivoltaic systems: Application to irrigated lettuces. Agric. Water Manag. 2018, 208, 440–453. [Google Scholar] [CrossRef]
  45. Zhang, K.; Wang, J.; Yang, Z.; Xin, G.; Yuan, J.; Xin, J.; Huang, C. Genotype variations in accumulation of cadmium and lead in celery (Apium graveolens L.) and screening for low Cd and Pb accumulative cultivars. Front. Environ. Sci. Eng. 2013, 7, 85–96. [Google Scholar] [CrossRef]
  46. Regulation (EC) 1881/2006. Setting Maximum Levels for Certain Contaminants in Foodstuffs; CR (EC) No 1881/2006; European Union: Brussels, Belgium, 2006. [Google Scholar]
  47. Rouphael, Y.; Cardarelli, M.; Schwarz, D.; Franken, P.; Colla, G. Effects of Drought on Nutrient Uptake and Assimilation in Vegetable Crops. In Plant Responses to Drought Stress: From Morphological to Molecular Features; Aroca, R., Ed.; Springer: Berlin/Heidelberg, Germany, 2012; pp. 171–195. ISBN 978-3-642-32653-0. [Google Scholar]
  48. Heath-Pagliuso, S.; Matlin, S.A.; Fang, N.; Thompson, R.H.; Rappaport, L. Stimulation of furanocoumarin accumulation in celery and celeriac tissues by Fusarium oxysporum f. sp. Apii. Phytochemistry 1992, 31, 2683–2688. [Google Scholar] [CrossRef]
  49. Schulzová, V.; Babička, L.; Hajšlová, J. Furanocoumarins in celeriac from different farming systems: A 3-year study. J. Sci. Food Agric. 2012, 92, 2849–2854. [Google Scholar] [CrossRef] [PubMed]
  50. Zobel, A.M.; Brown, S.A. Influence of low-intensity ultraviolet radiation on extrusion of furanocoumarins to the leaf surface. J. Chem. Ecol. 1993, 19, 939–952. [Google Scholar] [CrossRef]
  51. Popova, M.; Stoyanova, A.; Valyovska-Popova, N.; Bankova, V.; Peev, D. A new coumarin and total phenolic and flavonoids content of Bulgarian celeriac. Izvestiya Khimiya Bulgarska Akademiya Naukite 2014, 46, 88–93. [Google Scholar]
  52. Leclerc, J.; Miller, M.L.; Joliet, E.; Rocquelin, G. Vitamin and Mineral Contents of Carrot and Celeriac Grown under Mineral or Organic Fertilization. Biol. Agric. Hortic. 1991, 7, 339–348. [Google Scholar] [CrossRef]
  53. Kaiser, A.; Hartmann, K.I.; Kammerer, D.R.; Carle, R. Evaluation of the effects of thermal treatments on color, polyphenol stability, enzyme activities and antioxidant capacities of innovative pasty celeriac (Apium graveolens L. var. rapaceum (Mill.) DC.) products. Eur. Food Res. Technol. 2013, 237, 353–365. [Google Scholar] [CrossRef]
  54. MacLeod, G.; Ames, J.M. Volatile components of celery and celeriac. Phytochemistry 1989, 28, 1817–1824. [Google Scholar] [CrossRef]
  55. Maynard, D.N.; Barker, A.V.; Minotti, P.L.; Peck, N.H. Nitrate Accumulation in Vegetables. In Advances in Agronomy; Brady, N.C., Ed.; Academic Press: Cambridge, MA, USA, 1976; pp. 71–118. ISBN 0065-2113. [Google Scholar]
  56. Bruning-Fann, C.; Kaneene, J. The effects of nitrate, nitrite and N-nitroso compounds on human health: A review. Vet. Hum. Toxicol. 1994, 35, 521–538. [Google Scholar]
  57. Schuthan, W.; Bengtsson, B.; Bosund, I.; Hylmö, B. Nitrate accumulation in spinach. Plant Foods Hum. Nutr. 1967, 14, 317–330. [Google Scholar] [CrossRef]
  58. Wright, M.J.; Davison, K.L. Nitrate Accumulation In Crops And Nitrate Poisoning In Animals. In Advances in Agronomy; Norman, A.G., Ed.; Academic Press: Cambridge, MA, USA, 1964; pp. 197–247. ISBN 0065-2113. [Google Scholar]
  59. Wojciechowska, R.; Siwek, P. The effect of shading on nitrate metabolism in stalks and blades of celery leaves (Apium graveolens L. var. dulce). Folia Hortic. 2006, 18, 25–35. [Google Scholar]
  60. Derolez, J.; Vulsteke, G. Accumulation of nitrate: A cultivar-linked property with celeriac (Apium graveolens L.var. rapaceum). Plant Foods Hum. Nutr. 1985, 35, 375–378. [Google Scholar] [CrossRef]
  61. Dambrauskienė, E.; Maročkiene, N.; Viskelis, P.; Rubinskiene, M. Evaluation of productivity and biochemical composition of edible root celery. Acta Hortic. 2009, 830, 115–119. [Google Scholar] [CrossRef]
Figure 1. Celeriac plants growing underneath the agrivoltaic (AV) facility in 2017. The reference site is located behind the facility. (source: Bauerle/University of Hohenheim).
Agronomy 11 00733 g001
Figure 2. Setup of the field experiment in 2017 and 2018 with location of celeriac within the crop rotation. The experimental site was split into a reference (REF) and agrivoltaic (AV) site. The diagram is a schematic illustration and not to scale. (image source: BayWa r.e., modified).
Agronomy 11 00733 g002
Figure 3. Monthly mean temperature (red curve) and monthly accumulated precipitation (cyan bars) in 2017 and 2018. Data from Agricultural Meteorology Baden-Wuerttemberg, Billafingen weather station.
Agronomy 11 00733 g003
Figure 4. Mean plant height under AV (cyan triangles) and on REF (orange triangles) in 2017 (a) and 2018 (b). Significant differences are indicated by stars (* p < 0.05; **p < 0.005; *** p < 0.0005). Standard deviation is depicted by error bars.
Agronomy 11 00733 g004
Figure 5. Leaf area index (LAI) of plants grown under AV (cyan triangles) and in REF (orange triangles) in 2017 (a) and 2018 (b). Significant differences (* p < 0.05) are indicated by stars. Standard deviation is depicted by error bars.
Agronomy 11 00733 g005
Figure 6. Celeriac aboveground biomass (t dry matter ha−1) (a) and bulb yield (t fresh matter ha−1) (b) in REF and AV in 2017 and 2018. Significant differences are indicated by stars (* p < 0.005).
Agronomy 11 00733 g006
Figure 7. Celeriac harvested in 2017. The plants all come from one plot. In each treatment, four plots (with 12 plants each) were harvested. Most bulbs are comparatively small and some leaves are already senescent. (Source: Bauerle/University of Hohenheim).
Agronomy 11 00733 g007
Table 1. Yearly averages of air temperature and humidity, soil temperature and moisture as well as photosynthetic active radiation expressed by photosynthetic photon flux density (PFD) under the agrivoltaic system (AV) and on the reference site (REF) in 2017 and 2018.
Air Temperature
[°C]
Humidity
[%]
Soil Temperature
[°C]
Soil Moisture
[%]
PPFD
[μmol/m²s]
2017REF8.779.118.425.2469.4
AV8.781.917.227.1336.7
2018REF10.471.619.220.9497.9
AV10.474.417.817.8344.5
Table 2. Concentration of crude protein, crude fat, neutral detergent fiber (aNDFom), acid detergent fiber (ADFom), acid detergent lignin (ADL) and macroelements C, S, Ca, K, Mg, Na, P (in % dry matter DM). Significant differences (p < 0.05) are indicated by different letters. p-values correspond to the test of fixed effects year, treatment (Trt) and their interaction. SEM = Standard error of means.
Treatment[% DM]
Crude ProteinCrude FataNDFomADFomADLCSCaKMgNaPCl
2017
AV10a2.25a---39.5a0.09a0.31a4.09a0.20.31a0.58a0.08a
REF9.4a2.18a---40.1b0.09a0.34b3.9a0.210.31a0.59a0.08a
2018
AV11.7b2.78b13.39.5a2.0640.7c0.08b0.28c2.19b0.190.16b0.33b0.05b
REF12.1b2.83b16.110.5b3.041.1d0.08ab0.3ac2.25b0.180.22c0.3b0.06ab
SEM0.1960.0751.3480.0720.3270.1490.0020.0050.0760.010.0180.010.009
p-value
Year<0.0001<0.0001---<0.00010.06120.0001<0.00010.082<0.0001<0.00010.0152
Trt0.66430.87130.19180.00020.09850.00481.00.00210.42250.90.08440.36280.7760
Trt∗Year0.03970.4254---0.68430.31660.20090.12210.70710.10650.18320.2694
Table 3. Concentration of microelements (ppm dry matter (DM)). Significant differences (p < 0.05) are indicated by different letters. p-values correspond to the test of fixed effects year, treatment (Trt) and their interaction. SEM = Standard error of means.
Treatment[ppm DM]
AlBBaCuFeMnZnSiCdCoCrNiMoPbSeI
2018
AV3.16a33a8.04a16a21.3a36.4a29.3a<1500.67a<0.020.23a0.92a0.05a0.08a0.03<0.50
REF3.02a30.8a11.1b17.4a21a60.2b31.2a<1501.33b<0.020.08ab1.49b0.04a0.11b0.03<0.50
2017
AV1.28b27b2.47c14.1b30b42.1ac25.9b<1500.5a<0.020.02b1.19a<0.02b0.06c0.02<0.50
REF2.7ab24.6b3.8c12.8b28.4b48.1c25.7b<1500.96c<0.020.03b2.15c<0.02b0.1ab0.02<0.50
SEM0.531.020.8760.5151.4042.4621.069-0.079-0.0590.0890.0030.0060.007-
p-value
Year0.06260.0001<0.0001<0.00010.00010.22610.0019-0.0064-0.04840.0004<0.00010.00290.163-
Trt0.27050.04670.02990.86850.65330.00010.4452-<0.0001-0.2875<0.00010.28720.00020.9202-
Trt∗Year0.18180.85780.34870.0225 0.66570.00460.3385-0.231-0.19960.05210.28720.41910.7898-
Publisher’s Note: MDPI stays neutral with regard to jurisdictional claims in published maps and institutional affiliations.

