The locust standard brain: a 3D standard of the central complex as a platform for neural network analysis
1
Fachbereich Biologie, Tierphysiologie, Philipps-Universität Marburg, Marburg, Germany
2
Neuroscience Program, SRI International, Menlo Park, CA, USA
Many insects use the pattern of polarized light in the sky for spatial orientation and navigation. We have investigated the polarization vision system in the desert locust. To create a common platform for anatomical studies on polarization vision pathways, Kurylas et al. (2008)
have generated a three-dimensional (3D) standard brain from confocal microscopy image stacks of 10 male brains, using two different standardization methods, the Iterative Shape Averaging (ISA) procedure and the Virtual Insect Brain (VIB) protocol. Comparison of both standardization methods showed that the VIB standard is ideal for comparative volume analysis of neuropils, whereas the ISA standard is the method of choice to analyze the morphology and connectivity of neurons. The central complex is a key processing stage for polarization information in the locust brain. To investigate neuronal connections between diverse central-complex neurons, we generated a higher-resolution standard atlas of the central complex and surrounding areas, using the ISA method based on brain sections from 20 individual central complexes. To explore the usefulness of this atlas, two central-complex neurons, a polarization-sensitive columnar neuron (type CPU1a) and a tangential neuron that is activated during flight, the giant fan-shaped (GFS) neuron, were reconstructed 3D from brain sections. To examine whether the GFS neuron is a candidate to contribute to synaptic input to the CPU1a neuron, we registered both neurons into the standardized central complex. Visualization of both neurons revealed a potential connection of the CPU1a and GFS neurons in layer II of the upper division of the central body.
Many insects are able to perceive the pattern of polarized light in the blue sky (Horváth and Varjú, 2004
). Studies on bees and ants have shown that these insects use the celestial polarization pattern for spatial orientation and navigation (Wehner, 1992
). These and other insect species detect the plane of skylight polarization (E-vector) with a specialized dorsal rim area (DRA) of their compound eye (Labhart and Meyer, 1999
; Mappes and Homberg, 2004
). Photoreceptors in the DRA are highly sensitive to polarized light and send axonal projections to distinct dorsal regions of the lamina and medulla (Blum and Labhart, 2000
; Homberg and Paech, 2002
). Polarization-sensitive (POL) interneurons have been studied in the brain of the field cricket (Labhart, 1988
; Labhart et al., 2001
; Sakura et al., 2008
) and in the desert locust Schistocerca gregaria (Vitzthum et al., 2002
; Pfeiffer et al., 2005
; Kinoshita et al., 2007
; Pfeiffer and Homberg, 2007
; Heinze and Homberg, 2009
; Heinze et al., 2009
).
In locusts, POL-neurons innervate specific, mostly small and distinct neuropils in the brain that are specialized for integration and processing of polarized-light information. These neuropils are connected by distinct fiber bundles and can be regarded as elements of a polarization vision pathway in the locust brain (Homberg, 2004
). Neurons of a small ventral layer of the anterior lobe of the lobula (ALo) receive polarization information from the dorsal rim area of the medulla (DRMe) and send these signals to the anterior optic tubercle (AOTu) in the central brain. Only neurons of the lower unit of the AOTu are sensitive to polarized light (Pfeiffer et al., 2005
). These neurons integrate signals from the sky polarization and chromatic contrast and compensate their E-vector tuning for diurnal changes in solar elevation (Pfeiffer and Homberg, 2007
). Polarization information is transmitted from the AOTu to two distinct regions of the lateral accessory lobe, the median olive (MO) and the lateral triangle (LT) (Homberg et al., 2003
). From these areas, neurons transfer polarization information to a final processing stage of the polarization vision pathway, the central complex. The central complex comprises a group of neuropils spanning the midline of the brain and consists of the protocerebral bridge (PB), the upper (CBU) and lower (CBL) divisions of the central body, and a pair of postero-ventral neuropils, termed noduli (No).
Studies in Drosophila suggest a role of the central complex in walking and leg coordination (Strauss and Heisenberg, 1993
; Strauss, 2002
; Poeck et al., 2008
), flight control (Ilius et al., 1994
), spatial orientation (Strauss, 2002
; Neuser et al., 2008
), and memory for visual object parameters (Liu et al., 2006
; Wang et al., 2008
). Together with evidence from locusts for a prominent role in sky compass orientation (Vitzthum et al., 2002
; Heinze and Homberg, 2007
), the central complex can be regarded as an integration center for multisensory information that is relevant to spatial memory and spatial orientation in diverse behaviours. One of the key features of the central complex is a highly modular neuroarchitecture. The CBU and CBL are organized into sets of clearly defined horizontal layers (Homberg, 1991
; Müller et al., 1997
) and the CBU, CBL and PB, in addition, into arrays of 16 regular vertical modules, called columns (Williams, 1975
). Three major classes of cell types have been distinguished in the central complexes of locusts and other insects: (i) tangential neurons arborize in various areas outside the central complex and provide signaling input to distinct layers (Strausfeld, 1976
; Hanesch et al., 1989
); (ii) pontine neurons interconnect defined columns of the CBU in a regular way (Hanesch et al., 1989
; Siegl et al., 2009
), and (iii) columnar neurons provide signaling output from columnar domains to follower neurons in the lateral accessory lobes (LALs) (Hanesch et al., 1989
; Heinze and Homberg, 2008
). A subset of at least 13 different types of columnar and tangential neurons in the locust central complex are sensitive to polarized light (Vitzthum et al., 2002
; Heinze and Homberg, 2009
; Heinze et al., 2009
), and many of these contribute to a topographic representation of E-vectors underlying the columnar neuroarchitecture of the PB (Heinze and Homberg, 2007
).
For a deeper understanding of information processing in the neuronal network of the central complex, detailed knowledge about the synaptic connections between the different cell types is essential. An important step towards this goal is the generation of a high-quality three-dimensional (3D) anatomical atlas of the brain in which individual variations in shape, position and size of brain structures have been eliminated. This standard atlas can then serve as a platform to pool and simultaneaously visualize neurons from different preparations. Improvements in 3D imaging, processing, and computational capacity have permitted the creation of 3D standard brain atlases of the fruit fly, Drosophila melanogaster (Rein et al., 2002
), the honey bee, Apis mellifera (Brandt et al., 2005
), the desert locust, Schistocerca gregaria (Kurylas et al., 2008
), and the moths, Manduca sexta (el Jundi et al., 2009
) and Heliothis virescens (Kvello et al., 2009
). For generation of these atlases, two different standardization methods have been established. The Virtual Insect Brain (VIB) protocol (Jenett et al., 2006
) was used for the Drosophila and Manduca standard brains, whereas the Iterative Shape Averaging (ISA) method (Rohlfing et al., 2001
) was used for the Apis and Heliothis standard brains. The VIB standard brains of Drosophila and Manduca were used primarily to compare volumes of brain areas between sexes. In contrast, the ISA brain of the honey bee was created to register single neurons from individual brains into a common standard. To reveal the limitations and advantages of the ISA and VIB procedures, both techniques were applied in comparison for the generation of a standard brain of the desert locust (Kurylas et al., 2008
).
In this study we review the ISA and VIB standard brains of the desert locust and compare their advantages and limitations. As our goal is the analysis of neural connections in the central-complex network, we determined the ISA standardization method as the more appropriate one. To facilitate accurate representation of central-complex neurons, it is essential to have available an atlas of higher spatial resolution than is typically available for the whole brain. We, therefore, created a new, high-resolution ISA standard atlas of the central complex and immediately adjacent neuropils associated with the central complex. We show herein that this new 3D standard central complex is a highly suitable platform to investigate potential connections between central-complex neurons.
In the current work, we focus our attention to the columnar cell type CPU1a (Vitzthum et al., 2002
). Previous analyses suggested that CPU1a neurons receive input from single columns of the PB and from a pair of columns of the CBU (Heinze and Homberg, 2008
). In addition to polarized-light input, which is most likely provided in the PB arborizations (Heinze et al., 2009
), the CPU1a neuron receives input in the CBU columns which is probably polarization-independent. A candidate neuron to provide synaptic input in the CBU is the tangential giant fan-shaped (GFS) neuron (Williams, 1972
; Homberg, 1994
), which arborizes in the CBU. To investigate possible connections between both neurons, we reconstructed a GFS and a CPU1a neuron in 3D and registered both into the standard central complex. The visualization of both neurons in the standard central complex reveals potential connections between these neurons in layer II of the CBU.
Animals
Desert locusts (Schistocerca gregaria) were reared under crowded conditions at 28°C on a 12:12 light/dark cycle. Only adult gregarious male locusts (1–3 weeks after imaginal moult) were used for reconstructions of the central complexes.
Standardized Central Complex
Immunocytochemistry
Brains were dissected out of the head capsule and were fixed over night in 4% formaldehyde/0.1 M phosphate-buffered saline (4% FA/PBS, pH 7.4) at 4°C. They were then embedded in gelatine/albumin and sectioned from anterior to posterior with a vibrating-blade microtome (Leica VT1200 S, Leica Microsystems, Wetzlar, Germany) into 250-μm thick frontal sections. Brain sections were rinsed in 0.1 M PBS containing 0.3% Triton X-100 (PBT) for 1 h at room temperature and were preincubated (4°C, over night) in 5% normal goat serum (NGS; Jackson ImmunoResearch, Westgrove, PA, USA) in 0.1 M PBT containing 0.02% sodium azide. For visualization of distinct brain areas, all specimens were incubated with a monoclonal mouse antibody against the presynaptic vesicle protein synapsin I (SYNORF1, Klagges et al., 1996
, kindly provided by Dr. E. Buchner, Würzburg) for 4–6 days at 4°C. Anti-synapsin was diluted 1:50 in 0.1 M PBT containing 1% NGS and 0.02% sodium azide. To distinguish the layers of the central body, a rabbit antibody against serotonin was added to the primary antibody solution (1:20,000; Diasorin, Dietzenbach, Germany). After extensive rinsing, sections were incubated with goat anti-mouse (GAM) antibody conjugated to Cy5 and goat anti-rabbit (GAR) antibody conjugated to Cy2 (both 1:300; Jackson ImmunoResearch, Westgrove, PA, USA) in 0.1 M PBT, 1% NGS and 0.02% sodium azide for up to 3 days at 4°C. After rinsing, preparations were dehydrated in an ascending ethanol series (30–100%, 15 min each) and were cleared with a solution of 1:1 ethanol/methyl salicylate (15 min) followed by methyl salicylate (at least 40 min). Brain sections were embedded between two coverslips in Permount (Fisher Scientific, Pittsburgh, PA, USA). Compression of the preparations was prevented by spacers (Zweckform, Oberlaindern, Germany).
CLSM image acquisition
The brain sections were scanned using a confocal laser scanning microscope (CLSM, Leica TCS SP2) with a 20 × oil objective (HC PL APO 20×/0.70 lmm Corr CS, Leica, Bensheim, Germany). The fluorescent signal of Cy5 was detected with a HeNe laser (633 nm). In addition, the sections were also scanned with an Ar laser (488 nm) to detect the serotonin staining signal (Cy2). The sections were scanned with 1024 × 1024 pixels per stack in xy direction (pixel size in xy direction: 1 × 1 μm) and 1 μm step size in z direction. Sections were scanned from anterior and posterior.
Image processing and reconstruction
The image stacks of the central complex and surrounding neuropils obtained from the brain sections were processed using Amira 4.1.2 software (Visage Imaging, Fürth, Germany). Because the central complex and surrounding neuropils extended across several brain sections we first aligned the corresponding image data. Pairs of image stacks from adjacent brain sections were opened in Amira and the matching optical slices in both stacks of data were selected. These optical slices were exactly overlapped with the TransformEditor by translation in x, y and z direction and by rotation of the image stacks. The image stacks were then connected using the module Merge. The resulting image data showed a detailed representation of staining for synapsin and serotonin of the central complex and surrounding brain areas.
For 3D reconstructions, Labelfield files were created with the same dimensions (voxel size and resolution) as the corresponding merged image stacks. Using the Segmentation Editor, reconstructions of selected neuropils were performed. All neuropils were labeled based on the anti-synapsin image stacks except for layers II and III of the CBU. These layers could not be distinguished in the synapsin channel and were, therefore, reconstructed using the corresponding anti-serotonin image stacks. Regions of interest were labeled in 3D in several optical slices and contiguous 3D structures were reconstructed using the tool Wrap.
Standardization of the central complex
We used 20 sectioned brains from male locusts to generate a 3D standardized central complex using the ISA method. For an exact registration of the neuropils of interest it was essential to mask the areas surrounding the central complex and LALs in the image stacks with the module Arithmetic. In some of the image stacks we corrected the tonal value using Adobe Photoshop 8 (Adobe Systems, San Jose, CA, USA) Furthermore, due to computer memory limitations, it was necessary to downsample the image stacks and the labelfield files with the module Resample to a voxel size of 2 × 2 × 2 μm.
For registration of the central complexes the central-complex image stacks and corresponding labelfields were exported to 3D image files in Analyze format. The overall registration procedure was controlled by a shell script, which used command-line driven registration tools developed by one of the authors (TR) and available in source code as part of the Computational Morphometry Toolkit (http://nitrc.org/projects/cmtk/
). To reduce the time for image registration and transformation of the 20 central complexes, standardization of the central complex was calculated on a Linux-based cluster provided by Philipps-University of Marburg.
Analogous to the whole-brain procedure, CLSM images of the central complexes were first globally registered to a chosen reference specimen using an affine registration. Then, the iterative averaging and non-rigid transformation procedure was repeated four times. After completion of the averaging process, corresponding standardized 3D reconstructions of the labeled central-complex structures were created by applying the final transformation parameter to the label image stacks that corresponded to the standardized CLSM images. For an accurate standardization of the image stacks, the registration parameters were optimized and refined after repeated visual inspection of the results.
Central-Complex Neurons
Staining and immunocytochemistry
Central-complex neurons were injected iontophoretically with 4% Neurobiotin (Vector, Burlingame, CA) through glass microelectrodes with a resistance of 50–180 MΩ. The Neurobiotin was injected with a continuous depolarizing current of 1–3 nA for 1–5 min. The brains were dissected out of the head capsule and were fixed over night in 4% paraformaldehyde at 4°C. Both preparations were processed further as described by Heinze and Homberg (2008)
. Briefly, after fixation and rinsing, the brains were incubated at 1:1000 with Cy3-streptavidin (Dianova, Hamburg, Germany) in 0.1 M PBT for 3 days. After rinsing in buffer, they were dehydrated in an ascending ethanol series (25%–100%, 15 min each), transferred to ethanol/methyl salicylate (1:1, 15 min), and cleared in methyl salicylate for 35 min. Brains were mounted in Permount between two glass cover slides.
After scanning with the CLSM (10× oil objective) the embedded brains were incubated in xylene (2–4 h) to remove the embedding medium. Brains were rehydated in a descending ethanol series (100%–20%, 15 min. each) and were embedded in gelatine/albumin over night at 4°C. They were sectioned with the vibrating-blade microtome in 130–140-μm thick frontal sections. The sections were rinsed in 0.1 M PBS (4 × 15 min) and, after preincubation in 5% NGS in 0.1 M PBT at 4°C over night, were incubated for 6 days in anti-synapsin (1:50) and Cy3-streptavidin (1:1000) in 0.1 M PBT containing 1% NGS. After washing in 0.1 M PBT for 2 h, the sections were treated with Cy5-GAM (1:300), Cy3-streptavidin (1:1000) and 1% NGS in 0.1 M PBT for up to 3 days at 4°C. After rinsing, the preparations were dehydrated in an ascending ethanol series (30%–100%, 15 min. each) and were cleared with 1:1 ethanol/methyl salicylate (15 min.) followed by methyl salicylate (at least 40 min.). Sections were finally embedded in Permount between two coverslips.
Reconstruction and registration
The dye-injected neurons and the corresponding anti-synapsin stainings were scanned with the CLSM using a 20× or 40× objective (HCX PL APO 40×/1.25–0.75 Oil CS) at a resolution of 1024 × 1024 pixels (voxel size in xy direction: 0.22–0.35 × 0.22–0.35 μm) and a distance of 0.5 μm between optical slices. For neuron reconstructions in 3D we used the SkeletonTree tool in Amira 4.1.2 (Schmitt et al., 2004
; Evers et al., 2005
). Because of the limited computational capacity it was not possible to merge the scanned image stacks of the neurons with the anti-synapsin staining at high resolution. Therefore, we oriented all individual image stacks to the correct position with respect to each other using the TransformEditor and saved their positions with the module ApplyTransform. Reconstructions of the neurons were performed by opening image stacks consecutively and reconstructing the particular part of the neurons. For reconstruction of the corresponding neuropils the anti-synapsin-labeled image stacks were also transformed to their exact position, downsampled to a voxel size of 1 × 1 × 1 μm, and then merged into a single image stack. The nomenclature for central-complex neuropils and layers follows Heinze and Homberg (2008)
, the nomenclature for the lateral accessory lobe structures is based on Homberg (1994)
.
The reconstructed neurons were registered into the standardized central complex and into the standard locust brain of Kurylas et al. (2008)
. For registration of the neurons we registered distinct neuropils of the individual central complex into the standardized central complex and the standard brain using Amira 4.1.2. Neuropils of the individual central complex were first registered into the standard central complex and the standard brain using an affine transformation, computed by the AffineRegistration module. Afterwards, an elastic registration of the neuropils was performed using the module ElasticRegistration. The transformation parameters of the registrations were then applied to the neurons using the modules ApplyTransform and ApplyDeformation. Because of limited computational capacity it was not possible to register all neuropils in one process into the standard central complex. Therefore, we registered only two neuropils into the standard central complex in each case and then applied the registration parameters for the registration of the corresponding part of the neuron. Finally, all registered neuron parts were connected.
Visualization
To visualize our data we used several tools in Amira. The 3D surface views of the reconstructed neuropils were generated with the module SurfaceGen and were visualized with the tool SurfaceView. Direct volume rendering displays of the CLSM analogous image data of the standard central complex were created with the tool Voltex. To hide irrelevant structures surrounding the standardized neuropils and to distinguish the neuropils we masked the image data with the module Arithmetic. To this end, we used the standardized neuropil labelfield as a mask and removed surrounding synapsin-immunostained regions. Reconstructed neurons of the central complex were visualized with the SkeletonView. Volume data of the neuropils were calculated with the module TissueStatistics. Neuropil sizes were measured by the Measuring tool. Statistical analysis of these data was performed in SPSS 11.5 (Chicago, IL, USA) for Windows.
Standard Atlas of the Locust Brain
As a basis for further analysis of the neuroarchitecture of the locust brain and, in particular, for better understanding of neural networks associated with polarization vision and sky compass orientation Kurylas et al. (2008
) have previously established a standard atlas of the locust brain, based on data from ten male locust brains. Like other standard insect brains (Rein et al., 2002
; Brandt et al., 2005
) the reconstructions of the brains used for the registration process were based on staining against a synaptic neuropil marker. We briefly review the major findings of that study to illustrate the necessity for higher resolution standard atlases of particular brain areas of interest. In total, 33 distinct neuropils were reconstructed and registered for the standard locust brain (Figure 1
). Seven neuropils were registered in the optic lobe: the medulla proper (Me) was distinguished from two associated neuropils, the DRMe, which receives polarized-light information from the DRA of the compound eye (Homberg, 2004
), and the accessory medulla (aMe). Four subunits were distinguished in the lobula complex: the anterior (ALo), the dorsal (DLo), the inner (ILo) and the outer lobe of the lobula (OLo). In the median protocerebrum, the lateral horn (LH), the AOTu, the mushroom body, and the central complex were reconstructed. The AOTu is subdivided into an upper unit (uAOTu), which receives visual input from the optic lobe, and a lower unit (lAOTu), which is innervated by POL neurons (Pfeiffer et al., 2005
). The mushroom bodies (MB) were divided into the combined pedunculus (Pe)-lobes, the accessory calyx (aCa), and the primary calyx (pCa). In the central complex (CC) in the center of the brain, the PB, the upper division of the central body (CBU), the lower division of the central body (CBL), and the paired noduli (No) were distinctly registered. Below the MB the deutocerebral antennal lobes (AL) were the most ventral neuropils reconstructed in the brain. Although several brain regions, such as the tritocerebrum, the LALs, or the antennal mechanosensory and motor center, were reconstructed in some individual brains, they were not included in the standard brains due to difficulties in reproducibly identifying their boundaries to adjacent brain structures. These neuropils and brain regions were assigned to a common, artificial “midbrain neuropil” structure for standardization (Kurylas et al., 2008
).
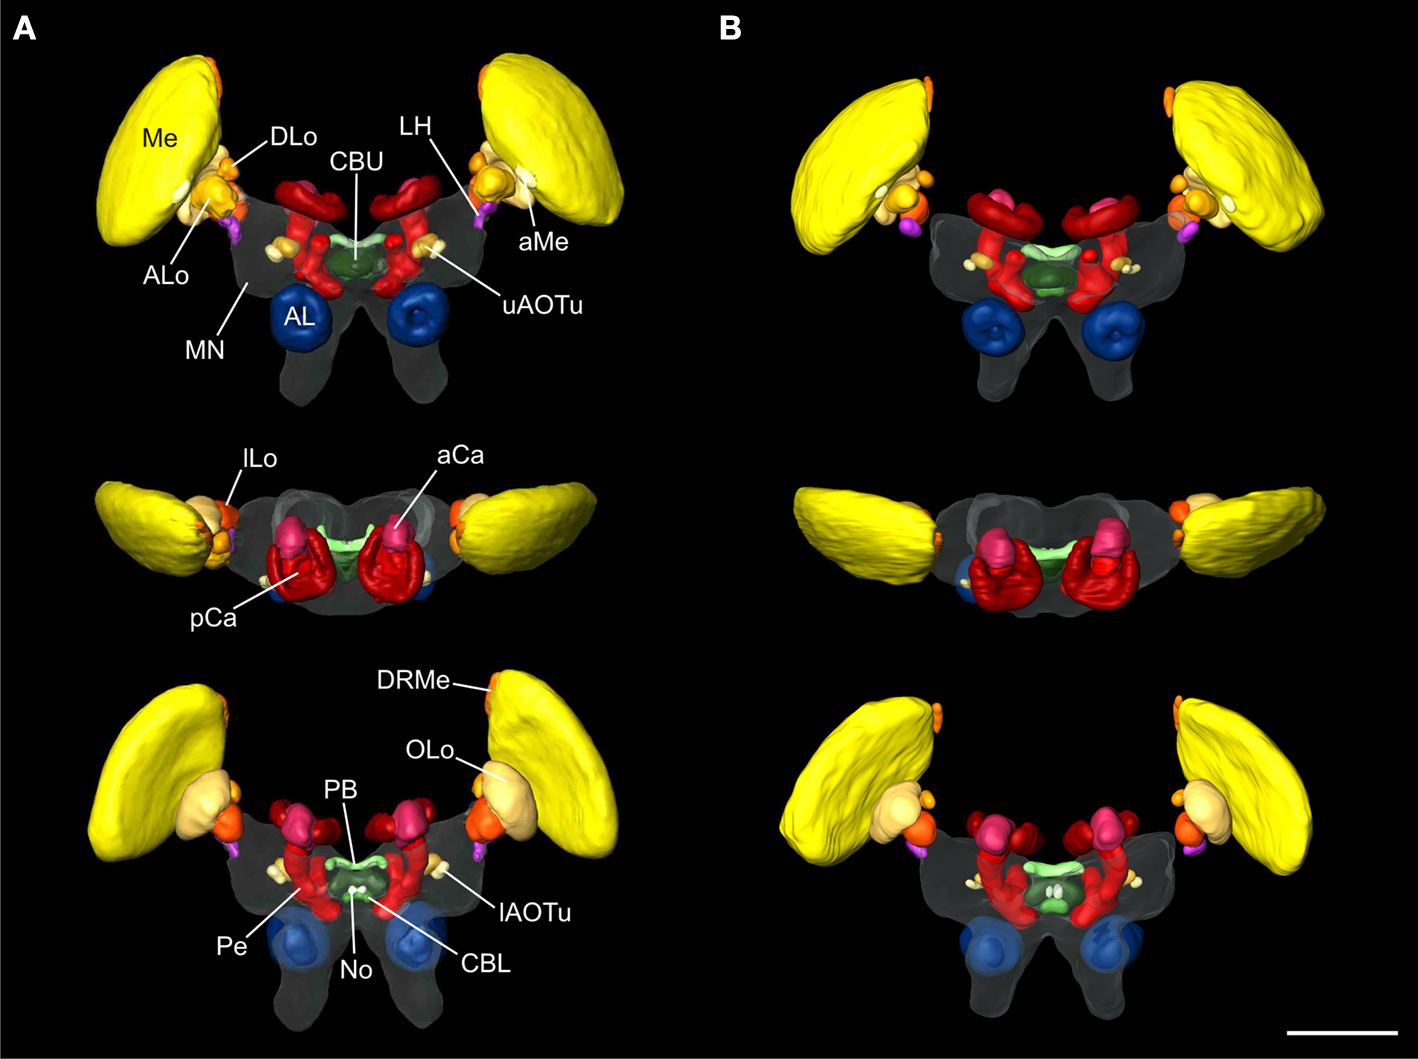
Figure 1. Visual comparison of the 10-animal ISA and VIB whole standard brains of the desert locust Schistocerca gregaria. Surface reconstruction of 33 distinct neuropils plus a “midbrain neuropil” (MN, transparent) (A) ISA standard brain in anterior (top), dorsal (middle), and posterior (bottom) view (aCa, accessory calyx; AL, antennal lobe; ALo, anterior lobe of the lobula; aMe, accessory medulla; CBL, lower division of the central body; CBU, upper division of the central body; DLo, dorsal lobe of the lobula; DRMe, dorsal rim area of the medulla; ILo, inner lobe of the lobula; lAOTu, lower unit of the anterior optic tubercle; LH, lateral horn; Me, medulla; No, noduli; OLo, outer lobe of the lobula; PB, protocerebral bridge; pCa, primary calyx; Pe, pedunculus; uAOTu, upper unit of the anterior optic tubercle). (B) VIB standard brain viewed from anterior (top), dorsal (middle), and posterior (bottom) sides. Visualization of the “midbrain neuropil” is based on average image data (modified from Kurylas et al., 2008
, Figures 5
A–C, right panel). The color coding of the neuropils is consistent with Brandt et al. (2005)
. Scale bar: 600 μm.
For creation of a visual 3D standard brain, two methods have been established: The Virtual Insect Brain protocol (VIB; Jenett et al., 2006
) and the Iterative Shape Averaging method (ISA, Rohlfing et al., 2001
). Both methods were applied to create a standardized brain of the locust (Figures 1
A,B). For an evaluation of both standardization procedures the relative distances to the center of the brain and the relative volumes of the standardized brains were compared to the mean distances and volumes of the ten individual brains (Kurylas et al., 2008
). In the VIB standard brain, neuropil volumes showed lower deviation from the mean volumes compared with the ISA standard brain. In contrast, the ISA standard brain showed higher invariance in relative distances, displayed brain structures more distinctly and showed higher symmetry in brain structures than the VIB standard. Therefore, the VIB standard brain is ideal for comparative volume analysis at the level of neuropils, whereas the standardized ISA brain is more useful as a platform to register and combine the morphologies of individual neurons (Kurylas et al., 2008
). The small relative size of some neuropils of interest, like the noduli, layers of the central complex, or the subunits of the AOTu posed a severe limitation to both atlases. These neuropils were represented by only small numbers of voxels. To analyze and to fit neuron branches faithfully into subunits of the central complex, we therefore decided to create an ISA standard of the locust central complex and associated brain areas at a higher image resolution.
The Standard Central Complex
For detailed reconstruction and identification of central-complex subunits, scanning of whole brains was not feasible due to limitations in focal depth of the 10× microscope objective. Therefore, a new set of 20 brains was dissected and sectioned in 250 μm-thick sections, followed by scanning and reconstruction of the regions of interest. In total, we reconstructed and standardized 22 neuropils and layers in the central complex. Analogous to whole-mount brains, reconstructions were based on anti-synapsin immunostaining, except for reconstruction of the layers of the CBU. The CBU consists of three layers (layers I–III) from anterior to posterior (Homberg, 1991
). Based on anti-synapsin staining, the boundary between layers I and II was well defined (Figure 2
A), but layers II and III could not be distinguished. The boundary between layers II and III was instead determined by serotonin immunostaining (Homberg, 1991
; Heinze and Homberg, 2008
; Siegl et al., 2009
; Figure 2
B). Although layers I and II can be further subdivided into the dorsal sublayers Ia and IIa and the ventral sublayers Ib and IIb (Homberg, 1991
), their precise boundaries are fuzzy (Heinze and Homberg, 2008
), and these sublayers were, therefore, not included in the standardized central complex. The CBL was reconstructed as a single neuropil. It is located anterior of the posterior groove and consists of six layers (Müller et al., 1997
). These layers were not well defined in synapsin- or serotonin immunostaining and were hence not reconstructed individually. Postero-dorsal to the CB we reconstructed the protocerebral bridge (PB, Figure 2
B). Although the CBU, CBL, and the PB are divided into 16 columns (Williams, 1975
; Heinze and Homberg, 2007
), it was not possible to reveal these substructures based on synapsin- or serotonin immunostaining. The paired noduli are located posterior to the CB (Figure 2
D) and consist of upper (NoU) and lower units (NoL). The upper unit shows three sublayers termed nodular layer I (NoUI), II (NoUII) and III (NoUIII) from dorsal to ventral. All subunits and layers of the noduli were reconstructed individually based on distinct anti-synapsin staining. Anterior to the ventral groove and dorsal to the CBU we reconstructed the anterior lip (aL), a neuropil that is directly connected to the central complex (Figure 2
A). Two other structures that are closely associated with the central complex are the paired lateral accessory lobes (LALs; Figure 2
C). The LALs are located posterior of the medial lobes of the MB and ventrolateral of the central complex. They consist of four well-defined subunits (Homberg, 1994
). Most prominent are a large dorsal shell extending anteriorly around the medial lobe of the mushroom body and a large ventral shell (VS). Both major subunits are separated by fibers in the isthmus tracts, which give rise to two further subunits, the LT and the MO.
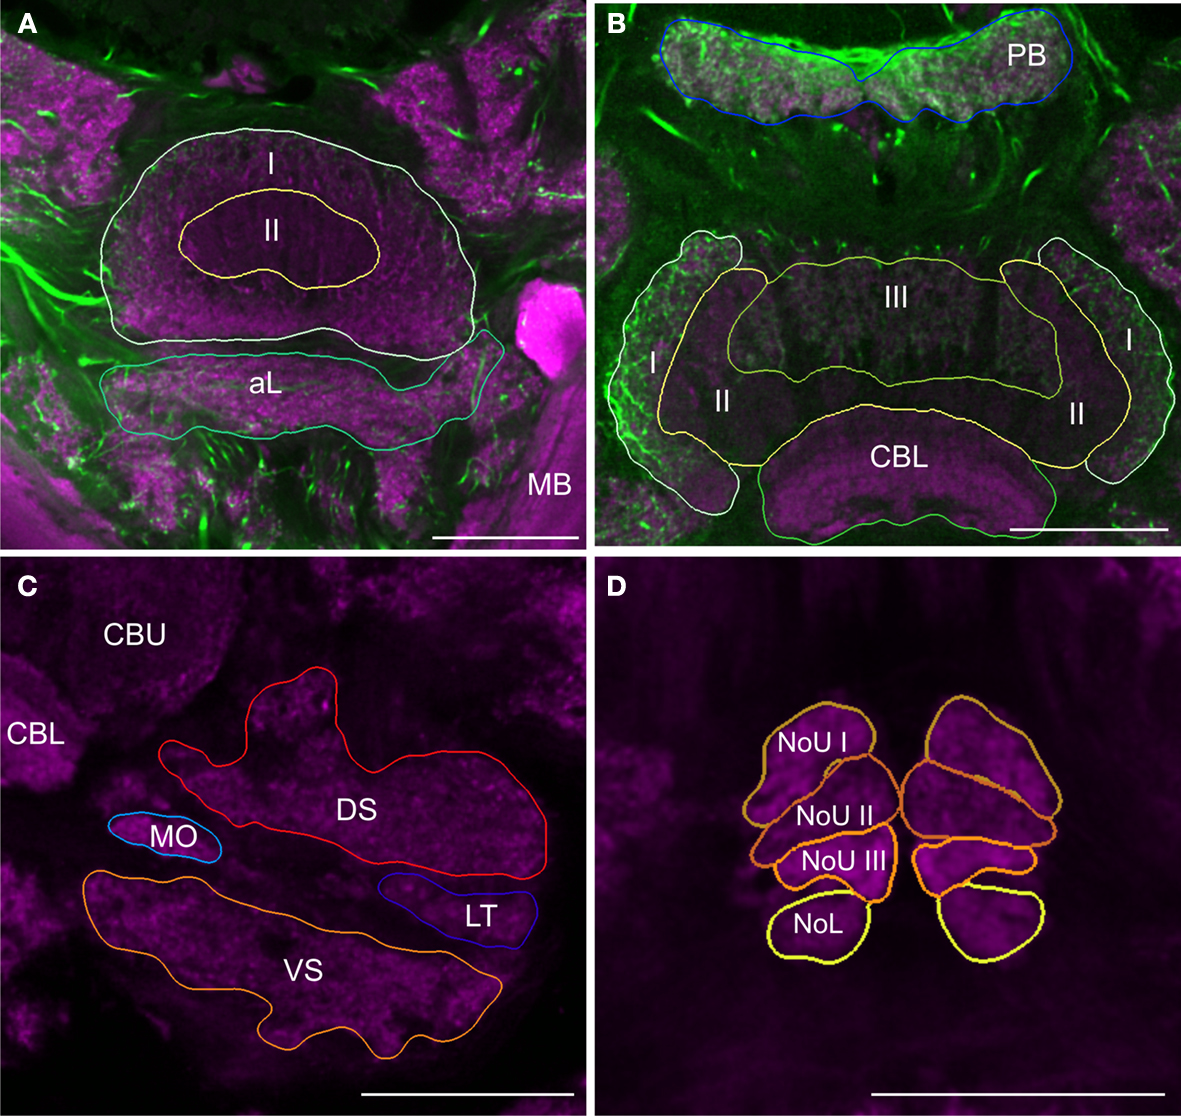
Figure 2. Images from frontal sections through the central complex and lateral accessory lobe at different levels based on immunostaining for synapsin (magenta) and serotonin (green). (A) Optical slice through layer I (I) and II (II) of the upper division of the central body and the anterior lip (aL) at the level of the mushroom bodies (MB). (B) Axial slice through the protocerebral bridge (PB), layer I (I), II (II) and III (III) of the upper division of the central body and the lower division of the central body (CBL). (C) Frontal section through the lateral accessory lobe, ventrolateral of the upper (CBU) and the lower (CBL) division of the central body. The lateral accessory lobe is subdivided into the dorsal shell (DS), the ventral shell (VS), the median olive (MO), and the lateral triangle (LT). (D) Confocal image through the upper and the lower units of the noduli (NoL). The upper units of the noduli are subdivided into layers I–III (NoU I, II, III). Scale bars: 100 μm.
For standardization, we reconstructed 20 individual adult male central complexes. Based on the results from Kurylas et al. (2008) and our aim to create a visual standardized model of these 22 neuropils for neural network analysis, we created the standard central complex using the ISA method (Rohlfing et al., 2001
). For standardization, one of the 20 brains had to be used as an initial affine registration template. Because the template brain determines the absolute scale of the ultimate standard atlas, we chose the brain with the smallest differences in neuropil distances from the mean distances of all brains to the brain center. Optical slices of this template brain are shown in Figure 2
. The ISA method created a fuzzy initial standardized atlas of the central complex based on affine registrations, followed by four iterations of averaging and non-rigid transformations. During registration in the iterative procedure the image stacks of the standard central complex converged into increasingly accurate alignment, and neuropil structures became increasingly sharp and well defined. The final outputs of the ISA procedure were an averaged intensity image (CLSM) stack and an “averaged” label image stack of the reconstructions of the neuropils. The average intensity image of the ISA standard central complex is shown in Figures 3
A,B as a direct volume rendering visualization. A 3D surface visualization of the reconstructed structures in the standard brain is shown in Figures 3
C–G from different perspectives. The mean shape property of standardized structures generated by the ISA method has been demonstrated previously through a comparison of the degree of deformation between two individual brains and between the standard brain and an individual brain (Brandt et al., 2005
; Kurylas et al., 2008
). The ISA standard central complex, therefore, represents a ”typical” central complex in terms of shape and appearance and provides a reliable, high-resolution reference coordinate space for registration and analysis of central-complex neurons of the desert locust.
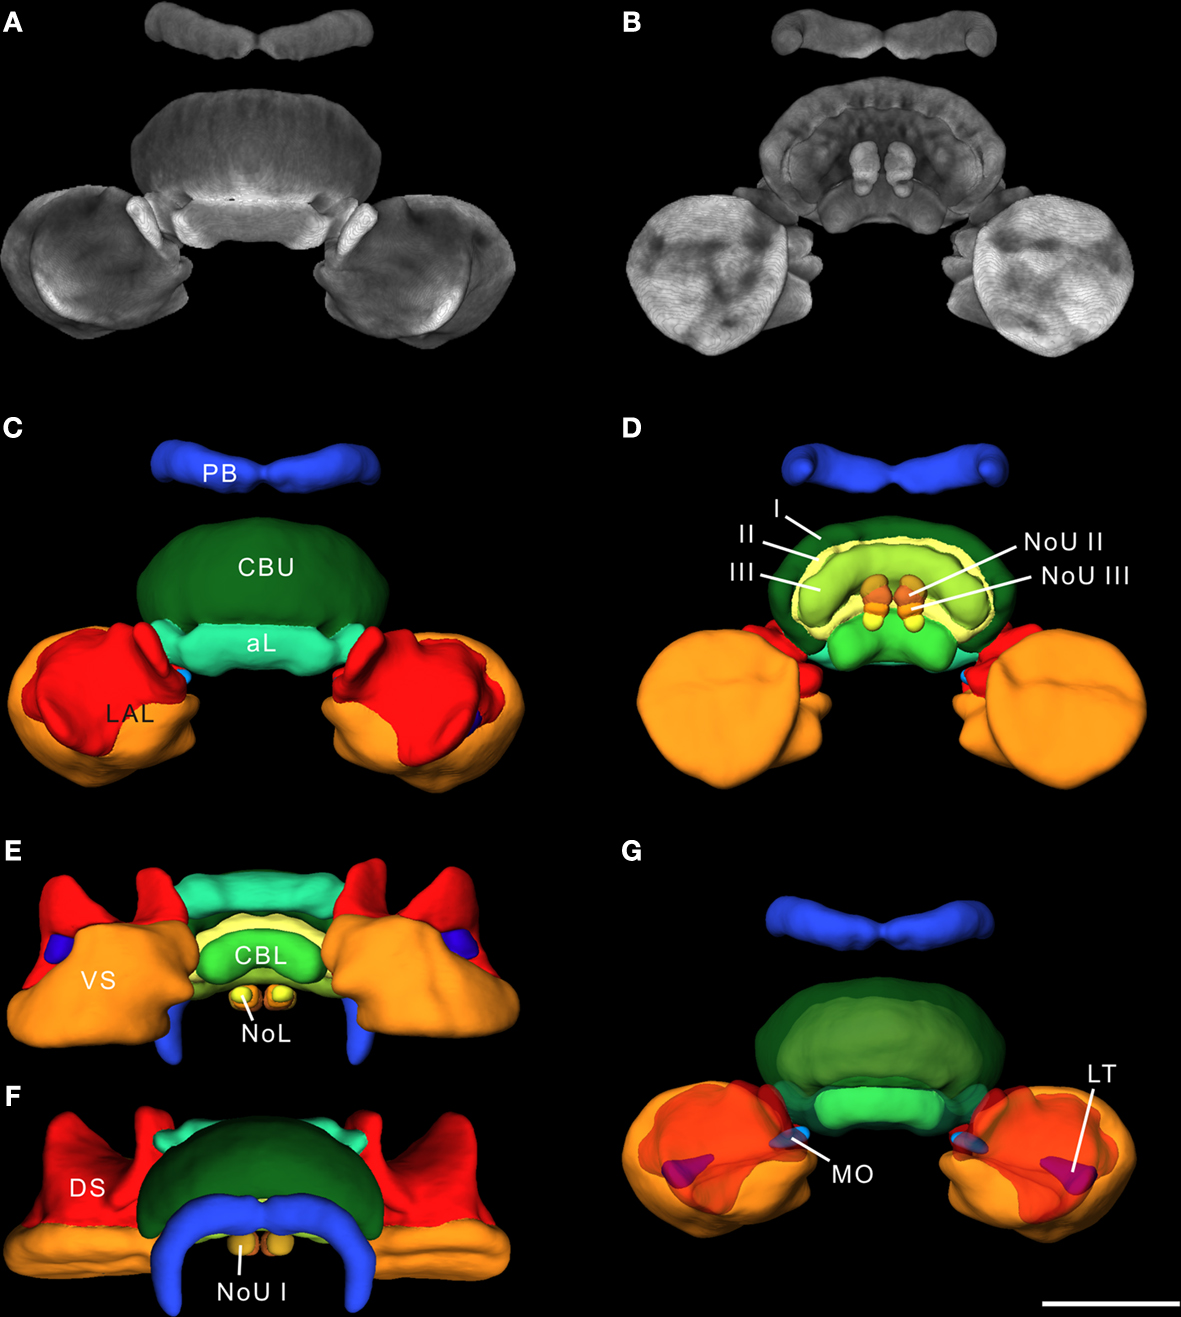
Figure 3. The 20-animal standard central complex calculated using the ISA method. (A,B) 3D reconstruction of the standardized image stack by direct volume rendering. For visualization, synapsin labeling in brain areas surrounding the image data was deleted. (A) 3D visualization of the standardized CLSM image stack from anterior. (B) Posterior view of the standard central complex image data. (C–G) Surface reconstruction of all 22 segmented neuropils from different perspectives. (C) Anterior view (D) posterior view (E) ventral view (F) dorsal view (G) anterior view with transparent layer I of the upper division of the central body and dorsal shells. I, II, III, layers I–III of the upper division of the central body; aL, anterior lip; CBL, lower division of the central body; CBU, upper division of the central body; DS, dorsal shell; LAL, lateral accessory lobe; LT, lateral triangle; MO, median olive; NoL, lower unit of the nodulus; NoU I, II, III, layers I–III of the upper units of the noduli; PB, protocerebral bridge; VS, ventral shell. Scale bar: 200 μm.
Comparison of volumes and sizes of central-complex subdivisions between the standard brain and the standardized central complex revealed significantly smaller mean neuropil volumes of the PB and CBL (student t-test; two tailed; Figure 4
A) in the sections than in the whole-mount brains. The CBU (p = 0.062) and the No (p = 0.551) were not significantly smaller. These differences in mean volumes probably resulted from larger tissue shrinkage of the brain sections and perhaps from differences in image resolution between the whole-mounts and the brain sections. Although the mean sizes of the PB and CBL were significantly different, the corresponding sizes in the ISA whole brain atlas do not reflect this (Figure 4
A). Similarly, the sizes of the neuropils between the standard central complex and the central-complex neuropils in the whole-brain ISA standard do not exhibit the same differences (Figure 4
B).
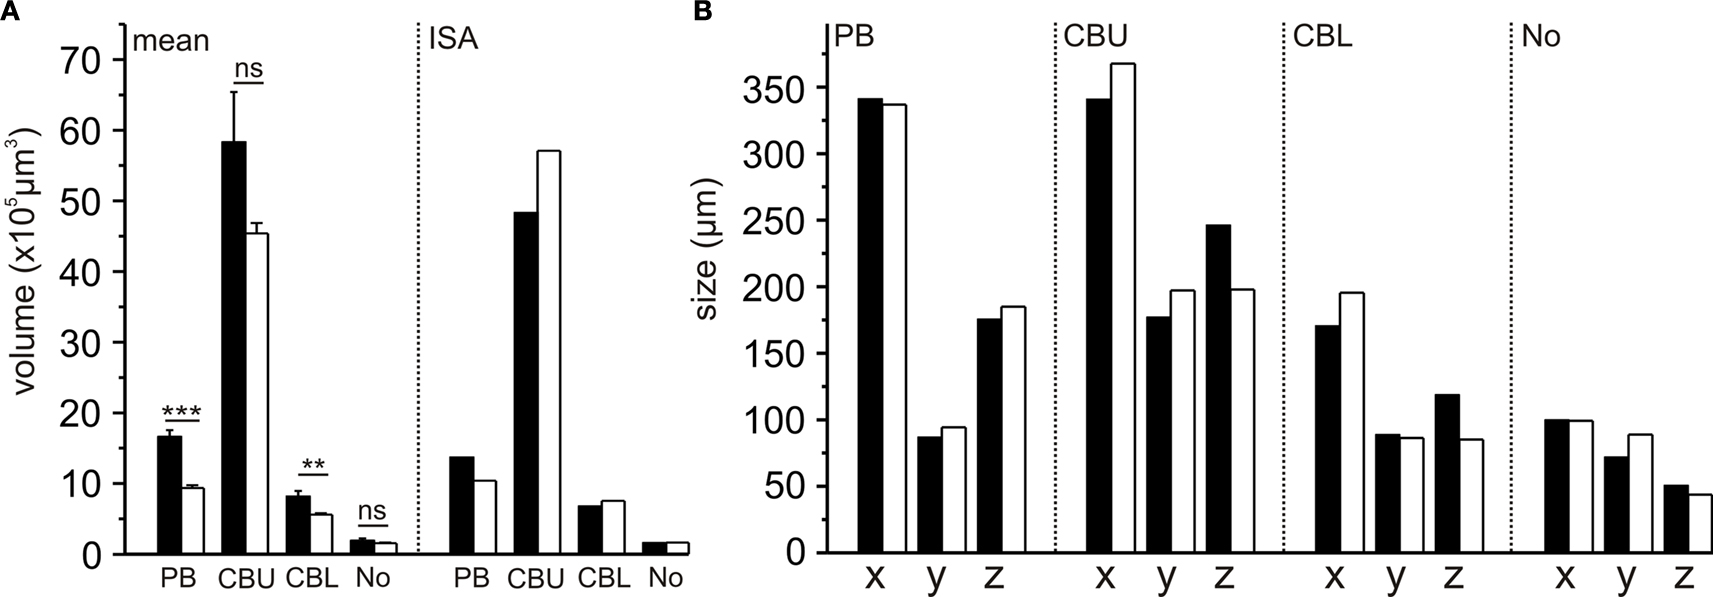
Figure 4. Comparison of volumes and sizes of central-complex subdivisions between the 10-animal standard whole brain (black bars; from Kurylas et al., 2008
) and the 20-animal standard central complex (white bars, this work). (A) Comparison of the means and ISA neuropil volumes (bars: standard error; ***p < 0.001; **p < 0.01; ns, not significant). (B) Comparison of neuropil sizes in the ISA standard brain and in the ISA standard central complex. CBL, lower division of the central body; CBU, upper division of the central body; No, noduli; PB, protocerebral bridge; x, y, z neuropil sizes in x, y, and z directions.
CPU1a Neuron
The POL columnar CPU1 and CPU2 neurons are among the largest columnar cell types of the central complex. To further analyze the neural connections of these neurons, we reconstructed a subtype of CPU1 neurons termed CPU1a in 3D, based on high-resolution image stacks obtained with a 20× and a 40× oil objective (Figure 5
). The somata of all CPU1 neurons are located in the pars intercerebralis; the neurons have arborizations in the PB, the central body, and in one or both LALs (Heinze and Homberg, 2008
). CPU1a neurons have arborizations in a single ipsilateral column of the PB and in two adjacent contralateral columns of the CBU. Axonal ramifications are concentrated in the contralateral LAL (Figure 5
A). The reconstructed neuron has its cell body in the anterior pars intercerebralis and, judged from the location of its arborization domain in the PB, densely arborizes in the second innermost column (column R7) of the right PB hemisphere (Williams, 1975
; Heinze and Homberg, 2008
; Figure 5
B). The primary neurite leaves the PB on the anterior side and runs ventrally to the CB. The neurite crosses the hemisphere via the z-bundle between the PB and the CB and enters the CBU at its dorsal contralateral side. There, the CPU1a cell gives rise to a large tree of smooth dendritic arborizations, extending through two adjacent columns of the CBU (Figure 5
C). The main neurite projects ventrally along the anterior face of the CBU, continues between layer I of the CBU and the anterior lip, and enters the ventral groove. Anterior to the CBL, the axonal fiber joins the isthmus tract and invades the contralateral LAL. Varicose and beaded ramifications are confined to the VS of the LAL (Figure 5
D). The 3D reconstructions of the neuron before (red) and after transformation (grey) for registration into the standard central complex are shown in Figure 5
E.
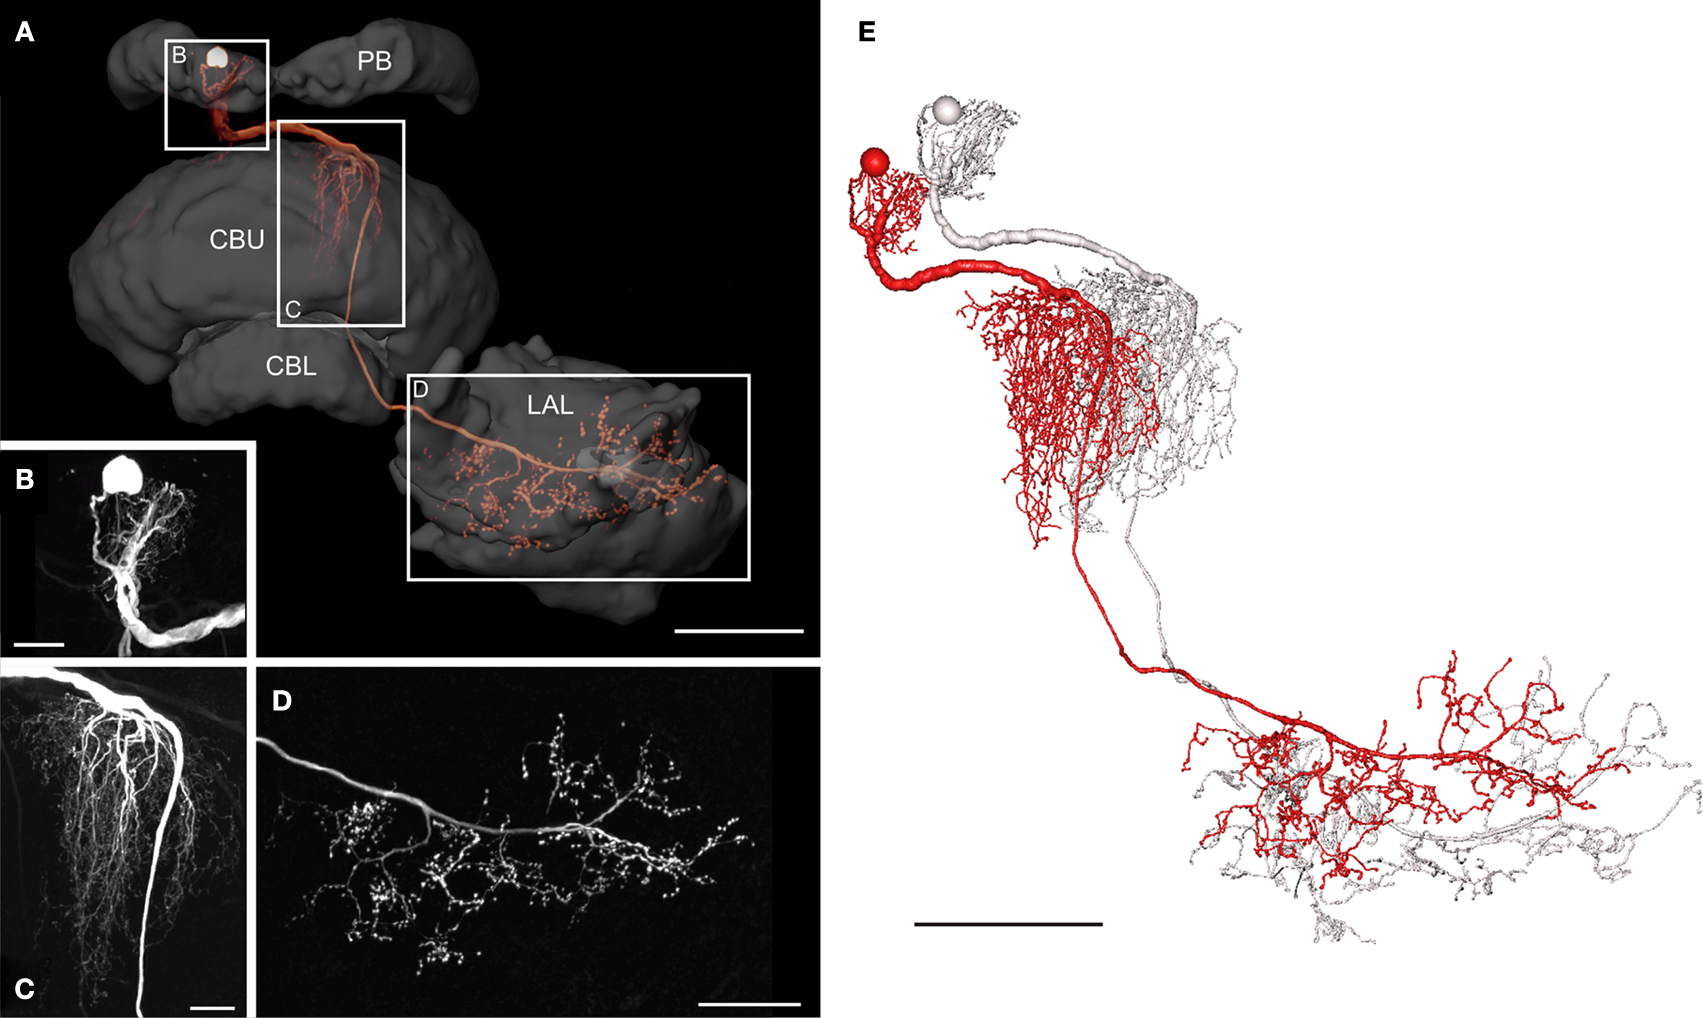
Figure 5. Morphology of a CPU1a neuron. (A) Anterior view of a 3D volume rendering visualization of the CPU1a neuron and reconstruction of several neuropils of the central complex and lateral accessory lobe. CBL, lower division of the central body; CBU, upper division of the central body; LAL, lateral accessory lobe; PB, protocerebral bridge. Boxes show areas enlarged in B–D. (B) Location of cell body and arborizations in column R7 of the PB; maximum intensity projection of a confocal image stack. (C) Maximum intensity projections of ramifications of the CPU1 cell in two columns of the CBU, viewed from anteriorly. (D) Maximum intensity projection of optical slices of the arborizations in the ventral shell of the left LAL shown in anterior view. (E) 3D reconstruction of the CPU1a neuron before (red) and after affine and elastic registration (grey). Scale bars: (A,E) 100 μm; (B,C) 20 μm; (D) 50 μm.
The distribution of smooth and beaded terminal fiber specializations suggests that the CPU1a neuron receives synaptic input from column R7 of the PB and from two columns of the CBU and sends this information to the VS of the LAL. In the PB the CPU1a neuron most likely receives polarization information (Heinze and Homberg, 2007
). In addition to polarization vision input, CPU1a neurons likely receive input from unknown sources in the CBU. To determine candidate neurons to provide this input, we reconstructed the GFS neuron, a tangential neuron with ramifications in the CBU.
Giant Fan-Shaped Neuron
The GFS neuron (Williams, 1972
; Homberg, 1994
) is a tangential neuron of the central body. Tangential neurons connect various brain regions to the PB or to particular layers of the CB. The soma of the GFS neuron lies posterior to the LAL in the ventro-median protocerebrum (Figure 6
A). The main neurite runs dorsally through the ventro-median protocerebrum and enters the ipsilateral LAL through the posterior surface of the VS. In the LAL the GFS neuron has smooth ramifications, especially in the dorsal shell and less prominently in the VS (Figure 6
C), but not in the LT and MO. Additional dendritic processes extend around the medial lobe of the mushroom body toward anterior regions of the brain and arborize with fine terminals in the ipsilateral anteromedian protocerebrum (Figures 6
D and 7
A). Finally, a few dendritic processes extend to lateral aspects of the anterior lip (Figure 7
A). The main neurite runs through the LAL dorsally from the isthmus tract toward the CB. Laterally from the CBL, it bends posteriorly and enters the posterior groove. Here the main neurite gives rise to eight major side branches. They enter eight pairs of columns of the CBU and ramify into highly varicose fiber processes, concentrated in layer II (Figure 6
B). The 3D reconstructions of the GFS neuron before (blue) and after registration (grey) are shown in Figure 6
E.
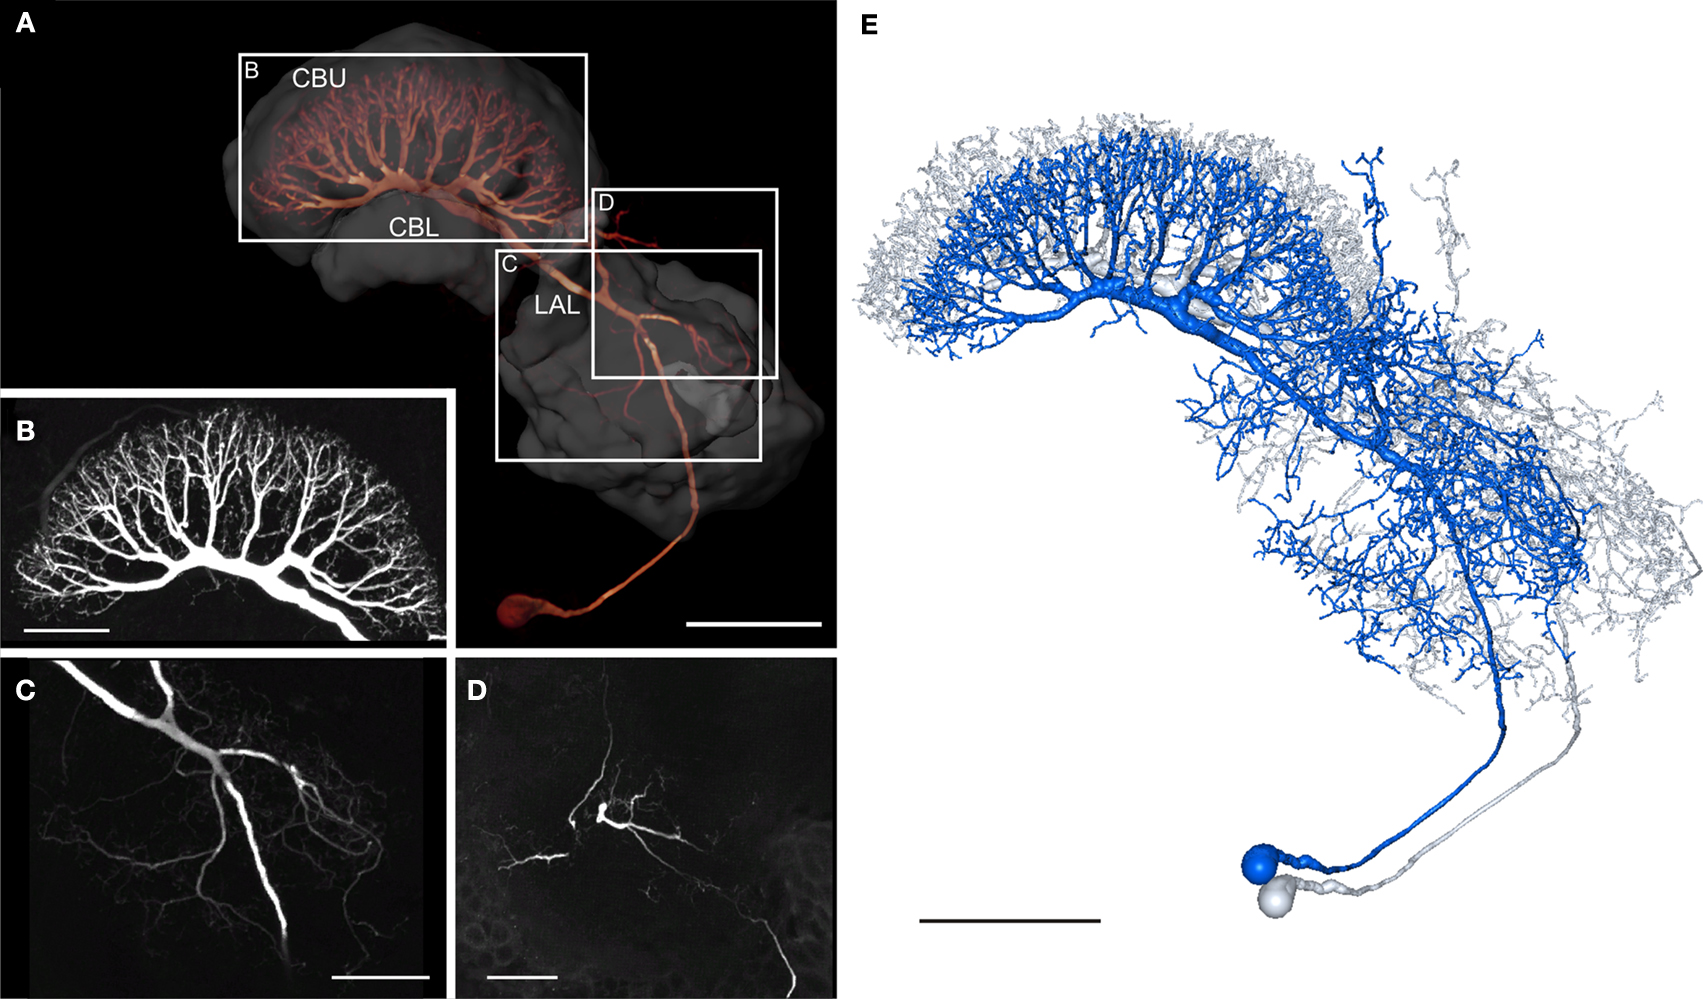
Figure 6. Morphology of the giant fan-shaped (GFS) neuron. (A) Anterior view of the GFS neuron by direct volume rendering. Reconstructions of central-complex neuropils and the lateral accessory lobe are shown transparently. CBL, lower division of the central body; CBU, upper division of the central body; LAL, lateral accessory lobe. Boxes show areas enlarged in B–D. (B) Maximum intensity projection of the arborization tree in the CBU, anterior view. (C) Maximum intensity projection of a confocal image stack from anterior showing ramification in the left LAL. (D) Maximum intensity projections of optical slices showing arborizations in the anterior median protocerebrum, anterior view. (E) 3D reconstruction of the GFS neuron before (blue) and after registration (grey). Scale bars: (A,E) 100 μm; (B–D) 50 μm.
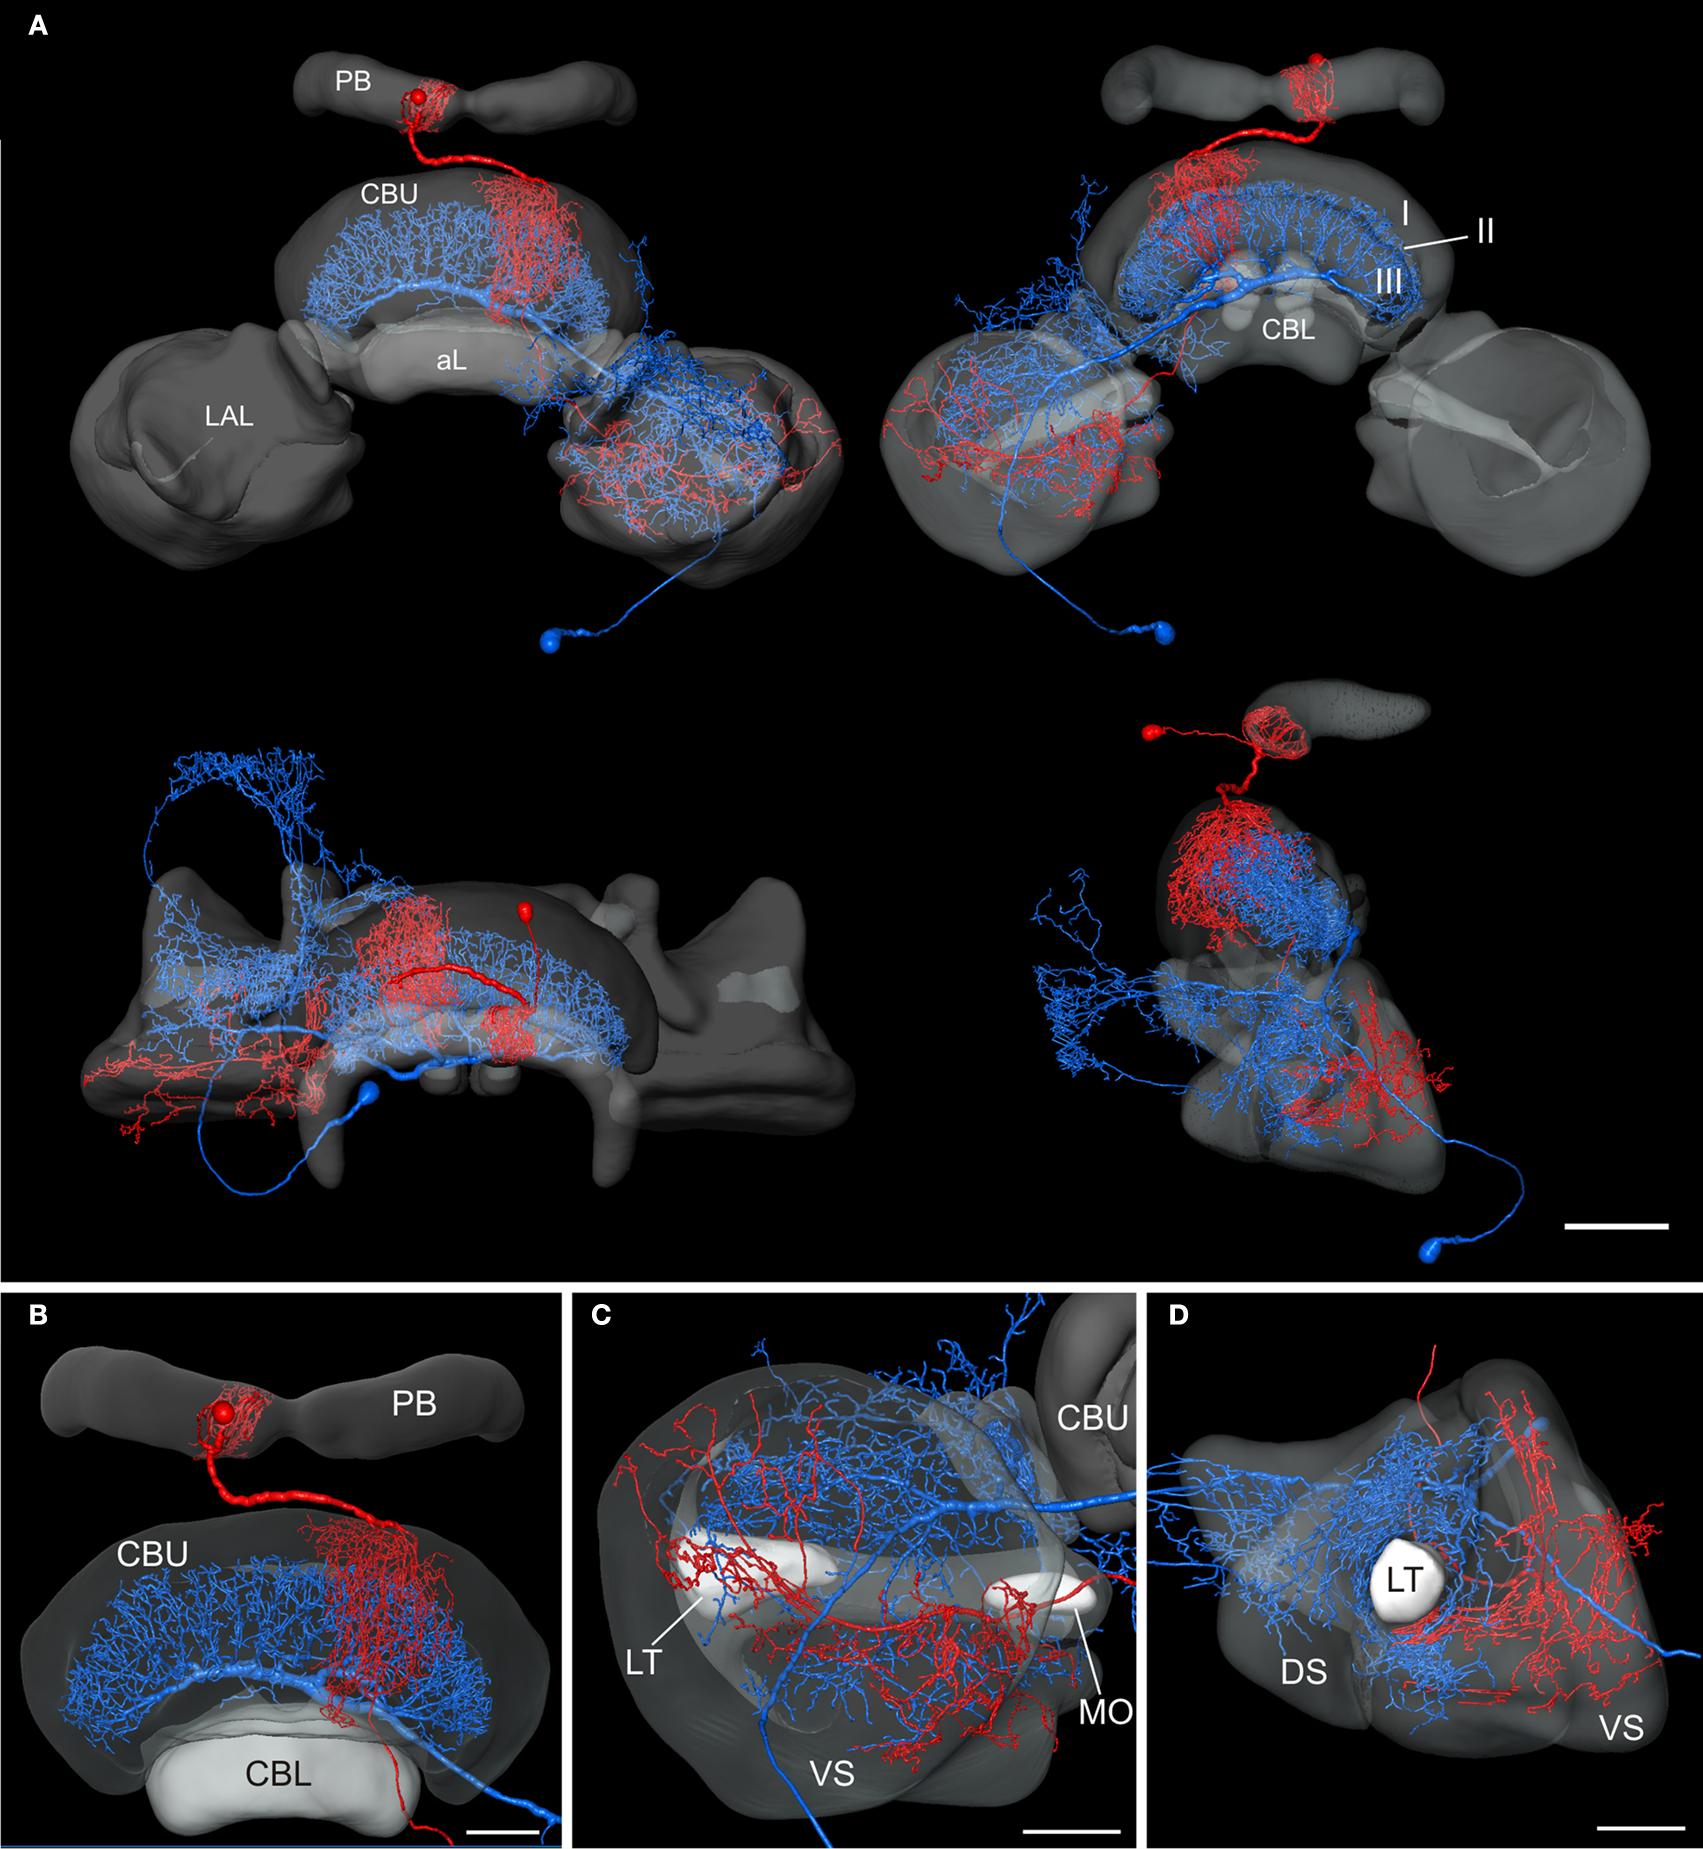
Figure 7. Registration of the CPU1a (red) and GFS (blue) neurons into the 3D standard central complex. (A) Anterior view (top left), posterior view (top right), dorsal view (bottom left) and lateral view (bottom right). (B) Anterior view showing arborizations in the upper division of the central body (CBU) and in the protocerebral bridge (PB). (C) Posterior view of the standardized right lateral accessory lobe with processes of the CPU1a and GFS neurons. (D) Ventrolateral view of the lateral accessory lobe. I, II, III, layers I–III of the upper division of the central body; aL, anterior lip; CBL, lower division of the central body; DS, dorsal shell; LAL, lateral accessory lobe; LT, lateral triangle; MO, median olive; VS, ventral shell. Scale bars: (A) 100 μm; (B–D) 50 μm.
Neurons in the Standard Central Complex
To analyze whether the tangential GFS neuron is a candidate to provide synaptic input to the columnar CPU1a cell, we registered both cells into the standardized central complex (Figure 7
). For an exact fit of the two neurons into the virtual central-complex atlas, corresponding brain areas of the individual brains were reconstructed (Figures 5
A and 6
A) and were registered into the standard central complex. For registration of the neuropils we used an affine registration followed by a non-rigid elastic registration. The transformation and deformation parameters were then applied to the reconstructed neurons to visualize both neurons in the standard central complex (Figure 7
A). The ramifications in column R7 of the PB of the registered CPU1a neuron indicate high accuracy of the registration process (Figure 8
C, arrow). The CPU1a neuron shows arborizations only in the VS of the LAL of the standard central complex, as is observed in the original brain. The GFS cell, in contrast, innervates the ventral and dorsal shells of the LAL, however, with the majority of ramifications in the dorsal shell (Figure 7
C), again as observed in the original brain. As in the individual brains, both registered neurons do not enter the LT and the MO (Figures 7
C,D). To investigate whether the output region of the GFS neuron and the input region of the CPU1a cell co-localize, we analyzed the CBU ramifications in detail. The CPU1a cell shows ramifications in layer I of the CBU (Figure 7
B) and fewer arborizations in layers II and III of the CBU (Figure 8
D). Neurites of the GFS neuron, in contrast, do not enter layer I, but show highest concentration of arborizations in layer II of the CBU (Figure 8
D). Although the CPU1a cell shows fewer arborizations in layer II, processes of both neurons clearly overlap in layer II of the CBU (Figures 7
A and 8
D). This co-localization of input processes of the CPU1a cell and output areas of the GFS neuron shows that the GFS neuron is a candidate to contribute to synaptic input to CPU1a neurons in layer II of the CBU.
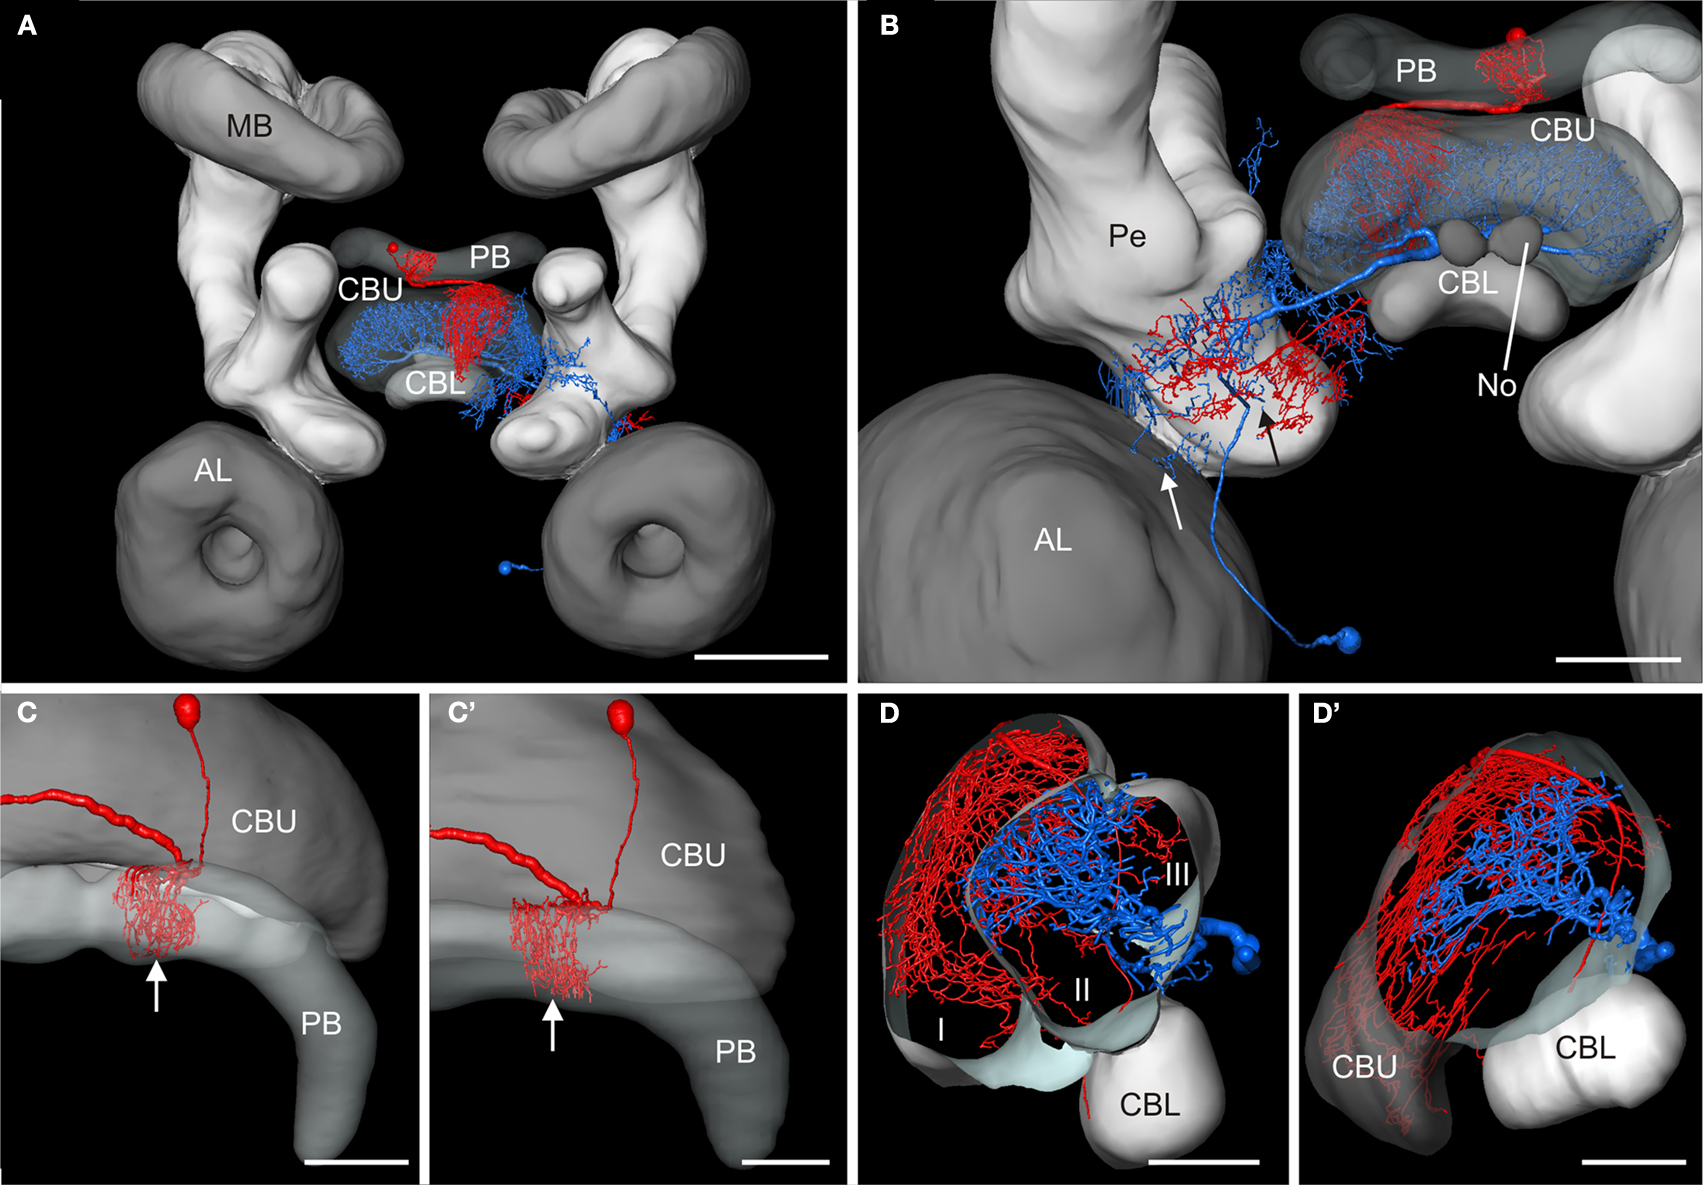
Figure 8. Registration of the CPU1a (red) and GFS (blue) neurons into the ISA standard brain and into the standard central complex. (A) Anterior view of the central brain of the standard brain showing the central complex, the mushroom bodies (MB) and the antennal lobes (AL). (B) Postero-lateral view of the central standard brain. Arrows indicate displacement of arborizations of the GFS neuron into the pedunculus (Pe) and antennal lobe. (C,C’) Dorsal view showing cell body and ramifications of the CPU1a neuron in column R7 (white arrows) of the protocerebral bridge (PB) registered into the standard central complex (C) and into the central complex neuropils of the standard brain (C’). (D,D’) Oblique sagittal sections through the central body of the standardized central complex (section thickness: 42 μm, D) and the standard brain (section thickness: 54 μm, D’) illustrating common projections of both neurons in layer II of the upper division of the central body. I, II, III, layers I–III of the upper division of the central body; CBL, CBU lower, resp. upper division of the central body; No, nodulus. Scale bars: (A) 200 μm; (B) 100 μm; (C–D’) 50 μm.
Comparison of VIB and ISA Standards
Kurylas et al. (2008)
have generated two whole standard brains of the desert locust, one following the VIB protocol (Jenett et al., 2006
) and the second using the ISA method (Rohlfing et al., 2001
). Both standardization methods were performed with the same set of ten brain preparations. For future applications it was particularly interesting to analyze advantages and limitations of both methods. Standard brains also exist for the fruit fly (Rein et al., 2002
), the moths Manduca sexta (el Jundi et al., 2009
) and Heliothis virescens (Kvello et al., 2009
), and the honeybee (Brandt et al., 2005
). Whereas the Drosophila and Manduca standards were generated using the VIB method, the honeybee and Heliothis standard brains are based on the ISA method. The standard brains of D. melanogaster and of M. sexta were primarily developed to compare volumes of brain neuropils. Accordingly, standard volumes were calculated and compared between the sexes (Rein et al., 2002
; el Jundi et al., 2009
). An additional motivation for the Drosophila standard brain was the prospect to quantitatively compare volumes of brain areas between wildtype and genetically manipulated flies. The honeybee and Heliothis standard brains were instead created to register neurons from different preparations into a common anatomical framework (Brandt et al., 2005
; Kvello et al., 2009
).
A comparison of the two locust standard brains showed that the VIB method creates an ideal standard brain for inter- and intraspecific volume comparisons, because it keeps neuropil volumes unchanged. This is not surprising, because the calculation of the standard or mean volumes does not depend on the process of registration. Instead, the VIB protocol calculates mean volumes of all segmented neuropils based on the labelfields before the brains are registered. The most meaningful result of the VIB protocol is the image stack of all registered segmented neuropils, as shown in Jenett et al. (2006
, Figure 4
), Kurylas et al. (2008
, Figures 5
D–F) and el Jundi et al. (2009
, Figures 4
D,F). The 3D surface view of the standard brain is a threshold representation of this registered image stack.
The ISA method, in contrast, generated the more exact visual standard atlas regarding positions and shapes of the neuropils and bilateral symmetry of the brain (Kurylas et al., 2008
). The ISA script registers the brains based on intensity image stacks (here, CLSM). After registration, deformation parameters are applied to the corresponding label fields to create a 3D model of standard brain structures. In contrast to the VIB method, which is easy to use through a step-by-step script in Amira, the ISA standard brain has to be calculated outside Amira, currently via a shell script. Both methods require choosing an individual brain as a template for the registration procedure. Whereas in the visual standard brain of the VIB method the positions of the neuropils are highly dependent on this template brain, the spatial relationships of neuropil positions in the ISA standard are largely independent from this template but their orientations may be affected (el Jundi et al., 2009
). During the initial, affine registration stage of the ISA method, the brains are also scaled depending on the template brain (Rohlfing et al., 2004
; el Jundi et al., 2009
) to minimize anatomical differences (Kuß et al., 2007
; Kurylas et al., 2008
). To minimize these possible sources of bias, Kurylas et al. (2008)
calculated for all brains the relative distances of neuropils to the brain center and chose the brain with the lowest deviations from the mean distances as the template brain.
The Standard Central Complex
In this work, we have generated a standardized central complex of the desert locust brain based on 20 individual central complexes. The central complex is involved in the control of locomotion and flight and plays an important role in spatial orientation in response to polarized light. In locusts it is the final processing stage in the polarization vision pathway (Heinze and Homberg, 2007
) and is probably the main integration site of polarization information from both eyes (Heinze et al., 2009
). The central complex is innervated by a large variety of neuronal cell types (Heinze and Homberg, 2008
, 2009
), whose roles in information processing and integration are largely unknown. To generate an anatomical platform for analysis of central-complex neurons from different brains, we used the ISA method based on Kurylas et al. (2008) and, for the first time, implemented this technique for the registration of only one brain area. This required masking of the regions surrounding the central complex in the CLSM image stacks. To hide the surrounding brain regions of the stacks we used the corresponding label fields with the module Arithmetic, after we enlarged the label fields by about 15 voxels in all directions and removed irrelevant regions.
A limitation of the locust standard brain of Kurylas et al. (2008)
is the relative low resolution of images (5.9 × 5.9 × 3 μm). Thereby, it was unfeasible to increase the number of reconstructed neuropils in the central brain. As a result, the subdivisions of the LALs, the anterior lip, and the layers of the CBU and noduli were not included into the standard whole brain. However, most of these structures are crucially involved in polarized-light signaling and are, thus, innerved by POL neurons (LAL: Vitzthum et al., 2002
; Pfeiffer et al., 2005
; CBU: Heinze and Homberg, 2007
, 2009
; No: Heinze and Homberg, 2009
). Especially the LALs are an important processing stage for polarized-light signals. They receive polarized-light input from the AOTu (Homberg, 2004
) and send this information to the central complex (Vitzthum et al., 2002
). In addition, they receive polarized-light information from the central complex and transfer it to descending pathways (Homberg, 1994
; Heinze and Homberg, 2009
).
The absence of these neuropils in the standard whole brain resulted in substantial imprecision during transformation of the two neurons (Figure 8
). As a result of the absence of the LAL in the standard whole brain, ramifications of the GFS neuron in the DS and VS were displaced into the Pe and the antennal lobe (Figure 8
B, arrows). In contrast, the arborizations of the CPU1a- and GFS neurons in the central-complex neuropils of the standard whole brain show that it is an adequate atlas for neurons that ramify in reconstructed brain areas (Figures 8
C’,D’). Nevertheless, the additional information provided by the additionally reconstructed neuropils and layers is indispensable for precise fitting of neurons into these compartments.
For future studies it will be important to incorporate the ISA standard central complex into the ISA whole-brain standard. To do this, we have to face the potential problem that the registration of the central complex atlas is based on brain sections, whereas the construction of the whole-brain standard was performed through a whole-mount protocol (Kurylas et al., 2008
). Compared to whole-mount preparations, which show already noticeable tissue shrinkage (Bucher et al., 2000
; Ott, 2008
), morphological distortions may be even larger in brain sections. Comparisons of mean volumes showed that the CBL and PB are significantly smaller in the standard central complex than in the standard brain, whereas the slightly smaller sizes of the CBU and No are not significant. Interestingly, these differences between mean volumes are not reflected when comparing the volumes of the ISA standards (Figure 4
A). Both, the ISA volumes and the overall dimensions of the central-complex neuropils are similar in the standard brain and the standard central complex (Figures 4
A,B). Taken together, the similar ISA volumes and sizes are a promising basis for our next goal to register the standardized central complex into the standard brain.
A similar potential problem arises when transforming neurons into the standard central complex. For detailed neuronal reconstructions, an adequate resolution of the CLSM image stacks is necessary. Owing to the limited working distance of the 20× and 40× objectives, the individual neurons of the central complexes were imaged from 130–140-μm brain sections. These sections may differ in shrinkage artifacts from the 250-μm brain sections used for the standardized central complex. For registration of the neurons into the standard central complex it was, therefore, necessary to transform, scale, and deform the cells in a fitting process. To do this, defined neuropils of the individual central complexes were registered into the standardized central complex, and the same transformation parameters of the registrations were then applied to the neurons.
The Polarization Vision Network in the Central Complex
The central complex comprises a group of highly modular midline neuropils in the insect brain. The topographic representation of zenithal E-vector tunings in the columns of the PB of the locust strongly suggests that coding of solar azimuth is a major aspect of the functional role of the central complex (Heinze and Homberg, 2009
; Heinze et al., 2009
). Based on anatomical and physiological data, a flow of information processing in the polarization vision network of the central complex has been suggested (Heinze and Homberg, 2008
, 2009
; Heinze et al., 2009
). Tangential neurons TL2 and TL3 represent the input neurons of the polarization vision network in the central complex. They receive their inputs in the LT and MO of the LAL and send axonal projections to the CBL (Vitzthum et al., 2002
). Columnar CL1 neurons connect the CBL to the PB and, together with tangential TB neurons of the PB, are most likely involved in generating the compass-like representation of E-vectors in the PB (Heinze and Homberg, 2007
). Processed polarization information is, finally, transferred via CPU1 and CPU2 cells to the LALs and is then transmitted indirectly to descending neurons.
CPU1 and GFS Neurons
In addition to polarized light, a brain area involved in spatial orientation and memory has to integrate a variety of other inputs, including landmark information, motivational input, and feedback from ongoing motor activity (Heinze et al., 2009
). This may lead to suppression of output if motivation for spatially-oriented behavior is low or to a context-dependent ratio of activation of motor centers in the right and left hemispheres of the nervous system for a spatial motor task. Because of their morphology, polarity, and hierarchy in the polarization vision system, the CPU1- and the conditionally POL CPU2 cells (Heinze and Homberg, 2009
) are ideal candidates to receive modulatory input, in addition to solar azimuth coding. CPU1/2 cells most likely receive their polarized-light input in the PB (Heinze and Homberg, 2009
; Heinze et al., 2009
), but have a second, even larger dendritic input region in the CBU. Two principal subclasses of CPU neurons have axonal projections to one (CPU1) or to both (CPU2) LALs (Heinze and Homberg, 2008
). Three subtypes of CPU1 cells are distinguished based on ramifications in the ipsilateral (CPU1a,c) or contralateral (CPU1b) hemisphere of the PB (Heinze and Homberg, 2008
). Whereas in all CPU1 neurons the ramifications in the PB are limited to single columns, the arborizations in the CBU either extend over several columns (CPU1b), are confined to two to three columns (CPU1a), or occur in a single column (CPU1c). Thus, the ratio between the polarization and non-polarization inputs may be defined through anatomical broadening in the CBU. In contrast, ramifications of all CPU1 and CPU2 cells invade layers I–III of the CBU but decline in density from layer I to III.
Co-registration suggests that the GFS neuron is a promising candidate to provide input to CPU1a neurons and perhaps to all types of CPU1/2 neurons. Spiking activity in CPU1a cells is modulated by the E-vector of polarized light (Vitzthum et al., 2002
). CPU1 cells receive polarized-light input from both eyes and have zenith-centered receptive fields extending over 120° (Heinze et al., 2009
). The GFS neuron, by contrast, is not sensitive to polarized light (Heinze, 2009
), but is weakly inhibited by frontally presented unpolarized light (Homberg, 1994
). The GFS neuron responds more strongly to movement stimulation in the ipsilateral field of view, is phasically excited by frontal wind stimulation, and shows strong activity bursts associated with tethered flight (Homberg, 1994
; Müller, 1997
; Heinze, 2009
). Interestingly, CPU1a cells also respond to frontal light with an inhibition of spiking (Vitzthum et al., 2002
). Taken together, these data support the hypothesis that the GFS neuron transfers non-polarized visual input and perhaps flight-associated excitation to the CPU1/2 cells.
In addition to the GFS neuron, a variety of other tangential neurons of the CBU, such as TU1 and TU2 cells (Homberg et al., 1999
), are possible candidates to provide synaptic input to CPU cells. Registering further neurons into the standard central complex will allow us to explore the neuronal connectivities in the central-complex network with increasing depth and complexity, and to formulate hypotheses on neural pathways and novel physiological properties of particular cell types that can then be tested in subsequent recordings. Our current achievements of a common platform for the whole brain and, with higher resolution, for the central complex provide an ideal basis for this enterprise.
The authors declare that the research was conducted in the absence of any commercial or financial relationships that could be construed as a potential conflict of interest.
We are grateful to Dr. Thomas Gebhardt for providing the Linux cluster and help in Linux, and to Erich Buchner for providing the anti-synapsin antibody. We thank Ulrike Träger for helpful suggestions on the manuscript and Karl Heinz Herklotz for maintaining the locust cultures. This work was supported by DFG grants HO 950/14 and HO 950/16 to Uwe Homberg. Torsten Rohlfing was supported by NIAAA under grant AA013521-INIA and NIBIB under Grant EB008381. Registration tools and scripts for Iterative Shape Averaging are available in source code as part of the Computational Morphometry Toolkit from http://www.nitrc.org/projects/cmtk/
.