Gut Microbiota and Lymphocyte Subsets in Canine Leishmaniasis
 Sara Meazzi1
  Stefania Lauzi1*
  Valeria Martini1
  Riccardo Ferriani2
  Margherita Peri1
  Sergio Aurelio Zanzani1
  Alessia Giordano1
- 1Department of Veterinary Medicine and Animal Sciences, University of Milan, Lodi, Italy
- 2Ospedale Veterinario San Francesco, Milan, Italy
Gut microbiota seems to interact with immune system. Canine leishmaniasis pathogenesis and severity of disease lean on the host immunity, but there is no information in literature about gut microbiota in infected animals. Thus, this study aims to compare the microbiota composition and leukocyte subset of healthy dogs with those of asymptomatic dogs exposed to Leishmania spp. and dogs with clinical leishmaniasis. Thirty-nine dogs were enrolled and grouped into three groups: healthy, exposed asymptomatic and infected symptomatic for Leishmania spp. Flow cytometry on whole blood evaluated the prevalence of CD4, CD5, CD8, CD11b, CD14, and CD21 positive cells. Gut microbiota was investigated using a next generation sequencing (NGS) technique. Firmicutes resulted significantly more abundant in the healthy dogs compared with the other two groups. Conversely, Proteobacteria were more abundant in symptomatic dogs. Even in rarest phyla comparison some significant differences were found, as well as in comparison at classes, order, family and genus levels. The symptomatic group had lower concentration of all the lymphocyte classes (CD5, CD21, CD4, CD8) compared to the other groups. A lower abundance of Firmicutes is reported in literature in diseased animals compared to the healthy ones and this is in agreement with the results of this study. Increased Proteobacteria in sick animals could suggest a dysbiosis status, even without distinct gastrointestinal signs. The leukocyte classes results indicate a decreased Th1 response in symptomatic dogs. Studies also investigating the cytokine response could deepen the knowledge on the pathogenesis of canine leishmaniasis.
Introduction
The gut microbiota is the ensemble of all the bacteria that live into the digestive tract (GI) (1). It plays different roles in the host homeostasis, contributing to food degradation and energy harvest. Moreover, some bacteria can produce metabolites needed for nutrition of the enterocytes. Finally, it acts as a physical obstacle against pathogens, and it interacts with the immunity (2). Furthermore, gut microbiota may also influence gastrointestinal tract defenses at different levels both helping the mucous layer formation (3) and inducing the generation of regulatory T cells (Treg), needed for the symbiotic relationship between bacteria and host (4). The association between the host immunity and the gut microbiota appears to be extended also to organs other than the intestine (4). The microbiota has a crucial role in the secondary lymphoid tissues development, as well as in CD4+ and CD8+ T lymphocytes, Treg, T helper 17 (Th17) cells and B lymphocytes differentiation and activity (5). The impaired immune response observed in animal models with manipulated microbiota, highlights the importance of the gut microbiota for the host. In germ-free mice, the absence of commensal bacteria has been associated to a reduced development not only of gut-associated lymphoid tissues (GALT), but also systemic ones. Furthermore, a decrease in circulating T and B lymphocytes together with a of Th1/Th2 imbalance was observed in the germ-free mice (6–8). Gut microbiota assessment could be performed on different type of specimens. Even though results obtained on stool samples are mostly representative of the distal gut, this kind of samples could be very easily obtained. In the evaluation of microbiota composition, factors such as antibiotic treatments, diet, and other environmental factors should be taken in account both in people and animals (4, 9–12). Several veterinary medicine studies evaluate the gut microbiota differences during dysbiosis (caused by different conditions) (13, 14). Specifically, microbiota composition imbalances may occur during inflammatory or infectious diseases (15). Leishmania spp. transmitted by a phlebotomine sand fly vector is the cause of a severe systemic condition namely canine leishmaniasis (16, 17). Both the protozoan and the host immunity are responsible for the development of the clinical signs of disease (17): Leishmania spp. is generally deposited in the skin by the sand fly during the blood meal; here it may be destroyed by the host immune system (self-limited infection), or it may be confined in the skin or lymph nodes without any clinical sign (asymptomatic infection), or it may diffuse systemically causing either symptomatic or asymptomatic infection depending on the host immunity (18). During Leishmania infection, cell-mediated immunity is pivotal for a successful response (19) and different subsets of T lymphocytes may influence the host predisposition for the clinical form of the diseases (16). In literature, a decrease of CD4+ Th lymphocytes and of CD8+ T cells in peripheral blood (20–22) has been reported in susceptible dogs. For several years, Th1 (cell mediated) was considered to be protective against the disease, contrarily Th2 (humoral response) was associated with (23) canine leishmaniasis predisposition. Nevertheless, it seems that infected dogs may mount both Th1 and Th2 responses, even if the Th1 is the predominant phenotype in resistant dogs (18). Given the pivotal role of immune response in the pathogenesis of canine leishmaniasis, the aims of this work were to evaluate the gut microbiota variations and the different leukocyte classes in canine peripheral blood of animals with clinical signs of leishmaniasis compared to dogs exposed to Leishmania spp. but asymptomatic and to healthy control unexposed dogs.
Materials and Methods
Dogs/Caseload
All the 39 dogs enrolled in this prospective study were referred to the Veterinary Teaching Hospital of The University of Milan or to the private veterinary clinic Ospedale S. Francesco of Milan (Italy) for routine wellness visit or diagnostic purpose and each owner signed an informed consent for the diagnostic sampling performed during those visits. Therefore, according to the Ethical Committee decision of the University of Milan, residual aliquots of samples or tissues collected during routine visit, can be employed for research purposes without any supplementary authorization (EC decision 29 Oct 2012, renewed with the protocol no. 02-2016). Dogs were considered eligible for inclusion when they met the following inclusion criteria: (1) no antibiotic or probiotic treatment for at least 3 months prior to inclusion, (2) no gastroenteric clinical signs for at least 2 weeks prior to inclusion, (3) negative result of the microscopic fecal examination for helminths and the detection of coproantigen of Giardia duodenalis by ELISA, (4) negative serological result using the SNAP® 4Dx® test (IDEXX) detecting Dirofilaria immitis antigen and antibodies against Anaplasma phagocytophilium, Anaplasma platys, Borrelia burgdoferi, Erlichia canis and Erlichia ewingii (5) fed on commercial food (6) no previous vaccination against Leishmania spp. Once enrolled, based on both screening analyses (that includes qPCR and IFAT for Leishmania spp.) and history, the dogs were further classified into three groups: healthy (H); Leishmania spp. exposed but asymptomatic (E_A); infected with Leishmania spp. and with the presence of clinical signs consistent with canine leishmaniasis (S) according to Canine Leishmaniasis Working Group guidelines (17). Specifically, in the H group dogs have no clinical signs or laboratory abnormalities and negative results for both IFAT (immunofluorescence antibody test) and qPCR for Leishmania on whole blood. All the dogs belonging to this group lived in a non-endemic area. E_A group included dogs with an absence of clinical signs nor clinicopathological abnormalities that suggest the presence of leishmaniasis or other diseases, but with weakly positive IFAT result (≤ 1:80) and negative Leishmania qPCR on blood samples. The history of these dogs always included origin and living in an endemic area and a past history of strong positive IFAT result for Leishmania antibodies or previous clinical manifestation of canine leishmaniasis. Finally, the S group was composed by sick dogs that presented with clinical manifestation of leishmaniasis together with clinicopathological alterations, positive IFAT result and the presence of the parasite (identified by PCR on blood or lymph-node and/or bone marrow cytology).
Sample Collection
At admission, for each dog 2 mL of whole blood were collected and subsequently divided into an EDTA tube and a plain tube (Venoject, Terumo Italia Srl, Rome, Italy). On EDTA samples, a complete blood cell count (CBC) was performed within 12–18 h, 200 μL were frozen at −20° for qPCR analyses and 0.5 mL were used for flow cytometric analyses. The serum tube was centrifuged at 2,500 × g for 5 min for serum harvesting. From each dog, at least 15 g of fresh feces were collected in one sampling and split into two aliquots: a fresh one for microscopic fecal evaluation and the detection of coproantigen of Giardia duodenalis by ELISA and another aliquot for the microbiota evaluation was immediately frozen at −20°. A sample of urine from each dog was collected by spontaneous micturition (at least 5 mL) and centrifuged at 1,250 × g for 5 min for supernatant harvesting and proteinuria evaluation.
Screening Analyses
Screening analyses were performed to group the enrolled dogs. On EDTA samples a CBC was evaluated through the automated hematology analyser Sysmex XT-2000iV (Sysmex corporation, Kobe, Japan) together with a microscopical examination of stained blood smears. On serum, a routine biochemistry panel (glucose, creatinine, urea, total protein, albumin, alanine aminotransferase and alkaline phosphatase) was executed with the automated spectrophotometer BT3500 (Biotecnica instruments S.p.a, Roma, Italia). Agarose gel serum protein electrophoresis, that is considered an accurate test to diagnose canine leishmaniasis, was achieved through the use of the semiautomated instrument Hydrasis (Sebia Italia S.r.l., Bagno a Ripoli, Florence, Italy). The typical electrophoretic pattern for canine leishmaniasis includes hypoalbuminemia and increase in α2 and γ globulin (sometimes there is also an increase in the β2 fraction, with the so-called β-γ bridge). The decrease in A:G is considered one of the most sensitive test for canine leishmaniasis (24). On urine supernatant, using the same instrument employed for serum biochemistry, the urinary protein to creatinine (UPC) ratio was assessed. The immunofluorescence antibody test (IFAT) was used to evaluate the antibody titer against Leishmania thanks to the MegaFLUO® Leish commercial kit (Diagnostik Megacor, Hörbranz, Austria). L. infantum DNA identification using real time PCR (qPCR) was assessed on EDTA samples following the instruction provided by the manufacturer of the commercial kit used (NucleoSpin® Blood, Macherey-Nagel, Germania). DNA pre-analytical quality control targeting vertebrate 12S rRNA locus was performed on randomly selected EDTA samples (results not shown) (25). The qPCR used as a target L. infantum kinetoplast minicircle DNA conserved regions and was performed according to published protocol (26), with minor modifications, using the instrument QuantStudio3 (Applied Biosystem). The parasite load measure was considered the number of threshold cycle (CT), with a lower number of CT indicate a higher burden of L. infantum. The positive control was represented by a canine sample that was previously tested for L. infantum and resulted positive, whereas for the negative control was used water.
Gut Microbiota Analyses
Microbial communities (Metabarcoding analyses) using sequencing of amplicon were investigated throughout the hypervariable genomic region (V3-V4 region 16SrRNA gene amplification), using an NGS approach on Illumina Platform. From 180 to 220 mg of each fecal sample the total amount of DNA was extracted following the instruction of the manufacturer and using the QIAamp DNA Stool Mini Kit (QIAGEN S.r.l., Milan, Italy). Using the Illumina 16srRNA protocol indexed NGS libraries were built. At first PCR was used to amplify template from a DNA sample using specific denatured primers targeting the 16S V3 and V4 region. One microliter of this product was evaluated for size (~550 bp) on a Bioanalyzer DNA 1000 chip (2100 Bioanalyzer with DNA 1000 Kit, Agilent, Santa Clara, CA, USA). Then, AMPure XP bead removed free primers and primers dimers (A63880I; Beckman Coulter Inc., Brea, CA, USA) allowing to complete a second PCR to attach dual index and Illumina sequencing adapters using the Nextera XT Index kit (Illumina, San Diego, CA, USA). Another cleaning step using AMPure XP bead was performed in order to prepare the final library for the quantification. The final library was diluted 1:50 and then on 1 μL was evaluated the sample size (~630 bp) using Bioanalyzer DNA 1000 chip already mentioned. The DNA concentration expressed in nM and based on the DNA amplicons size, was used to pool the obtained 60 libraries in equimolar concentration. Finally, the pooled library was sequenced using the Illumina Miseq technology in 2 × 300 bp run using 20% of PhiX library as control (27).
Flow Cytometry Analyses
Leukocyte populations of CD4+, CD8+, CD5+, CD14+, CD11b+, and CD21+ cells were assessed using the flow cytometer BryCyte E6 (Mindray, Schengen, China). The obtained results were analyzed using a dedicated software (MRFlow, Mindray, Schengen, China) (27). Each sample was run on three tubes and each tube contained exactly 500 × 103 cells (based on the formula 500/WBC applied on hematologic results). Twenty-five microliter of RPMI solution containing 0.2% fetal bovine serum (FBS) were added to decrease the non-specific antibodies binding. Then, 50 μL of the specific antibody dilution was added accordingly to the following scheme (see Table 1): tube 1 was used as negative control (no antibody); tube 2 contained antibody directed against CD5, CD8, and CD4; finally, tube 3 contained antibody directed against CD14, CD11b, and CD21. Each tube incubated at room temperature for at least 15 min. Then, an 8% ammonium chloride lysing solution was added to remove the erythrocytes and samples were washed through centrifugation (1,250 rpm for 8 min). The supernatant was thrown away and the pellet was resuspended in 500 μL of PBS and acquired by the flow cytometer. A first gate was set in a morphological scattergram (forward scatter, FSC-H, vs. side scatter, SSC-h) to keep out platelets and cellular fragments from the analyses. Subsequently, based on complexity and fluorescence, cell populations were analyzed. For each sample the percentage cell positive for CD5, CD8, CD4 (to evaluate the lymphocytes only the low complexity cells were included), CD14, CD11b, CD21 was registered. The neutrophils percentage was calculated through the following formula: %CD11b-%CD14. Finally, CD4+:CD8+ ratio was calculated. All the recorded percentages were then used, together with the leukocytes total number, to calculate the absolute number of each white blood cell class (27).
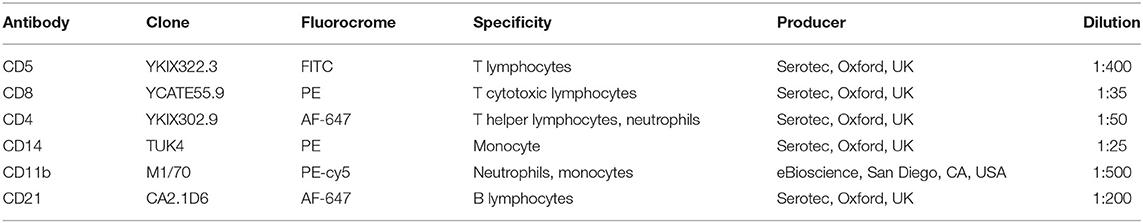
Table 1. List of the antibodies in use, their specificity and dilution.
Data Analyses
Microbiota analysis was based on de novo read counts that have been built using the addition of both the quality scores and sequence frequencies in a probabilistic noise model for nucleotide transitions. All the sequences were filtered and the chimerae removed. Then, the obtained data were compared to a standard database of bacteria, and they were labeled accordingly (28). The main step of the sequence analysis is the denoised and assembly of sequences into groups called Ribosomal Sequence Variants (RSVs) instead of the traditional Operational Taxonomic Units (OTUs). The workflow was based on software packages from the open-source Bioconductor project (28). At first the low-quality sequencing reads were removed and all the reads were trimmed to an adequate length. Afterward sequence variants were inferred and, following the steps already proposed by Callahan et al. (28), a sequence table (an analog, with a higher resolution, of the “OTU table”) was generated. All these phases were achieved through a DADA2 method that is based on a substitution error parameterized model that allow to distinguish possible sequencing errors from real biological variation (28). In order to correctly allocate the taxonomy, a naive Bayesian classifier method was used: it performed a comparison between sequence variants and a classified sequences training set (GreenGenes V13 gg_13_8_train_set_97). Alpha diversity was evaluated through Observed and Shannon metrics. Rarefaction Species curve was obtained using “rarecurve” function of Vegan Package (vegan: Community Ecology Package. R package version 2.5-4.). The alpha diversity differences among groups were assessed using a Kruskal–Wallis (followed, when significant results were obtained, by a post-hoc test) performed with Analyse-it Software for Microsoft excel. Beta diversity (that assess the between sample diversity) was evaluated using non-metric multidimensional scaling (NMDS) and principal coordinate decomposition (also known as classical scaling) of a distance matrix (PCOA) was used to graphically described the diversity between samples in a low-dimensional space based on Bray-Curtis dissimilarity matrix and Jaccard dissimilarity matrix. The phyloseq-format microbiome data was converted into a DESeqDataSet for Differential Abundance OTU call (29). Specifically, DESeq2 carried out for each OTU a hypothesis test to assess if results were considered enough to refuse the null hypothesis, namely that the difference observed was caused only by experimental variability. Differences in each leukocyte subset, both expressed as percentage or as absolute number, among the groups were evaluated using Kruskall-Wallis test (when statistical differences were observed, a post-hoc test was then performed) using Analyse-it Software for Microsoft Excel (Analyse-it Software Ltd, Leeds, United Kingdom). The presence of correlation between microbiota phylum and the absolute number of white blood cell classes was evaluated using the Spearmann's test. The r coefficient was interpreted according to Schober et al. (30). For all the statistical analyses, significance level was set at P < 0.05 (27).
Results
Dogs
Signalment of the 39 dogs enrolled in this study is summarized in Table 2. Based on clinical examination and screening analyses, dogs were divided into infected symptomatic (S, 12 dogs), exposed asymptomatic (E_A, 13 dogs) and healthy controls (H, 14 dogs). All the dogs belonging to S group presented with leishmaniasis clinical signs of disease, positive IFAT and a positive result for a direct test (qPCR or cytology) (Table 3). For dogs 11, 17 and 36 the amount of EDTA whole blood was not sufficient to perform the flow cytometric evaluation. Thus, Flow cytometry evaluation was finally performed on 36 dogs.
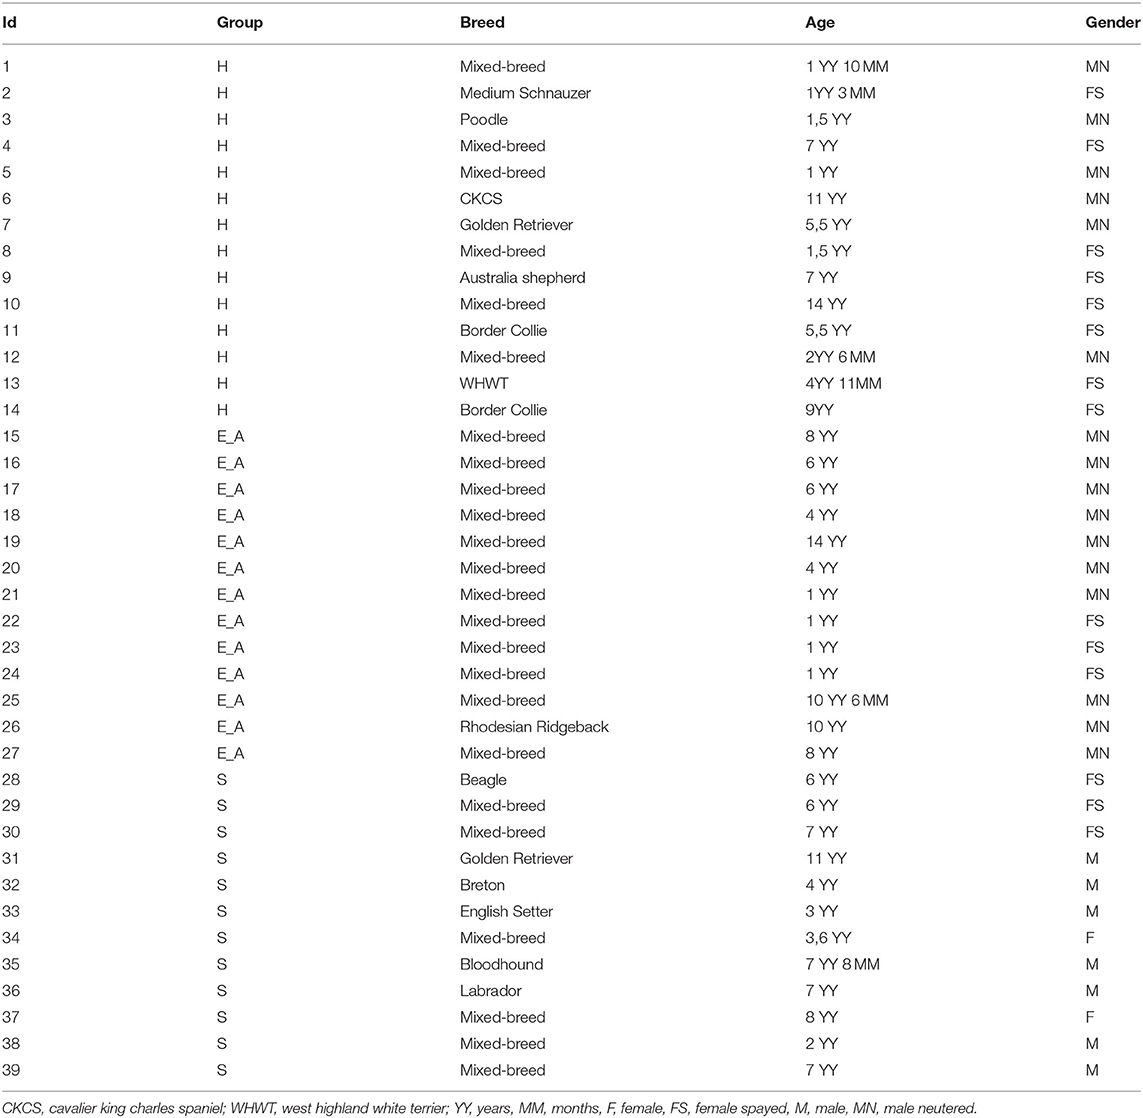
Table 2. Signalment and groups of the dogs enrolled in this study.
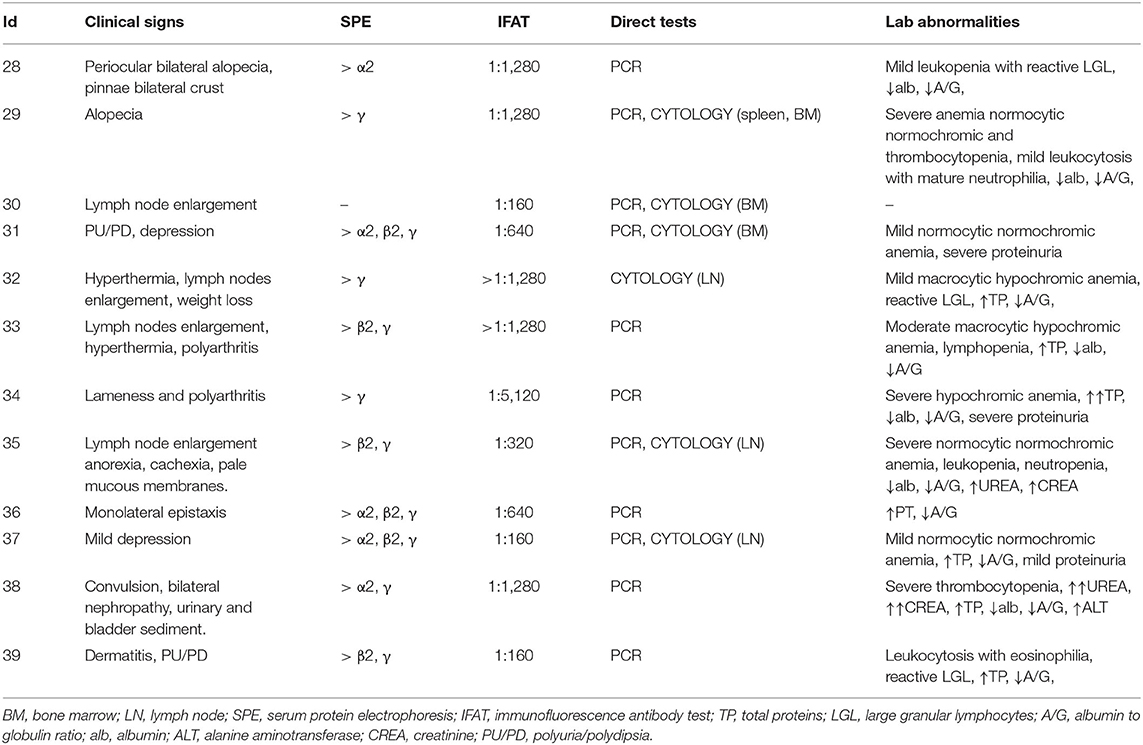
Table 3. Clinical signs and laboratory abnormalities of the dogs belonging to S group.
Microbiota Analysis
A total amount of 10,137,881 sequences, with a mean of 259,946 sequences/sample (median 273,190, range 69,776–273,190) were considered with an acceptable quality. The evaluation of alpha-diversity rarefaction curves confirmed the good quality of the entire caseload. Indeed, all the curves tended to grow very quickly and, in some cases, reached a plateau, consistent with a high richness of different bacterial species (Figure 1). Considering the beta-diversity (Figure 2), S group (blue dots), appeared to be grouped differently compared to the other groups (black and red dots that represent E_A and H, respectively) that seemed to be closer to each other. Firmicutes, Bacteroidetes, Proteobacteria, Actinobacteria and Cyanobacteria were the most represented phyla in the study population (Figure 3). According to the statistical analysis Firmicutes were more abundant in H group, than in E_A and S ones (P = 0.007 and =0.046, respectively). On the other hand, Proteobacteria was more represented in S than into H (P = 0.004). Significant differences were present even considering the rarest phyla: [Thermi] were less represented in E_A than into H group (P = 0.049), while Spirochaetes were less abundant in S than into H and E_A (P = 0.02 vs. H and =0.001 vs. E_A). Deferribacteres and Tenericutes were less represented in S than into the E_A group (P = 0.016 and =0.02, respectively). Class comparison showed that bacteria belonging to Firmicutes phylum such as Clostridia and Erysipelotrichi were more abundant in the H group, compared to the E_A (P = 0.03), and S group (P = 0.048). On the other hand, Gammaproteobacteria belonging to the Proteobacteria phylum was less abundant in H, compared to the other dogs (P = 0.043 in E_A and P =0.0003 in S). Significant differences were highlighted among groups even for rarest classes, Deinococci was less abundant in E_A compared to H dogs (P = 0.045), while [Brachyspirae], Deferribacteres and Mollicutes were more represented in E_A compared to S group (P = 0.007, =0.02 and =0.044, respectively) (Figure 4). Significant differences were observed even extending the analysis to order, family and genus (Tables 4, 5) (27).
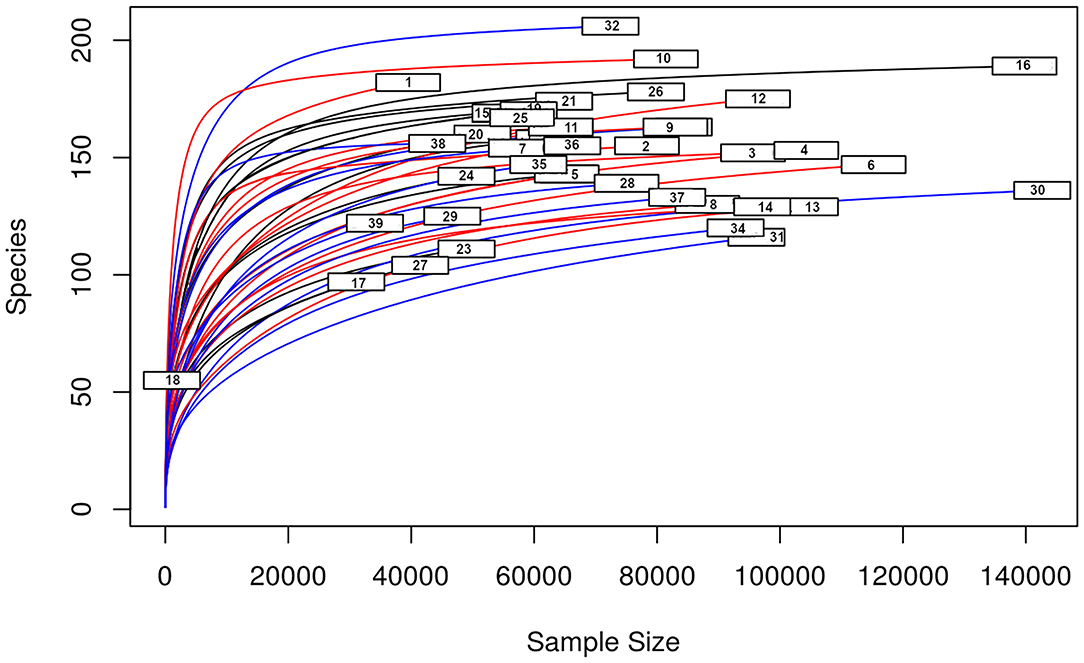
Figure 1. Alpha—diversity for the entire caseload. Each line represents one sample: in blue those belonging to S group, in red the H group, in black the E_A group. On the x-axis is reported the sequences number, the y-axis represented the number of different species.
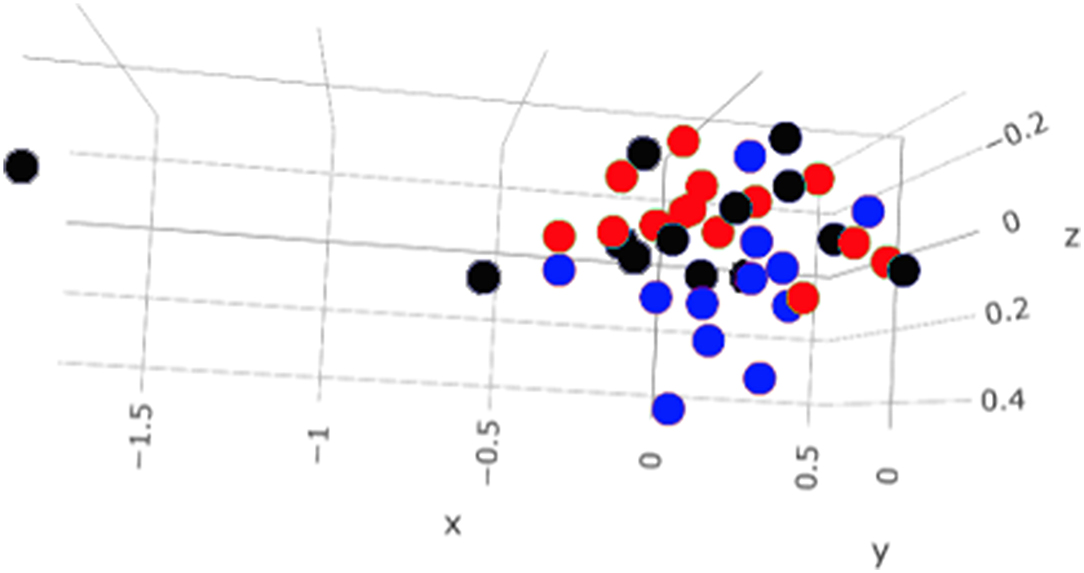
Figure 2. Beta—diversity of the entire caseload. Each dot represents one sample, in blue the symptomatic dogs (S), in red the healthy dogs (H) and in black the exposed asymptomatic (E_A). On each axis is reported the variance.
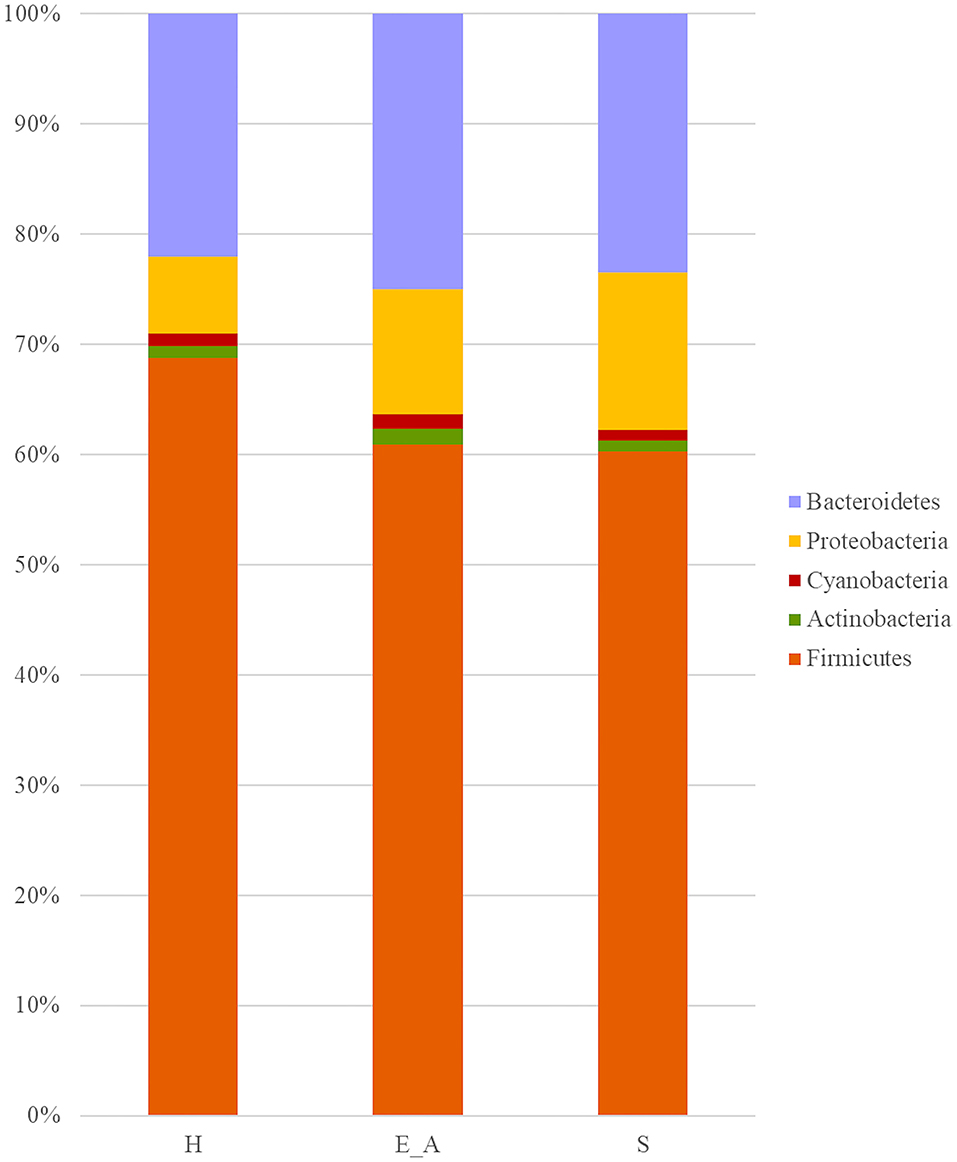
Figure 3. Bar plot representation of phylum relative abundance in the three groups. Only phylum with a relative abundance above 0.5% were reported in the graph.
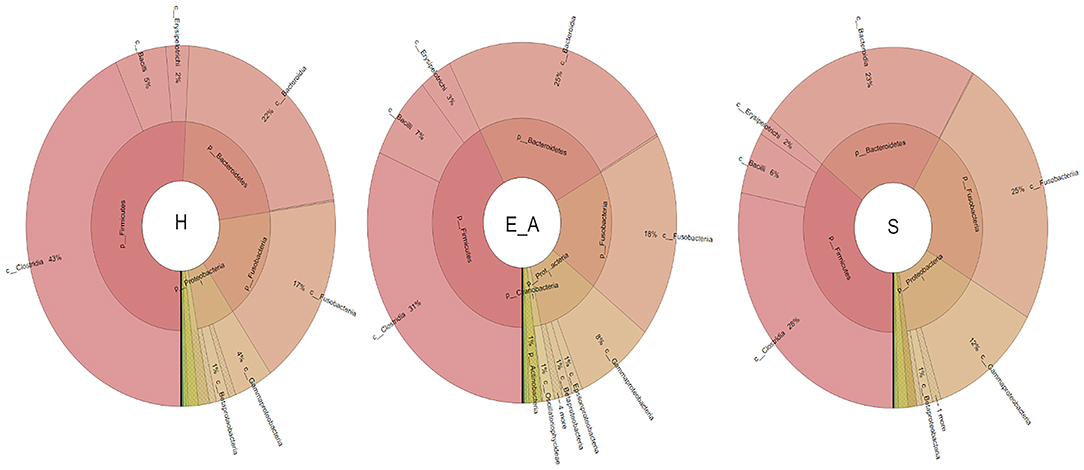
Figure 4. Microbiota composition of the three groups. Phyla and healthy classes of the bacteria sequenced in healthy (H), exposed asymptomatic (E_A) and symptomatic (S) dogs are represented through a Krona chart.
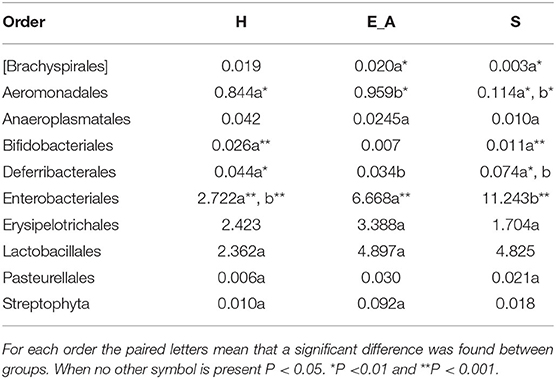
Table 4. Relative abundances of the orders that showed significant differences among the groups.
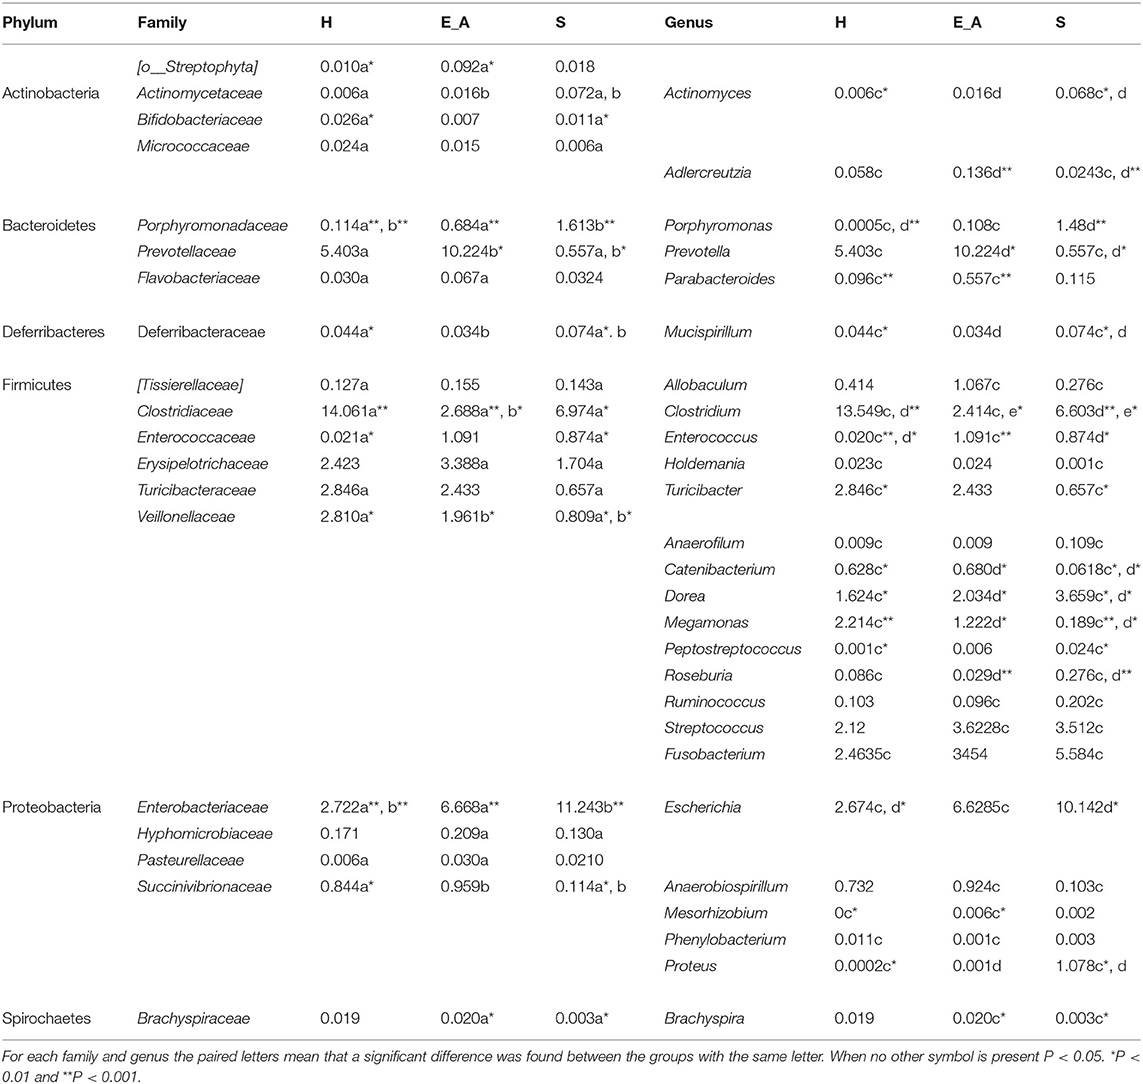
Table 5. Relative abundances of the families and genus that resulted significantly different among the three groups.
Comparison of Leukocyte Classes Among Groups
The CD14+ percentage and the CD4:CD8 ratio did not vary among groups (P = 0.56 and P =0.36, respectively). Conversely, significant differences were recorded for CD11b+ (P = 0.0026), neutrophils (P = 0.014), CD5+ (P = 0.0085), CD4+ (P = 0.032), CD8+ (P = 0.027) and CD21+ (P = 0.004) percentages among groups. Specifically, the percentage of CD11b and neutrophils was decreased in the H group compared to the E_A (P = 0.034 for both class of leukocytes) and to the S group (P = 0.001 for both class of leukocytes). The comparison between these latter two groups did not result in significant differences. The percentage of CD21+ and CD8+ cells was significantly decreased in the S group compared to E_A (P = 0.004 and 0.048, respectively) and H (P = 0.004 and = 0.012), while these two latter groups were not significantly different. The percentage of CD4+ and CD5+ was significantly decreased in the S group, only compared to the H group (P = 0.008 and P = 0.004, respectively), but not to the E_A one. The absolute number of CD14+, CD11b+ and neutrophils did not vary among groups (P = 0.72, P = 0.6, and P = 0.57, respectively). Conversely, CD5+ (P = 0.0097), CD4+ (P = 0.0047), CD8+ (P = 0.0106) and CD21+ (P = 0.0011) were significantly different. Specifically, all these lymphocyte classes were decreased in the S dogs compared to E_A (P = 0.012, 0.008, 0.012, and 0.003, respectively) and H (P = 0.008, 0.005, 0.007, and 0.0007, respectively). However, these latter groups were not significantly different for any of the lymphocyte classes (Figure 5).
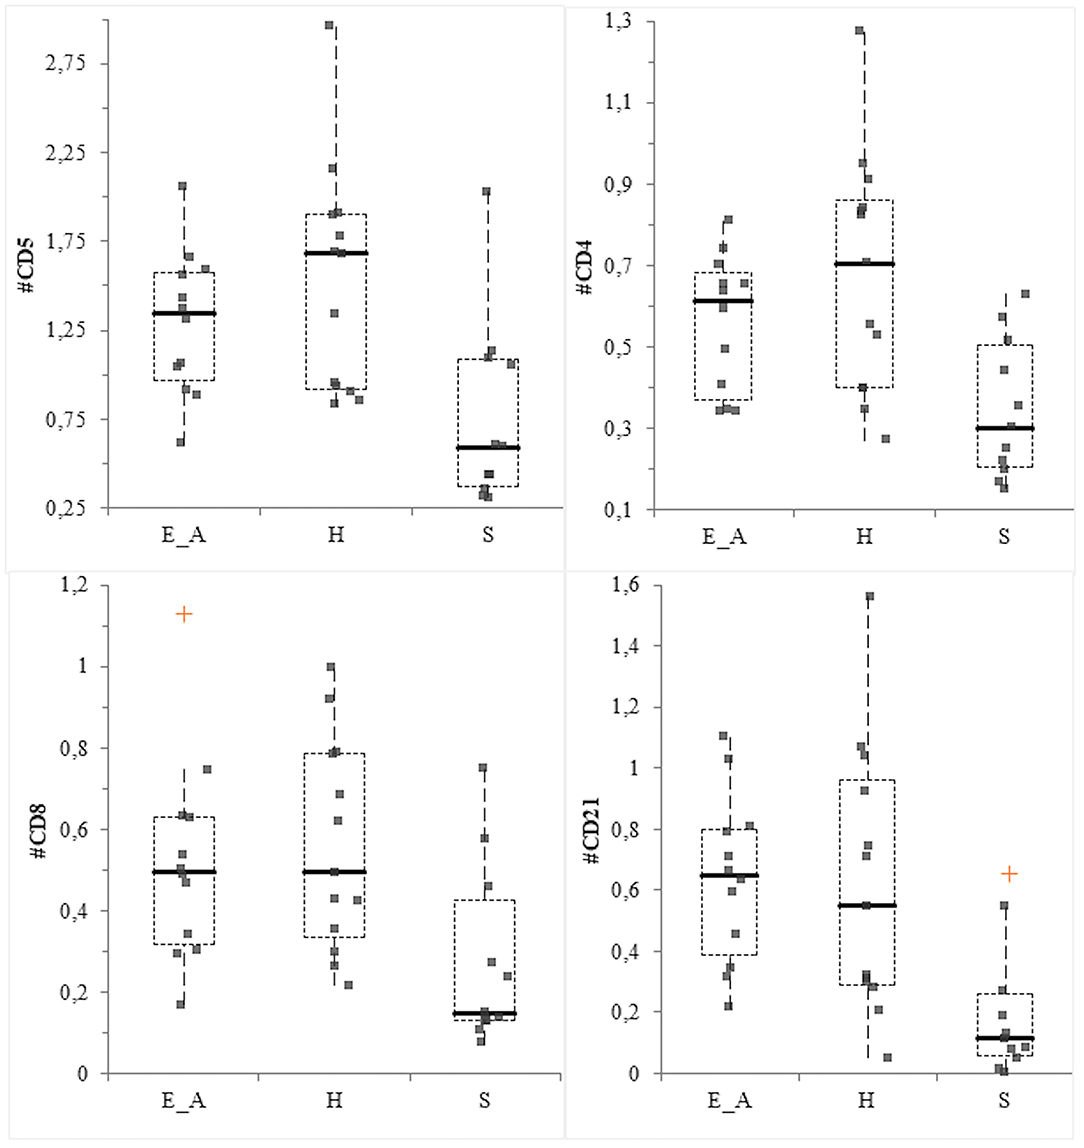
Figure 5. Box—plot for main lymphocyte classes in the three group of dogs. Comparison of the absolute value (expressed as ×103/μL) of CD5+ cells (upper left), CD4+ cells (upper right), CD8+ (lower left) and CD21+ (lower right) cells among the three group. The orange crosses represent the near outliers.
Correlation Between Microbiota Phyla and Leukocyte Classes
The correlation analysis between gut microbiota phyla relative abundance and the leukocyte classes absolute number showed a mild positive correlation between Actinobacteria and CD11b (r = 0.35) and between Fusobacteria and CD4:CD8 ratio (r = 0.33). A mild negative correlation was observed between Fusobacteria and CD11b (r = −0.35) and neutrophils (r = −0.39).
Discussion
To the authors knowledge this study is the first reporting results about possible correlations between gut microbiota and leukocytes subclasses in dogs with clinical signs of L. infantum infection, exposed asymptomatic dogs and healthy unexposed controls. The study of microbiota is a field of great interest in both human and veterinary medicine, due to both the relationship with immunity and the possible therapeutic application (31). The results obtained in this study, showing that the phyla most represented in healthy dogs were Firmicutes, Bacteroidetes, Actinobacteria and Proteobacteria, agree with previous studies (32). Specifically, Firmicutes phylum has been frequently found as more represented in healthy animals, both in literature and in this study, as well as two of its main represented classes, Clostridia and Erysipelotrichi (33). Interestingly, the result obtained in this study regarding Proteobacteria phylum, more abundant in symptomatic dogs than into the healthy ones, is in accordance with previous reports (14, 34). It should be reminded that Proteobacteria phylum, that includes several gastrointestinal pathogens (e.g., Escherichia coli), is of particular concern in veterinary medicine. Thus, this finding in symptomatic dogs may suggest the presence of a subtle dysbiosis even in dogs that do not clearly show clinical signs related with a gastrointestinal disease. Moreover, the significant higher abundance of Gammaproteobacteria, which is the main class belonging to Proteobacteria phylum, as well as other bacteria belonging to genera of this phylum (specifically Enterococcus and Proteus) in both symptomatic and asymptomatic dogs, compared to the healthy ones, may also suggest the presence of dysbiosis in infected dogs. The significant results at the genus level showing a lower abundance of Mucispirillum (Fam. Deferribacteraceae, phylum Deferribacteres) in dogs with clinical signs of the disease compared to the other two groups needs further investigations. In mice gut microbiota Mucispirillum has been reported to be protective against Salmonella infection (35). There is no information about the role of this genus in dogs, but the lower abundance recorded in symptomatic dogs may suggest the presence of dysbiosis or of gastrointestinal increased susceptibility to diseases. Overall, most of the less represented families and genera in the symptomatic group (Veillonellaceae, Megamonas, Prevotella, Catenibacterium and Clostridium) belong to the Firmicutes and Bacteroidetes phyla and are related with the short chain fatty acids (SCFAs) production. These metabolites (specifically acetate, propionate and butyrate), that derive from simple carbohydrates fermentation, are reported to have a main role in the enterocyte's nutrition and in immunomodulation. Indeed, it seems that they are associated with the production enhancement of anti-inflammatory cytokines (e.g., IL-10 and TGFβ) and the proinflammatory cytokines suppression (e.g., IL-6, IL-8 and TNFα) (36, 37). It could be interesting in future studies to investigate whether symptomatic dogs are associated to a decrease of SCFAs synthesis through a metabolomic approach. Differences between Leishmania-infected dogs (both with or without clinical signs) and healthy dogs were not surprising. Indeed, an alteration of gut microbiota composition in dogs with disorders other than gastrointestinal diseases (e.g., multicentric lymphoma, diabetes mellitus) has already been reported (15, 38). However, literature about healthy or diseased microbiota composition in dogs is not concordant. Moreover, attention should be driven also to factors other than the presence of diseases or infections that may influence the microbiota composition. In the present study, in order to minimize possible confounding factors, all the enrolled dogs were fed on commercial food only. However, the extent of the dietary influence on the caseload of this study is not completely known, since there is some variability in the type of commercial food. In addition, environment, age and body condition score may also influence the microbiota, as well as the individual variability that may be present in the healthy population. Thus, a larger study group may help in confirming results obtained here.
In this study, results related to the leukocyte populations agree with some previous studies reporting the pivotal role of the immune system in the evolution and clinical results of Leishmania spp. infection in dogs (16). In the cutaneous leishmaniasis murine model, resistance to the disease has been correlated with a prevalent Th1 response, while susceptibility has been associated with a predominant Th2 response alone. In canine leishmaniasis, a major protection is associated with a Th1-like immunity (39). In the present study all the lymphocyte subsets were significantly lower in the dogs with clinical signs compared with both the exposed asymptomatic and the healthy ones. Even though B-cells are implicated in the plasma cells activation and production of immunoglobulin, cause of canine leishmaniasis symptomatic form of disease (17), this stimulation usually takes place in lymphoid organs or in bone marrow. Thus, it is not astonishing to observe a decrease (both in percentage and absolute number) of circulating CD21+ cells in symptomatic dogs, as already reported (22, 40). Since the decrease of T lymphocytes associated with a Th1 response is related with the disease susceptibility (22, 40) the significantly lower amount of CD5+ and CD4+ cells in the symptomatic group are expected as well. The results obtained from the evaluation of CD4:CD8 ratio in dogs affected by L. infantum infection are controversial. Some studies reported a decrease of this ratio in dogs with clinical signs of leishmaniasis (41, 42). However, in the present study a significant difference in CD4:CD8 was not found. This result may be associated with a decrease of both CD8+ and CD4+ cells in symptomatic dogs that subsequently led to an absence of variation of the ratio. The visual inspection of the box plot graph suggests that the lowest results for CD4:CD8 were observed in the asymptomatic group. This evidence confirms what reported by Reis et al. (22) where a CD8+ cells increase is described to cause an inversion of CD4:CD8 ratio, in relationship with a low parasite burden in the bone marrow. The different results reported previously likely reflect the complexity of this disease, thus a further investigation about the role of Th1/Th2 response in the pathogenesis of the disease could be interesting, for example by evaluating cytokine expression in canine patients. The results of the correlation between phyla abundance and leukocyte classes, even though statistically significant, were not robust enough to be relevant, being r values lower than 0.4.
One limitation of this study is represented by the small sampling population, thus the results here obtained should be confirmed on a larger number of dogs. Anyway, it should be pointed out that investigations on canine microbiota during systemic infectious diseases are still scarce in literature, thus results here observed still have an important role in gathering information about this topic in canine medicine. Another limitation of this study concerns the inclusion of exposed asymptomatic, instead of infected asymptomatic dogs. This choice was due to ethical issues, since a positive PCR result on a bone marrow sample should have been obtained to confirm hidden infection. Unfortunately, bone marrow sampling is a quite invasive procedure requiring at least local anesthesia, even when performed by experienced clinicians, making it not be ethically advisable in clinically healthy dogs. For this reason, in this study, qPCR was performed on leftover whole blood specimens that had been sampled for diagnostic purposes or routine health check. In literature, some papers report good sensitivity and specificity for qPCR on whole blood, also in asymptomatic dogs (43). Nevertheless, results obtained in this study on the exposed asymptomatic group should be confirmed in infected asymptomatic dogs. Another possible limitation is the inclusion of all the symptomatic dogs in one group despite different clinical presentations of the disease. In this study symptomatic dogs were enrolled according to Canine Leishmaniasis Working Group guidelines (17). However, the Leishvet group guidelines allow to further classify the sick dogs based on the severity of clinical signs (44). Thus, it would be interesting to investigate in future studies if the difference here observed in canine gut microbiota of sick dogs would be confirmed even with different clinical presentation of the disease. In conclusion, the gut microbiota composition in dogs with or without Leishmania spp. infection was significantly different among groups, mostly in the Firmicutes and Proteobacteria phyla. This observation agrees with previous studies about systemic or local gastrointestinal diseases other than leishmaniasis in dogs (15, 45). The investigation on a higher number of cases, possibly including infected dogs without clinical signs, rather than exposed dogs, could confirm the results obtained in this study. To the authors' knowledge this study is the first that investigate the gut microbiota composition in association with canine leishmaniasis, providing new insights on this disease. Moreover, a recent study on a hamster model for fatal visceral leishmaniasis reported how the dysbiosis, induced by a long-term antibiotic treatment, seems to delay the onset and reduce the severity of the disease, suggesting that a modification in microbiota composition could possibly affect the disease development (46). These results, together with those obtained in the present study, should further spur the researcher into investigation on canine gut microbiota during leishmaniasis as a possible target of intervention to modify the disease development. Flow cytometric results partially agree with those reported in literature, showing a decrease of all the lymphocytes classes in symptomatic dogs. However, it would be interesting to deeply investigate the role of immunity analyzing the pattern of cytokine expression in the different groups. The preliminary results obtained on the correlation between leukocyte classes and microbiota composition need to be confirmed on a higher number of dogs. Moreover, due to the absence of data about this topic, it is quite difficult to provide a biological explanation, even though these preliminary results may be a starting point for further analyses.
Data Availability Statement
The original contributions presented in the study are publicly available. This data can be found here: https://www.ncbi.nlm.nih.gov/bioproject/PRJNA837097.
Ethics Statement
Samples from all the dogs were collected according to a protocol approved by the Ethical Committee of the University of Milan (protocol no. 02-2016) that allow the use of residual samples and tissues collected for routine or diagnostic purposes with the informed consent of the owners, without any further formal request or authorization.
Author Contributions
AG and SM contributed to conception, design of the study, and wrote the first draft of the manuscript. MP, SZ, SM, SL, RF, and VM organized the database. SM performed the statistical analysis. AG, SM, SZ, SL, and VM wrote sections of the manuscript. All authors contributed to manuscript revision, read, and approved the submitted version.
Conflict of Interest
The authors declare that the research was conducted in the absence of any commercial or financial relationships that could be construed as a potential conflict of interest.
Publisher's Note
All claims expressed in this article are solely those of the authors and do not necessarily represent those of their affiliated organizations, or those of the publisher, the editors and the reviewers. Any product that may be evaluated in this article, or claim that may be made by its manufacturer, is not guaranteed or endorsed by the publisher.
Acknowledgments
The results of this study have been partially discussed into Meazzi's Ph.D. degree thesis titled the interplay between host defenses and systemic pathogens in promoting diseases of companion animals. The authors acknowledge the support of the APC central fund of the University of Milan.
References
1. Adak A, Khan MR. An insight into gut microbiota and its functionalities. Cell Mol Life Sci. (2019) 76:473–93. doi: 10.1007/s00018-018-2943-4
2. Neish AS. Microbes in gastrointestinal health and disease. Gastroenterology. (2009) 136:65–80. doi: 10.1053/j.gastro.2008.10.080
3. Jakobsson HE, Rodríguez-Piñeiro AM, Schütte A, Ermund A, Boysen P, Bemark M, et al. The composition of the gut microbiota shapes the colon mucus barrier. EMBO Rep. (2015) 16:164–77. doi: 10.15252/embr.201439263
4. Nie P, Li Z, Wang Y, Zhang Y, Zhao M, Luo J, et al. Gut microbiome interventions in human health and diseases. Med Res Rev. (2019) 39:2286–313. doi: 10.1002/med.21584
5. Winkler ES, Thackray LB. A long-distance relationship: the commensal gut microbiota and systemic viruses. Curr Opin Virol. (2019) 37:44–51. doi: 10.1016/j.coviro.2019.05.009
6. Williams AM, Probert CSJ, Stepankova R, Tlaskalova-Hogenova H, Phillips A, Bland PW. Effects of microflora on the neonatal development of gut mucosal T cells and myeloid cells in the mouse. Immunology. (2006) 119:470–8. doi: 10.1111/j.1365-2567.2006.02458.x
7. Round JL, Mazmanian SK. The gut microbiota shapes intestinal immune responses during health and disease. Nat Rev Immunol. (2009) 9:313–23. doi: 10.1038/nri2515
8. Lopes MEM, Carneiro MBH, dos Santos LM, Vieira LQ. Indigenous microbiota and Leishmaniasis. Parasite Immunol. (2016) 38:37–44. doi: 10.1111/pim.12279
9. Bokulich NA, Chung J, Battaglia T, Henderson N, Jay M, Li H, et al. Antibiotics, birth mode, and diet shape microbiome maturation during early life. Sci Transl Med. (2016) 8:343ra82. doi: 10.1126/scitranslmed.aad7121
10. Kristensen K, Henriksen L. Cesarean section and disease associated with immune function. J Allergy Clin Immunol. (2016) 137:587–90. doi: 10.1016/j.jaci.2015.07.040
11. Schmidt M, Unterer S, Suchodolski JS, Honneffer JB, Guard BC, Lidbury JA, et al. The fecal microbiome and metabolome differs between dogs fed Bones and Raw Food (BARF) diets and dogs fed commercial diets. PLoS ONE. (2018) 13:1–20. doi: 10.1371/journal.pone.0201279
12. Alessandri G, Milani C, Mancabelli L, Mangifesta M, Lugli GA, Viappiani A, et al. Metagenomic dissection of the canine gut microbiota: insights into taxonomic, metabolic and nutritional features. Environ Microbiol. (2019) 21:1331–43. doi: 10.1111/1462-2920.14540
13. Suchodolski JS, Markel ME, Garcia-Mazcorro JF, Unterer S, Heilmann RM, Dowd SE, et al. The fecal microbiome in dogs with acute diarrhea and idiopathic inflammatory bowel disease. PLoS ONE. (2012) 7:e51907 doi: 10.1371/journal.pone.0051907
14. Zheng Y, Hao X, Lin X, Zheng Q, Zhang W, Zhou P, et al. Bacterial diversity in the feces of dogs with CPV infection. Microb Pathog. (2018) 121:70–6. doi: 10.1016/j.micpath.2018.04.043
15. Jergens AE, Guard BC, Redfern A, Rossi G, Mochel JP, Pilla R, et al. Microbiota-related changes in unconjugated fecal bile acids are associated with naturally occurring, insulin-dependent diabetes mellitus in dogs. Front Vet Sci. (2019) 6:199. doi: 10.3389/fvets.2019.00199
16. Saridomichelakis MN. Advances in the pathogenesis of canine leishmaniosis: epidemiologic and diagnostic implications. Vet Dermatol. (2009) 20:471–89. doi: 10.1111/j.1365-3164.2009.00823.x
17. Paltrinieri S, Gradoni L, Roura X, Zatelli A, Zini E. Laboratory tests for diagnosing and monitoring canine leishmaniasis. Vet Clin Pathol. (2016) 45:552–78. doi: 10.1111/vcp.12413
18. Saridomichelakis MN, Koutinas AF. Cutaneous involvement in canine leishmaniosis due to Leishmania infantum (syn. L. chagasi). Vet Dermatol. (2014) 25:61–72. doi: 10.1111/vde.12105
20. Pinelli E, Boog CJP, Rutten VPMG, van Dijk B, Bernadina WE, Ruitenberg EJ. A canine CD8+ cytotoxic T-cell line specific for Leishmania infantum-infected macrophages. Tissue Antigens/. (1994) 43:189–92. doi: 10.1111/j.1399-0039.1994.tb02321.x
21. Pinelli E, Gonzalo RM, Boog CJP, Rutten VPMG, Gebhard D, Del Real G, et al. Leishmania infantum-specific T cell lines derived from asymptomatic dogs that lyse infected macrophages in a major histocompatibility complex-restricted manner. Eur J Immunol. (1995) 25:1594–600. doi: 10.1002/eji.1830250619
22. Reis AB, Teixeira-Carvalho A, Giunchetti RC, Guerra LL, Carvalho MG, Mayrink W, et al. Phenotypic features of circulating leucocytes as immunological markers for clinical status and bone marrow parasite density in dogs naturally infected by Leishmania chagasi. Clin Exp Immunol. (2006) 146:303–11. doi: 10.1111/j.1365-2249.2006.03206.x
23. Locksley RM, Heinzel FP, Sadick MD, Holaday BJ, Gardner KD. Murine cutaneous leishmaniasis : susceptibility correlates with differential expansion of helper T-cell subsets. Ann l'Institut Pasteur Immunol. (1987) 138:744–9. doi: 10.1016/S0769-2625(87)80030-2
24. Giordano A, Paltrinieri S. Interpretation of capillary zone electrophoresis compared with cellulose acetate and agarose gel electrophoresis: reference intervals and diagnostic efficiency in dogs and cats. Vet Clin Pathol. (2010) 39:464–73. doi: 10.1111/j.1939-165X.2010.00255.x
25. Kitano T, Umetsu K, Tian W, Osawa M. Two universal primer sets for species identification among vertebrates. Int J Leg Med. (2007) 121:423–7. doi: 10.1007/s00414-006-0113-y
26. Francino O, Altet L, Sánchez-Robert E, Rodriguez A, Solano-Gallego L, Alberola J, et al. Advantages of real-time PCR assay for diagnosis and monitoring of canine leishmaniosis. Vet Parasitol. (2006) 137:214–21. doi: 10.1016/j.vetpar.2006.01.011
27. Meazzi S. The interplay between host defenses and systemic pathogens in promoting diseases of companion animals [PhD thesis]. University of Milan, Milan, Italy (2020).
28. Callahan BJ, Sankaran K, Fukuyama JA, McMurdie PJ, Holmes SP. Bioconductor workflow for microbiome data analysis: from raw reads to community analyses. F1000Research. (2016) 5:1–50. doi: 10.12688/f1000research.8986.2
29. McMurdie PJ, Holmes S. Phyloseq: an R package for reproducible interactive analysis and graphics of microbiome census data. PLoS ONE. (2013) 8:e61217. doi: 10.1371/journal.pone.0061217
30. Schober P, Schwarte LA. Correlation coefficients: appropriate use and interpretation. Anesth Analg. (2018) 126:1763–8. doi: 10.1213/ANE.0000000000002864
31. Pereira GQ, Gomes LA, Santos IS, Alfieri AF, Weese JS, Costa MC. Fecal microbiota transplantation in puppies with canine parvovirus infection. J Vet Intern Med. (2018) 32:707–11. doi: 10.1111/jvim.15072
32. Handl S, Dowd SE, Garcia-Mazcorro JF, Steiner JM, Suchodolski JS. Massive parallel 16S rRNA gene pyrosequencing reveals highly diverse fecal bacterial and fungal communities in healthy dogs and cats. FEMS Microbiol Ecol. (2011) 76:301–10. doi: 10.1111/j.1574-6941.2011.01058.x
33. Suchodolski JS. Diagnosis and interpretation of intestinal dysbiosis in dogs and cats. Vet J. (2016) 215:30–7. doi: 10.1016/j.tvjl.2016.04.011
34. Suchodolski JS, Dowd SE, Wilke V, Steiner JM, Jergens AE. 16S rRNA gene pyrosequencing reveals bacterial dysbiosis in the Duodenum of dogs with idiopathic inflammatory bowel disease. PLoS ONE. (2012) 7:e39333. doi: 10.1371/journal.pone.0039333
35. Herp S, Brugiroux S, Garzetti D, Ring D, Jochum LM, Beutler M, et al. Mucispirillum schaedleri antagonizes salmonella virulence to protect mice against colitis. Cell Host Microbe. (2019) 25:681–94.e8. doi: 10.1016/j.chom.2019.03.004
36. Minamoto Y, Minamoto T, Isaiah A, Sattasathuchana P, Buono A, Rangachari VR, et al. Fecal short-chain fatty acid concentrations and dysbiosis in dogs with chronic enteropathy. J Vet Intern Med. (2019) 33:1608–18. doi: 10.1111/jvim.15520
37. Macfarlane GT, Macfarlane S. Bacteria, colonic fermentation, and gastrointestinal health. J AOAC Int. (2012) 95:50–60. doi: 10.5740/jaoacint.SGE_Macfarlane
38. Gavazza A, Rossi G, Lubas G, Cerquetella M, Minamoto Y, Suchodolski JS. Faecal microbiota in dogs with multicentric lymphoma. Vet Comp Oncol. (2018) 16:E169–75. doi: 10.1111/vco.12367
39. Solano-Gallego L, Llull J, Ramos G, Riera C, Arboix M, Alberola J, et al. The Ibizian hound presents a predominantly cellular immune response against natural Leishmania infection. Vet Parasitol. (2000) 90:37–45. doi: 10.1016/S0304-4017(00)00223-5
40. Bourdoiseau G, Bonnefont C, Magnol JP, Saint-André I, Chabanne L. Lymphocyte subset abnormalities in canine leishmaniasis. Vet Immunol Immunopathol. (1997) 56:345–351. doi: 10.1016/S0165-2427(96)05768-6
41. Miranda S, Martorell S, Costa M, Ferrer L, Ramis A. Characterization of circulating lymphocyte subpopulations in canine leishmaniasis throughout treatment with antimonials and allopurinol. Vet Parasitol. (2007) 144:251–60. doi: 10.1016/j.vetpar.2006.10.007
42. Coura-Vital W, Marques MJ, Giunchetti RC, Teixeira-Carvalho A, Moreira ND, Vitoriano-Souza J, et al. Humoral and cellular immune responses in dogs with inapparent natural Leishmania infantum infection. Vet J. (2011) 190:e43–7. doi: 10.1016/j.tvjl.2011.04.005
43. Mohammadiha A, Mohebali M, Haghighi A, Mahdian R, Abadi AR, Zarei Z, et al. Comparison of real-time PCR and conventional PCR with two DNA targets for detection of Leishmania (Leishmania) infantum infection in human and dog blood samples. Comp Study Exp Parasitol. (2013) 133:89–94. doi: 10.1016/j.exppara.2012.10.017
44. Solano-Gallego L, Miró G, Koutinas A, Cardoso L, Pennisi MG, Ferrer L, et al. LeishVet guidelines for the practical management of canine leishmaniosis. Parasit Vec. (2011) 20:4–86. doi: 10.1186/1756-3305-4-86
45. Suchodolski JS, Xenoulis PG, Paddock CG, Steiner JM, Jergens AE. Molecular analysis of the bacterial microbiota in duodenal biopsies from dogs with idiopathic inflammatory bowel disease. Vet Microbiol. (2010) 142:394–400. doi: 10.1016/j.vetmic.2009.11.002
46. Lewis MD, Paun A, Romano A, Langston H, Langner CA, Moore IN, et al. Fatal progression of experimental visceral leishmaniasis is associated with intestinal parasitism and secondary infection by commensal bacteria, and is delayed by antibiotic prophylaxis. PLoS Pathog. (2020) 16:e1008456. doi: 10.1371/journal.ppat.1008456
Keywords: Leishmania spp., fecal microbiome, leukocytes, flow cytometry, bacteria
Citation: Meazzi S, Lauzi S, Martini V, Ferriani R, Peri M, Zanzani SA and Giordano A (2022) Gut Microbiota and Lymphocyte Subsets in Canine Leishmaniasis. Front. Vet. Sci. 9:868967. doi: 10.3389/fvets.2022.868967
Received: 03 February 2022; Accepted: 16 May 2022;
Published: 13 July 2022.
Edited by:
Donato Traversa, University of Teramo, ItalyReviewed by:
Giacomo Rossi, University of Camerino, ItalyFernanda Nazaré Morgado, Oswaldo Cruz Institute, Brazil
Bruno Mendes Roatt, Universidade Federal de Ouro Preto, Brazil
Flaviane Pinho, Federal University of Bahia, Brazil
Copyright © 2022 Meazzi, Lauzi, Martini, Ferriani, Peri, Zanzani and Giordano. This is an open-access article distributed under the terms of the Creative Commons Attribution License (CC BY). The use, distribution or reproduction in other forums is permitted, provided the original author(s) and the copyright owner(s) are credited and that the original publication in this journal is cited, in accordance with accepted academic practice. No use, distribution or reproduction is permitted which does not comply with these terms.
*Correspondence: Stefania Lauzi, stefania.lauzi@unimi.it