Integrated Analysis of mRNA and MicroRNA Co-expressed Network for the Differentiation of Bovine Skeletal Muscle Cells After Polyphenol Resveratrol Treatment
 Dan Hao1,2†
  Xiao Wang3†
  Yu Yang1
  Bo Thomsen2 Lars-Erik Holm2 Kaixing Qu4 Bizhi Huang5*
  Hong Chen1,6*
- 1College of Animal Science and Technology, Northwest A&F University, Shaanxi Key Laboratory of Animal Genetics, Breeding and Reproduction of Shaanxi Province, Yangling, China
- 2Department of Molecular Biology and Genetics, Aarhus University, Aarhus, Denmark
- 3Konge Larsen ApS, Kongens Lyngby, Denmark
- 4Academy of Science and Technology, Chuxiong Normal University, Chuxiong, China
- 5Yunnan Academy of Grassland and Animal Science, Kunming, China
- 6College of Animal Science, Xinjiang Agricultural University, Urumqi, China
Resveratrol (RSV) has been confirmed to benefit human health. Resveratrol supplemented in the feeds of animals improved pork, chicken, and duck meat qualities. In this study, we identified differentially expressed (DE) messenger RNAs (mRNAs) (n = 3,856) and microRNAs (miRNAs) (n = 93) for the weighted gene co-expression network analysis (WGCNA) to investigate the co-expressed DE mRNAs and DE miRNAs in the primary bovine myoblasts after RSV treatment. The mRNA results indicated that RSV treatments had high correlations with turquoise module (0.91, P-value = 0.01) and blue module (0.93, P-value < 0.01), while only the turquoise module (0.96, P-value < 0.01) was highly correlated with the treatment status using miRNA data. After biological enrichment analysis, the 2,579 DE genes in the turquoise module were significantly enriched in the Gene Ontology (GO) terms and Kyoto Encyclopedia of Genes and Genomes (KEGG) pathways. The top two GO terms were actin filament-based process (GO:0030029) and actin cytoskeleton organization (GO:0030036). The top two KEGG pathways were regulation of actin cytoskeleton (bta04810) and tight junction (bta04530). Then, we constructed the DE mRNA co-expression and DE miRNA co-expression networks in the turquoise module and the mRNA–miRNA targeting networks based on their co-expressions in the key module. In summary, the RSV-induced miRNAs participated in the co-expression networks that could affect mRNA expressions to regulate the primary myoblast differentiation. Our study provided a better understanding of the roles of RSV in inducing miRNA and of the characteristics of DE miRNAs in the key co-expressed module in regulation of mRNAs and revealed new candidate regulatory miRNAs and genes for the beef quality traits.
Introduction
Resveratrol (RSV) is a natural polyphenol compound found in grapes, nuts, and some blackberries. Researchers have studied its health-promoting effects of neuroprotection (1) and cardioprotection (2) as well as its inhibiting actions to tumor cell proliferation (3) and microbial activity (4) and its diminishing effects on inflammation in humans and animals (5, 6). Its pro-differentiation properties to human lung fibroblasts (7), embryonic cardiomyoblasts (8), and skeletal myoblast have also been studied (9). For example, Dirks Naylor (10) demonstrated the RSV effects on skeletal muscle metabolism, protein catabolism, and muscle-related ischemia and reperfusion injury disease in a review study (10). Resveratrol could also help to improve muscle fatigue resistance (11), reduce aging-induced muscle loss (12), improve muscle atrophy (13), and enhance exercise performance (14). Resveratrol is contained in the wine grape pomace, and adding it to feed will benefit the feed efficiency and meat tenderness in lamb (15). In addition, the antioxidant effects of RSV improved the heat-stressed and the transport-stressed meat quality of broilers (16, 17). Resveratrol alleviated the skeletal muscle mitochondrial dysfunction and oxidative damage, when 80 mg/kg/day RSV was supplied in the intrauterine growth retardation piglets (18). The same dose of RSV also improved the meat quality by increasing the content of oxidative muscle fiber and decreasing the lipid accumulation in pigs (19). Dietary RSV supplements of 300–450 mg/kg in Peking ducks improved meat quality through decreasing abdominal fat rate and shear force, as well-increasing the flavor amino acid and intramuscular fat deposition (20). In cattle, the beneficial effects of RSV have been concluded in several studies on bovine oocyte maturation and subsequent embryonic development (21), inhibition of apoptosis and lipid peroxidation for the fertilization capacity of bovine sex-sorted semen (22), rumen fermentation, methane production, and prokaryotic community composition (23). However, the effect of RSV on beef production and quality still needs further investigation.
The carcass composition of beef cattle is influenced by intrinsic factors (e.g., genetic, age, and sex) and extrinsic factors (e.g., nutrition, environment, and management) (24). Bassel et al. (25) suggested the establishment of global co-expression network connections between genes by considering all samples in Arabidopsis. Gene co-expression networks are constructed by genes with significant co-expression relationships, where the co-expressed genes show similar expression patterns across samples that are controlled by the same transcriptional regulatory programs (26, 27). The weighted gene co-expression network analysis (WGCNA) has been used in analyzing the feed efficiency, residual feed intake, carcass traits, and lactation in cattle (28–30).
Our previous study focused on transcriptomic changes in bovine skeletal muscle cells after RSV treatment and was conducted to identify the differentially expressed (DE) genes and microRNAs (miRNAs) (31, 32); therefore, this study mainly focuses on the combined co-expressed transcriptomes, i.e., messenger RNA (mRNA) and miRNA studies for bovine muscle in response to treatment with RSV, which aims to investigate the roles of RSV in inducing miRNA for the better understanding, to identify the characteristics of DE miRNAs in the key co-expressed module in regulation of mRNAs, and to reveal new candidate regulatory miRNAs and genes underlying the beef quality traits.
Materials and Methods
Primary Bovine Myoblast, Transcriptome Sequencing, and Differential Expression Analysis
The cultured primary myoblasts from the fetal beef longissimus dorsi muscle, the transcriptome sequencing datasets after quality control and alignment, and the differential expression analysis results were achieved from our previous studies (31, 32).
All the animal procedures were carried out according to the protocols approved by the Institutional Animal Care and Use Committee (IACUC) of the College of Animal Science and Technology, Northwest A&F University, China. Ninety-day-old fetal cattle were collected from Tumen slaughterhouse in Xi'an, Shaanxi Province. First, we used 75% alcohol and 1% double-antibody sterile phosphate buffer solution (phosphate buffered saline, PBS) to gently wash the epidermis of the fetal cow to eliminate blood stains and bacterial contamination in an extra-large plate. Second, we cut the muscle tissue pieces and placed them in a 50-ml centrifuge tube, with collagenase I digestion in Dulbecco's modified Eagle's medium (DMEM) at 37°C for 1.5 h. Third, the suspension was filtered and centrifuged, and the supernatant was removed. Fourth, we added four times the volume of 0.25% trypsin in the sediment at 37°C for 30 min. Fifth, the digested sample was filtered through 1-mm stainless steel mesh and 100-μm mesh. Sixth, we added 500 μl of a medium containing 15% fetal bovine serum (FBS) to the pellet to terminate the digestion, and the cells were inoculated in a 6-cm Petri dish. After 20-min culturing, we drew the upper culture medium and continued the culturing process in a new 6-cm Petri dish. When the cell density reached 80–90%, we used them for the subsequent experiments.
RNA for each cell sample was isolated for mRNA sequencing to generate 125 or 150-bp paired-end reads and for miRNA sequencing to generate 50-bp single-end reads on an Illumina Hiseq platform (Illumina, USA). We removed the unqualified reads by quality control to achieve clean reads by in-house perl scripts that were used in our previous studies (31, 32). Then, the miRNA tags were mapped to the reference genome of Bos taurus (UMD_3.1.1/bosTau8) by Bowtie software (version 0.12.9) (33). The mapped miRNA tags were used to seek the known miRNAs using miRBase20.0 as the reference, so the potential miRNA and the secondary structures were obtained by miRDeep2 software (version 2.0.0.5) (34).
The expected number of fragments per kilobase of transcript sequence per million base pairs sequenced (FPKM) of each gene was calculated to achieve the average FPKM values for the replicates. The threshold of gene expression was set for mRNA, when the FPKM value is larger than 1. Following the normalization formula (35), miRNA expression levels were also estimated by transcript per million (TPM). A differential expression analysis of two groups (case and control) for both mRNA and miRNA was performed using the R package DESeq (version 1.18.0) (36). The P-values were adjusted using the Benjamini and Hochberg's method for controlling the false discovery rate (FDR). Differentially expressed mRNAs and DE miRNAs were defined when the adjusted P-values were < 0.05. In addition, we calculated fold changes (FCs) between the case and control groups based on the averaged FPKM values and TPM values to define the up-regulated (log2FC > 0) and down-regulated (log2FC < 0) mRNAs and miRNAs, respectively.
We used the skeletal muscle cells under the polyphenol RSV treatment as the case group, while the skeletal muscle cells without RSV treatment were considered as the control group. Meanwhile, both the case and control groups had three independent experiments separately for the skeletal muscle cell collections. The correlation coefficients among samples were visualized in the heatmaps using log10(FPKM + 1) for mRNA and log10(TPM + 1) for miRNA in Figure 1.
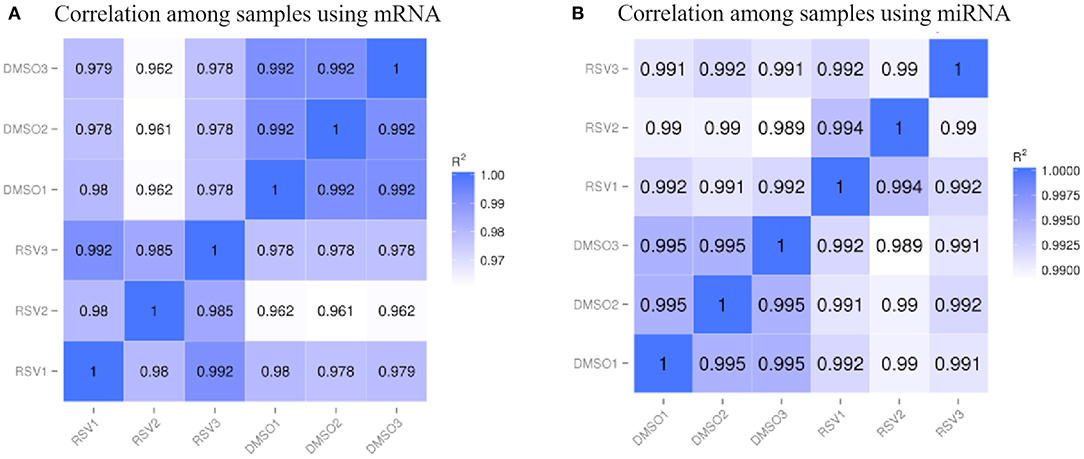
Figure 1. The heatmap of correlation coefficients among samples for (A) mRNA data and (B) miRNA data. R2 indicates the square of Pearson correlation coefficient.
Gene Co-expression Network of mRNA and miRNA and Their Associations With RSV Treatment
The R package WGCNA (37) was used to construct the co-expression network. It constructs a similarity matrix by Pearson correlation coefficients to measure the similarity between the gene expression profiles and then transforms the similarity matrix into an adjacency matrix (A) raised to a β exponent (soft threshold) based on the free-scale topology model. In this study, a total of 18,329 genes were filtered from 26,332 genes in mRNA data based on the median absolute deviation (MAD) of each gene bigger than 0.01. The β power parameter (soft threshold) was equal to 12 when the R2 of the free-scale topology was equal to 0.8 (Figure 2A). In the miRNA data, 650 miRNAs were filtered from 765 genes, and the β power parameter (soft threshold) was equal to 4 (Figure 2B).
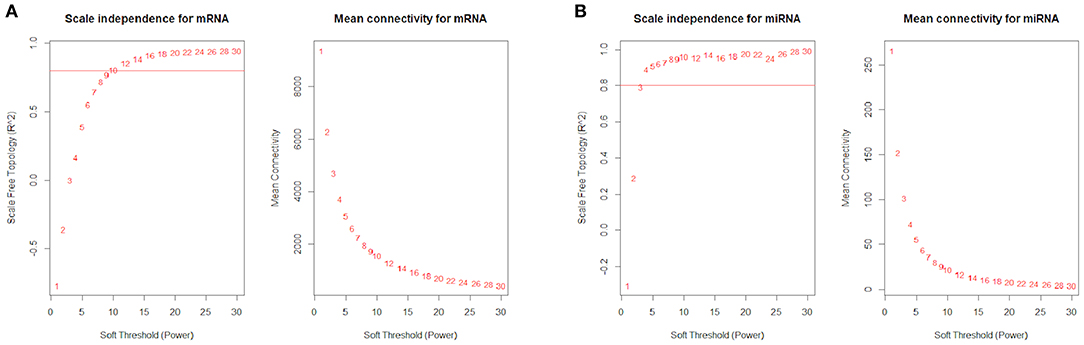
Figure 2. R2 of the free-scale topology and mean connectivity with soft threshold (power) for (A) mRNA data and (B) miRNA data.
We chose the soft threshold power (β = 12 for mRNA and β = 4 for miRNA) based on the criterion of approximate scale-free topology to construct a weighted gene network and detect the consensus modules with the topological overlap matrix (TOM). The minimum module size was set at 30 for both miRNA data and mRNA data, and the maximum module sizes were set at 18,329 and 650 for mRNA data and miRNA data, respectively. Based on the dissimilarity between module eigengenes (MEs), the modules can be merged, where the first principal component of each module represents the gene expression profiles within the modules (38). Here, we set the cut height for module merging at 0.25, so the modules whose eigengenes are correlated above 0.75 will be merged.
A module association analysis was conducted between the ME and the RSV treatment status (i.e., 0, 0, 0, 1, 1, 1 for three control and three case groups, respectively) to calculate the correlations for the relevant module identifications. We calculated the module significance (MS) [i.e., the average absolute gene significance (GS) of all the genes involved in the module, where GS is measured as log P-value in the linear regression between gene expression and RSV treatment status] to evaluate the correlation strengths. Normally, the module with the highest MS score is the key module (37). Module significance genes in the association analysis (P-value < 0.1) were assigned for functional enrichment analysis. The hub genes were defined as the TOM values up to 0.8.
Gene Ontology and Pathway Enrichment Analysis
R package clusterProfiler (version 3.6) (39) was used to test the Gene Ontology (GO) terms and Kyoto Encyclopedia of Genes and Genomes (KEGG) pathway enrichments. Significant enrichment was defined with the adjusted P-value < 0.1 for both GO terms and pathways.
Predicted Target mRNAs of miRNA and mRNA–miRNA Networks
The bovine genomic sequence (release-99) and the gene annotation file were downloaded from the Ensembl FTP site (http://www.ensembl.org/index.html). We used TBtools to obtain the 3′ UTR sequence of the bovine genomic transcripts (40). Then, the transcript stable IDs were converted to the Ensembl stable IDs using the BioMart website (http://www.ensembl.org/biomart). Accordingly, we found the 3′ UTR sequence of the genes in the turquoise modules. The binding capability of miRNAs and their target genes in the turquoise modules was assessed by RNAhybrid (version 2.1.2) (41), with the minimal free energy hybridization under −20 and the helix constraint from 8 to 12.
Results
Differentially Expressed mRNAs and miRNAs Between the RSV Treatment and Control Groups
From our previous study (31, 32), a total of 3,856 DE mRNAs were identified from 18,329 mRNAs based on the threshold of adjusted P-value < 0.05; meanwhile, 93 DE miRNAs were also identified from 650 miRNAs based on the same thresholds (Table 1). The details of log2FC, P-value, adjusted P-value, and DE mRNAs with FPKM and miRNAs with TPM of each sample are listed in the Supplemental File 1.
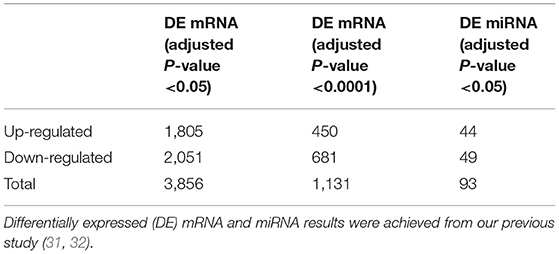
Table 1. Summary of differentially expressed mRNAs and miRNAs.
Module Identification of the Gene Co-expression Network for mRNA and miRNA and Their Associations With RSV Treatment
Using 18,329 mRNA and 650 miRNA data for the sample clustering, we found that the samples with RSV treatment were clustered together in mRNA analysis (Figure 3A), while RSV-treated samples were not clustered together by miRNA data (Figure 3B). Generally, 18,329 mRNAs were grouped into 32 modules that had similar co-expressions using the average linkage hierarchical clustering algorithm (Figures 3C,E), where 8,311 mRNAs were grouped into turquoise module as the key module, followed by 2,210 mRNAs into blue module, etc. (Figure 3E; Table 2). However, miRNAs were only grouped into eight modules (Figures 3D,F; Table 2), where 285 miRNAs were grouped into turquoise modules as the key module, followed by 100 miRNAs into blue modules. The mRNAs and miRNAs that were not assigned to any modules were grouped into gray modules (Figures 3C–F).
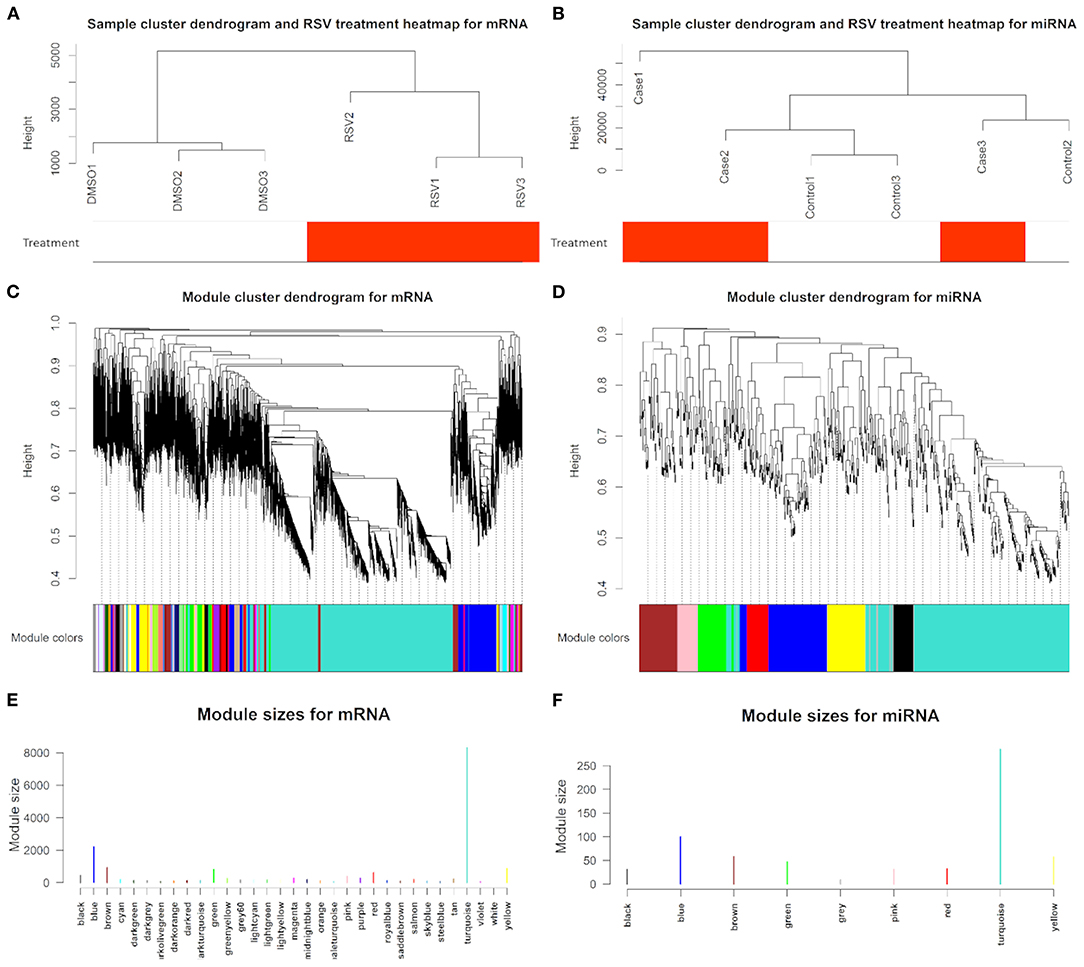
Figure 3. Sample cluster with RSV treatment heatmap, dendrogram clustering plots with assigned module colors based on topological overlap analysis of dissimilarity, and identified module size in different colors for (A,C,E) mRNAs and (B,D,F) miRNAs, respectively.
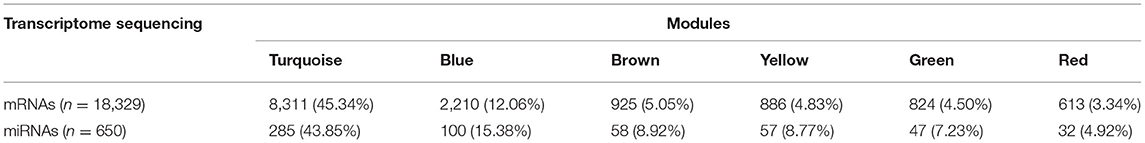
Table 2. Summary of mRNA and miRNA module identifications.
The eigengene adjacency heatmap indicated that these modules of mRNAs and miRNAs could be clustered further together into groups (Figure 4). After incorporating the RSV treatment trait, we found that the treatment status was clustered with blue and turquoise modules for mRNAs (Figure 4A) and with turquoise modules in a single cluster for miRNAs (Figure 4B).
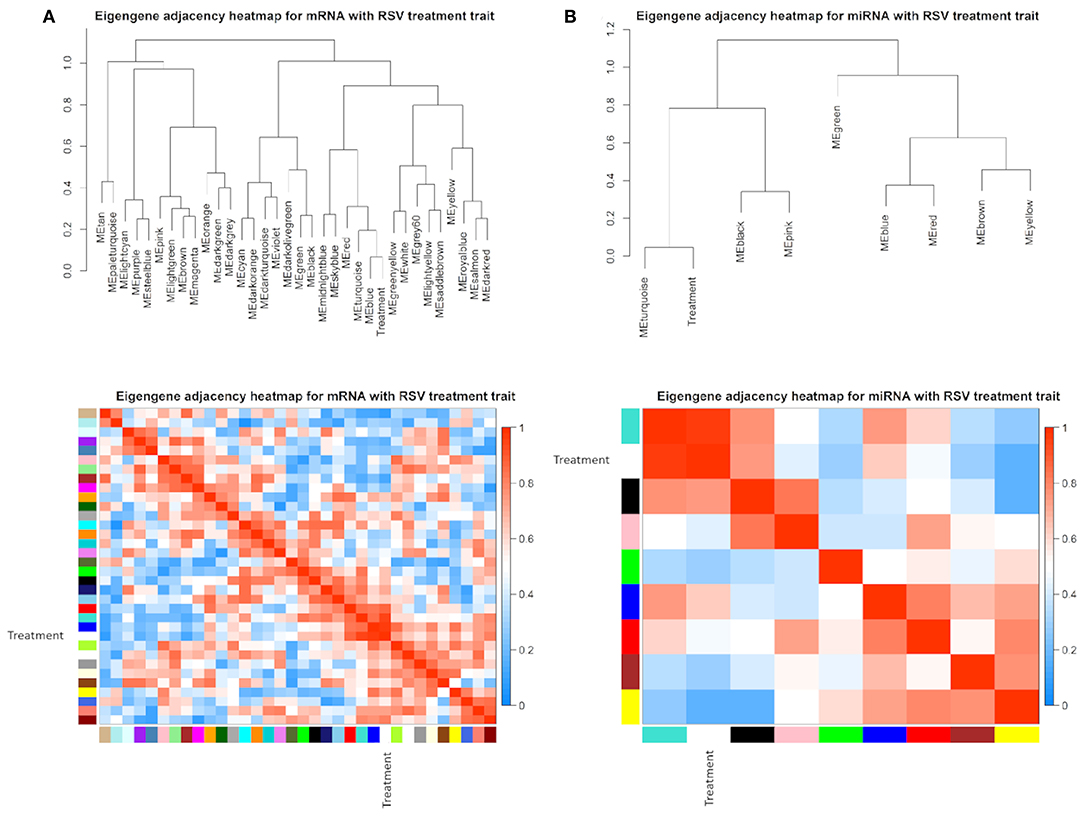
Figure 4. Eigengene dendrogram and adjacency heatmap of different co-expression modules for (A) mRNAs and (B) miRNAs, respectively.
The module–trait relationship results revealed that RSV treatment had high correlations with turquoise module (0.91, P-value = 0.01), blue module (0.93, P-value < 0.01), and tan module (−0.81, P-value = 0.05) using mRNA data (Figure 5A), whereas only turquoise module (0.96, P-value < 0.01) was highly correlated with treatment status using miRNA data (Figure 5B). Therefore, the turquoise module showed a strongly positive relationship with RSV treatment no matter whether mRNA data or miRNA data is used.
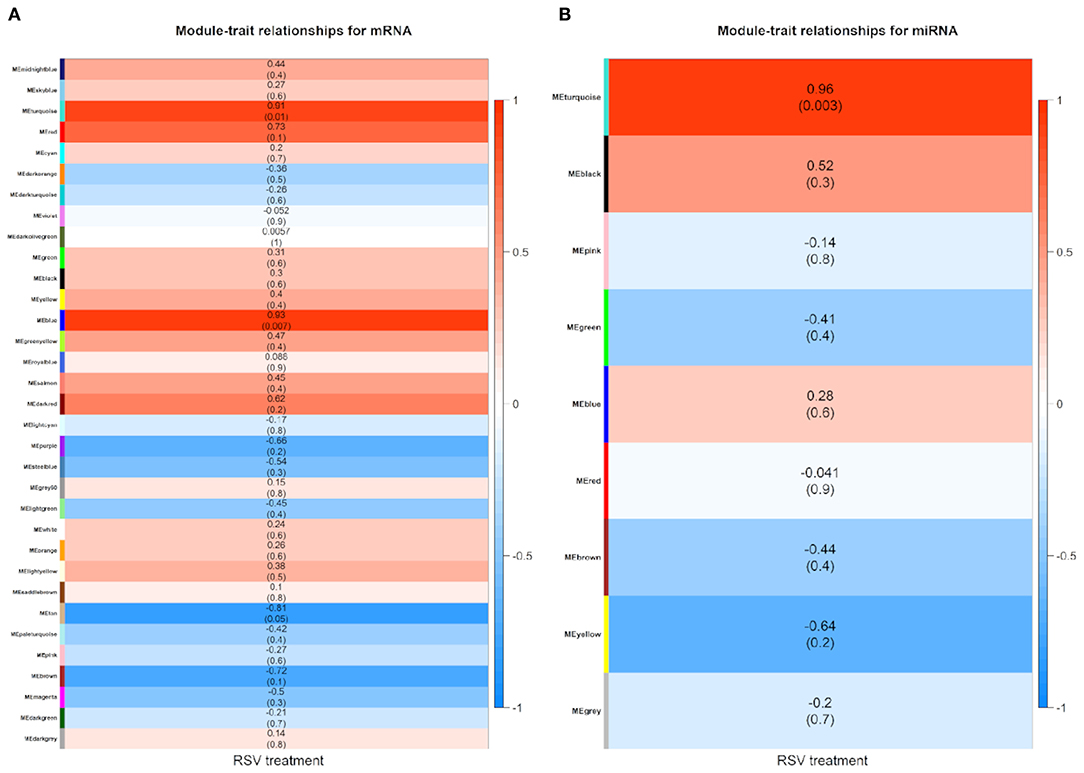
Figure 5. Module–trait relationship heatmap between RSV treatment and control groups for (A) mRNAs and (B) miRNAs, respectively. Each row indicates module eigengenes with the correlation coefficients (P-values in the brackets), where the red color represents positive correlation and the blue color represents negative correlation.
We also used the 3,856 DE mRNAs and 93 DE miRNAs for the weighted gene network construction based on the same soft threshold power (β = 12 for mRNA and β = 4 for miRNA) and then visualized them in the TOM clusters (Figure 6). Here, the minimum module size and maximum block size were set at 30 and 3,856, respectively, for mRNA and were set at 30 and 93, respectively, for miRNA. Only two cluster modules were displayed for both mRNAs and miRNAs, i.e., turquoise and blue modules. In the turquoise module, 2,579 DE mRNAs and 59 DE miRNAs were found, while 1,277 DE mRNAs and 34 DE miRNAs were found in the blue module. Furthermore, the network heatmap of DE mRNAs and DE miRNAs showed a high level of overlap densities among the two clusters (Figure 6).
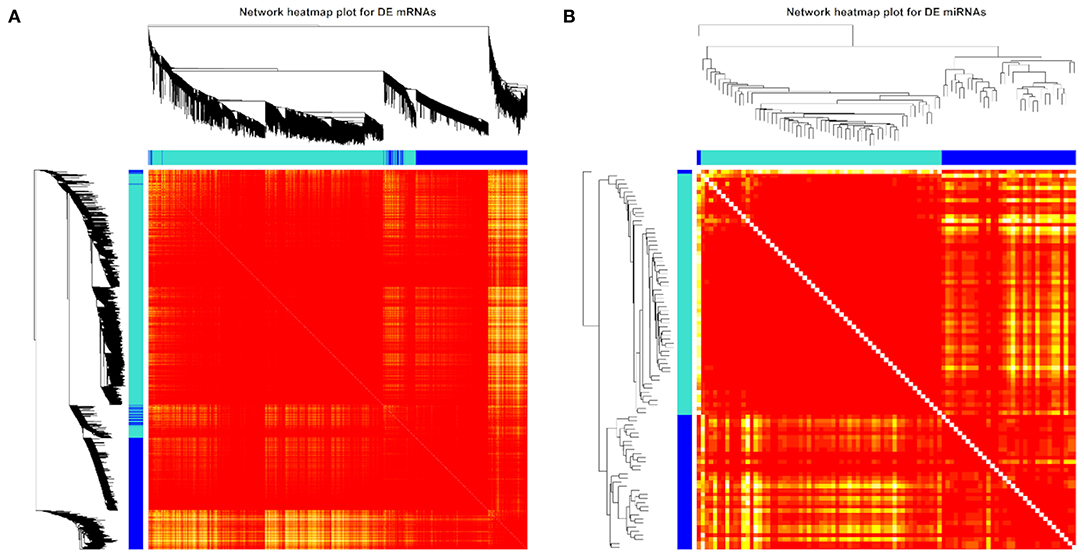
Figure 6. Weighted differentially expressed (DE) (A) mRNA (n = 3,856) and (B) miRNA (n = 93) network heatmap of the co-expression interactions based on the topological overlap matrix (TOM) dissimilarity. The gene dendrogram and module assignment are shown along the left side and the top, where the axe colors indicate the different modules. The color intensity inside the heatmap represents the overlap degree, where a light color represents low overlap and a darker red color represents higher overlap. DE mRNA and miRNA results were achieved from our previous study (31, 32).
Gene Ontology and Pathway Enrichment Analysis
Based on the 2,579 DE mRNAs in the turquoise module, we performed an enrichment analysis to reveal significant GO terms and KEGG pathways. We found that the three most significant GO terms were actin filament-based process (GO:0030029, adjusted P-value = 1.86 × 10⁻⁶) with 37 DE genes that were enriched in, followed by actin cytoskeleton organization (GO:0030036, adjusted P-value = 4.33 × 10⁻⁶) with 34 DE genes, and actin filament organization (GO:0007015, adjusted P-value = 6.86 × 10⁻⁵) with 24 DE genes in the down-regulated category (Figure 7A). Similarly, the three most significant pathways were regulation of actin cytoskeleton (bta04810, adjusted P-value = 1.40 × 10⁻¹¹) with 47 genes, tight junction (bta04530, adjusted P-value = 2.32 × 10⁻⁶) with 33 genes, and axon guidance (bta04360, adjusted P-value = 2.32 × 10⁻⁶) with 33 genes (Figure 7B).
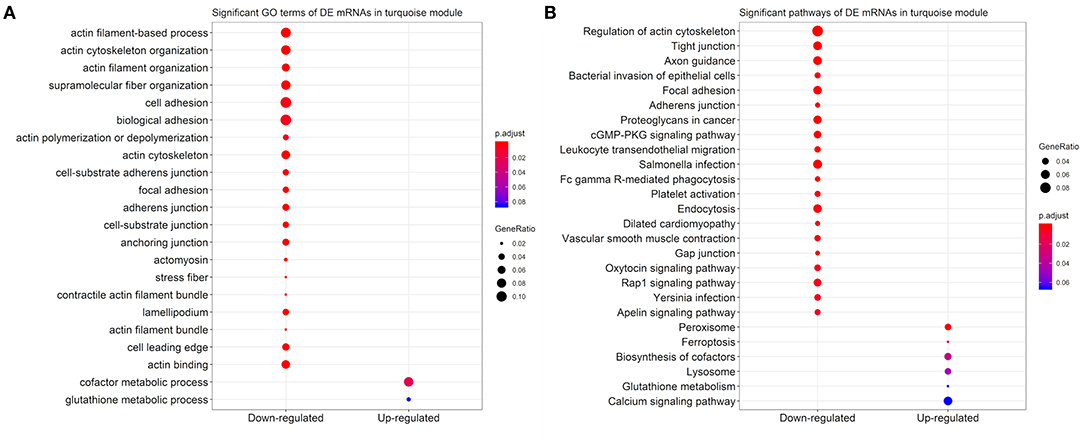
Figure 7. Scatter plots for the significant (A) Gene Ontology (GO) terms and (B) Kyoto Encyclopedia of Genes and Genomes (KEGG) pathways in the down-regulated and up-regulated categories of 2,579 differentially expressed (DE) mRNAs in turquoise module. Only the top 20 significant GO terms and KEGG pathways were visualized.
Networks Displaying the Relationships Among Genes Within Co-expressed Modules
We selected and constructed the network of four genes within the turquoise module including two significantly up-regulated genes, i.e., sushi domain containing 4 (SUSD4) gene and diacylglycerol O-acyltransferase 1 (DGAT1) gene, and two significantly down-regulated genes, i.e., fibroblast growth factor 18 (FGF18) gene and actin gamma 1 (ACTG1) gene (Figure 8). SUSD4 has associations with 186 genes including 8 up-regulated genes and 176 down-regulated genes (Figure 8A). DGAT1 was closely connected with 70 genes where 32 genes were up-regulated (e.g., proliferating cell nuclear antigen, PCNA) and 38 genes were down-regulated (e.g., phosphatase and tensin homolog, PTEN) (Figure 8B). FGF18 and ACTG1 were negatively connected with 36 and 51 up-regulated genes, respectively (Figures 8C,D). The selected hub gene ACTG1 was negatively related with skeletal muscle myosin heavy chain 3 (MYH3) gene, fibroblast growth factor 2 (FGF2) gene, and uncoupling protein-2 (UCP2) (Figure 8D).
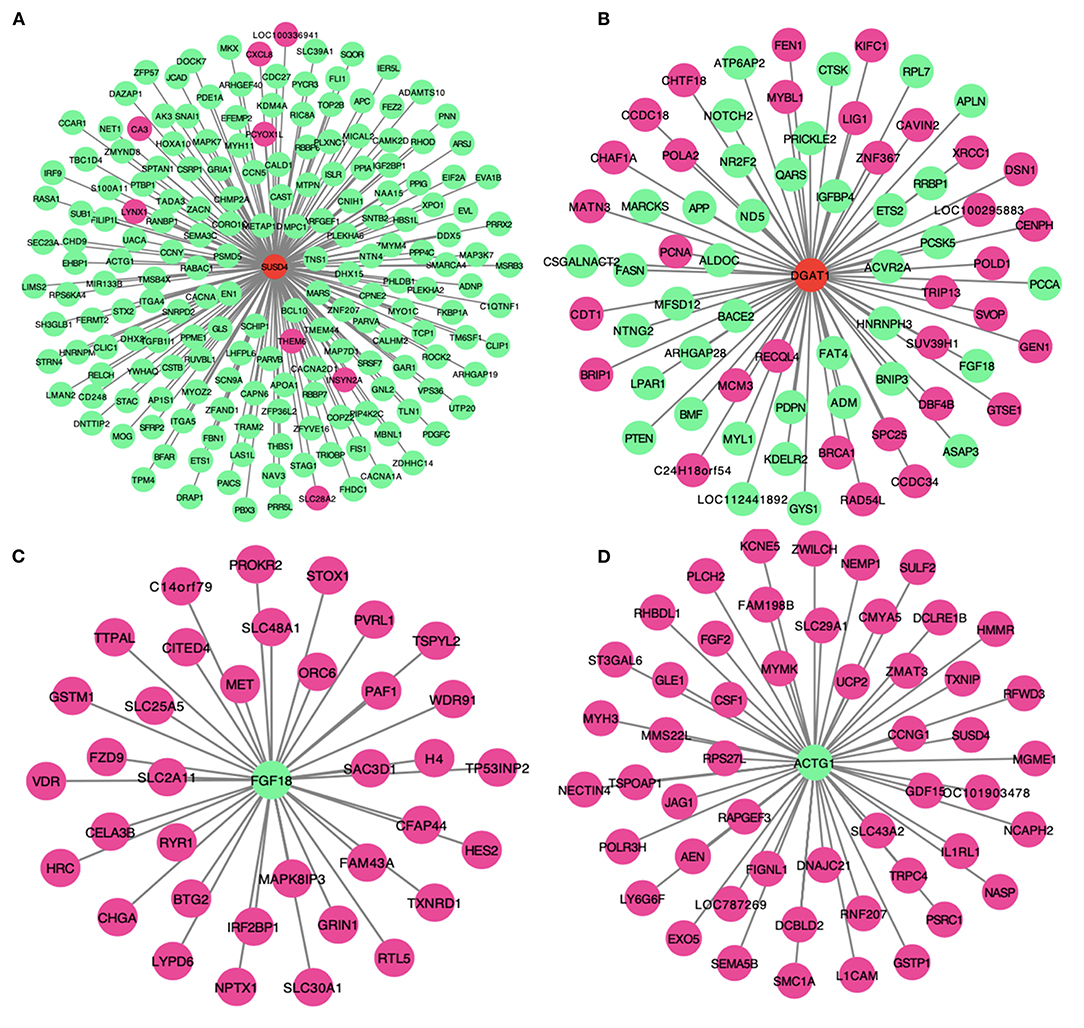
Figure 8. The networks displaying the relationships of four key hub genes within co-expressed turquoise modules, i.e., (A) sushi domain containing 4 (SUSD4) gene, (B) diacylglycerol O-acyltransferase 1 (DGAT1) gene, (C) fibroblast growth factor 18 (FGF18) gene, and (D) actin gamma 1 (ACTG1) gene.
Identification of miRNAs in the Key Module and Target Gene Prediction of the miRNAs for mRNA–miRNA Network
Based on the top significant RSV-induced up- and down-regulated DE miRNAs in the turquoise module, we predicted their target genes. The top four up-regulated miRNAs were bta-miR-34c, bta-miR-432, bta-miR-2344, and bta-miR-154c that targeted 21, 78, 22, and 49 down-regulated genes in the turquoise module, respectively (Figure 9A). Likewise, the top four down-regulated miRNAs, i.e., bta-miR-2310, bta-miR-452, bta-miR-1814c, and bta-miR-199b targeted 59, 62, 58, and 15 up-regulated genes in the turquoise module, respectively, where bta-miR-2310 and bta-miR-1814c targeted the same genes (n = 57) (Figure 9B). Three up-regulated and three down-regulated miRNAs targeted the top up-regulated CDKN1A [adjusted P-value = 2.50 × 10−104 and log2(FC) = 1.97], while five up-regulated and one down-regulated miRNAs targeted the top down-regulated KCNK12 [adjusted P-value = 5.92 × 10−63 and log2(FC) = −2.32] (Figure 9C).
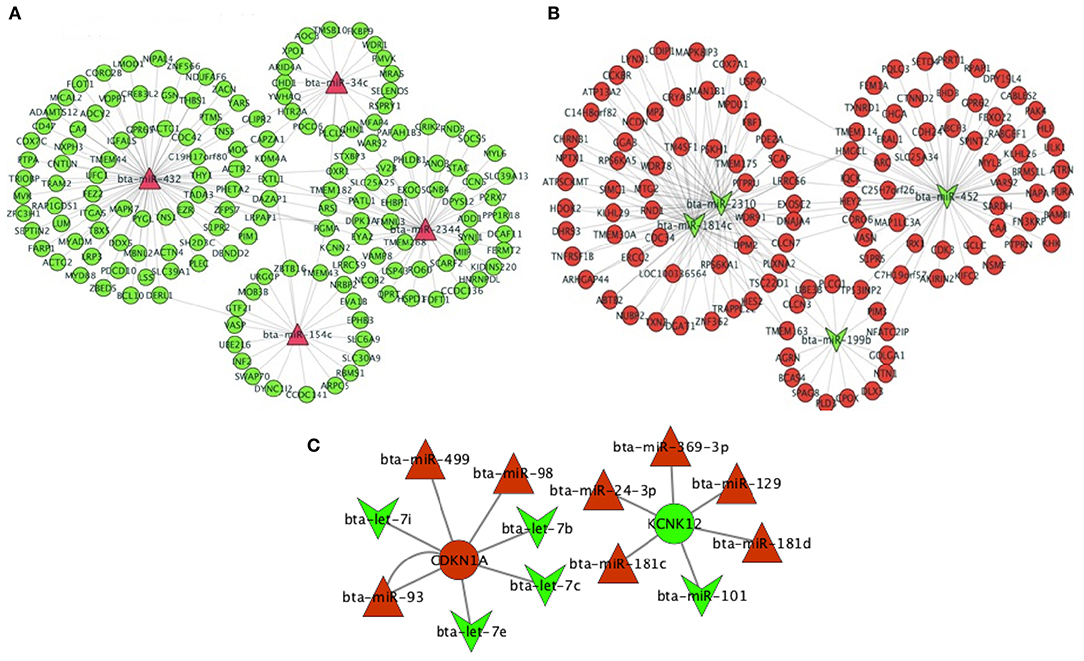
Figure 9. mRNA–miRNA network of the top four differentially expressed (DE) miRNAs in the (A) up-regulated status (bta-miR-34c, bta-miR-432, bta-miR-2344, and bta-miR-154c) and the (B) down-regulated status (bta-miR-199b, bta-miR-2310, bta-miR-1814c, and bta-miR-452) in the key turquoise module and their targeted DE genes. (C) mRNA–miRNA network of the top two DE genes and the targeting DE miRNAs. DE mRNA and miRNA results were achieved from our previous study (31, 32). The green color indicates the down-regulated miRNAs and genes, while the red color indicates the up-regulated miRNAs and genes.
Discussion
Carcass weight is mainly influenced by the number and the size of myoblasts that are generated from somite and through proliferation, differentiation, and fusion into myofibers in an embryonic stage (42). Skeletal muscle fiber characteristics can be divided into fast and slow types based on the contraction speed that can determine the meat quality traits such as marbling (43). Internal (heredity) and external factors (nutrition and environment) are combined to regulate the conversions among the fiber types, such as arginine (44) and linoleic acid (45) that have been considered as the nutrients that influence the conversion of skeletal fiber type. Researchers also analyzed the omics data to reveal the effects of functional feed additives to improve carcass characteristics and beef quality, such as vitamin A, zinc propionate, etc. (46, 47). Our study aims to illustrate the additive effects of natural polyphenol compound RSV on primary bovine myoblast differentiation through transcriptome sequencing.
Resveratrol effects have been extensively studied on various cell types including cardiomyoblasts (8), fibroblasts (7), hepatocytes (48), smooth muscle cells (49), mammary epithelial cells (50), immune cells (6), and a multitude of various cancer cell lines (3). Moreover, researchers paid more attention to the RSV functions on human myoblast proliferation, injury, and death, as well as the resistance against oxidative stress of RSV to the skeletal muscle tissues in livestock (4, 11, 17, 20, 31). In this study, we identified biologically relevant key modules of the co-expressed mRNA and miRNA networks for the differentiation of bovine primary myoblast after RSV treatment. The results showed that the significant modules of DE mRNAs and DE miRNAs were strongly associated with RSV treatment status; for example, the key mRNA module was turquoise module with 2,579 DE mRNAs induced by RSV, where 47 down-regulated DE genes were enriched in the regulation of actin cytoskeleton pathway (Figure 7B). The actin cytoskeleton is essential for cell proliferation, differentiation, migration, phagocytosis, and exocytosis, even when cells experience oxidative damage (51). The actin cytoskeleton is also essential to maintaining the stability of skeletal muscle functions. The absence of ACTG1 resulted in muscle weakness and a progressive myopathy in mice (52); meanwhile, the reduced expression of ACTG1 was closely associated with up-regulated MYH3 induced by RSV (Figure 8D). MYH3 plays an important role in the skeletal muscle metabolism and the content of distinct types of skeletal muscle fibers (53). Thus, we suggested that RSV had functions on the type switch of the primary bovine myoblast fiber, which was consistent with the previous studies of RSV effects on C2C12 cells (54, 55).
Skeletal muscle development is elaborately regulated by myogenic regulatory factors (MRFs), growth factors (e.g., TGF-β and IGFs), signal pathways (e.g., IGF1-Akt-mTOR and Smad2/3 pathway), and non-coding RNAs (miRNAs) (56–58). MiRNAs play important roles in regulating myogenesis and regeneration, hypertrophy and atrophy, muscle disease, and aging (59, 60). In recent years, the identified functions of miRNAs in skeletal muscle development have been widely studied in cattle. Our study also identified 59 DE miRNAs in the turquoise module including bta-miR-432 and bta-miR-365-3p. They were highly expressed in skeletal muscle tissues and differently expressed in the fetal and adult stages of Qinchuan cattle; they may participate in the myoblast differentiation with vital roles (61, 62).
Network construction that integrates miRNA and mRNA data to identify the complex transcriptional regulating mechanism of RSV is more significant to the biological pathways for primary bovine myoblast than a separate analysis. This study found that ACTG1 could be targeted by the significantly RSV-induced up-regulated bta-miR-432 that potentially activated the IGF2/AKT signaling pathway to promote the proliferation and differentiation of myoblasts (61) (Figure 9A). Interestingly, the RSV-induced down-regulated bta-miR-2310 and bta-miR-1814c could co-target 57 RSV-induced up-regulated DE genes, such as DGAT1 that is the functional candidate gene for the improvement of meat and carcass fatness quality in beef cattle (63) (Figure 9B). DGAT1 was also positively connected with the myoblast proliferation gene (PCNA) and negatively related with PTEN, which regulated the skeletal satellite cell proliferation and differentiation (64) (Figure 9B). The RSV-induced miRNAs participated in the complex co-expression networks to regulate primary myoblast differentiation through affecting mRNA expressions, which subsequently participated in regulating skeletal development, metabolism, and skeletal muscle fiber type switch, thereby functionally regulating the cattle carcass weight and meat quality.
Conclusions
In summary, RSV treatments had high correlations with the turquoise module (0.91, P-value = 0.01) and blue module (0.93, P-value < 0.01) using mRNA data, but only had high correlations with the turquoise module (0.96, P-value < 0.01) using miRNA data. The two top GO terms of actin filament-based process (GO:0030029) and actin cytoskeleton organization (GO:0030036) and the two top KEGG pathways of regulation of actin cytoskeleton (bta04810) and tight junction (bta04530) were revealed using 2,579 DE genes in the turquoise module. The mRNA–miRNA network was then constructed based on the co-expressions of DE mRNA and miRNA in the key module. Our study provided a better understanding of the roles of RSV in inducing miRNA and of the characteristics of DE miRNAs in the key co-expressed module in regulation of mRNAs and revealed new candidate regulatory miRNAs and genes for beef quality traits.
Data Availability Statement
The datasets presented in this study can be found in online repositories. The names of the repository/repositories and accession number(s) can be found below: GEO, GSE186730.
Ethics Statement
All the animal procedures were carried out according to the protocols approved by the College of Animal Science and Technology, Northwest A&F University, China. All the experimental animals were approved by the Institutional Animal Care and Use Committee in the College of Animal Science and Technology, Northwest A&F University, China.
Author Contributions
DH performed all the experiments. DH and XW analyzed the data and wrote the manuscript. XW, YY, BT, and L-EH improved the manuscript. HC and BH conceived and designed the experiments. KQ collected experimental samples. All authors contributed to the article and approved the submitted version.
Funding
This work was supported by the National Natural Science Foundation of China (No. 31772574), the Program of National Beef Cattle and Yak Industrial Technology System (CARS-37), the Program of Yunling Scholar and the Young and Middle-aged Academic Technology Leader Backup Talent Cultivation Program in Yunnan Province, China (No. 2018HB045), the Yunnan Provincial Major S&T Project (2019ZG007 and 2019ZG011), and the Doctoral Startup Project of Chuxiong Normal University (No. BSQD2101).
Conflict of Interest
XW was employed by company Konge Larsen ApS.
The remaining authors declare that the research was conducted in the absence of any commercial or financial relationships that could be construed as a potential conflict of interest.
Publisher's Note
All claims expressed in this article are solely those of the authors and do not necessarily represent those of their affiliated organizations, or those of the publisher, the editors and the reviewers. Any product that may be evaluated in this article, or claim that may be made by its manufacturer, is not guaranteed or endorsed by the publisher.
Acknowledgments
DH appreciates the scholarship from the China Scholarship Council, China.
Supplementary Material
The Supplementary Material for this article can be found online at: https://www.frontiersin.org/articles/10.3389/fvets.2021.777477/full#supplementary-material
Abbreviations
ACTG1, actin gamma 1 gene; DGAT1, diacylglycerol acyltransferase-1 gene; DE, differentially expressed; FPKM, fragments per kilobase of transcript sequence per million base pairs sequenced; FDR, false discovery rate; FCs, fold changes; GO, Gene Ontology; IACUC, Institutional Animal Care and Use Committee; MAD, median absolute deviation; mRNAs, messenger RNAs; MRFs, myogenic regulatory factors; MEF2, myocyte enhancer factor 2; RSV, resveratrol; TPM, transcript per million; KEGG, Kyoto Encyclopedia of Genes and Genomes; WGCNA, weighted gene co-expression network analysis.
References
1. Albani D, Polito L, Signorini A, Forloni G. Neuroprotective properties of resveratrol in different neurodegenerative disorders. BioFactors. (2010) 36:370–6. doi: 10.1002/biof.118
2. Hung LM, Chen JK, Huang SS, Lee RS, Su MJ. Cardioprotective effect of resveratrol, a natural antioxidant derived from grapes. Cardiovasc Res. (2000) 47:549–55. doi: 10.1016/S0008-6363(00)00102-4
3. Lin JN, Lin VCH, Rau KM, Shieh PC, Kuo DH, Shieh JC, et al. Resveratrol modulates tumor cell proliferation and protein translation via SIRT1-dependent AMPK activation. J Agric Food Chem. (2010) 58:1584–92. doi: 10.1021/jf9035782
4. Ahmed ST, Hossain ME, Kim GM, Hwang JA, Ji H, Yang CJ. Effects of resveratrol and essential oils on growth performance, immunity, digestibility and fecal microbial shedding in challenged piglets. Asian Aust J Anim Sci. (2013) 26:683–90. doi: 10.5713/ajas.2012.12683
5. Das S, Das DK. Anti-inflammatory responses of resveratrol. Inflamm Allergy Drug Targets. (2007) 6:168–73. doi: 10.2174/187152807781696464
6. Zhou ZX, Mou SF, Chen XQ, Gong LL, Ge WS. Anti-inflammatory activity of resveratrol prevents inflammation by inhibiting NF-κB in animal models of acute pharyngitis. Mol Med Rep. (2018) 17:189–93. doi: 10.3892/mmr.2017.7933
7. Fagone E, Conte E, Gili E, Fruciano M, Pistorio MP, Lo Furno D, et al. Resveratrol inhibits transforming growth factor-β-induced proliferation and differentiation of ex vivo human lung fibroblasts into myofibroblasts through ERK/Akt inhibition and PTEN restoration. Exp Lung Res. (2011) 37:162–74. doi: 10.3109/01902148.2010.524722
8. Leong CW, Wong CH, Lao SC, Leong EC, Lao IF, Law PTW, et al. Effect of resveratrol on proliferation and differentiation of embryonic cardiomyoblasts. Biochem Biophys Res Commun. (2007) 360:173–80. doi: 10.1016/j.bbrc.2007.06.025
9. Kaminski J, Lançon Lançon A, Aires V, Limagne E, Tili E, Michaille JJ, et al. Resveratrol initiates differentiation of mouse skeletal muscle-derived C2C12 myoblasts. Biochem Pharmacol. (2012) 84:1251–9. doi: 10.1016/j.bcp.2012.08.023
10. Dirks Naylor AJ. Cellular effects of resveratrol in skeletal muscle. Life Sci. (2009) 84:637–40. doi: 10.1016/j.lfs.2009.02.011
11. Alway SE, McCrory JL, Kearcher K, Vickers A, Frear B, Gilleland DL, et al. Resveratrol enhances exercise-induced cellular and functional adaptations of skeletal muscle in older men and women. J Gerontol A Biol Sci Med Sci. (2017) 72:1595–606. doi: 10.1093/gerona/glx089
12. Joseph AM, Malamo AG, Silvestre J, Wawrzyniak N, Carey-Love S, Nguyen LMD, et al. Short-term caloric restriction, resveratrol, or combined treatment regimens initiated in late-life alter mitochondrial protein expression profiles in a fiber-type specific manner in aged animals. Exp Gerontol. (2013) 48:858–68. doi: 10.1016/j.exger.2013.05.061
13. Wang D, Sun H, Song G, Yang Y, Zou X, Han P, et al. Resveratrol improves muscle atrophy by modulating mitochondrial quality control in STZ-induced diabetic mice. Mol Nutr Food Res. (2018) 62:1–11. doi: 10.1002/mnfr.201700941
14. Dolinsky VW, Jones KE, Sidhu RS, Haykowsky M, Czubryt MP, Gordon T, et al. Improvements in skeletal muscle strength and cardiac function induced by resveratrol during exercise training contribute to enhanced exercise performance in rats. J Physiol. (2012) 590:2783–99. doi: 10.1113/jphysiol.2012.230490
15. Zhao JX, Li Q, Zhang RX, Liu WZ, Ren YS, Zhang CX, et al. Effect of dietary grape pomace on growth performance, meat quality and antioxidant activity in ram lambs. Anim Feed Sci Technol. (2018) 236:76–85. doi: 10.1016/j.anifeedsci.2017.12.004
16. Zhang C, Zhao X, Wang L, Yang L, Chen X, Geng Z. Resveratrol beneficially affects meat quality of heat-stressed broilers which is associated with changes in muscle antioxidant status. Anim Sci J. (2017) 88:1569–74. doi: 10.1111/asj.12812
17. Zhang C, Wang L, Zhao XH, Chen XY, Yang L, Geng ZY. Dietary resveratrol supplementation prevents transport-stress-impaired meat quality of broilers through maintaining muscle energy metabolism and antioxidant status. Poult Sci. (2017) 96:2219–25. doi: 10.3382/ps/pex004
18. Cheng K, Wang T, Li S, Song Z, Zhang H, Zhang L, et al. Effects of early resveratrol intervention on skeletal muscle mitochondrial function and redox status in neonatal piglets with or without intrauterine growth retardation. Oxid Med Cell Longev. (2020) 2020:1–12. doi: 10.1155/2020/4858975
19. Cheng K, Yu C, Li Z, Li S, Yan E, Song Z, et al. Resveratrol improves meat quality, muscular antioxidant capacity, lipid metabolism and fiber type composition of intrauterine growth retarded pigs. Meat Sci. (2020) 170:108237. doi: 10.1016/j.meatsci.2020.108237
20. Yu Q, Fang C, Ma Y, He S, Ajuwon KM, He J. Dietary resveratrol supplement improves carcass traits and meat quality of Pekin ducks. Poult Sci. (2021) 100802. doi: 10.1016/j.psj.2020.10.056
21. Wang F, Tian X, Zhang L, He C, Ji P, Li Y, et al. Beneficial effect of resveratrol on bovine oocyte maturation and subsequent embryonic development after in vitro fertilization. Fertil Steril. (2014) 101:577–86. doi: 10.1016/j.fertnstert.2013.10.041
22. Li CY, Zhao YH, Hao HS, Wang HY, Huang JM, Yan CL, et al. Resveratrol significantly improves the fertilisation capacity of bovine sex-sorted semen by inhibiting apoptosis and lipid peroxidation. Sci Rep. (2018) 8:7603. doi: 10.1038/s41598-018-25687-z
23. Ma T, Wu W, Tu Y, Zhang N, Diao Q. Resveratrol affects in vitro rumen fermentation, methane production and prokaryotic community composition in a time- and diet-specific manner. Microb Biotechnol. (2020) 13:1118–31. doi: 10.1111/1751-7915.13566
24. Hocquette JF, Botreau R, Picard B, Jacquet A, Pethick DW, Scollan ND. Opportunities for predicting and manipulating beef quality. Meat Sci. (2012) 92:197–209. doi: 10.1016/j.meatsci.2012.04.007
25. Bassel GW, Glaab E, Marquez J, Holdsworth MJ, Bacardit J. Functional network construction in arabidopsis using rule-based machine learning on large-scale data sets. Plant Cell. (2011) 23:3101–16. doi: 10.1105/tpc.111.088153
26. Stuart JM, Segal E, Koller D, Kim SK. A gene-coexpression network for global discovery of conserved genetic modules. Science. (2003) 302:249–55. doi: 10.1126/science.1087447
27. Weirauch MT. Gene coexpression networks for the analysis of DNA microarray data. In: Dehmer M, Emmert-Streib F, Graber A, Salvador A, editors. Applied Statistics for Network Biology: Methods in Systems Biology. New York, NY: John Wiley & Sons (2011). p. 215–50. doi: 10.1002/9783527638079.ch11
28. De Oliveira PSN, Coutinho LL, Tizioto PC, Cesar ASM, de Oliveira GB, Diniz WJ, et al. An integrative transcriptome analysis indicates regulatory mRNA-miRNA networks for residual feed intake in Nelore cattle. Sci Rep. (2018) 8:17072. doi: 10.1038/s41598-018-35315-5
29. Novais FJ, Pires PRL, Alexandre PA, Dromms RA, Iglesias AH, Ferraz JBS, et al. Identification of a metabolomic signature associated with feed efficiency in beef cattle. BMC Genomics. (2019) 20:1–10. doi: 10.1186/s12864-018-5406-2
30. Fan Y, Arbab AAI, Zhang H, Yang Y, Nazar M, Han Z, et al. Lactation associated genes revealed in holstein dairy cows by weighted gene co-expression network analysis (WGCNA). Animals. (2021) 11:1–16. doi: 10.3390/ani11020314
31. Hao D, Wang X, Wang X, Thomsen B, Kadarmideen HN, Lan X, et al. Transcriptomic changes in bovine skeletal muscle cells after resveratrol treatment. Gene. (2020) 754:144849. doi: 10.1016/j.gene.2020.144849
32. Hao D, Wang X, Wang X, Thomsen B, Qu K, Lan X, et al. Resveratrol stimulates microRNA expression during differentiation of bovine primary myoblasts. Food Nutr Res. (2021) 65:1–9. doi: 10.29219/fnr.v65.5453
33. Langmead B, Trapnell C, Pop M, Salzberg SL. Ultrafast and memory-efficient alignment of short DNA sequences to the human genome. Genome Biol. (2009) 10:R25. doi: 10.1186/gb-2009-10-3-r25
34. Friedländer MR, MacKowiak SD, Li N, Chen W, Rajewsky N. MiRDeep2 accurately identifies known and hundreds of novel microRNA genes in seven animal clades. Nucleic Acids Res. (2012) 40:37–52. doi: 10.1093/nar/gkr688
35. Zhou L, Chen J, Li Z, Li X, Hu X, Huang Y, et al. Integrated profiling of microRNAs and mRNAs: microRNAs located on Xq273 associate with clear cell renal cell carcinoma. PLoS ONE. (2010). 5:e15224. doi: 10.1371/journal.pone.0015224
36. Anders S, Huber W. Differential expression analysis for sequence count data. Genome Biol. (2010) 11:R106. doi: 10.1186/gb-2010-11-10-r106
37. Langfelder P, Horvath S. WGCNA: An R package for weighted correlation network analysis. BMC Bioinformatics. (2008) 9:559. doi: 10.1186/1471-2105-9-559
38. Silva-Vignato B, Coutinho LL, Poleti MD, Cesar ASM, Moncau CT, Regitano LCA, et al. Gene co-expression networks associated with carcass traits reveal new pathways for muscle and fat deposition in Nelore cattle 06 Biological Sciences 0604 Genetics. BMC Genomics. (2019) 20:32. doi: 10.1186/s12864-018-5345-y
39. Yu G, Wang LG, Han Y, He QY. clusterProfiler: an R package for comparing biological themes among gene clusters. OMICS J Integr Biol. (2012) 16:284–7. doi: 10.1089/omi.2011.0118
40. Chen C, Chen H, Zhang Y, Thomas HR, Frank MH, He Y, et al. TBtools: an integrative toolkit developed for interactive analyses of big biological data. Mol Plant. (2020) 13:1194–202. doi: 10.1016/j.molp.2020.06.009
41. Rehmsmeier M, Steffen P, Höchsmann M, Giegerich R. Fast and effective prediction of microRNA/target duplexes. RNA. (2004) 10:1507–17. doi: 10.1261/rna.5248604
42. Mueck T, Berger F, Buechsler I, Valchanova RS, Landuzzi L, Lollini PL, et al. TRAF6 regulates proliferation and differentiation of skeletal myoblasts. Differentiation. (2011) 81:99–106. doi: 10.1016/j.diff.2010.11.002
43. Hwang YH, Kim GD, Jeong JY, Hur SJ, Joo ST. The relationship between muscle fiber characteristics and meat quality traits of highly marbled Hanwoo (Korean native cattle) steers. Meat Sci. (2010) 86:456–61. doi: 10.1016/j.meatsci.2010.05.034
44. Chen X, Guo Y, Jia G, Liu G, Zhao H, Huang Z. Arginine promotes skeletal muscle fiber type transformation from fast-twitch to slow-twitch via Sirt1/AMPK pathway. J Nutr Biochem. (2018) 61:155–62. doi: 10.1016/j.jnutbio.2018.08.007
45. Lu ZQ, Ren Y, Zhou XH, Yu XF, Huang J, Yu DY, et al. Maternal dietary linoleic acid supplementation promotes muscle fibre type transformation in suckling piglets. J Anim Physiol Anim Nutr. (2017) 101:1130–6. doi: 10.1111/jpn.12626
46. Diniz WJS, Mazzoni G, Coutinho LL, Banerjee P, Geistlinger L, Cesar ASM, et al. Detection of co-expressed pathway modules associated with mineral concentration and meat quality in nelore cattle. Front Genet. (2019) 10:210. doi: 10.3389/fgene.2019.00210
47. Knutson EE, Menezes ACB, Sun X, Fontoura ABP, Liu JH, Bauer ML, et al. Effect of feeding a low-vitamin A diet on carcass and production characteristics of steers with a high or low propensity for marbling. Animal. (2020) 14:2308–14. doi: 10.1017/S1751731120001135
48. Gnoni GV, Paglialonga G. Resveratrol inhibits fatty acid and triacylglycerol synthesis in rat hepatocytes. Eur J Clin Invest. (2009) 39:211–8. doi: 10.1111/j.1365-2362.2008.02077.x
49. Li H, Xia N, Hasselwander S, Daiber A. Resveratrol and vascular function. Int J Mol Sci. (2019) 20:1–16. doi: 10.3390/ijms20092155
50. Licznerska B, Szaefer H, Wierzchowski M, Sobierajska H, Baer-Dubowska W. Resveratrol and its methoxy derivatives modulate the expression of estrogen metabolism enzymes in breast epithelial cells by AhR down-regulation. Mol Cell Biochem. (2017) 19:1907–14. doi: 10.1007/s11010-016-2871-2
51. Davidson AJ, Wood W. Unravelling the actin cytoskeleton: a new competitive edge? Trends Cell Biol. (2016) 26:569–76. doi: 10.1016/j.tcb.2016.04.001
52. Rubenstein PA. The functional importance of multiple actin isoforms. BioEssays. (1990) 12:309–15. doi: 10.1002/bies.950120702
53. Cho IC, Park HB, Ahn JS, Han SH, Lee JB, Lim HT, et al. A functional regulatory variant of MYH3 influences muscle fiber-type composition and intramuscular fat content in pigs. PLoS Genet. (2019) 15:e1008279. doi: 10.1371/journal.pgen.1008279
54. Jiang Q, Cheng X, Cui Y, Xia Q, Yan X, Zhang M, et al. Resveratrol regulates skeletal muscle fibers switching through the AdipoR1-AMPK-PGC-1α pathway. Food Funct. (2019) 10:3334–43. doi: 10.1039/c8fo02518e
55. Wen W, Chen X, Huang Z, Chen D, Chen H, Luo Y, et al. Resveratrol regulates muscle fiber type conversion via miR-22-3p and AMPK/SIRT1/PGC-1α pathway. J Nutr Biochem. (2020) 77:108297. doi: 10.1016/j.jnutbio.2019.108297
56. Perry RL, Rudnick MA. Molecular mechanisms regulating myogenic determination and differentiation. Front Biosci. (2000) 5:d750–67. doi: 10.2741/a548
57. Goljanek-Whysall K, Sweetman D, Münsterberg AM. microRNAs in skeletal muscle differentiation and disease. Clin Sci. (2012) 123:611–25. doi: 10.1042/CS20110634
58. Schiaffino S, Dyar KA, Ciciliot S, Blaauw B, Sandri M. Mechanisms regulating skeletal muscle growth and atrophy. FEBS J. (2013) 280:4294–314. doi: 10.1111/febs.12253
59. Güller I, Russell AP. MicroRNAs in skeletal muscle: their role and regulation in development, disease and function. J Physiol. (2010) 588:4075–87. doi: 10.1113/jphysiol.2010.194175
60. Zheng Y, Kong J, Li Q, Wang Y, Li J. Role of miRNAs in skeletal muscle aging. Clin Interv Aging. (2018) 13:2407–19. doi: 10.2147/CIA.S169202
61. Wang X, Cao X, Dong D, Shen X, Cheng J, Jiang R, et al. Circular RNA TTN acts as a miR-432 sponge to facilitate proliferation and differentiation of myoblasts via the IGF2/PI3K/AKT signaling pathway. Mol Ther Nucl Acids. (2019) 18:966–80. doi: 10.1016/j.omtn.2019.10.019
62. Hao D, Wang X, Wang X, Thomsen B, Yang Y, Lan X, et al. MicroRNA bta-miR-365-3p inhibits proliferation but promotes differentiation of primary bovine myoblasts by targeting the activin A receptor type I. J Anim Sci Biotechnol. (2021) 12:!6. doi: 10.1186/s40104-020-00528-0
63. Li X, Ekerljung M, Lundström K, Lundén A. Association of polymorphisms at DGAT1, leptin, SCD1, CAPN1 and CAST genes with color, marbling and water holding capacity in meat from beef cattle populations in Sweden. Meat Sci. (2013) 94:153–8. doi: 10.1016/j.meatsci.2013.01.010
Keywords: primary bovine myoblast, resveratrol, differentially expressed analysis, WGCNA, mRNA co-expression, miRNA co-expression, mRNA-miRNA network
Citation: Hao D, Wang X, Yang Y, Thomsen B, Holm L-E, Qu K, Huang B and Chen H (2021) Integrated Analysis of mRNA and MicroRNA Co-expressed Network for the Differentiation of Bovine Skeletal Muscle Cells After Polyphenol Resveratrol Treatment. Front. Vet. Sci. 8:777477. doi: 10.3389/fvets.2021.777477
Received: 15 September 2021; Accepted: 15 November 2021;
Published: 24 December 2021.
Edited by:
Sunday O. Peters, Berry College, United StatesCopyright © 2021 Hao, Wang, Yang, Thomsen, Holm, Qu, Huang and Chen. This is an open-access article distributed under the terms of the Creative Commons Attribution License (CC BY). The use, distribution or reproduction in other forums is permitted, provided the original author(s) and the copyright owner(s) are credited and that the original publication in this journal is cited, in accordance with accepted academic practice. No use, distribution or reproduction is permitted which does not comply with these terms.
*Correspondence: Bizhi Huang, hbz@ynbp.cn; Hong Chen, chenhong1212@263.net
†These authors have contributed equally to this work