How Does Citizen Science Compare to Online Survey Panels? A Comparison of Food Knowledge and Perceptions Between the Zooniverse, Prolific and Qualtrics UK Panels
 Beth Armstrong1*
  Christian Reynolds1,2
  Gemma Bridge3
  Libby Oakden1
  Changqiong Wang4
  Luca Panzone5
  Ximena Schmidt Rivera6
  Astrid Kause7
  Charles Ffoulkes8 Coleman Krawczyk9 Grant Miller10
  Stephen Serjeant11
- 1Department of Geography, Faculty of Social Sciences, The University of Sheffield, Sheffield, United Kingdom
- 2Center for Food Policy, City, University of London, London, United Kingdom
- 3Leeds Business School, Leeds Beckett University, Leeds, United Kingdom
- 4Wolfson Institute of Preventive Medicine, Barts and The London School of Medicine & Dentistry, Queen Mary University of London, London, United Kingdom
- 5School of Natural and Environmental Sciences, Newcastle University, Newcastle upon Tyne, United Kingdom
- 6College of Engineering, Design and Physical Sciences, Institute of Energy Futures, Brunel University London, Uxbridge, United Kingdom
- 7Center for Decision Research & Priestley International Center for Climate, University of Leeds, Leeds, United Kingdom
- 8Agricultural Development Advisory Service, Wolverhampton, United Kingdom
- 9Institute of Cosmology and Gravitation, University of Portsmouth, Portsmouth, United Kingdom
- 10Zooniverse, Oxford, United Kingdom
- 11Faculty of Science, Technology, Engineering and Mathematics, School of Physical Sciences, Open University, Milton Keynes, United Kingdom
With an increasing focus on the uptake of healthy and sustainable diets, a growing body of research has explored consumer perceptions and understanding of the environmental impacts and safety of foods. However, this body of research has used a wide range of methods to recruit participants, which can influence the results obtained. The current research explores the impact of different recruitment methods upon observed estimations of the carbon footprint (gCO2e), energy content (Kcal), food safety and animal using three different online recruitment platforms; Qualtrics (N = 397), Prolific (N = 407), Zooniverse (N~601, based on unique IP addresses). Qualtrics and Prolific participants rated the carbon footprint, energy content, food safety and animal welfare of all foods in the survey. Zooniverse citizens rated the carbon footprint or energy content then food safety or animal welfare of all foods in the survey. Kruskal-Wallis and Chi-square analyses compared the energy content and carbon footprint estimations with validated values, and differences in estimate accuracy and perceptions between recruitment methods. Participants were unable to accurately estimate the carbon footprint and energy content of foods. The carbon footprint of all foods were overestimated, with the exception of beef and lamb which was underestimated. The calorie content of fruits and vegetables are typically overestimated. Perceptions of animal welfare and food safety differed by recruitment method. Zooniverse citizens rated animal welfare standards to be lower for meat products and eggs, compared to Qualtrics and Prolific participants. Overall, Qualtrics participants typically held the highest food risk perceptions, however this varied by food type. The lack of knowledge about the carbon footprint and energy content of foods demonstrates the need for consumer education and communication to enable the move toward healthier and more sustainable diets. Perceptions of food safety and animal welfare demonstrate a baseline from which to develop consumer focused communications and governance. We have shown that different recruitment tools can result in differences in observed perceptions. This highlights the need to carefully consider the recruitment tool being used in research when assessing participant knowledge and perceptions.
Introduction
Food production and agriculture contributes 20–30% of global greenhouse gas emissions (GHGE) (Poore and Nemecek, 2018; Kause et al., 2019). By nudging consumers toward a healthy and sustainable diets the environmental impact of the food system (CCC, 2020) and burden of diet-related chronic diseases such as obesity, diabetes, heart disease could be reduced (Rolls et al., 2002; Steenhuis and Vermeer, 2009; Miyazaki et al., 2011).
Though dietary guidelines, advice and policy promote the consumption of healthy and sustainable diets, (Health Council of the Netherlands, 2011; Ministers NC of, 2014; Reynolds et al., 2014; Monteiro et al., 2015; Fischer and Garnett, 2016; Freidberg, 2016; van't Veer et al., 2017; CCC, 2020) a disconnect has been identified between bodies providing advice and the knowledge held by the public.
Consumers typically misestimate the carbon footprint and energy content of foods (Carels et al., 2007; Chernev and Chandon, 2010; Lee et al., 2012; Holmstrup et al., 2013; Liu et al., 2015; Jones et al., 2016; Panzone et al., 2016; Shi et al., 2018; Camilleri et al., 2019; Armstrong and Reynolds, 2020; Armstrong et al., 2020). Consumers frequently misestimate the portion size and energy content of foods. In addition to contributing to over-consumption and leading to diet-related chronic diseases, misestimating portion size can create food waste which contributes to climate change (Rolls et al., 2002; Steenhuis and Vermeer, 2009; Miyazaki et al., 2011). As perceptions of energy density and carbon footprint of food are associated with purchase intention (Armstrong and Reynolds, 2020), understanding the current level of consumer knowledge about the calorie content and carbon footprint of foods provides an evidence base to develop interventions which will effectively nudge consumers toward healthier and more sustainable diets (Cohen and Story, 2014; Camilleri et al., 2019). In addition to assessing differences in consumer knowledge of energy density and carbon footprint of foods between recruitment platforms, the current research will explore consumer perceptions of animal welfare and food safety/risk.
Consumers within developed countries are increasingly concerned with animal welfare (Cornish et al., 2019) and perceptions of animal welfare can influence choice of dairy and meat products (De Graaf et al., 2016; Cornish et al., 2019). High animal welfare standards are associated with greater food safety, quality and taste (Harper and Henson, 2001; Röhr et al., 2005; Cicia et al., 2016; Armstrong et al., 2020). However, it is debated whether the cost of a product has a greater impact on purchases than welfare (Harper and Henson, 2001; Cicia et al., 2016). Cornish et al. (2019) explored the relationship between animal welfare attitudes and purchasing habits on Austrian consumers. Although 92% of consumers reported concern about animal welfare, the perceived cost and availability of the high-welfare products limited purchases, with 76, 53, and 31% of consumers reporting the purchase of high welfare eggs, chicken and pork, demonstrating the role of cost of the intention-behavior gap. Cornish et al. (2019) proposed that policy makers and food producers should promote the benefits of and explore cost-effective methods to provide high welfare animal products to align with consumer preferences.
Food safety perception is an important factor in influencing consumer product choice (van Rijswijk and Frewer, 2008). Consumers has become increasingly concerned with food safety and many factors such as (dis)trust in regulators, information providers, scientific institutions, knowledge of production methods, and media communications, especially following food scares (Frewer, 2001; Grunert, 2005; Röhr et al., 2005; Lobb et al., 2007). As consumer perceptions of food safety are influenced by a range of factors and impact food choices, it is necessary to assess current perceptions of food safety and identify whether these differ between recruitment groups.
With an increasing focus on the uptake of healthy and sustainable diets, a growing body of research aims to explore consumer knowledge and perception of foods. However, a range of methods have been used to recruit participants.
The methods used to collect participant data are continuously developing and the methods themselves are a focal point of research. Previous research has demonstrated that using different methods of data collection may impact results. Survey responses, response rate, and associated cost differ between paper based (posted) and online data collection methods however respondent demographics also differ (McDonald and Adam, 2003). Conversely, Ward et al. (2012) conducted a comparison of six scales using paper based and online data collection. The same demographic group (college students) were used for each sample. Differences in response between the paper based and online data collection methods were observed for two of the six scales. Ward et al. (2012) propose that the differences in two scales (The way I feel about myself; Leisure satisfaction) are due to the greater perceived anonymity when answering online surveys, which allow participants to be more honest when answering sensitive questions.
Similarly, a wide range of online recruitment platforms are now available to aid recruitment however each method platform presents inherent flaws (Lowry et al., 2016). As with the comparisons between paper based and online methods, the use of different online recruitment tools can impact response data and panel cohorts can vary by demographics, participant naivety, and data quality (McDonald and Adam, 2003, Ward et al., 2012).
MTurk, Qualtrics and Prolific are three commonly used online recruitment and data collection tools. MTurk has been widely adopted in academic research (e.g., Mellis and Bickel, 2020). However, with no minimum pay for taking part in surveys, concerns around low wages MTurkers may receive led to debate of whether the platform provides an ethical method to collect data (Moss et al., 2020). Prolific provides an alternative recruitment platform to MTurk, which requires participants to be paid a minimum hourly wage. A comparison of Prolific and MTurk, concluded that Prolific has greater functionality than MTurk, and though providing a minimum wage may limit some research groups, this provides a more ethical recruitment method (Palan and Schitter, 2018).
Existing research comparing data from different online recruitment tools has demonstrated differences between the platforms. A comparison of self-report demographic and sexual behavior reported in a clinic, via MTurk and Qualtrics demonstrated differences in demographics, sexual history, substance use, knowledge and attitudes between MTurk and Qualtrics panel (Beymer et al., 2018). A comparison of MTurk, Prolific and Faircrowd (formally Crowdflower), found differences between the recruitment platforms, it was found that Prolific and MTurk produced higher quality data than Crowdflower, though Prolific participants were more naive, less dishonest and from a more diverse demographic than MTurkers, though demographic biases were still apparent (Peer et al., 2017).
Citizen science offers an alternative to traditional data collection methods, aiming to engage a broader and larger audience, enabling citizens to take part in the research process and providing an outlet to educate participants about the topics interacting with (van't Veer et al., 2017; European Citizen Science Association, 2019). Though citizen science has been widely used in many academic disciplines (e.g., Dickinson et al., 2010), there is a paucity of citizen science within the nutrition literature (Ryan et al., 2018) with only a handful of studies using this method (e.g., Armstrong et al., 2020).
The current research explores the impact of different recruitment platforms upon observed estimations of the carbon footprint (gCO2e), energy content (Kcal), food safety and animal welfare of 30 different foods. We are not aware of any studies to date that have compared food knowledge and attitudes of participants recruited from citizen science platforms with online recruitment panels. Expanding the traditional use of citizen science platforms as a method to train citizens and gather “classifications,” we explore the use of citizen science as a method of gathering consumer knowledge and attitudes. We provide a comparison of citizen science methods and online survey panels, providing an insight into the functionality and limitations of the methods as data collection tools. In addition, we discuss qualitative survey feedback from citizens who completed the survey on the Zooniverse platform.
Methods
Survey Platforms
Two online panel recruitment platforms (Qualtrics, Prolific) and one citizen science platform (Zooniverse) were used in the current study.
Qualtrics is a global online survey tool with a panel of over 100 million participants. The tool offers a range of recruitment options including the ability to recruit a nationally representative sample. Participants are registered users who are paid for completing the survey. Prolific is an international recruitment tool for online research with 125,817 active participants (in the last 3 months).
Prolific does not host surveys, researchers must link their project to an external survey tool e.g., (Qualtrics, 2020) (www.qualtrics.com/), (SurveyMonkey, 2020) (www.surveymonkey.co.uk/), Gorilla (www.gorilla.sc/). Prolific offers the option to recruit by demographics, hobbies or to recruit a nationally representative sample. Participants must be registered users and are paid a minimum of £5.00/h (recommended over £7.80/h) for completing a survey.
The Zooniverse platform was selected as it is the largest citizen science platform on the internet with over 900,000 registered citizens (Smith et al., 2013; Simpson et al., 2014). Researchers can use the Zooniverse platform to create projects and recruit either Zooniverse citizens (public), a select group of “beta” citizens, or via a project link to the survey (private) which can be distributed to a specific participant group. Due to the functionality of the platform it is not possible to gather demographic data from citizens (with the exception of fully registered citizens). Citizen science aims to recruit a diverse range of citizens, however demographics such as gender and age group can vary by project topic (Spiers et al., 2018). Citizens take part in the research on a voluntary basis and do not receive payment for completing the survey.
Recruitment
Participants were recruited via Qualtrics, Prolific and the Zooniverse beta community. Three-hundred and ninety-seven adults (age M = 38.98 years, SD = 14.51, 71% female) living in the UK were recruited using Qualtrics between 13th March and 5th April 2020. Four-hundred and seven adults (age M = 36.54 years, SD = 13.61, 70% female) living in the UK were recruited using Prolific between 13th January and 6th February 2020. Participants recruited via Qualtrics and Prolific were registered panel members and received payment for completing the survey.
Approximately six-hundred and one participants (based on the number of unique IP addresses) took part in the Zooniverse platform survey between 20th February and 2nd March 2020. Participants were recruited from the beta community who received a survey invitation and link via a Zooniverse mailing list. Due to the functionality of the platform demographic information was not recorded. Participants were not paid to take part in the study and completed the survey on a voluntary basis.
Materials
Thirty foods [fruits and vegetables (potato, carrots, tomatoes, frozen peas, cabbage, cauliflower, mushrooms, onion, apple, orange, banana, strawberries, canned chickpeas, baked beans); meat and fish (bacon, beef, lamb, pork, chicken, white fish, oily fish); eggs and dairy (milk, full-fat cheese, low-fat cheese, eggs); grains and cereals (pasta, rice, bread, muesli); other (Quorn mince)] with a range of carbon footprint and energy density values were chosen. Photos of each food, were taken by a professional photographer, in a style similar to food portion guides [such as the Intake24 image bank (Simpson et al., 2017; Newcastle University, Food Standards Scotland, 2018)] – e.g. reference plate for scale; consistent angle, distance size, lighting etc. The portion sizes used were the typical (average) portion size of each food reported in the Waves 1-4 National Diet and Nutrition Survey (Public Health England, 2014). Each image was displayed with a text description and weight (grams) of the portion displayed (e.g., bread 100 g).
The carbon footprint values (kgCO2e/100 g product) used represent average emissions to produce primary food commodities to the point of the regional distribution center in the UK. The carbon footprint values (kgCO2e/100 g product) were based on data published by Audsley et al. (2010), Clune et al. (2017), and Poore and Nemecek (2018).
The energy content (Kcal/100 g) was taken from the National Diet and Nutrition Survey databank (Public Health England, 2014).
Procedure
Zooniverse
Before taking part in the survey participants were presented with study information in a “tutorial” which informed participants what they would be asked in the survey and provided brief explanations of energy content, carbon footprints, animal welfare, and food safety. Each explanation included examples e.g., A chocolate bar (~50 g) contains 240 Calories (kcal) worth of energy; a bread roll (~112 g) has a carbon footprint of 5 g of CO2; high risk foods include meat, fish, chicken, milk; higher animal welfare products include free-range eggs, line-caught wild salmon. The tutorial could be accessed by the participant at any point during the survey.
Due to the functionality of the Zooniverse platform eight “workflows” of the survey were created to allow counterbalancing of the variables. Participants were randomly allocated to a workflow. The workflows included questions about energy content density (0–930 kcal) or carbon footprint (0–8180 gCO2e), and animal welfare (low welfare 0—high welfare 10) or food safety (low risk 0—high risk 10) for each of the 30 foods. Due to the functionality of the platform (i.e., tasks/questions are shown for each image), animal welfare was asked for non-animal foods. Participants were also asked their typical cooking method and cooking time for the featured foods. The findings of the cooking method and time data are not addressed in this article. Each workflow included the 30 foods. Participants indicated their response using a slider tool which was set to zero as default. Participants could complete as many questions as they wanted and could retire from the survey at any time. After the participants engaged with the survey on the Zooniverse platform, they were given the option of giving feedback on the survey—part of the citizen community engagement with the research, and is typical of Zooniverse research. This was collected as a google form by Zooniverse and the aggregated results provided back to the research team.
Prolific
Participants recruited via Prolific were redirected to and then completed a survey hosted on Qualtrics. Participants were provided with study information and provided consent before taking part in the study. The survey consisted of two sections. The first section of the survey contained questions about demographics, food preparation, and cooking habits. The second section contained questions about carbon footprint, energy content, food safety, and animal welfare. The order of the topics was randomized. Each question topic included a brief description and examples of the concept (comparable to that provided in the Zooniverse “tutorial”). Participants indicated their estimate of energy density (0–930 kcal), carbon footprint (0–8180 gCO2e), animal welfare (low welfare 0—high welfare 10) and food safety (low risk 0—high risk 10) for each of the 30 foods via a slider tool.
Qualtrics
Participants were recruited via an advert on Qualtrics. The advert redirected participants to the survey which was hosted on Qualtrics. Participants were provided with study information and provided consent before taking part in the study. The first section of the survey contained questions about demographics, food preparation, and cooking habits. The second section asked participants to provide estimations of the energy content (0–930 kcal), carbon footprint (0–8180 gCO2e), animal welfare (low welfare 0—high welfare 10) and food safety (low risk 0—high risk 10) for each of the 30 foods.
Data Analysis
The software SPSS (Statistical Package for the Social Sciences) version 26 (IBM Corp, 2019) was used to conduct a series of Chi-square, Kruskal Wallis H tests and subsequent pairwise comparisons (Bonferroni corrections applied) to explore how estimates of energy content, carbon footprint, animal welfare standards, and food safety differ by recruitment method (Zooniverse Beta, Prolific, Qualtrics). Estimations of energy content were classified as “below range,” “in range,” or “above range” against validated figures (Public Health England, 2014). As the energy content of foods, and accuracy tolerance of food labels can vary, estimates within a ±10% range of approved figures were classified as “in range” (European Commission, 2012; Public Health England, 2012; Jumpertz et al., 2013). In line with energy content estimations, carbon footprint estimations were classified as “below range,” “in range,” or “above range” against validated figures (Clune et al., 2017; Poore and Nemecek, 2018) using a ±10% tolerance. As the food safety/risk and animal welfare perceptions are not metrics and do not have validated figures, these will not be classified using a ±10% tolerance (as with energy density and carbon footprint) but will be compared with the perceptions of other foods.
Results
Carbon Footprint Perception
Overall, only 2% of carbon footprint estimates were within the designated range (±10% range). The majority of participants overestimated the carbon footprint (87.5%) with fewer underestimating the value (10.5%), [H(2) = 29866.88, p < 0.001].
We observe a difference in carbon footprint estimation values between recruitment method [H(2) = 112.59, p < 0.001], with Zooniverse Beta citizens (mean rank = 9776.40) and Prolific participants (mean rank = 11054.23) providing lower estimations than Qualtrics participants (mean rank = 11527.50), [H(2) = 112.59, p < 0.001].
Next we consider how the accuracy of carbon footprint estimations (±10% gCO2 range) differ by recruitment method (see Table 1). Participants recruited via Zooniverse Beta, Qualtrics and Prolific typically overestimate carbon footprint values [χ(4) = 523.53, p < 0.001], few estimations are within range across all recruitment methods. Zooniverse Beta citizens underestimate carbon footprint values more often compared to Qualtrics and Prolific participants, though Qualtrics and Prolific participants did not differ (see Table 1).
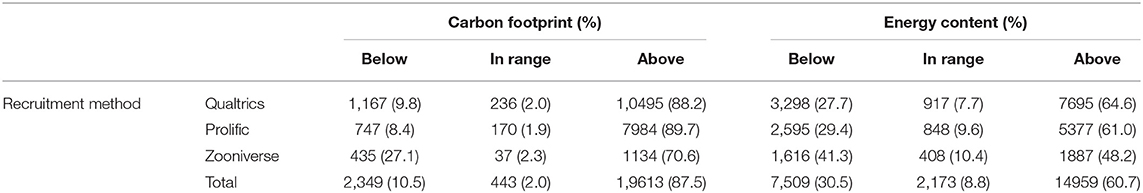
Table 1. Accuracy of carbon footprint and energy content estimates of each recruitment method.
Accuracy of estimation differed by food type, [χ(58) = 5552.51, p < 0.001] with the carbon footprint of all foods being overestimated (e.g., above -+10% gCO2 range: Quorn 92.3%; potato 97.7%; beans 92.2%) except beef and lamb which was more frequently underestimated, (below -+10% gCO2 range: beef 57.5%; lamb 58.3%), [(see Figure 1), (see Supplementary Material, SM1 for estimation classifications of each food and recruitment platform)].
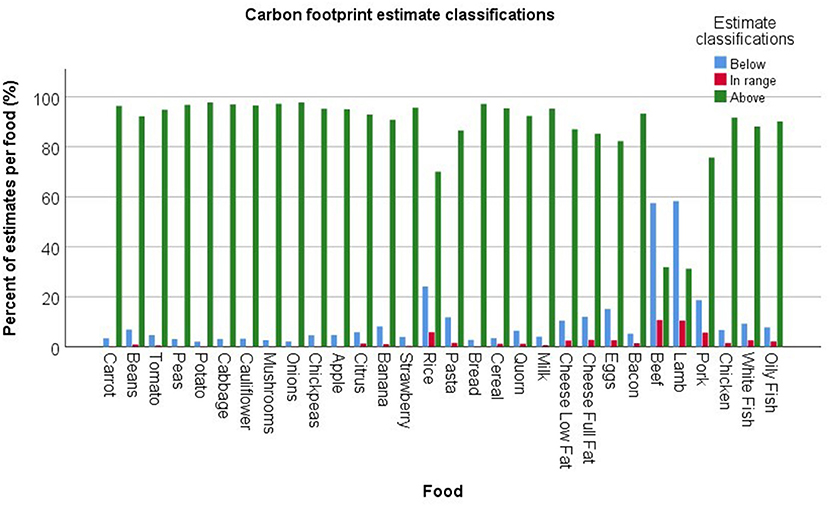
Figure 1. Carbon footprint estimate classifications.
Energy Content Perception
Participants typically overestimate the energy content of the foods (60.7%) with fewer underestimating the energy content (30.5%) or estimating within the designated range (8.8%) of energy content, [χ(2) = 100042.50, p < 0.001].
Estimated energy content values between recruitment methods [H(2) = 558.39, p < 0.001], with Zooniverse Beta citizens (mean rank = 10127.34) and Prolific participants (mean rank = 12115.80) providing lower estimations than Qualtrics participants (mean rank = 13193.31).
Accuracy of estimation differed by food type, [χ(58) = 5180.53, p < 0.001]. The energy content of pasta (65.8%), rice (69.9%), beef (65.8%), pork (69.0%), and beans (52.7%) were more frequently underestimated. The energy content of fruits and vegetables (e.g., tomato, 94.8%; strawberry, 88.0%), fish (e.g., white fish 81.9%), dairy products (e.g. milk, 93.8%; full fat cheese, 57.3%), and eggs (72.5%) were overestimated, [(see Figure 2), (see Supplementary Material, SM1 for estimation classifications of each food and recruitment platform].
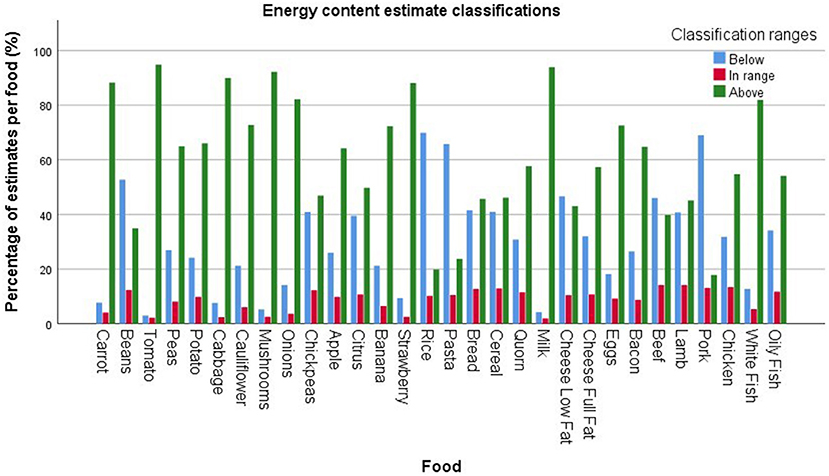
Figure 2. Energy content estimate classifications.
Participants recruited via Qualtrics, Prolific, and Zooniverse beta typically overestimate the energy content of foods [χ(4) = 349.20, p < 0.001], (see Table 1). Few estimations fall within range across all recruitment methods. Zooniverse Beta citizens underestimate energy content values more often than Qualtrics and Prolific participants (see Table 1).
Food Risk Perception
Overall, foods are considered low risk (mean = 2.48, SD = 2.27), (scale: low risk 0—high risk 10). However, this varies by recruitment method [H(2) = 192.08, p < 0.001] with Zooniverse Beta citizens (mean rank = 10821.31) and Prolific participants (mean rank = 10321.01) perceiving food as lower risk than Qualtrics participants (mean rank = 11529.40).
Perceptions of food risk vary by food type [H(29) = 4951.30, p < 0.001]. Fruit and vegetables (e.g., mean rank apple = 8222.62, carrot = 8279.00) are perceived as lower risk, with rice (mean rank = 11310.07), dairy products (e.g., mean rank low fat cheese = 12098.92), fish (e.g., mean rank oily fish = 14157.56), eggs (mean rank = 14157.56), and meat products (e.g., mean rank chicken = 16791.26, beef = 15828.41) being perceived as higher risk (see Supplementary Material, SM2).
Animal Welfare Perception
Next we consider the welfare perceptions of animal products. Overall, foods are considered to have moderate welfare (mean = 4.49, SD = 2.85), (scale: low welfare 0—high welfare 10). However, perceptions vary between each recruitment method [H(2) = 69.16, p < 0.001] with Zooniverse Beta citizens (mean rank = 3043.47) giving the lowest ratings, followed by Prolific participants (mean rank = 3734.56) perceiving animal welfare standards to be lower than Qualtrics participants (mean rank = 3943.77).
Perceptions of animal welfare vary by food type [H(10) = 53.51, p < 0.001]. Chicken (mean rank = 3498.34) and eggs (mean rank = 3624.92) are associated with the lowest welfare standards with fish (mean rank white fish = 4100.03, oily fish = 4050.21) and milk (mean rank = 3959.65) being associated with higher welfare standards. However, pairwise comparisons indicate that of all the animal products rated, only fish products [chicken - oily fish, H(1) = 4.78, p < 0.001; chicken - white fish, H(1) = 5.20, p < 0.001, Bonferroni correction applied] and milk [chicken - oily fish, H(1) = 4.78, p < 0.001] significantly differ from chicken (see Supplementary Material, SM3). An exploratory analysis indicated that animal welfare perception of primary (meat and fish) and secondary (dairy and eggs) animal products do not differ in welfare perceptions [H(1) = 0.37, p = 0.54].
Next, we considered how animal welfare perceptions vary by food type (animal products only) between recruitment methods. Animal welfare perceptions do not differ by recruitment method for dairy [milk: H(2) = 0.34, p = 0.18; full fat cheese: H(2) = 0.35, p = 0.84, low fat cheese: H(2) = 4.06, p = 0.13] or fish products [oily fish: H(2) = 3.14, p = 0.21, white fish: H(2) = 2.19, p = 0.36]. However, we observe differences for eggs [H(2) = 11.07, p = 0.004] and meat products [bacon H(2) = 22.54, p < 0.001, beef H(2) = 10.04, p = 0.007, lamb H(2) = 6.79, p = 0.03, pork H(2) = 29.03 p < 0.001, chicken H(2) = 27.68, p < 0.001] with Zooniverse citizens having the lowest perceptions of animal welfare standards, followed by Prolific participants, Qualtrics participants perceived animal welfare standards to the highest (see Supplementary Material, SM3).
Carbon Footprint, Energy Content, Food Risk, and Animal Welfare Correlations
To explore whether participants conflate the rated attributes, we conducted a series of correlations (carbon footprint, energy content, food risk, animal welfare).
When considering the data from all recruitment platforms and across all foods, we observe moderate positive correlations between carbon footprint, energy content, and safety perceptions (see Table 2). However, when animal welfare is considered (animal products only), very small negative correlations are observed indicating that high welfare foods are loosely perceived to have a lower carbon footprint and food risk (see Table 2).
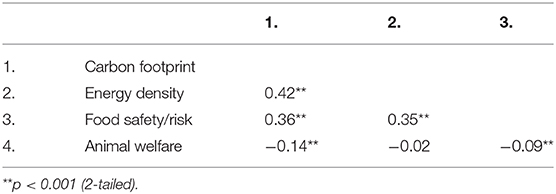
Table 2. Attribute correlations.
We repeated the analysis with data from each recruitment platform to explore whether the observed correlations were still present. As Zooniverse workflows presented citizens with either the energy density or carbon footprint attribute, then either animal welfare or food safety attribute, it was not possible to calculate the correlations between these ratings. However, attributes which were rated by the same citizen and would potentially allow a correlation to be calculated (i.e., carbon footprint and welfare/safety; carbon footprint and welfare/ safety) did not receive sufficient information sufficient ratings for each food to produce a correlation analysis, with some not being rated at all.
Consequently, we calculated the attribute correlations for the Prolific and Qualtrics data only (see Supplementary Material, SM4). We next repeated the attribute rating correlation analysis with data from each recruitment method and for each food (see Supplementary Material, SM5). Data from the Qualtrics platform show energy density, carbon footprint and food safety attribute correlations for non-animal foods and the majority of animal products. There was no correlation between animal welfare with energy density or food safety/risk, with the expectation of white fish and beef which showed very weak negative correlations between food animal welfare and food safety.
The data from the Prolific platform indicate weak-moderate correlations between energy density and carbon footprint across non-animal foods (except bread) and no correlation between food safety and carbon footprint (except for chickpeas and Quorn). Weak positive correlations are observed across the majority of non-animal products for food safety and energy density.
When we consider attribute ratings of animal products, we observe positive correlations between carbon footprint estimations with energy density and food safety. No significant correlations exist between energy density and animal welfare, though positive correlations are observed between energy density and food safety. Weak correlations between animal welfare and food safety was only observed for bacon, beef, lamb and pork but not for eggs, dairy and fish.
Zooniverse Beta Citizen Feedback
Several issues were highlighted in the Zooniverse feedback which addressed the use of the Zooniverse platform for survey data collection, participant knowledge, and platform functionality.
Participants noted the difference between the typical citizen science projects (based on data classifications) and the current project (perceptions and attitudes data collection). Though several of the citizens found the project interesting, concerns were raised over whether the Zooniverse is the correct platform for data collection.
Many citizens stated that they lacked knowledge of carbon footprint values associated with foods, however some citizens also indicated they were unfamiliar with caloric values of foods.
Several citizens had difficulty in accurately inputting responses when using the slider tool. Though the project instructions asked citizens to rate animal welfare for animal products only this was not communicated sufficiently as many citizens highlighted that they were asked to rate “animal welfare” of non-animal products. This issue could be overcome by the creation of different workflows of animal and non-animal products, or the inclusion of a “not applicable” response option.
Citizens indicated the desire for more information about the origin of foods requested (e.g., whether raw or cooked, grass fed or grain fed animals, country of origin, organic), this suggests that citizens are aware of factors in the food system which contribute to carbon footprint. In addition, this reflects that citizens are not used to knowledge/perception survey based projects, with typical citizen science projects providing detailed training to allow citizens to make classifications of existing data/images.
As Zooniverse beta citizens represent a global network, many citizens indicated they had difficulty with the survey due to cultural differences such as being unfamiliar with the metric weight measurements (used to indicate portion size), the types of food featured, and the portion sizes shown were not what would be considered a “typical” portion for their food culture—despite this being a the average portion for the UK.
Discussion
This study demonstrates two key findings. First, participants are unable to estimate the approximate carbon footprint and energy content of foods, with only 2% of carbon footprint estimates within range (+/10%), and 9% of energy content of food. Second, we observe that the Zooniverse citizen science platform is, to an extent, comparable with online recruitment platforms, with patterns of energy density and carbon footprint knowledge being similar across the platforms. We found that participant food knowledge and perceptions differ between the three recruitment methods used in the current study. This highlights the need for the recruitment platform to be carefully considered when conducting nutrition science research. Replicating the findings of previous research (Carels et al., 2007; Chernev and Chandon, 2010; Lee et al., 2012; Holmstrup et al., 2013; Liu et al., 2015; Jones et al., 2016; Panzone et al., 2016; Shi et al., 2018; Camilleri et al., 2019; Armstrong and Reynolds, 2020) we observe that, across the three recruitment platforms used, participants are unable to accurately estimate the carbon footprint and energy content of food. We found that the type of food being rated influenced the direction of both carbon footprint and energy content estimates. Though the carbon footprint of foods were typically overestimated, the carbon footprint of beef and lamb were frequently underestimated. The energy density of fruits and vegetables are overestimated more often than other food categories. We observe differences in food knowledge and perceptions between recruitment platforms. Qualtrics participants estimate values of energy density and carbon footprint to be higher than Zooniverse and Prolific participants.
As previous research has observed that consumer perceptions of energy content and carbon footprint of food are associated with purchase intention (Armstrong and Reynolds, 2020), identifying differences in the consumer knowledge between different recruitment platforms and food types provides a point of consideration for researchers, policy makers and those developing interventions to nudge consumers toward healthier and sustainable diets.
Perceptions of animal welfare standards showed little variation between products (milk, full-fat cheese, low-fat cheese, eggs, bacon, beef, lamb, pork, chicken), with only fish being perceived to be of a higher standard. There was no difference in welfare perception between primary (bacon, beef, lamb, pork, chicken) and secondary products (milk, eggs, cheese) indicating that consumers' perceptions of secondary products are not “removed” from the welfare of the animal. We observe differences in animal welfare perceptions between recruitment platforms. Zooniverse citizens rated animal welfare standards to be lower for meat products and eggs, compared to Qualtrics and Prolific participants, however due to the absence of demographic data we are unable to determine if this is explained by difference in the cohort—including potential differences in geography of participants.
In line with previous research which demonstrated that consumers tend to conflate food related attributes (Harper and Henson, 2001; Röhr et al., 2005; Cicia et al., 2016; Armstrong et al., 2020), we observe that the majority of attributes correlate. However, the attribute correlations observed vary by recruitment platform and food. We propose that the conflation of attributes may be due to a “halo effect” with a single factor impacting attribute ratings. In contrast with previous research which demonstrated that consumers perceive animal welfare and food safety/risk to be closely related (Harper and Henson, 2001; Röhr et al., 2005; Cicia et al., 2016; Armstrong et al., 2020), we found that animal welfare standards were only weakly associated with food safety/risk perceptions. It is unclear whether this is an artifact of the recruitment platforms used or the foods featured in the current research.
We observe that fruit and vegetables were considered lower risk, compared to rice and animal products. As food safety perception is an influencing factor in consumer product choice (van Rijswijk and Frewer, 2008) it may be possible for health professionals and government bodies aiming to move consumers toward a healthier and more suitable diet, to use consumers existing perceptions to increase the proportion of fruit and vegetables purchased and consumed, and decrease the proportion of meat and animal products in consumer diets.
Limitations
Due to the nature and functionality of the Zooniverse citizen science platform we were unable to gather demographic information. Consequently, we are not able to determine whether the Zooniverse cohort are comparable to those recruited via Qualtrics and Prolific. As Qualtrics and Prolific attract a particular demographic (Peer et al., 2017) it would be valuable to explore the food knowledge and perceptions of demographic groups which do not typically engage with online panel research. In addition, the current research was (primarily) limited to UK based participants and western foods. As consumers within developed countries are more concerned with animal welfare standards, which can in turn, influence product choice (De Graaf et al., 2016; Cornish et al., 2019) it would be valuable to explore the food knowledge and perceptions of citizens from other countries. Qualitative feedback from the Zooniverse platform provided valuable insight into citizen food knowledge and perceptions. However, as Zooniverse beta is an international community, cultural differences, such as unfamiliarity with the foods and measurement systems featured, made the survey more challenging for some citizens.
In the current research we used a 10 point scale (low welfare—high welfare) to measure perceptions of animal welfare and food safety, unlike the carbon footprint and energy density measures which use a metric, the scale relies on participant interpretation of what constitutes high and low welfare, and therefore could introduce noise within the data. The introduction of easy to interpret and use metrics of animal welfare and food safety may provide more insightful understanding of the variables.
When classifying estimates energy density and carbon footprint a +-10% range was used. This figure was taken from the accuracy tolerance of food labels (e.g., European Commission, 2012; Public Health England, 2012; Jumpertz et al., 2013), and here it was applied to energy density and carbon footprint, in the absence of labeling guidance for carbon footprint values. However, it would be beneficial for future research to apply deviation values to classify the accuracy of estimated carbon footprint values for each food.
We observed that the majority of attributes correlate, which may indicate conflation. However, due to the nature of the data it is possible that the correlations observed are artificial. The validity of the attribute conflation could be confirmed by future research, by using participants as a random factor in regression analysis, this would establish if the correlation is being driven by individuals (rating all attributes as high/low) or a food level correlation.
Implications
The current research presents novel findings, demonstrating that the recruitment method used by researchers can impact the observed food knowledge and perceptions of participants. As data of participant knowledge and perceptions can be used as an evidence base for to underpin policy change, education communication and behavioral change interventions intended to move consumers toward more sustainable and healthy diets, it is key that the impact of the recruitment platform on observed data is considered. We suggest that if budget and timings allow, researchers could use multiple platforms for recruitment, using a combination of citizen science and online panel platforms. As citizen science platforms aim to engage a more diverse and larger body of the public (European Citizen Science Association, 2019), the use of citizen science can make a valuable contribution by allowing researchers to access a different population from that of online survey panels (McDonald and Adam, 2003; Ward et al., 2012; Peer et al., 2017). Consequently, the use of citizen science in addition to online survey panels can provide a wider evidence base which can contribute to the development of more effective consumer facing communications, interventions, and guidance for policy.
The current research supports citizen science communities and researchers by demonstrating: the value of citizen science as a method which can be flexible to the needs of the research (e.g., the current research trailed a survey method rather than the typical classification function of Zooniverse); citizen science can yield data which are comparable to the results of widely accepted online survey and recruitment platforms; citizen science can be successfully adapted to topics of the most common areas of biology, conservation, and ecology (Kullenberg and Kasperowski, 2016). However, we also observe some methodological limitations which must be considered by those intending to adopt citizen science methods (see section Limitations).
Future Research
We suggest two areas for future research. First, it is important to understand whether the differences observed in perceptions (carbon footprint, energy content, food safety, animal welfare) between the platforms impact purchase intention and product choice. Second, previous research has suggested that food safety perceptions are influenced by a range of factors and information sources (Frewer, 2001; Grunert, 2005; Röhr et al., 2005; Lobb et al., 2007). It would be valuable to understand how the different groups acquire and develop their food knowledge and perceptions, and whether the sources of information differ between different consumer groups.
Conclusions
We have demonstrated that the Zooniverse beta provides a recruitment platform which is comparable to online survey panels. We observe that each of the three recruitment platforms used can result in differences in observed food knowledge and perceptions.
Finally, the lack of knowledge about the carbon footprint and energy content of foods, across all recruitment platforms, demonstrates the need for consumer education and communication to enable the move toward healthier and more sustainable diets. The observed perceptions of food safety/risk and animal welfare demonstrate a baseline from which to develop consumer focused communications and policy.
Data Availability Statement
The raw data supporting the conclusions of this article will be made available by the authors, without undue reservation.
Ethics Statement
This study was conducted according to the guidelines laid down in the Declaration of Helsinki and all procedures involving research study participants were approved by the Geography Department, University of Sheffield ethics panel. Consent was obtained from all subjects. PROJECT TITLE: Piloting Zooniverse to help us understand citizen food perceptions (2nd phase) APPLICATION: Reference Number #024356. The patients/participants provided their written informed consent to participate in this study.
Author Contributions
CR: Grant holder and PI, data collection, designed the study, and peer-reviewed drafts. CW, LP, XS, AK, GB, CF, and CK: research collaborator and peer-reviewed drafts. BA: research collaborator, data collection, data analysis, and first draft of manuscript. GM and SS: research collaborator. All authors contributed to the article and approved the submitted version.
Funding
This work was funded by STFC Food Network+ pilot funding (ST/P003079/1), and STFC 21st Century challenge funding (ST/T001410/1) Piloting Zooniverse for food, health and sustainability citizen science. BA and CR was supported from the HEFCE Catalyst-funded N8 AgriFood Resilience Programme and matched funding from the N8 group of Universities. Additional funding was provided by Research England via the project Food based citizen science in UK as a policy tool.
Conflict of Interest
GM is affiliated with Zooniverse, a University of Oxford project. He provided advice on the development of the experiment, use response tool, and deployment of the research. He was not involved with the research and did not influence the analysis of the data or the results that were presented.
The remaining authors declare that the research was conducted in the absence of any commercial or financial relationships that could be construed as a potential conflict of interest.
Supplementary Material
The Supplementary Material for this article can be found online at: https://www.frontiersin.org/articles/10.3389/fsufs.2020.575021/full#supplementary-material
References
Armstrong, B., Bridge, G., Oakden, L., Reynolds, C., Wang, C., Panzone, L., et al. (2020). Piloting citizen science methods to measure perceptions of carbon footprint and energy content of food. Front. Sustain. Food Syst. 4:120. doi: 10.3389/fsufs.2020.00120
Armstrong, B., and Reynolds, C. (2020). China and the USA, a higher perceived risk for UK consumers in a post COVID-19 food system: the impact of country of origin and ethical information on consumer perceptions of food. [version 1; peer review: awaiting peer review]. Emerald Open Res. 2:35. doi: 10.35241/emeraldopenres.13711.1
Audsley, E., Brander, M., Chatterton, J. C., Murphy-Bokern, D., Webster, C., and Williams, A. G. (2010). How Low Can We Go? An Assessment of Greenhouse Gas Emissions From the UK Food System and the Scope Reduction by 2050. Report for the WWF and Food Climate Research Network. Available online at: http://dspace.lib.cranfield.ac.uk/handle/1826/6503
Beymer, M. R., Holloway, I. W., and Grov, C. (2018). Comparing self-reported demographic and sexual behavioral factors among men who have sex with men recruited through Mechanical Turk, Qualtrics, and a HIV/STI clinic-based sample: implications for researchers and providers. Archiv. Sex. Behav. 47, 133–142. doi: 10.1007/s10508-016-0932-y
Camilleri, A. R., Larrick, R. P., Hossain, S., and Patino-Echeverri, D. (2019). Consumers underestimate the emissions associated with food but are aided by labels. Nat. Clim. Change 9, 53–58. doi: 10.1038/s41558-018-0354-z
Carels, R., Konrad, K., and Harper, J. (2007). Individual differences in food perceptions and calorie estimation: an examination of dieting status, weight, and gender. Appetite 49, 450–458. doi: 10.1016/j.appet.2007.02.009
CCC (2020). Land Use: Policies for a Net Zero UK. Available online at: https://www.theccc.org.uk/publication/land-use-policies-for-a-net-zero-uk/ (accessed February 2020).
Chernev, A., and Chandon, P. (2010). “Calorie estimation biases in consumer choice,” in Leveraging Consumer Psychology for Effective Health Communications: The Obesity Challenge, eds R. Batra, K. P. Anand, and V. J. Strecher (Armonk, NY: M.E. Sharpe), 104–121.
Cicia, G., Caracciolo, F., Cembalo, L., Del Giudice, T., Grunert, K. G., Krystallis, A., et al. (2016). Food safety concerns in urban China: consumer preferences for pig process attributes. Food Control 60, 66–173. doi: 10.1016/j.foodcont.2015.07.012
Clune, S., Crossin, E., and Verghese, K. (2017). Systematic review of greenhouse gas emissions for different fresh food categories. J. Clean. Prod. 140, 766–783. doi: 10.1016/j.jclepro.2016.04.082
Cohen, D. A., and Story, M. (2014). Mitigating the health risks of dining out: the need for standardized portion sizes in restaurants. Am. J. Public Health 104, 586–590. doi: 10.2105/AJPH.2013.301692
Cornish, A. R., Ashton, B., Raubenheimer, D., and McGreevy, P. D. (2019). Australian consumers' knowledge and concern for animal welfare in food production: influences on purchasing intentions. Soc. Anim. 1, 1–28. doi: 10.1163/15685306-12341601
De Graaf, S., Van Loo, E. J., Bijttebier, J., Vanhonacker, F., Lauwers, L., Tuyttens, F. A., et al. (2016). Determinants of consumer intention to purchase animal-friendly milk. J. Dairy Sci. 99, 8304–8313. doi: 10.3168/jds.2016-10886
Dickinson, J. L., Zuckerberg, B., and Bonter, B. N. (2010). Citizen science as an ecological research tool: challenges and benefits. Annu. Rev. Ecol. Evol. Syst. 41, 149–172. doi: 10.1146/annurev-ecolsys-102209-144636
European Citizen Science Association (2019). Empowerment, Inclusiveness and Equity. Available online at: https://ecsa.citizen-science.net/empowerment-inclusiveness-equity
European Commission (2012). Guidance Document for Competent Authorities for the Control of Compliance With EU Legislation on: Regulation (EU) No 1169/2011 of the European Parliament and of the Council of 25 October 2011 on the Provision of Food Information to Consumer….2012. Available online at: https://ec.europa.eu/food/sites/food/files/safety/docs/labelling_nutrition-vitamins_minerals-guidance_tolerances_1212_en.pdf (accessed February 2020).
Fischer, C. G., and Garnett, T. (2016). Plates, Pyramids, and Planets: Developments in National Healthy and Sustainable Dietary Guidelines: A State of Play Assessment. FAO and the University of Oxford.
Freidberg, S. (2016). Wicked nutrition: the controversial greening of official dietary guidance. Gastronomica 16, 69–80. doi: 10.1525/gfc.2016.16.2.69
Frewer, L. (2001). Risk perception and risk communication about food safety issues. Nutr. Bull. 25, 31–33. doi: 10.1046/j.1467-3010.2000.00015.x
Grunert, K. G. (2005). Food quality and safety: consumer perception and demand. Eur. Rev. Agric. Econ. 32, 369–391. doi: 10.1093/eurrag/jbi011
Harper, G., and Henson, S. (2001). Consumer Concerns About Animal Welfare and the Impact on Food Choice. Final report EU FAIR CT98-3678. UK, Department of Agricultural and Food Economics, University of Reading. Available online at: https://ec.europa.eu/food/sites/food/files/animals/docs/aw_arch_hist_eu_fair_project_en.pdf
Health Council of the Netherlands (2011). Guidelines for a Healthy Diet: the Ecological Perspective. Available online at: https://www.healthcouncil.nl/documents/advisory-reports/2011/06/16/guidelines-for-a-healthy-diet-the-ecological-perspective
Holmstrup, M., Stearns-Bruening, K., and Rozelle, J. (2013). Quantifying accurate calorie estimation using the think aloud method. J. Nutr. Educ. Behav. 45, 77–81. doi: 10.1016/j.jneb.2012.04.007
Jones, A., Vanderlee, L., White, C., Hobin, E., Bordes, I., and Hammond, D. (2016). ‘How many calories did I just eat?'An experimental study examining the effect of changes to serving size information on nutrition labels. Public Health Nutr. 19, 2959–2964. doi: 10.1017/S1368980016000665
Jumpertz, R., Venti, C. A., Le, D. S., Michaels, J., Parrington, S., Krakoff, J., and Votruba, S. (2013). Food label accuracy of common snack foods. Obesity 21, 164–169. doi: 10.1002/oby.20185
Kause, A., Bruine de Bruin, W., Millward-Hopkins, J., and Olsson, H. (2019). Public perceptions of how to reduce carbon footprints of consumer food choices. Environ. Res. Lett. 14:114005. doi: 10.1088/1748-9326/ab465d
Kullenberg, C., and Kasperowski, D. (2016). What is citizen science?-A scientometric meta-analysis. PLoS ONE 11:e0147152. doi: 10.1371/journal.pone.0147152
Lee, C. D., Chae, J., Schap, T., Kerr, D. A., Delp, E. J., Ebert, D. J., et al. (2012). Comparison of known food weights with image-based portion-size automated estimation and adolescents' self-reported portion size. J. Diabetes Sci. Technol. 6, 428–434. doi: 10.1177/193229681200600231
Liu, P. J., Bettman, J., Uhalde, A., and Ubel, P. (2015). ‘How many calories are in my burrito?'Improving consumers’ understanding of energy (calorie) range information. Public Health Nutr. 18, 15–24. doi: 10.1017/S1368980014000627
Lobb, A. E., Mazzocchi, M., and Traill, W. B. (2007). Modelling risk perception and trust in food safety information within the theory of planned behaviour. Food Qual. Preference 18, 384–395. doi: 10.1016/j.foodqual.2006.04.004
Lowry, P. B., D'Arcy, J., Hammer, B., and Moody, G. D. (2016). “Cargo Cult” science in traditional organization and information systems survey research: a case for using nontraditional methods of data collection, including Mechanical Turk and online panels. J. Strategic Inform. Syst. 25, 232–240. doi: 10.1016/j.jsis.2016.06.002
McDonald, H., and Adam, S. (2003). A comparison of online and postal data collection methods in marketing research. Mark. Intellig. Plann. 21, 85–95. doi: 10.1108/02634500310465399
Mellis, A. M., and Bickel, W. K. (2020). Mechanical Turk data collection in addiction research: utility, concerns and best practices. Addiction 115, 1960–1968. doi: 10.1111/add.15032
Ministers NC of (2014). Nordic Nutrition Recommendations 2012. Copenhagen. Available online at: http://norden.diva-portal.org/smash/get/diva2:704251/FULLTEXT01.pdf
Miyazaki, T., de Silva, G., and Aizawa, K. (2011). “Image-based calorie content estimation for dietary assessment,” in 2011 IEEE International Symposium on Multimedia, 363–368. Available online at: https://ieeexplore.ieee.org/document/6123373
Monteiro, C. A., Cannon, G., Moubarac, J. C., Martins, A. P. B., Martins, C. A., Garzillo, J., et al. (2015). Dietary guidelines to nourish humanity and the planet in the twenty-first century. A blueprint from Brazil. Public Health Nutr. 18, 2311–2322. doi: 10.1017/S1368980015002165
Moss, A. J., Rosenzweig, C., Robinson, J., and Litman, L. (2020). Is it ethical to use mechanical Turk for behavioral research? Relevant data from a representative survey of MTurk participants and wages. PsyArXiv. doi: 10.31234/osf.io/jbc9d
Newcastle University Food Standards Scotland. (2018). Intake24 Food Database and Full Image Database. Available online at: https://intake24.co.uk/
Palan, S., and Schitter, C. (2018). Prolific. ac—A subject pool for online experiments. J. Behav. Exp. Finance 17, 22–27. doi: 10.1016/j.jbef.2017.12.004
Panzone, L. A., Lemke, F., and Petersen, H. L. (2016). Biases in consumers' assessment of environmental damage in food chains and how investments in reputation can help. Technol. Forecast. Soc. Change 111, 327–337. doi: 10.1016/j.techfore.2016.04.008
Peer, E., Brandimarte, L., Samat, S., and Acquisti, A. (2017). Beyond the Turk: alternative platforms for crowdsourcing behavioral research. J. Exp. Soc. Psychol. 70, 153–163. doi: 10.1016/j.jesp.2017.01.006
Poore, J., and Nemecek, T. (2018). Reducing food's environmental impacts through producers and consumers. Science 360, 987–992. doi: 10.1126/science.aaq0216
Public Health England (2012). The Composition of Foods Integrated Dataset - User Guide 2012 Available online at: https://assets.publishing.service.gov.uk/government/uploads/system/uploads/attachment_data/file/788485/McCance_Widdowson_Comp_Foods_Integrated_Dataset_User_Guide_2019__1_.pdf (accessed February 2020)
Public Health England (2014). National Diet and Nutrition Survey. Results from Years 7-8 (combined) of the Rolling Programme (2014/15 to 2015/16). Available online at: https://www.gov.uk/government/statistics/ndns-results-from-years-7-and-8-combined (accessed January 6, 2020).
Qualtrics (2020). Provo, UT. Version: January-February 2020. Available online at: https://www.qualtrics.com
Reynolds, C. J., Buckley, J. D., Weinstein, P., and Boland, J. (2014). Are the dietary guidelines for meat, fat, fruit and vegetable consumption appropriate for environmental sustainability? A review of the literature. Nutrients 6, 2251–2265. doi: 10.3390/nu6062251
Röhr, A., Lüddecke, K., Drusch, S., Müller, M. J., and Alvensleben, R. V. (2005). Food quality and safety–consumer perception and public health concern. Food Control 16, 649–655. doi: 10.1016/j.foodcont.2004.06.001
Rolls, B., Morris, E., and Roe, L. (2002). Portion size of food affects energy intake in normal-weight and overweight men and women. Am. J. Clin. Nutr. 76, 1207–1213. doi: 10.1093/ajcn/76.6.1207
Ryan, S. F., Adamson, N. L., Aktipis, A., Andersen, L. K., Austin, R., Barnes, L., et al. (2018). The role of citizen science in addressing grand challenges in food and agriculture research. Proc. R. Soc. B 285:20181977. doi: 10.1098/rspb.2018.1977
Shi, J., Visschers, V., Bumann, V., and Siegrist, M. (2018). Consumers' climate-impact estimations of different food products. J. Clean. Prod. 172, 1646–1653. doi: 10.1016/j.jclepro.2016.11.140
Simpson, E., Bradley, J., Poliakov, I., Jackson, D., Olivier, P., Adamson, A. J., et al. (2017). Iterative development of an online dietary recall tool: INTAKE24. Nutrients 9:118. doi: 10.3390/nu9020118
Simpson, R., Page, K. R., and De Roure, D. (2014). “Zooniverse: observing the world's largest citizen science platform,” in Proceedings of the 23rd International Conference on World Wide Web (Seoul), 1049–1054. doi: 10.1145/2567948.2579215
Smith, A. M., Lynn, S., and Lintott, C. J. (2013). “An introduction to the zooniverse,” in First AAAI Conference on Human Computation and Crowdsourcing (Palm Springs, CA).
Spiers, H., Swanson, A., Fortson, L., Simmons, B. D., Trouille, L., Blickhan, S., et al. (2018). “Patterns of volunteer behaviour across online citizen science,” in Companion Proceedings of the The Web Conference 2018 (Lyon), 93–94. doi: 10.1145/3184558.3186945
Steenhuis, I., and Vermeer, W. (2009). Portion size: review and framework for interventions. Int. J. Behav. Nutr. Phys. Act. 6:58. doi: 10.1186/1479-5868-6-58
SurveyMonkey (2020). San Mateo, CA. Available online at: www.surveymonkey.com
van Rijswijk, W., and Frewer, L. J. (2008). Consumer perceptions of food quality and safety and their relation to traceability. Br. Food J. 110, 1034–1046. doi: 10.1108/00070700810906642
van't Veer, P., Poppe, K. J., and Fresco, L. O. (2017). Towards a European Food and Nutrition Policy. Wageningen University and Research. Available online at: https://edepot.wur.nl/423602
Keywords: carbon footprint, methods, citizen science, portion size, energy content, consumer perception, food environmental impact
Citation: Armstrong B, Reynolds C, Bridge G, Oakden L, Wang C, Panzone L, Schmidt Rivera X, Kause A, Ffoulkes C, Krawczyk C, Miller G and Serjeant S (2021) How Does Citizen Science Compare to Online Survey Panels? A Comparison of Food Knowledge and Perceptions Between the Zooniverse, Prolific and Qualtrics UK Panels. Front. Sustain. Food Syst. 4:575021. doi: 10.3389/fsufs.2020.575021
Received: 22 June 2020; Accepted: 22 December 2020;
Published: 27 January 2021.
Edited by:
Minna Kaljonen, Finnish Environment Institute (SYKE), FinlandReviewed by:
Taiyang Zhong, Nanjing University, ChinaBálint Balázs, Environmental Social Sciences Research Group, Hungary
Copyright © 2021 Armstrong, Reynolds, Bridge, Oakden, Wang, Panzone, Schmidt Rivera, Kause, Ffoulkes, Krawczyk, Miller and Serjeant. This is an open-access article distributed under the terms of the Creative Commons Attribution License (CC BY). The use, distribution or reproduction in other forums is permitted, provided the original author(s) and the copyright owner(s) are credited and that the original publication in this journal is cited, in accordance with accepted academic practice. No use, distribution or reproduction is permitted which does not comply with these terms.
*Correspondence: Beth Armstrong, m.armstrong@sheffield.ac.uk