Exploring Possible Relations Between Optical Variability Time Scales and Broad Emission Line Shapes in AGN
 Edi Bon
 Predrag Jovanović1
  Paola Marziani
 Nataša Bon
 Aleksandar Otašević
- 1Astronomical Observatory, Belgrade, Serbia
- 2Osservatorio Astronomico di Padova (INAF) Padua, Padova, Italy
Here we investigate the connection of broad emission line shapes and continuum light curve variability time scales of type-1 Active Galactic Nuclei (AGN). We developed a new model to describe optical broad emission lines as an accretion disk model of a line profile with additional ring emission. We connect ring radii with orbital time scales derived from optical light curves, and using Kepler's third law, we calculate mass of central supermassive black hole (SMBH). The obtained results for central black hole masses are in a good agreement with other methods. This indicates that the variability time scales of AGN may not be stochastic, but rather connected to the orbital time scales which depend on the central SMBH mass.
1. Introduction
Type-1 Active Galactic Nuclei (AGN) are very powerful and variable emitters. The continuum emission in radio-quiet AGN is assumed to originate mainly from an accretion disk (AD) around a central supermassive black hole (SMBH) (Lynden-Bell, 1969; Shakura and Sunyaev, 1973). There is consensus that the accretion disk can be represented as virialized (rotating) gas in a flattened distribution following a Keplerian velocity field.
The optical broad emission lines (BELs) are assumed to be produced with photoionization processes (Netzer, 2013), as they respond to the variations of UV continuum. The accretion disk itself may be a low-ionization line emitter (see e.g., Chen and Halpern, 1989; Chen et al., 1989; Eracleous and Halpern, 1994; Popović et al., 2004; Bon et al., 2006, 2009a,b, 2015; Gavrilović et al., 2007; Bon, 2008), if part of the continuum radiation is scattered toward it. The optical broad line light curves (like for e.g., Hα) are highly correlated with the optical continuum light curves (e.g., Kaspi et al., 2000). The time lags between correlated patterns in the continuum and Hα flux are of the order of days, up to months, defining the size of broad line region (BLR). Reverberation mapping campaigns are based on this fact, and they measure time lags of correlated light curves in order to determine the sizes of reverberating region (which are after used for determination of central BH masses) in AGN (see e.g., Peterson, 1997; Kaspi et al., 2000; Peterson et al., 2002; Denney et al., 2009). The correlation of light curves might indicate that the signature of the main driver of the variability could be detected in the shape of the broad emission line profiles. This could give us the velocity resolved information about processes that drive the variability.
The shape of Balmer emission lines, particularly Hα and Hβ line profile, in many AGN could be described as similar to the shape of an AD line profile expected to originate from flattened distribution of rotating emitting gas. Characteristic double peaked very broad profile, are usually seen in simulated emission line profiles (see for e.g., Chen and Halpern, 1989; Chen et al., 1989; Eracleous and Halpern, 1994; Newman et al., 1997; Čadež et al., 1998; Popović et al., 2003, 2004; Bon et al., 2006, 2009a,b; Bon, 2008; Jovanović et al., 2010) but are observed only in one percent of AGN (Eracleous and Halpern, 1994; Strateva et al., 2003; Netzer, 2013). In typical, single peaked BEL profiles, the AD contributions could be blended by surrounding isotropic velocity component in the BLR (Popović et al., 2003, 2004; Bon et al., 2006, 2009a; Collin et al., 2006; Gavrilović et al., 2007; Bon, 2008). In some cases, broad Hα and Hβ line profiles show a red side more broadened and extended further into the red part of the spectrum, that could be associated with gravitational redshift (see e.g., Bon et al., 2015, and references therein). In case the blue side of a line is more extended, the contribution is usually assumed to be from the winds or outflows (see Marziani et al., 1996; Czerny, 2006; Collin et al., 2006; Sulentic et al., 2007).
Even though long term monitoring campaigns of AGN may still not be long enough to search for periodic variability (Bon et al., 2017), there are some highly monitored cases for which some claims of detecting significant periodicity have been made (see for example Bon et al., 2012, 2016, 2017; Graham et al., 2015a,b; Bhatta et al., 2016; Charisi et al., 2016). Currently, there are some ongoing campaigns of extensive monitoring programs (see e.g., Peterson et al., 2002; Gezari et al., 2007; Sergeev et al., 2007; Ilić et al., 2017) that may provide valuable light curves for the future variability investigations.
Here we explore a possibility that ripples in the observed broad optical emission line profiles may be in connection with variability time scales observed in optical continuum light curves. We present a case study of Arp 102B, using spectra and light curves from Shapovalova et al. (2013). Our hypothesis is that the variability patterns in the light curves may be induced by the orbiting of perturbers “perturbation” (a hot spot, a spiral arm, a compact body such as a stellar mass object or even up to intermediate mass black hole) within the accretion disk (see more i, for e.g., Chakrabarti and Wiita, 1994; Lin and Papaloizou, 1996; Newman et al., 1997; Gezari et al., 2007; Flohic and Eracleous, 2008; Jovanović et al., 2010; McKernan et al., 2012). Using the AD model with additional emitting rings (separated with gaps), developed specially for this purpose, we match the synthetic broad emission line profiles to the observed Hα line, in order to measure the ring radii. We connect variability time scales, with radii, and calculate the central BH mass.
The paper is organized as follows: first, we present the method (section 2) of measuring the radii that could be paired with variability time scales from light curves. For that purpose we developed a model of an AD emission with additional enhanced thin rings (section 2.1). We used data (spectra and light curves) available in Shapovalova et al. (2013). We match the AD model to the observed Hα broad emission line and measure the ring radii that we connect to optical variability time scales. We analyze optical light curves, find variability time scales that we match with measure ring radii, and calculate the mass of the SMBH as a test of our hypothesis (section 3). We discuss possible mechanisms in section 4. In the last section 5, we point out the main conclusions of our investigation.
2. Method
Light curves of an optical continuum and broad emission line flux are highly correlated (Kaspi et al., 2000). This may indicate the same origin of their variability source. Therefore, one could expect that the source of variability could leave a trace in the shapes of their broad line profile shape. Analysis of variation time scales may give us valuable information about why they vary the way they do, while the line profiles could provide us with the information about the kinematic parameters of the variability drive (like the radii where the source of variation is located).
In order to investigate the variability time scales of optical continuum light curves, we use standard methods like Lomb-Scargle (Lomb, 1976; Scargle, 1982), and sine function fitting, that we use here to determine variability time scales. Here we assume that the variability time scales corresponds to the orbital time scales within the region of AD where the optical light could be originating from (see e.g., Bon et al., 2012, 2016). Ripples in the broad emission line profiles could be produced by the effects of the same phenomena that drives the variability (Eracleous and Halpern, 1994; McKernan et al., 2013). If we detect them, we would then be able to determine some dynamical properties (see for e.g., Newman et al., 1997; Gezari et al., 2007). In case we could identify more then one variability time scale period in the light curves that could be linked to the radius of an emitting ring in the broad emission line profile, then for each ring-radius pair we should expect to obtain the same mass (or at least very close value) of the central SMBH using Kepler's laws.
In order to test these assumptions, as a first step we model synthetic line emission of an orbiting gas in the flat, disk like gas distribution, assuming that photo ionization process produces the emission line from that region, that we could approximate with the accretion disk emission model (Chen and Halpern, 1989; Chen et al., 1989; Eracleous and Halpern, 1994; Čadež et al., 1998; Jovanović and Popović, 2008; Jovanović et al., 2010; Bon et al., 2015).
By matching the AD model to the Hα broad emission line profile, we determine the inclination, inner and outer radii and additional ring radii. The inner radius is defined by matching the far red and blue wings of the observed line profile to the red wing of AD model line shape. The red wing part is most sensitive to the and gravitational redshift effect (see e.g., Bon et al., 2015), and therefore the extension of the red side of the line wing determines how close to the BH the gas is emitting the optical Balmer lines. We note that we determine the inner radius of an AD of the Hα broad line from the fit of the model, and that the inner radius in gravitational units is usually ≳ 100, much larger than the inner radius derived from X-ray lines (like Fe Kα), usually close to the innermost stable circular orbit, 1 to 6 gravitational radii (for AD size of the optical emission lines, see for e.g., Chen and Halpern, 1989; Chen et al., 1989; Eracleous and Halpern, 1994; Popović et al., 2004; Bon et al., 2006, 2009a,b, 2015; Gavrilović et al., 2007; Bon, 2008). The part of the disk that contributes to the thermal continuum emission is the one of highest temperature, also close to the the innermost stable circular orbit (Lynden-Bell, 1969; Shakura and Sunyaev, 1973). This region is expected to be much closer to the black hole than the AD region suitable for the optical emission line emission. From the fit of the model to the observed broad line we determine inner and outer radius of the AD and each ring as well as the inclination and emissivity law that is common parameter for the complete model.
Simulated profiles of AD emission usually have characteristic two peaks in the core of the line, are broadened due to virial motion and made asymmetric by relativistic effects. The two peaks are usually blended by the isotropic emission component in the core of the line profile, originated further away from the AD, which is observed in majority of AGN spectra (Popović et al., 2003, 2004; Popovic et al., 2008; Bon et al., 2006, 2009a; Bon, 2008). Only in a very small number (less then 1%) of objects the two peaks are clearly recognized (see e.g., Strateva et al., 2003).
Small bump-like features can be found on the BEL profiles. They cannot be immediately modeled by smooth AD profiles.
2.1. Model of AD With Additional Ring Emission or AD With Ring Gaps
The AD model is an idealization of emission with assumption of an homogeneous AD. This may not be the case, and therefore the AD profile may not sufficient to describe all features in observed profiles like e.g., small bumps on the wings which are often present.
Assuming that the time scale of perturbed disk (cooling time, shock wave progression, or anything that produced additional emission from that ring) is significantly longer then the orbital time scale, then we could approximate that the time scale of variations measured in optical light curves correspond to the orbiting of some features within the AD at radii that could be associated to narrow rings that we located in AD by matching the observed emission lines with synthetic modeled profiles. Their radii are measured in units of gravitational radii Rg, since from the AD model we cannot obtain the information about the central mass. By connecting each variability time scale to some radii in the AD, with an assumption that the shorter variability time scale corresponds to a closer ring, while the outer radii correspond to a longer variability time scale, we could be able to calculate the mass of the central SMBH1 using the Kepler's third law for a circular orbit:
where r = ξ(rg) is the ring radius in gravitational radii and P is the circular orbital period of the orbiting region at such radii (as prposed in Newman et al., 1997; Gezari et al., 2007). We note here that regardless of the formula, our method is different then the method of Newman et al. (1997). These authors used monitoring spectra to determine the radius of a hot spot, which they then connected to the orbiting period. Here we use single epoch spectra and variability time scales measured from photometric data.
We use different AD model than in previous papers (Chen and Halpern, 1989; Chen et al., 1989; Antonucci et al., 1996; Newman et al., 1997; Gezari et al., 2007), even though we obtain similar values of parameters for the inclinations and the inner and outer radius. Here we use the relativistic ray tracing AD model2 We propose that the origin of the variability patterns, could be traced to the ripples in the shape of broad line profiles. Making a connection of variability time scales and radii, Equation (1) can be used to determine dynamical properties of AGN.
We construct our model assuming the emission of an AD and each ring contributions to the line profiles with the same inclination and emissivity law as in the parent AD, which is preserved in ring models. The code includes both special relativistic and general relativistic effects on radiation from the accretion disk around SMBH (see e.g., Jovanović, 2012). This AD model is based on ray-tracing method in the Kerr metric (Fanton et al., 1997; Čadež et al., 1998), for different values of inner and outer radii and inclinations of rings in AD. The emissivity index was kept to be close as possible to the value q = −2, assuming the emissivity law to be ~rq, as expected for the case of photo-ionization mechanism. The model is then constructed using a previous match of the AD profile to the emission line, as a starting point. The scaled contributions of the ring profiles are added to the AD profile until bumpy features in observed spectra are described with the synthetic spectrum. Beside the fact that the shape of the line is fitted more realistic then with a simple AD model, we are also obtaining a valuable information about the radii in the disk plane where the emission is emitted from.
We considered our model as analogy to AD in which the emission is not continuous from Rmin to Rmax, but instead is restricted to emission emission annuli. The physical justification of disk gaps can reside on the removal of the gas disk in systems in which the the emission is not contributing to the emission line shape due to obscuration by dust in the outscirt of BLR (Bon et al., 2016) or by voids produced due to accreting secondary object within the AD plane (Lin and Papaloizou, 1996; Lin, 1997), or in case where gas was originally counterrotating with respect to the black hole spin (Vorobyov et al., 2016), or by an accreting object in the disk plane (Artymowicz et al., 1993). In this case, the disk profile is modeled by the addition of several emission annuli (assuming the same AD model and one inclination value). The analysis of the line profile is otherwise analogous to the excess ring emission model.
3. Results
In order to test this our model interpretation of the BEL profiles, we performed a case study of Arp 102B because it is well-known for its broad emission lines with double peaked shape that was already proposed to correspond to the AD emission profile (Chen and Halpern, 1989; Chen et al., 1989; Sulentic et al., 1990; Eracleous and Halpern, 1994; Antonucci et al., 1996; Newman et al., 1997; Sergeev et al., 2000; Gezari et al., 2007; Jovanović et al., 2010; Popović et al., 2014).
Using the line profile matching to the model, we measure the ring radii that we connect to the variability time scales.
Assuming that the orbital time scale is the only match to time scale of variability patterns seen in these light curves, we combine measured radii ξ and variability scale periods, and derive mass assuming circular Keplerian orbit of this variable region positioned within the AD3.
We measured ξ radii with an AD model in units of gravitational radii (Rg) from the broad emission line profiles. If two or more significant periods were detected, assuming a low cut taken to be at 400 days period (in order to avoid effects of Earth's orbital period of 1 year), then we try to pair the to the parts of an AD which could be perturbed, like inner and outer radius of a ring or a main part of AD, where the interaction with different state medium could be expected4. We test the assumption by calculating the mass of the central BH following Equation (1), with expectation that the obtained results for masses, for each pair of variability time scale and the ring radius, should be equal, or at least to be of similar values.
The example of the model (Figure 1) matched to the observed spectrum of the object Arp 102B is presented in Figure 2. The inclination is 32 degrees, and the AD is truncated in the following rings: 370–1050, 1430–1540, and 3500–3800 Rg, with the emissivity parameter q = −2.1 over the whole model. We note that the result is very similar to other fits of this object (Chen and Halpern, 1989; Chen et al., 1989; Newman et al., 1997), who obtained the same inclination while the complete disk was assumed to correspond to main part of AD in our model, with Rinn = 350 Rg, and Rout = 1000 Rg5. The measurement of variability time scales of light curves is shown in the Figure 3. We find the longer time scale to be about 14 years period (intrinsically 5250 days, after correction for the systematic redshift), while the shorter time scale is taken from earlier variability analysis (Newman et al., 1997; Sergeev et al., 2000; Shapovalova et al., 2013), where the variability time scale was found to be of about 700 days (in the interval 650–750 days, here taken as 680 after scaling for the redshift).
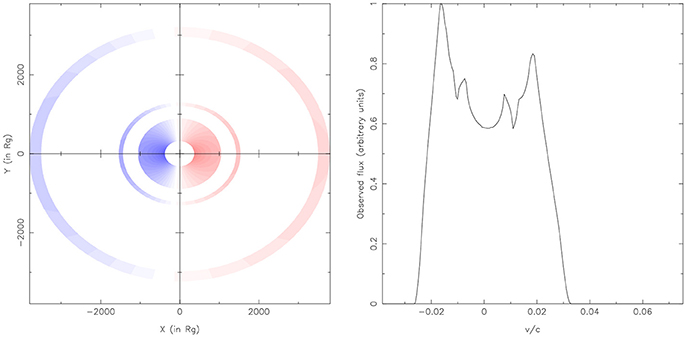
Figure 1. An examples of AD + 2 outer rings (left panel) with corresponding shape of broad line profile, matched to Hα line of Arp 102B in 2.
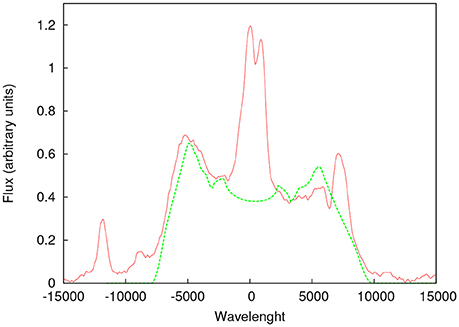
Figure 2. An example of AD + rings model matching the observed broad Hα emission line profiles. Here is presented the case of Arp 102B.
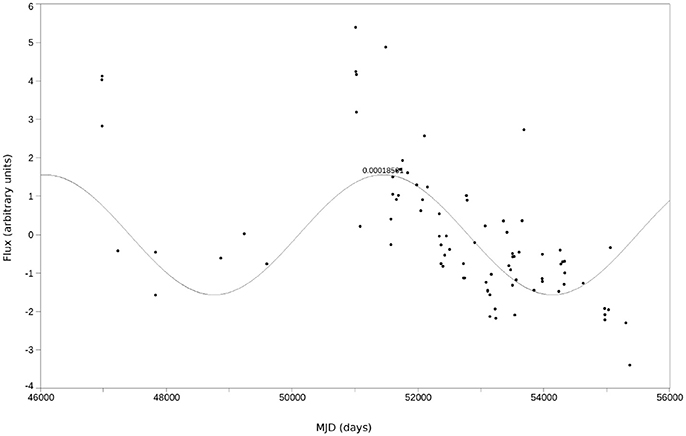
Figure 3. Long term variability analysis of Arp 102B light curve after trend removal correction fitted with the sine function with the period of about 14 years.
We assume that the variability is produced sharp edges of gaps and emitting rings. By matching the inner radius of AD to the corresponding variability time scale (370 Rg with 680 days), and 1500 Rg with 5255 days variability time scale), we obtain the mass of about 2.7 ·108 M⊙ (as an average of these two values: 2.68 ·108 and 2.71 ·108 M⊙). This value is very close to the value of with 2.1 ·108 M⊙ in Newman et al. (1997, obtained from the orbiting hotspot assumption) and not so different from 3.5 ·108 M⊙ suggested in Sergeev et al. (2000, obtained with the model of thousands randum orbiting clouds, mached to the radial velocity maps of broad line variability), and about two times higher then the mass value of 1.1 ·108 M⊙ as suggested in Shapovalova et al. (2013).
The virial product can then be obtained from the 20 day lag of line flux to continuum Shapovalova et al. (2013), and following the formula form Collin et al. (2006) for radial velocity dispersion in case of rectangular shape6 line profile δvr = 14500 / 3.46 ≈ 4,190 km s−1. The virial factor f can then be estimated by computing = 1/f, where MBH, P is the black hole mass computed from the P following Equation 1. Using these values we derive 1/f = 7.36·107/(2.7·108)≈0.287. The 1/f should be equal to ratio of virial product and the mass7 obtained from the period by definition, and f depends on inclination as f≈(sin(i))−2, resulting the inclination of 32°, which is consistent with the value from the AD model fitted to the Hα broad emission line (with our model and earlier fits as well). Therefore, not only that the model gives the consistent mass with the three different period-radii pairs, but also the retrieved inclination from the virial product gives a consistent value of inclination as the AD model fit to the Hα broad emission line.
Admittedly, our model follow from a very strong assumption: the use of variability time scale P (derived from the continuum variation) for estimating the black hole mass and the use of ξ derived from the profile ring should be consistent. The assumption may not be correct in principle, since the P obtained from the continuum may not refer to the same ξ of the profile rings. It requires in-situ emission at the ξ deduced from the ring.
4. Possible Interpretations
Here we do not consider any details about what produces the hot ring regions or the dips in the AD, and we are fully aware that the measured periods are significant above the white noise levels, but may not appear significant compared to the red noise AR curves (Vaughan and Uttley, 2006; Vaughan et al., 2016). We were mainly interested in measuring time scales of orbital periods assuming that the variability patterns (Marziani et al., 2017a,b) in the light curves could be induced by the orbital time scales. Some interpretations of possible periodicities are discussed in many works (Chakrabarti and Wiita, 1994; Eracleous and Halpern, 1994; Newman et al., 1997; Gezari et al., 2007; Popović, 2012; Graham et al., 2015a,b; Bon et al., 2016, 2017; Charisi et al., 2016; Li et al., 2016; Liu et al., 2016). Assuming circular orbits in the disk as we did here, we suggest that possible source of optical variability should be located in the AD, amplifying emission at that radius. We are aware that at such radii, the standard models of thermal emission of AD (Shakura and Sunyaev, 1973) shows that the temperature of the disk is relatively low, under 1,000 K (according to the standard disk model, Shakura and Sunyaev, 1973), which is not sufficient enough for the photo ionization mechanism to produce optical broad emission lines, or to significantly contribute to the optical continuum flux, without additional emission mechanism, like shocks (Chakrabarti and Wiita, 1994; Eracleous and Halpern, 1994; Gezari et al., 2007), hot spot (Newman et al., 1997; Flohic and Eracleous, 2008; Jovanović et al., 2010), secondary orbiting object on a circular orbit around the central SMBH with additional accretion mechanism that is sufficient to produce significant contribution to the continuum and the line emission (see e.g., Lin and Papaloizou, 1996; Lin, 1997; McKernan et al., 2014, where they show a fast forming of intermediate mass BH's in AD with circular orbits arround the cetral SMBH). It is expected that in such cases the voids or gaps would be formed (see for e.g., McKernan et al., 2012, 2013, 2014) in the AD (similar to the planet formation in the stellar disks), with piling up of matter at the outer border of the gap ring (see, McKernan et al., 2013, and the references therein), that may represent the region that could be associated with the ring emission that we modeled here.
5. Conclusions
We simulated an AD emission profiles with additional ring regions and compared them with the observed profiles of the broad Hα emission lines. We measured variability time scales from available optical light curves. We pair each ring profile with the variability time scale. Using Kepler's third law, we then calculate central SMBH masses.
Our results show that:
1) The model of an AD with additional emitting rings or by a sequence of emission annuli separated by gaps could well describe the observed Hα emission line profiles in the case of Arp 102B.
2) Masses calculated from each pair of variability time scale and narrow ring with enhanced emission, result with very similar values providing support for the model and initial hypothesis, indicating that the features fitted in the line profiles are probably emitted in an AD (virial velocity field).
3) We also test our model prediction from the fact that the virial factor depends on the inclination. Since, from the ratio of VP and the mass obtained with our model using Keplerian velocity, we obtain practically identical value of inclination as from the AD fit to the line profile. Therefore this gives another justification of our model.
This result may indicate that the variability time scales of AGN may be connected to the orbiting time scales which depend on the central SMBH mass.
In near future, we plan to extend the sample (Bon et al. 2018, in preparation), selecting more AGN with long term monitoring data.
Author Contributions
EB is responsible for developing the idea and writing the text of the manuscript. PJ developed the code for the model. EB, NB, PJ, PM, and AO worked on analyses and discussions.
Conflict of Interest Statement
The authors declare that the research was conducted in the absence of any commercial or financial relationships that could be construed as a potential conflict of interest.
The reviewer MD declared a shared affiliation, with no collaboration, with several of the authors, EB, PJ, NB and AO, to the handling editor.
Acknowledgments
This research is part of projects 176003 Gravitation and the large scale structure of the Universe and 176001 Astrophysical spectroscopy of extragalactic objects supported by the Ministry of Education and Science of the Republic of Serbia.
Footnotes
1. ^ This is similar as in the case of planetary system where all orbiting objects radii and periods correspond to the same mass of the central body.
2. ^ We tested several different AD models (Fanton et al., 1997; Čadež et al., 1998; Jovanović and Popović, 2008; Jovanović, 2012; Bon et al., 2015) for a line fit, and find that obtained inclinations were practically the same regardless of the model used and also if we adopt more complex model, assuming the additional rings with the same AD parameters (inclination and emissivity law).
3. ^ It is important to stress that emission lines do respond to continuum changes on a timescale that is τ≪P (months vs. 10 years), but this should not invalidate our argument right because the reverberation response τ is much smaller than P, which is the orbital period at radius ξ.
4. ^ We note that the expected orbital periods in optical part of the AD for typical AGN of M ~108 M⊙ should be about 1 year (see for e.g., Gaskell, 2008), but this should not be a problem since also longer periods are detected.
5. ^ We note that at about the same radius was obtained as outer radius of AD in previous disk models (Chen and Halpern, 1989; Chen et al., 1989; Newman et al., 1997).
6. ^ line FWHM/σ == 3.46.
7. ^ f = ((sin(i))2+(H/R)2)−1 as suggested in Netzer (2013), were H/R represents the contribution of isotropic velocity component as a ratio between the width of a disk and the radius of AD. Assuming H/R ≈ 0 the formula transforms into f = (sin(i))−2.
References
Antonucci, R., Hurt, T., and Agol, E. (1996). Spectropolarimetric test of the relativistic disk model for the broad H alpha line of ARP 102B. Astrophys. J. Lett. 456:L25.
Artymowicz, P., Lin, D. N. C., and Wampler, E. J. (1993). Star trapping and metallicity enrichment in quasars and active galactic nuclei. Astrophys. J. 409, 592–603. doi: 10.1086/172690
Bhatta, G., Zola, S., Stawarz, Ł., Ostrowski, M., Winiarski, M., Ogłoza, W., et al. (2016). Detection of possible quasi-periodic oscillations in the long-term optical light curve of the BL Lac object OJ 287. Astrophys. J. 832:47. doi: 10.3847/0004-637X/832/1/47
Bon, E. (2008). The disk emission in single peaked lines for 12 AGNs. Serbian Astron. J. 177, 9–13. doi: 10.2298/SAJ0877009B
Bon, E., Gavrilović, N., La Mura, G., and Popović, L. Č. (2009a). Complex broad emission line profiles of AGN - Geometry of the broad line region. New Astron. Rev. 53, 121–127. doi: 10.1016/j.newar.2009.09.007
Bon, E., Jovanović, P., Marziani, P., Shapovalova, A. I., Bon, N., Borka Jovanović, V., et al. (2012). The first spectroscopically resolved sub-parsec orbit of a supermassive binary black hole. Astrophys. J. 759:118. doi: 10.1088/0004-637X/759/2/118
Bon, E., Marziani, P., and Bon, N. (2017). “Periodic optical variability of AGN,” in New Frontiers in Black Hole Astrophysics, Vol. 324 IAU Symposium, eds A. Gomboc (Ljubljana), 176–179.
Bon, E., Popović, L. Č., Gavrilović, N., La Mura, G., and Mediavilla, E. (2009b). Contribution of a disc component to single-peaked broad lines of active galactic nuclei. Mon. Not. R. Astron. Soc. 400, 924–936. doi: 10.1111/j.1365-2966.2009.15511.x
Bon, E., Popović, L. Č., Ilić, D., and Mediavilla, E. (2006). Stratification in the broad line region of AGN: The two-component model. New Astron. Rev. 50, 716–719. doi: 10.1016/j.newar.2006.06.015
Bon, E., Zucker, S., Netzer, H., Marziani, P., Bon, N., Jovanović, P., et al. (2016). Evidence for Periodicity in 43 year-long Monitoring of NGC 5548. Astrophys. J. Suppl. 225:29. doi: 10.3847/0067-0049/225/2/29
Bon, N., Bon, E., Marziani, P., and Jovanović, P. (2015). Gravitational redshift of emission lines in the AGN spectra. Astrophys. Space Sci. 360:7. doi: 10.1007/s10509-015-2555-5
Čadež, A., Fanton, C., and Calvani, M. (1998). Line emission from accretion discs around black holes: the analytic approach. New Astron. 3, 647–654.
Chakrabarti, S. K. and Wiita, P. J. (1994). Variable emission lines as evidence of spiral shocks in accretion disks around active galactic nuclei. Astrophys. J. 434, 518–522. doi: 10.1086/174753
Charisi, M., Bartos, I., Haiman, Z., Price-Whelan, A. M., Graham, M. J., Bellm, E. C., et al. (2016). A population of short-period variable quasars from PTF as supermassive black hole binary candidates. Mon. Not. R. Astron. Soc. 463, 2145–2171. doi: 10.1093/mnras/stw1838
Chen, K. and Halpern, J. P. (1989). Structure of line-emitting accretion disks in active galactic nuclei - ARP 102B. Astrophys. J. 344, 115–124.
Chen, K., Halpern, J. P., and Filippenko, A. V. (1989). Kinematic evidence for a relativistic Keplerian disk - ARP 102B. Astrophys. J. 339, 742–751.
Collin, S., Kawaguchi, T., Peterson, B. M., and Vestergaard, M. (2006). Systematic effects in measurement of black hole masses by emission-line reverberation of active galactic nuclei: eddington ratio and inclination. Astron. Astrophys. 456, 75–90. doi: 10.1051/0004-6361:20064878
Czerny, B. (2006). “The role of the accretion disk in AGN variability,” in Astronomical Society of the Pacific Conference Series, Astronomical Society of the Pacific Conference Series, Vol. 360, eds C. M.Gaskell, I. M. McHardy, B. M. Peterson, and S. G. Sergeev (San Francisco, CA), 265.
Denney, K. D., Peterson, B. M., Pogge, R. W., Adair, A., Atlee, D. W., Au-Yong, K., et al. (2009). Diverse kinematic signatures from reverberation mapping of the broad-line region in AGNs. Astrophys. J. Lett. 704, L80–L84. doi: 10.1088/0004-637X/704/2/L80
Eracleous, M. and Halpern, J. P. (1994). Doubled-peaked emission lines in active galactic nuclei. Astrophys. J. Suppl. 90, 1–30.
Fanton, C., Calvani, M., de Felice, F., and Cadez, A. (1997). Detecting accretion disks in active galactic nuclei. Publ. Astron. Soc. Jpn. 49, 159–169.
Flohic, H. M. L. G. and Eracleous, M. (2008). Interpreting the variability of double-peaked emission lines in active galactic nuclei with stochastically perturbed accretion disk models. Astrophys. J. 686, 138–147. doi: 10.1086/590547
Gaskell, C. M. (2008). “Accretion disks and the nature and origin of AGN continuum variability,” in Revista Mexicana de Astronomia y Astrofisica Conference Series, Vol. 32 (Huatulco), 1–11.
Gavrilović, N., Bon, E., Popović, L. Č., and Prugniel, P. (2007). “Determination of accretion disc parameters in the case of five AGN with double-peaked lines,” in Spectral Line Shapes in Astrophysics, American Institute of Physics Conference Series, Vol. 938, eds L. C. Popovic and M. S. Dimitrijevic, 94–97.
Gezari, S., Halpern, J. P., and Eracleous, M. (2007). Long-term profile variability of double-peaked emission lines in active galactic nuclei. Astrophys. J. Suppl. 169, 167–212. doi: 10.1086/511032
Graham, M. J., Djorgovski, S. G., Stern, D., Drake, A. J., Mahabal, A. A., Donalek, C., et al. (2015a). A systematic search for close supermassive black hole binaries in the Catalina Real-time Transient Survey. Mon. Not. R. Astron.Soc. 453, 1562–1576. doi: 10.1093/mnras/stv1726
Graham, M. J., Djorgovski, S. G., Stern, D., Glikman, E., Drake, A. J., Mahabal, A. A., et al. (2015b). A possible close supermassive black-hole binary in a quasar with optical periodicity. Nature 518, 74–76. doi: 10.1038/nature14143
Ilić, D., Shapovalova, A. I., Popović, L. Č., Chavushyan, V., Burenkov, A. N., Kollatschny, W., et al. (2017). Long-term monitoring of the broad-line region properties in a selected sample of AGN. Front. Astron. Space Sci. 4:12. doi: 10.3389/fspas.2017.00012
Jovanović, P. (2012). The broad Fe Kα line and supermassive black holes. New Astron. Rev. 56, 37–48. doi: 10.1016/j.newar.2011.11.002
Jovanović, P. and Popović, L. Č. (2008). Observational effects of strong gravity in vicinity of supermassive black holes. Fortschr. Phys. 56, 456–461. doi: 10.1002/prop.200710519
Jovanović, P., Popović, L. Č., Stalevski, M., and Shapovalova, A. I. (2010). Variability of the Hβ line profiles as an indicator of orbiting bright spots in accretion disks of quasars: a case study of 3C 390.3. Astrophys. J. 718, 168–176. doi: 10.1088/0004-637X/718/1/168
Kaspi, S., Smith, P. S., Netzer, H., Maoz, D., Jannuzi, B. T., and Giveon, U. (2000). Reverberation measurements for 17 quasars and the size-mass-luminosity relations in active galactic nuclei. Astrophys. J. 533, 631–649. doi: 10.1086/308704
Li, Y.-R., Wang, J.-M., Ho, L. C., Lu, K.-X., Qiu, J., Du, P., et al. (2016). Spectroscopic indication of a centi-parsec supermassive black hole binary in the galactic center of NGC 5548. Astrophys. J. 822:4. doi: 10.3847/0004-637X/822/1/4
Lin, D. N. C. (1997). “Star/disk interaction in the nuclei of active galaxies,” in IAU Colloq. 159: Emission Lines in Active Galaxies: New Methods and Techniques, Astronomical Society of the Pacific Conference Series, Vol. 113, eds B. M. Peterson, F.-Z. Cheng, and A. S. Wilson (Shanghai), 64.
Lin, D. N. C. and Papaloizou, J. C. B. (1996). Theory of accretion disks II: application to observed systems. Annu. Rev. Astron. Astrophys. 34, 703–748.
Liu, T., Gezari, S., Burgett, W., Chambers, K., Draper, P., Hodapp, K., et al. (2016). A Systematic Search for Periodically Varying Quasars in Pan-STARRS1: An Extended Baseline Test in Medium Deep Survey Field MD09. Astrophys. J. 833:6. doi: 10.3847/0004-637X/833/1/6
Lomb, N. R. (1976). Least-squares frequency analysis of unequally spaced data. Astrophys. Space Sci. 39, 447–462.
Marziani, P., Bon, E., Grieco, A., Bon, N., Dultzin, D., Del Olmo, A., et al. (2017a). “Optical variability patterns of radio-quiet and radio-loud quasars,” in New Frontiers in Black Hole Astrophysics, IAU Symposium, Vol. 324, ed A. Gomboc (Ljubljana), 243–244.
Marziani, P., Negrete, C. A., Dultzin, D., Martinez-Aldama, M. L., Del Olmo, A., Esparza, D., Sulentic, J. W., D'Onofrio, M., Stirpe, G. M., Bon, E., and Bon, N. (2017b). “Highly accreting quasars: a tool for cosmology?,” in New Frontiers in Black Hole Astrophysics, IAU Symposium, Vol. 324, eds A. Gomboc (Ljubljana), 245–246.
Marziani, P., Sulentic, J. W., Dultzin-Hacyan, D., Calvani, M., and Moles, M. (1996). Comparative analysis of the high- and low-ionization lines in the broad-line region of active galactic nuclei. Astrophys. J. Suppl. 104:37.
McKernan, B., Ford, K. E. S., Kocsis, B., and Haiman, Z. (2013). Ripple effects and oscillations in the broad Fe Kα line as a probe of massive black hole mergers. Mon. Not. R. Astron. Soc. 432, 1468–1482. doi: 10.1093/mnras/stt567
McKernan, B., Ford, K. E. S., Kocsis, B., Lyra, W., and Winter, L. M. (2014). Intermediate-mass black holes in AGN discs - II. Model predictions and observational constraints. Mon. Not. R. Astron. Soc. 441, 900–909. doi: 10.1093/mnras/stu553
McKernan, B., Ford, K. E. S., Lyra, W., and Perets, H. B. (2012). Intermediate mass black holes in AGN discs - I. Production and growth. Mon. Not. R. Astron. Soc., 425, 460–469. doi: 10.1111/j.1365-2966.2012.21486.x
Netzer, H. (2013). The Physics and Evolution of Active Galactic Nuclei. Cambridge, UK: Cambridge University Press.
Newman, J. A., Eracleous, M., Filippenko, A. V., and Halpern, J. P. (1997). Measurement of an active galactic nucleus central mass on centiparsec scales: results of long-term optical monitoring of Arp 102B. Astrophys. J. 485, 570–580.
Peterson, B. M. (1997). An Introduction to Active Galactic Nuclei. Cambridge; New York, NY: Cambridge University Press.
Peterson, B. M., Berlind, P., Bertram, R., Bischoff, K., Bochkarev, N. G., Borisov, N., et al. (2002). Steps toward determination of the size and structure of the broad-line region in active galactic nuclei. XVI. A 13 year study of spectral variability in NGC 5548. Astrophys. J. 581, 197–204. doi: 10.1086/344197
Popović, L. Č. (2012). Super-massive binary black holes and emission lines in active galactic nuclei. New Astronomy Reviews, 56:74–91.
Popovic, L. C., Bon, E., and Gavrilovic, N. (2008). “The broad emission lines in AGN: hidden disk Emission,” in Revista Mexicana de Astronomia y Astrofisica Conference Series, Vol. 32 (Mexico city), 99–101.
Popović, L. Č., Mediavilla, E., Bon, E., and Ilić, D. (2004). Contribution of the disk emission to the broad emission lines in AGNs: two-component model. Astron. Astrophys. 423, 909–918. doi: 10.1051/0004-6361:20034431
Popović, L. Č., Mediavilla, E. G., Bon, E., Stanić, N., and Kubičela, A. (2003). The line emission region in III Zw 2: kinematics and variability. Astrophys. J. 599, 185–192. doi: 10.1086/379277
Popović, L. Č., Shapovalova, A. I., Ilić, D., Burenkov, A. N., Chavushyan, V. H., Kollatschny, W., et al. (2014). Spectral optical monitoring of the double-peaked emission line AGN Arp 102B. II. Variability of the broad line properties. Astron. Astrophys. 572:A66. doi: 10.1051/0004-6361/201423555
Scargle, J. D. (1982). Studies in astronomical time series analysis. II - Statistical aspects of spectral analysis of unevenly spaced data. Astrophys. J. 263, 835–853.
Sergeev, S. G., Doroshenko, V. T., Dzyuba, S. A., Peterson, B. M., Pogge, R. W., and Pronik, V. I. (2007). Thirty years of continuum and emission-line variability in NGC 5548. Astrophys. J. 668, 708–720. doi: 10.1086/520697
Sergeev, S. G., Pronik, V. I., and Sergeeva, E. A. (2000). Arp 102B: variability patterns of the Hα line profile as evidence for gas rotation in the broad-line region. Astron. Astrophys. 356, 41–49.
Shakura, N. I. and Sunyaev, R. A. (1973). Black holes in binary systems. Observational appearance. Astron. Astrophys. 24, 337–355.
Shapovalova, A. I., Popović, L. Č., Burenkov, A. N., Chavushyan, V. H., Ilić, D., Kollatschny, W., et al. (2013). Spectral optical monitoring of a double-peaked emission line AGN Arp 102B. Variability of spectral lines and continuum. Astron. Astrophys. 559:A10. doi: 10.1051/0004-6361/201321781
Strateva, I. V., Strauss, M. A., Hao, L., Schlegel, D. J., Hall, P. B., Gunn, J. E., et al. (2003). Double-peaked low-ionization emission lines in active galactic nuclei. Astron. J. 126, 1720–1749. doi: 10.1086/378367
Sulentic, J. W., Bachev, R., Marziani, P., Negrete, C. A., and Dultzin, D. (2007). C IV λ1549 as an eigenvector 1 parameter for active galactic nuclei. Astrophys. J. 666:757–777. doi: 10.1086/519916
Sulentic, J. W., Zheng, W., Calvani, M., and Marziani, P. (1990). Implications of ARP 102B - Line emission from an accretion disk? Astrophys. J. Lett. 355, L15–L18.
Vaughan, S. and Uttley, P. (2006). Detecting X-ray QPOs in active galaxies. Adv. Space Res. 38, 1405–1408. doi: 10.1016/j.asr.2005.02.064
Vaughan, S., Uttley, P., Markowitz, A. G., Huppenkothen, D., Middleton, M. J., Alston, W. N., et al. (2016). False periodicities in quasar time-domain surveys. Mon. Not. R. Astron. Soc. 461, 3145–3152. doi: 10.1093/mnras/stw1412
Keywords: galaxies, active-galaxies, quasar, supermassive black holes, quasar, emission lines, line, profiles
Citation: Bon E, Jovanović P, Marziani P, Bon N and Otašević A (2018) Exploring Possible Relations Between Optical Variability Time Scales and Broad Emission Line Shapes in AGN. Front. Astron. Space Sci. 5:19. doi: 10.3389/fspas.2018.00019
Received: 29 November 2017; Accepted: 11 May 2018;
Published: 01 June 2018.
Edited by:
Deborah Dultzin, Universidad Nacional Autónoma de México, MexicoReviewed by:
Omaira Gonzàlez Martín, Instituto de Radioastronomía y Astrofísica, MexicoMilan S. Dimitrijevic, Astronomical Observatory, Serbia
Copyright © 2018 Bon, Jovanović, Marziani, Bon and Otašević. This is an open-access article distributed under the terms of the Creative Commons Attribution License (CC BY). The use, distribution or reproduction in other forums is permitted, provided the original author(s) and the copyright owner are credited and that the original publication in this journal is cited, in accordance with accepted academic practice. No use, distribution or reproduction is permitted which does not comply with these terms.
*Correspondence: Edi Bon, ebon@aob.bg.ac.rs