Accounting for Research Induced Environmental Impacts Using Life Cycle Assessment
 Ronan Cooney
 Alexandre Tahar
 Alan Kennedy
 Eoghan Clifford
- 1School of Engineering, College of Engineering and Science, National University of Ireland, Galway, Ireland
- 2Ryan Institute, National University of Ireland, Galway, Ireland
Since the 1970's the number of scientific publications with sustainability as a keyword has increased from 1 in 1975 to 13,628 in 2019. Research, like all human endeavors, has impacts on the environment due to the activities required to generate the supporting data (i.e., use of vehicles, resources, and materials). Researchers have a responsibility to minimize their impacts as part of their work and to make environmentally responsible decisions. A life-cycle approach is currently the best-developed means of assessing the impact of a group or organization. This article presents a case study of organizational life cycle assessment (O-LCA) of a research project. The objectives of this study were to (i) estimate the impact of the project, focusing on travel. (ii) Use a post hoc approach to determine impact reduction opportunities. (iii) Apply O-LCA as a decision-making tool in project management of research and (iv) profile the environmental impact of the project using public data (manufacturers figures) and proprietary datasets. The results of this study indicate that the greatest impact arising from the project was due to commuting followed by conference and training attendance, fieldwork and meetings. Scenarios modeling, alternative vehicle use, flexible working arrangements and stakeholder events highlighted the reduction potential that could have been implemented as part of the project. O-LCA proved to be an appropriate tool for assessing the impact of a research group and that it has the potential to inform decisions and management of academic projects and events. It should be noted that the ability of research groups or personnel to bring about change might be limited, typically due to their placement within a larger organization (e.g., a higher education institute). The recent COVID-19 pandemic, has hastened the shift to remote working practices for many organizations. Recent surveys indicate that more than 80% of respondents would like to work remotely, at least some of the time, after the pandemic. This modal shift in working practices offers an immediate opportunity for environmental relief. It is recommended that O-LCA be incorporated into groups and organizations to support their decision-making practices to foster responsible and sustainable research.
Introduction
As the impacts of human activities become visible and the realities of climate change become evident, the number of research projects, programmes, and initiatives focusing on sustainability and sustainable production has increased. A search on the academic database, Scopus, revealed that between 1970 and 2016 the number of peer-reviewed articles featuring the terms “sustainability” and “sustainable” have increased from 1 and 5, to 11,962 and 21,664 respectively (Figure 1). This increase in the volume of publications comes at a price. These publications hide an indirect impact due to the resources used, the fieldwork carried out, the meetings attended and the conferences where the research was disseminated. All these aspects of research bear a direct and indirect burden on the natural environment. Thus, when investigating the impacts and sustainability of their topics and areas, researchers should look to minimize or estimate the environmental impacts associated with their work.
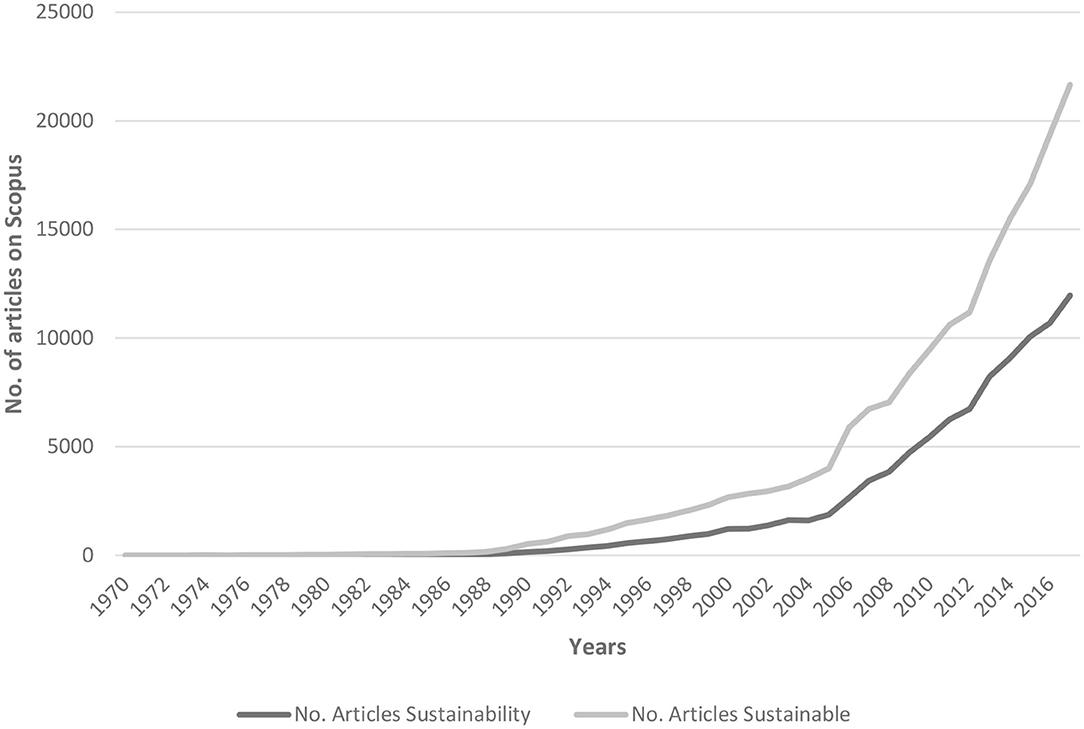
Figure 1. The number of publications available on the academic database, SCOPUS (accessed May, 2018).
An area which has not been established or investigated in the literature is that of the environmental burden associated with research into sustainability and sustainable practices. The exact number of projects and programmes researching sustainability is difficult to quantify, as the term can be used in many forms (i.e., development, planning, transport, production etc.). A study from 2006 (Pretty et al., 2006), reviewed 286 agricultural sustainability projects in East and South Asia. Since that publication, there does not appear to be any document, paper or database reporting on the number of projects researching sustainability either at a regional or global scale. Without definite information on the number and duration of projects investigating sustainability in an area, it is difficult to approximate the potential burden of associated research. As researchers into sustainable practices and resource efficiency, it is imperative that the impacts associated with a research project, programme, or group be considered throughout the life cycle of the project.
A phrase which should become the mantra of researchers focusing on sustainability is, “What saves us is efficiency - the devotion to efficiency”, this phrase was written by Joseph Conrad in his 1905 novel “Heart of Darkness” in the context of the “efficiency” with which colonial powers exploited human resources with modern methods (Alexander, 2008). Using the modern interpretation of the word efficiency, as defined in the Oxford dictionary – “preventing the wasteful use of a resource,” the applicability of this phrase as the mantra for sustainable research into sustainability becomes evident. As researchers this would translate into us applying the most efficient means of achieving the objective. The phrase is consistent with life cycle thinking, which aims to increase the scope of a process beyond traditional metrics and incorporate environmental, social and economic impacts that can inform decision makers (UNEP/SETAC, 2012).
The incorporation of life cycle thinking into project management using the United Nations Environmental Programme, Society of Environmental Toxicology and Chemistry (UNEP/SETAC) organizational life cycle assessment (O-LCA) guidelines offers a framework that can be applied to research groups and their respective organizations.
O-LCA is a relatively new area of research within the field of life cycle assessment (LCA) and sustainability studies. The framework and guidelines having been published by the UNEP and SETAC in 2015 and by ISO/TS in 2014 (ISO/TS 14072). O-LCA can be defined as the analysis of the activities of an organization, to determine the associated impacts and provide a better understanding of the environmental burden (and mitigation opportunities) of an organizations activities (Martínez-Blanco et al., 2015b). LCA was originally developed to assess the burden associated with production systems (Guinée, 2002), but its underlying principles and concepts have the potential to identify inefficiencies and promote positive changes in how organizations perform and the impacts associated with their operation. By reaching a better understanding of the impacts, material and energy flows associated with an organization, focus can be placed on the optimal means of reducing life cycle impacts while improving its sustainability either economically, socially, or environmentally (Martínez-Blanco et al., 2015a). O-LCA calls for a focus on more than just single aspects of production chains and activities and can thus provide a more holistic assessment than conventional carbon-foot print approaches such as the Organization Environment Footprint (Martínez-Blanco et al., 2015a,b; Finkbeiner, 2016). The multi-impact approach adopted by O-LCA can provide deeper understanding of an organization. Organizations can benefit by the identification of impact reduction opportunities, carbon budgeting of projects, strengthening of the argument for greater funding for remote technologies (to reduce travel), improvements in knowledge control, practical, and quantifiable implementation of environmental awareness strategies and fulfillment of social responsibility (Finkbeiner, 2016; Forin et al., 2018). To date only a handful of O-LCA studies have been published (Jungbluth et al., 2016; Lo-Iacono-Ferreira et al., 2016; Martínez-Blanco et al., 2016; Resta et al., 2016; Neppach et al., 2017; de Camargo et al., 2018; Forin et al., 2018). The application of O-LCA to research projects or activities is particularly timely given the COVID-19 pandemic and the resultant changes it has had on travel and working patterns.
To echo Forin et al. (2018) “case studies are essential” for the promotion, debate and development of O-LCA. The present study provides a case study of the application of O-LCA to a multi-annual, multi-agency research project studying sustainable aquaculture. The key objectives of this case study were to (i) determine the impact of the research project, by focusing on vehicle use and using a post-hoc approach. (ii) Determine impact reduction opportunities, during the cycle of a research project by modeling interventions and alternative scenarios, and (iii) to assess the use of O-LCA as a project management tool for research.
Three scenarios were conducted on the data gathered to ascertain the likely related impacts of the project with the use of (i) electric vehicles (EVs) in lieu of conventional internal combustion engine (ICE) vehicles, (ii) fulltime personnel encouraged to use flexible working arrangements (in this instance to work from their residence 1 day per week), and (iii) the use of public transport by attendees at events hosted by the project. The method, approaches and results of this study may also be of interest to researchers in estimating or assessing the reduction of their environmental burden since the onset of the COVID-19 pandemic.
Methodological Approach
Conceptual Framework
The O-LCA methodology is based on the underlying guidelines and principles of conventional product based LCAs. The steps involved are similar to process based LCAs as the goal and scope must be defined, the study must build a life cycle inventory (LCI), conduct a life cycle impact assessment (LCIA) and interpret the results. The major differences between O-LCA and traditional LCA can be divided into three critical areas (Martínez-Blanco et al., 2015a; Forin et al., 2018), (i) the object of the study in LCA is termed the product and focuses on a good or service. In an O-LCA the product is exchanged for an organization. An organization can be defined as a person or a group of individuals working toward a common objective, or in roles which purport to achieve the goals of an organization (Martínez-Blanco et al., 2015a), (ii) the unit of analysis in an LCA is referred to as the functional unit, the reference unit to which inputs, outputs and impacts are ascribed. For an O-LCA study, the unit of analysis is referred to as the reporting unit (Martínez-Blanco et al., 2015a), and (iii) the final area is that of the boundaries applied to the approach. The system boundary in an LCA defines the flows and processes of a production system. System boundaries in O-LCA set the limits of the study and include the operations of the reporting organization, the materials and resources used and the resulting emissions (Martínez-Blanco et al., 2015a,b; Finkbeiner, 2016). For more definitive descriptions and methodology choices see; Finkbeiner (2016), Martínez-Blanco et al. (2015a), Martínez-Blanco et al. (2015b), and Forin et al. (2018).
The conceptual framework for the study presented in this document focused on estimating the environmental burden of a medium term research project (Figure 2). This approach used a number of data sources to generate the research question and LCI of the reporting unit. Tail-pipe emissions from the vehicles used were estimated using the manufacturers figures (i.e., g CO2/km) and background data (i.e., fuel production) were sourced from the LCI database ecoinvent (Wernet et al., 2016). These datasources were selected as they offer two avenues to researchers or practitioners, (i) not every research project has access to comprehensive LCI databases, using readily available figures (i.e., manufacturers figures) allows for reproducible approximations, and (ii) the use of an LCI database provides more holistic data and by its nature is oriented toward LCA. These databases also allow for a deeper understanding of the production chain of fuel and its use.

Figure 2. The conceptual framework of the presented case study.
Data on travel activities or events associated with the project were collated using a blended approach. Multiple sources or records were consulted. These included the review of health and safety documents, travel or mileage claims and interviews with project personnel. Table 1 outlines how data for each of the activities were collected and provides examples on the types of data they contributed.
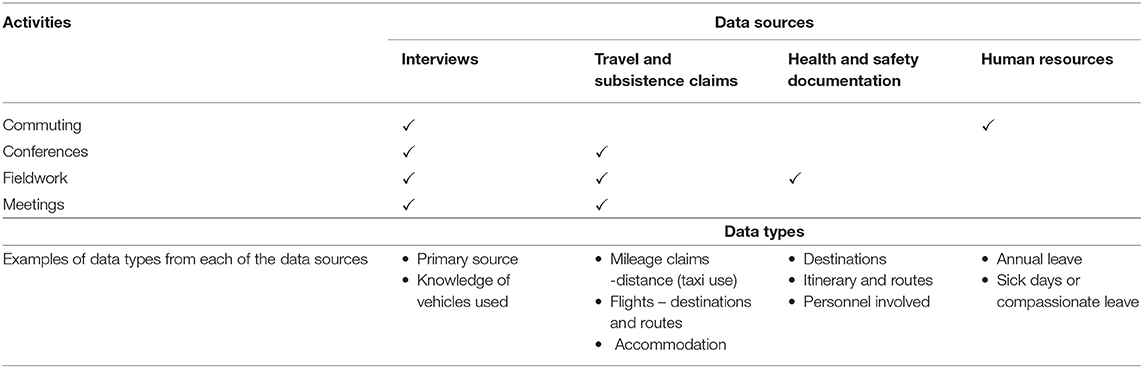
Table 1. The different data sources and examples of the types of data they contributed to the LCI.
Three scenarios were conducted to investigate impact reduction opportunities, which could have been implemented, likely impacts of such a project where EVs were used and to determine the most environmentally conscious options available. Scenario (1) outlines the associated impacts of the project, if personnel used EVs. Scenario (2) investigated the reduction potential associated with having personnel work from home 1 day per week, negating the need to commute to work on that day. Scenario (3) considered stakeholder impact reduction opportunities, where public transportation was used instead of personal vehicles.
The EV scenario was considered as the uptake of EVs has been positive. Electric car sales have increased by 54% in Europe from 2016 (IEA, 2018) and initiatives such as the EV30@30 campaign (a campaign by the Clean Energy Ministerial which aims at having 30% of vehicle sales being EVs by 2030). Studies into adoption of EVs indicate that individuals who are environmentally conscious (Ziegler, 2012; Plötz et al., 2014) and those with advanced degrees (Hidrue et al., 2011; Egbue and Long, 2012) are often among the early adopters of new technology. Based on this indication, a scenario where individuals used EVs instead of internal combustion engine vehicle (ICEV) was devised. As researchers into sustainability, it would be likely that individuals such as those involved with the case study project would be early adopters of EVs. In this study, an EV was defined as any of the three following types – hybrid electric vehicles (HEVs), plug in electric hybrid vehicles (PHEVs) and battery electric vehicles (BEVs).
The flexible working arrangement scenario was included as there is a trend in organizations offering their personnel this option (Kelliher and Anderson, 2009). This scenario modeled the reduced environmental impact that could have been attained if certain personnel were encouraged to work from their residence 1 day per week (this is a conservative scenario given the onset of COVID-19).
The stakeholder scenario was included as there is often a call for the increased use of public transportation in event organization and travel. Aquaculture in Ireland primarily occurs in the North-west and South-west of the country (Grealis et al., 2017). These regions are typically not well-serviced by motorways or public transportation options, which necessitate high levels of reliance on private transportation. This scenario investigated which of these transportation options was the most environmentally conscious choice, when inviting industry delegates to workshops and events.
The goal of this study was to establish the environmental burden associated with a 2-year research project in Ireland and to investigate the use of O-LCA as a tool optimizing project management to limit life cycle impacts due to the project. The reporting organization was defined as the MOREFISH project and included staff directly working on the project and attendees at project events.
Scope of the Assessment
System Boundaries
The system boundaries focused on travel activities that occurred within the projects reference period (Figure 3). These activities included (i) commuting to work, (ii) fieldwork impacts relating to mileage claims, (iii) air travel and (iv) stakeholder events. Excluded from the study were personal mobile devices, deliveries of supplies and equipment, traffic congestion, infrastructure, consumables, and the spending of wages. The use of electrical equipment, energy use and consumables should be included in future studies to better inform on the impacts of a research project. However, it was not possible to include these in this study as it was designed subsequent to the project.
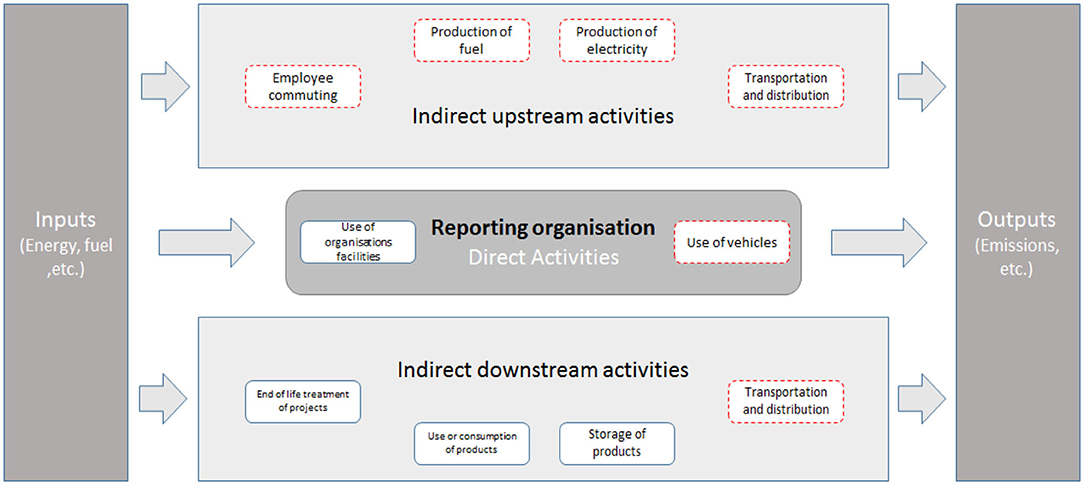
Figure 3. The scope and activities associated with the operation of such a project. Boxes highlighted with red dashed lines indicate the activities assessed as part of the study. Figure adapted from the UNEP/SETAC O-LCA guidelines (2015).
Reporting Flow
The reporting flow of the study, as per UNEP/SETAC UNEP (2015), was defined on a temporal scale i.e., the project duration (01/01/2015-31/08/2017). During this time, there were a total of 2,017 travel events (a travel event was defined as a roundtrip journey) associated with the project and 51 stakeholder events (treated the same as a travel event) by project personnel. These travel events were broken down into the mode of transport used: road (car/van/SUV), air, bus, and rail and further classified as commuting activities, fieldwork activities, conference and training activities, and meeting activities. These categories were then assessed on tailpipe emissions by analyzing carbon dioxide (CO2), nitrous oxides (NOx), particulate matter (PM) and fuel consumption1. Fuel consumption and use was further investigated to determine the indirect impacts of fuel use (i.e., the production and transportation of the fuel), using the LCI database, ecoinvent 3.4 (Wernet et al., 2016). The reporting flow accounted for the environmental burden of the MOREFISH project and was regarded as the reference scenario.
Life Cycle Inventory and Life Cycle Impact Assessment
The inventory for this study was created using a mix of proprietary data, public reports and LCA databases (Table 2). Proprietary data was gathered using personnel questionnaires, travel and expenses claims. Project personnel included two principle investigators (PIs), two post-doctoral researchers (PDs), two post-graduate researchers (PGs), a research fellow (RF), and the project manager (PMR). The PIs of this project were contracted to spend 10% of their working hours on the project. This resulted in 10% of their commuting emissions and distance being allocated to the project. The RF had no dedicated time to the project but was active in an advisory role. Manufacturers' figures were used to determine average fuel use and the tailpipe emissions for each vehicle. Background processes such as fuel and energy production were taken from the LCI database, ecoinvent version 3.4 (Wernet et al., 2016). Data related to air travel, bus, rail and trams were also extracted from ecoinvent 3.4.
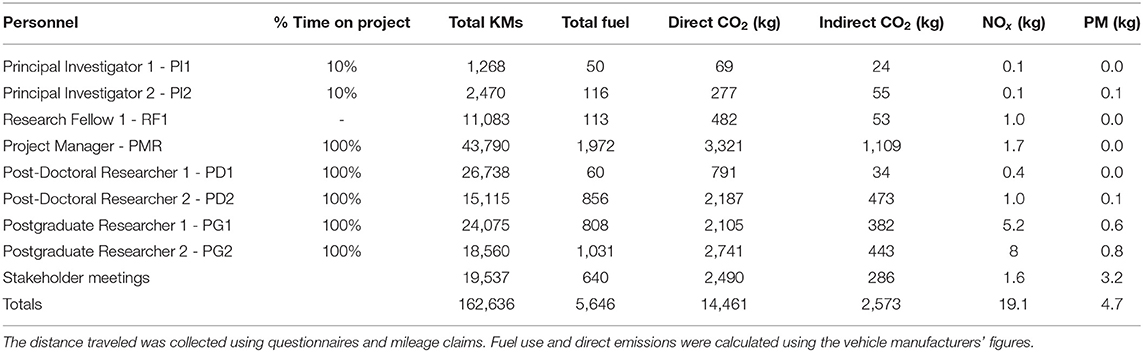
Table 2. The inventory for the project.
The LCIA of the study was conducted using the CML 2001 characterization factors (Guinée, 2002). The impact categories assessed as part of this study included abiotic depletion potential (ABP) in megajoules (MJ), global warming potential (GWP), ozone layer depletion (ODP), human toxicity potential (HTP), freshwater aquatic ecotoxicity potential (FWAETP), marine aquatic ecotoxicity potential (MAETP), terrestrial ecotoxicity potential (TETP), photochemical oxidation potential (POP), acidification potential (AP), and eutrophication potential (EP). Using the CML characterization factors, manufacturers NOx emissions were assessed for HTP, AP, and EP.
Sensitivity and Scenario Analysis
Scenario 1 – Electric Vehicles
Private vehicles used by project personnel during the project were substituted with EVs of a similar class and projected value of the ICEV it replaced. The closest equivalent EVs were selected on the criteria of the class (sports car, small family car etc.) and value of the reference vehicle. For example, PG1 operated a Peugeot 307, a small family car. An EV that could replace this, would be a Citroën DS5, also a small family car. The commercial vehicles used during the project were substituted with the closest EV commercial equivalents (Table 3). In this instance, the ICEV Nissan Pathfinder was substituted with a PHEV Mitsubishi Outlander and the ICEV Ford Transit was substituted with a BEV Nissan eNV200. Emissions for PHEVs were calculated based on the assumptions used by the Sustainable Energy Authority of Ireland in their EV comparison calculator (www.seai.ie)2. The main assumption being that 40% of total kilometers traveled would be on electric only. As such, PHEV emissions were calculated using the following equations (Equations 1–4):
Where d is the distance traveled (km), Ef is the manufacturers figures for tail pipe emissions (mg/km), No. occupants is the number of passengers - including the driver involved with the trip, W/km is the power requirement per km based on the vehicle traveling 40% of the distance on electric power only and Carbon Intensity is the kg CO2eq/kWh released during the production of the electricity used to power the vehicle in electric mode.
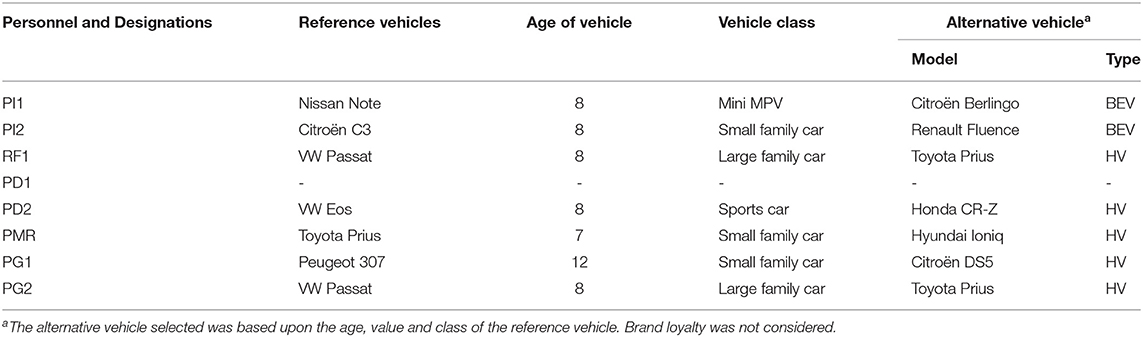
Table 3. The reference vehicles owned and operated by personnel during the project and the alternative vehicles assigned to project personnel.
Scenario 2 – Flexible Working
The categories of this scenario were the same as the reference, for all but commuting impacts. More senior personnel who were not devoted 100% to the project (i.e., the two PIs and RF) were excluded from this reduced commuting frequency, as there could still be a requirement for them to be present in the University to oversee other projects and personnel.
Scenario 3 – Stakeholder Meetings
In this scenario the vehicles used by the stakeholders (age and fuel type), the distances traveled, and tailpipe emissions incurred due to their attendance at the MOREFISH meetings were recorded (Table 4).
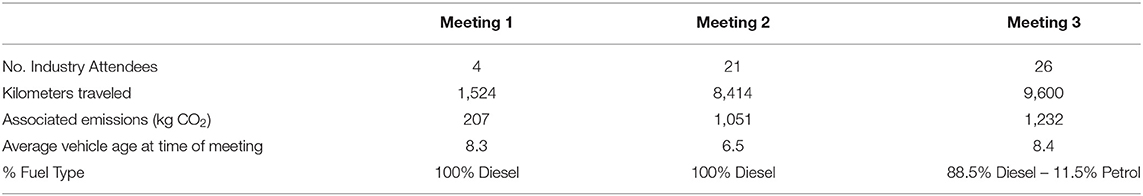
Table 4. The number of attendees, and distance traveled increased for each progressive workshop.
There were three stakeholder meetings, a kick off meeting in May 2015, a follow up meeting in October of 2016 and a final meeting in January 2017. To analyse the distance and mode by which individuals could have attended events using public transport a number of assumptions were made. These were; (i) that delegates would travel up to 25% of the full distance to avail of public transport with a more direct route than the nearest available option (this was taken as the maximum time people would travel for public transport before they would have used personal transport), (ii) that where possible people would use the cheapest transport option, in the Irish instance bus rather than rail, and (iii) that delegates would drive their average commuting distance to arrive at the closest direct public transportation route, except in the instances where assumption (i) was used. This was represented using Equation (5):
Where is the average commuting distance of the stakeholder, PTR is public transport route and SBR is the distance of a return journey via the shuttle bus. Average commuting distances for delegates from Ireland were sourced from the Central Statistics Office of Ireland (CSO, 2017; ROI Transport, 2018) and for stakeholders traveling from Northern Ireland, the Department for Infrastructure report on travel (DOI, 2018; NI Transport, 2018).
To avail of parking, attendees were required to supply their vehicle registration numbers. The registration number was later searched in an online database of motor vehicles (www.cartell.ie) from which the vehicle year, make, model, engine capacity, fuel type, and Euro Emissions Standard were collected. From this information, it was possible to further determine the manufacturer's official figures for CO2, NOx, PM emissions, and fuel consumption.
Results
The results of the analysis are presented in two parts. Within each section the results using the manufacturers figures are presented, followed by combing these results with background LCI data on fuel production from ecoinvent.
Reference
Analysis of the project interviews and records revealed that project personnel traveled 143,098 km over the life of the project. This figure included all the distances traveled by project personnel using public (bus, rail, air, and taxi travel) and private transportation (personal vehicles). Table 5 displays the total direct emissions of the project based on the figures stipulated by the vehicle manufacturers displayed by category.
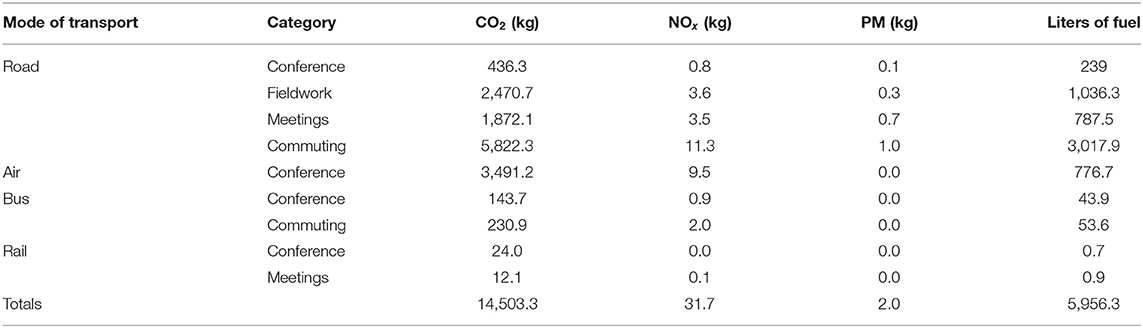
Table 5. The direct emissions arising from vehicle use and the estimated fuel use (based on manufacturers figures).
Commuting
Unsurprisingly, the bulk of project events (86.2%) were due to personnel commuting to their place of work. Commuting accounted for 38.7% of the total distance traveled during the project (private vehicle and public transportation combined) and accounted for 47.7% of direct GWP (Table 6).
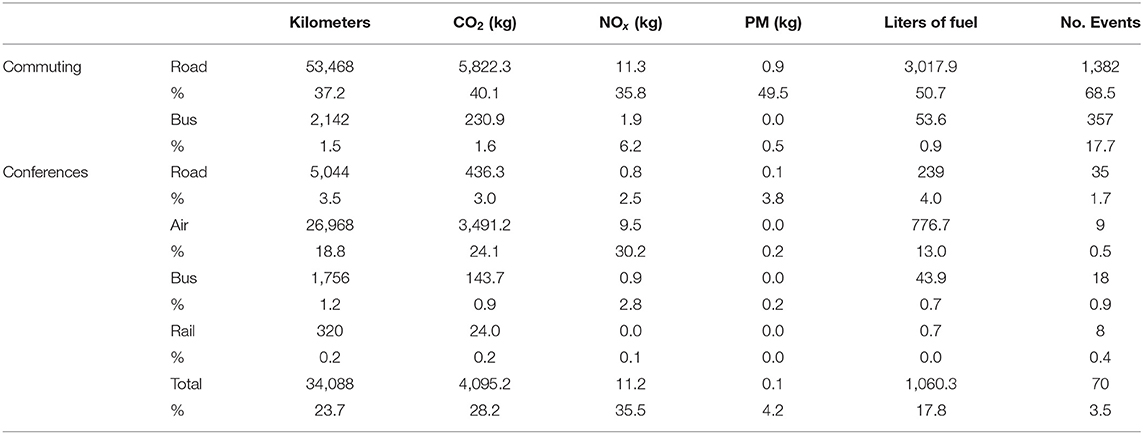
Table 6. The distance traveled, the approximate emissions, fuel use, and number of events associated with the commuting and conference categories considered.
PG 1 and PG 2 were responsible for 44% of commuting GWP. PMR and PD2 who also commuted to work using private vehicles accounted for 32 and 20% of GWP, respectively. The remaining 3.9% of GWP was contributed by PD2 (3%) and PI2 (0.9%). GWP for postgraduates and PD2 were due to increased commuting distance (18, 69, and 23 km, respectively) and the use of older, inefficient vehicles (120, 154, and 181 g CO2/km). PMR operated a newer, HEV and commuted a total of 20,640 km with direct GWP of 2,477 kg CO2 eq. The number of commuting events attributed to PMR are on average 2.6 times lower than the average number of events for project personnel (120 events as opposed to an average of 316), the main contributor to the footprint of this individual was not the frequency of commute but the distance (170 km round trip).
The total distance commuted by PI2 during the temporal boundaries of the project was 4,996 km with GWP 559.5 kg CO2 eq. For PI2 12.5% of commuting activities were allocated to the project as this was equivalent to the contractual time involved in the project. This allocation choice resulted in this individual contributing 624.5 km and GWP of 70 kg CO2 eq. PI1 commuted to work using a bicycle and was excluded (see section Discussion).
Fuel usage for commuting accounted for 68% of total petrol and 52% of total diesel usage during the project. Indirect GWP amounted to 1,609 kg CO2 eq. Petrol and diesel production for use in personal vehicles accounted for 61.3 and 36.9% respectively of indirect GWP, with public transportation (bus) only accounting for 1.5%. Within the context of indirect GWP, 53.5% was accounted for in commuting.
Commuting was the highest contributor to project impacts, followed by conference attendance and then fieldwork (Table 7). The impact of both these categories (discussed below) was approximately three times lower than that of commuting impacts.
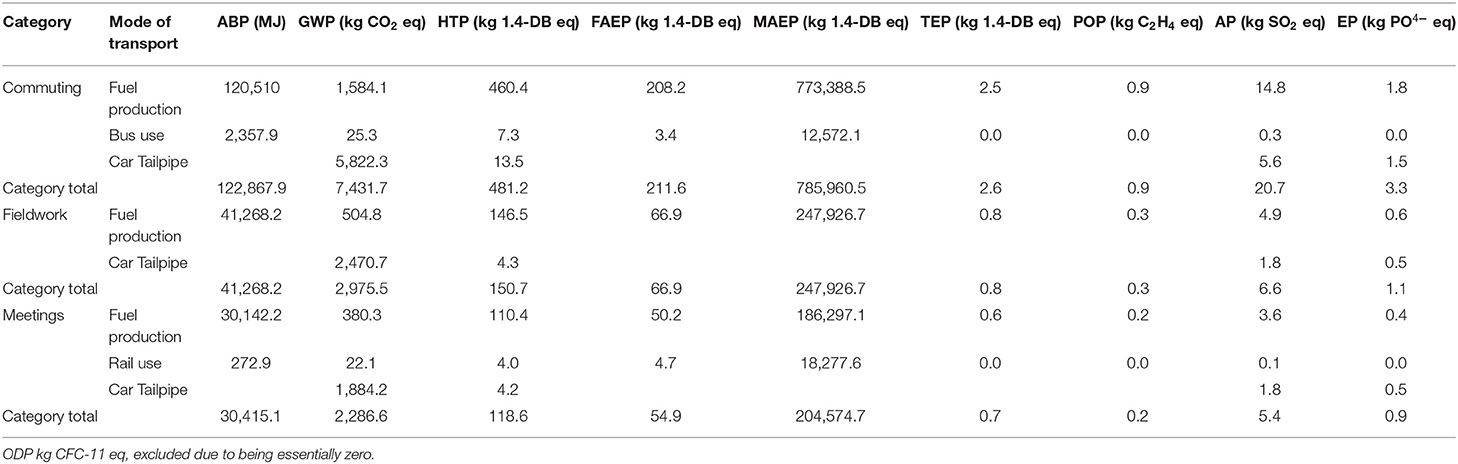
Table 7. The life cycle impact assessment of the various categories in the reference scenario.
Conferences, Fieldwork, and Meetings
Conferences, workshops, and training events was the second highest in terms of distance traveled (23.7%). Direct GWP for this category comprised 25.4% of the total project emissions. There were 70 events that required the use of a vehicle - 3.5% of the total travel events during the project. While only 9 events involved air travel (0.4% of total events), it accounted for 18.8% of total distance traveled by the project, 21.6% of direct GWP and 30.2% of NOx emissions. Conferences and training, accounted for a total of 4.7% of petrol usage, 6.4% of diesel, 100% of kerosene, and 54.7% of rail related kWh. The LCIA revealed that the greatest contributor to ABP was fuel production for personal vehicle use. This was also the case for GWP, MEP, and AP. The fieldwork aspect of this project accounted for 4.6% of events, 19.2% of kilometers traveled and 15.3% of direct GWP. The average distance traveled for the fieldwork events was 300 km. Fieldwork for the project accounted for 4.7% of petrol usage and 26.3% of diesel and was the third largest contributor to the impact of the project in terms of direct and indirect impacts and emissions. Meetings (internal, external and stakeholder) were responsible for 5.8% of events, 18.4% of kilometers traveled and 11.7% of direct GWP. Personal vehicles were the preferred means of transportation, with rail travel making up a 1.5% of the distance traveled and 0.1% of total travel events. Fuel usage in this category accounted for 13.2% of petrol, 15.6% of diesel, and 45.3% of rail kWh. This category had the lowest impact of all categories considered as part of the project. Meetings accounted for an average of 10% across the impact categories considered.
Constrained Boundaries - Commuting
Consideration was also paid to the exclusion of commuting from the analysis of the projects impacts (i.e., constraining the system boundaries). In this case, there would have been a direct reduction of 38.7% in the distance traveled, 41.7% reduction in direct GWP, 42% reduction in NOx emissions, 51.6% reduction in fuel burned and 86.2% reduction in travel events (Figure 4). Following on from this, the greatest contributor to the impact potential of the project would have been the category of conference and training, followed by fieldwork and meetings.

Figure 4. A comparison of the reference scenario with and without the commuting category included.
Scenario 1 – Use of Electric Vehicles
In this scenario, the LCI of the project remained the same with the only variable being the use of electricity to power EVs, fuel consumed and tailpipe emissions. The results of this scenario, indicate that there would be a decrease of 4,891 kg (30%) of direct GWP, 14 kg (45% reduction) of NOx, 1.97 kg (7,330% reduction) of PM, and 2,038 L (34% reduction) of fuel. The greatest reduction in fuel was for petrol (50% reduction). This was due to the allocation of BEVs or diesel HEV to drivers who operated petrol ICEVs in the reference results. The greatest difference to reference was in electricity use and the indirect emissions arising from electricity demand. There was an increase in electricity from 69.9 to 1,404.28 kWh, with an indirect GWP of 799.2 kg. Overall, there was a 16.5% decrease in LCIA results (Figure 5). The greatest reduction in impacts were in EP (30.3%), AP (29.9%), and ODP (29.1%) The greatest increases were in MAETP (8%) and FWAETP (5.9%).
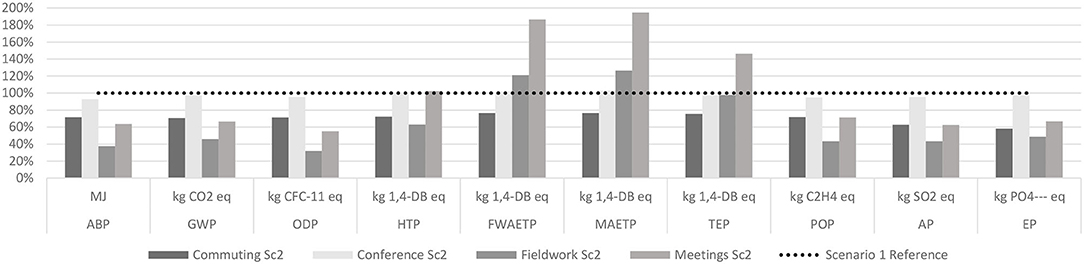
Figure 5. A comparison between the Scenario 1 – Reference and Scenario 2 (Sc2). In this figure the impacts of the reference are treated as 100% and a comparison between the impact categories and the transportation categories is made.
Commuting
When commuting impacts using EVs were compared against the reference, there was an average reduction of 21.6% across all impact categories. The highest decrease was observed in EP at 35.5%, followed by AP at 32.8%. The lowest level of reduction was seen in GWP at 11.5%. Fuel use was also down 28% from the reference scenario. The impact from bus use remained the same as the reference.
Conference
The distances and impacts for conferences and training remained the same in this scenario as the reference. In the reference scenario, air travel accounted for 24% of the project GWP. In this scenario, it increased to 31% due to the reduced emissions from road vehicles. In terms of private vehicles, usage there was a 20.7% reduction in direct GWP, a 64.7% reduction in road NOx emissions and a 100% reduction in PM (based on the use of manufacturers emissions figures). There was also a 35.2% reduction in total road fuel usage, with the greatest reduction seen in petrol at 61.4% and diesel at 54.1%. Electrical energy usage in this scenario increased by 138.3%. Indirect GWP as a result increased by 238.3% from 14.6 to 34.8 kg.
On average across all impact categories there was a reduction of 2.6%. The greatest reductions were observed in ABP (MJ) at 6.9%, PCOP at 4.9%, and ODP (4.5%). Impact categories which saw an increase were MAETP (2.7%) and FWAETP (1.9%).
Fieldwork
Fieldwork related tailpipe impacts decreased by an average of 70% across all impact categories. Decreases of 65.2% in direct GWP, 82.2% in NOx, a 100% decrease in PM, and a 63.4% reduction in fuel usage were observed. Electricity demand was estimated at 694.3 kWh, with an indirect GWP 395.1 kg CO2 eq. Despite this increase in indirect GWP - the LCIA demonstrated that overall GWP decreased by 54.3% (Figure 6). Results for the impact assessment indicated that the greatest reductions were in ODP (69.1%), ABP in MJ (63.5%), and AP (57.4%). The categories in which impacts increased were MAETP (25.4%) and FWAETP (20.2%). Despite these increases in ecotoxicity categories, there was an average decrease of 35.5% across all impact categories.
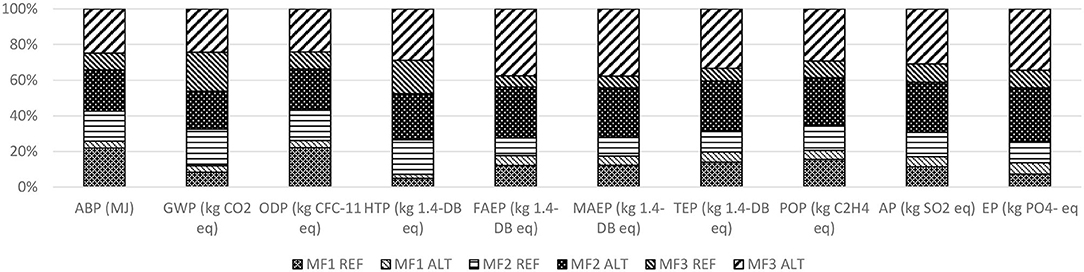
Figure 6. Contribution analysis of the 3 workshops reference scenarios and their alternatives. MOREFISH workshop 1 is designated as MF1, MOREFISH workshop 2 as MF2 etc.
Meetings
For meetings there was a 47.5% reduction in direct GWP an 80.6% reduction in NOx, and a 99.9% reduction in PM. Total fuel use decreased 51.5%, with a 76.6 and 28.8% decrease in petrol and diesel, respectively. Areas which saw an increase were electricity usage (kWh) which increased by 1,772% and the indirect GWP which increased by 56,033%. While this is a dramatic increase it must be stated that electricity consumption increased from 31.7 to 561.3 kWh and indirect GWP increased from 0.6 to 319.5 kg, respectively.
The LCIA results indicated that on average there would be an increase of 0.4% across impacts categories for meetings with a median decrease of 28.5%. The greatest reductions were seen in ODP (44.6%), ABP in MJ (36.2%), and GWP (33.7%). Of the impact categories considered four increased when compared with the reference scenario. These were MAETP (94.8%), FWAETP (86.5%), TETP (46.2%), and HTP (2.4%). These increases were due to the higher use of electric energy in this scenario. For example, MAETP increased from 205,503 kg 1, 4 DB eq. to 400,258 kg 1, 4 DB eq. Similar increases were seen in all the toxicity impacts categories which brought the average of this scenario to 0.4% greater than the reference. Excluding toxicity from the LCIA, the average reduction across all impact categories was 32%.
Scenario 3 – Flexible Working
The results of this scenario indicate that when compared with commuting in the reference scenario there was on average a 12.9% reduction in impacts across all categories. The greatest decrease was observed in EP at 15%. This was followed by AP (14%) and GWP (13.1%). The lowest decreases were observed in POP (12.3%), MAETP (12.3%), and HTP (12.4%). In terms of the impact on the overall project, by having personnel work 1 day a week from home there was an average decrease of 5% across all impact categories. The greatest of which was observed in GWP of 6.4%, EP (5.8%) and AP (5.8%). The lowest reductions were seen in HTP (1.6%), MAETP (4.5%), and FWAETP (4.8%).
Scenario 3 – Stakeholder Intervention
The first stakeholder workshop of the project had 4 industry attendees. The attendees traveled approximately 1,524 km, had a GWP of 207.3 kg CO2 eq and emitted 0.003 kg of PM. Fuel use totalled 77.7 L of diesel, with travel time estimated as 9.12 h3 In the alternative scenario considered there was an increase in the distance traveled of 298 km and an increase in the travel duration by 8.8 h, which resulted in extra emissions of 1.5 kg NOx, 0.07 kg of PM. GWP decreased by 121.3 kg, with 27.2 L less diesel being used. The LCIA revealed that including fuel production, there was on average a 48.6% decrease across all impact categories. The greatest reductions were observed in ABP (81.9%), POP (68.2%), and TETP (58.8%).
The second stakeholder workshop had 21 attendees who traveled a total of 8,414 km (increase due to overseas speakers). Air travel accounted for 33% of distance traveled and 34.4% of GWP. On average air travel increased GWP, time traveled, distance traveled and fuel use by 27.5%. The greatest increase in tailpipe emissions due to air travel was in NOx, which accounted for 61% of total NOx emissions. The alternative scenario saw an increase in distance traveled by 1,323.2 km, an increase in NOx emissions (4.9 kg) and time traveled (37.7 h). There were reductions in GWP (544.8 kg), PM (0.9 kg), and fuel use (46.9 L). The LCIA of this event revealed that there was on average an increase of 139% across all impact categories for this scenario. The greatest increases were in ABP (kg Sb eq) of 578% (the amounts in both cases were less than 1 g), FWAETP of 183.9% and MAETP of 167.2%. The lowest increases were observed in GWP (4.6%), HTP (33.3%), and ODP (34.5%). These increases were due to the greater distances that would have been required to be traveled, by bus and rail. The third stakeholder workshops had 26 attendees. Individuals traveled 9,600 km, commuted for 47.55 h, had a GWP of 1,232.2 kg CO2 eq, 2.2 kg of NOx, 1.6 kg of PM, and used 397.7 L of fuel. Analogous to the second stakeholder workshop, air travel accounted for an average of 27% of GWP, fuel and time spent traveling. The alternative scenario for this workshop had greater distances involved and traveling time, 1,575.5 km and 59.18 h, respectively. There was a 31.6% decrease in GWP, and a decrease of 1.2 kg in NOx emissions. Fuel requirements also decreased by 26.4%, a saving of 105 L. Air travel accounted for 45.6% of GWP in the alternative scenario, where in the reference it represented 31.2%. The LCIA for this scenario indicated that use of public transport was not the most environmentally conscious choice. The average increase across impact categories was 404%. With the greatest increases seen in FWAETP by 499.5% and MAETP by 474.5%. The lowest increases were observed in GWP (11%), HTP (53.6%), and ODP (153.6%). These increases in impact were due to the rise in fuel use due to the additional distances traveled via rail and bus routes.
When compared directly, the tailpipe emissions and fuel use indicated that the alternative scenarios perform better. However, the distances traveled, and the time required to travel both increased (Table 8).
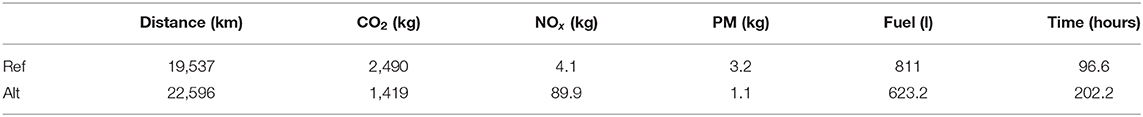
Table 8. The cumulative tailpipe (direct) figures of the reference and alternative scenarios for the workshops.
When viewed from a life cycle perspective the alternative scenarios performed consistently poorer than the reference scenario (Figure 6). The greatest increases in impacts were observed in FWAETP by 152% and MAETP by 141.7%. The only impact category which was lower was GWP, which decreased by 2.5%, a saving of 74 kg. Thus, the focus on tailpipe emissions and fuel presents only a glimpse of the results.
Discussion
The results of this case study using two different methodological approaches (tailpipe emissions and life cycle oriented data) highlight the simplicity with which researchers and practitioners can account for the sustainability and environmental burden of their work and projects. The decision to use mixed datasets to estimate the impact was 2-fold. The first reason behind this was that many projects and researchers do not have the training or access to LCA software or databases. All researchers when armed with either the registration number (license plate) or make and model of a vehicle should be able to find the manufacturers figures on emissions per unit of distance. Using these figures for each respective vehicle, researchers, or practitioners can then use freely available LCIA methods such as CML or ReCiPe to approximate the impact of their activities.
However, even with such a simple approach proposed in this case study there remain several methodological choices, which have limitations, and implications on how O-LCA can be included within research project management practices.
Commuting
There remain valid questions on whether commuting falls within the scope of O-LCA of a research project, as it is in an area where the lines of private and professional activities are blurred. The rationale for including commuting impacts within this case study was based on the following principles: (i) that the actions of the individuals employed or associated with the project only occurred due to their involvement with the project. It can be counter argued that these individuals would have had an environmental burden allocated elsewhere even if they were elsewhere employed and not associated with the project, which could very well be the case, but the actual events which contributed to the impact of the project occurred because of their involvement. (ii) Commuting would be a major contributor to the overall burden associated with each individual's footprint within the project. By allowing personnel to observe the impact reduction opportunities available to them, they could in turn make a more informed choice as to how they can incorporate life cycle thinking into their daily working and personal lives.
It can be also argued that commuting activities are beyond the boundaries O-LCA and that the inclusion of commuting constitutes an intrusion into personal information and is far beyond the scope of project management. However, in order to achieve the aims of the project personnel must be present at work, and how they arrived plays a role in the overall impact of a research project, as has been demonstrated in the above sections. Beyond the general remit of project management, the point remains that as researchers and participants in a project looking at promoting and developing sustainable practices, personnel on such a project should inform themselves as to what their impact is and potentially select more efficient means of transport for work. Heinen et al. (2010) from a review of bicycle use for commuting, states that it is feasible for adults to commute 6–11.6 km with ease. More recent literature (Hansen and Nielsen, 2014; Larsen, 2018) states that for most commuters anything over 5 km is a long-distance bicycle commute. For example, during the project PI1 commuted 4,327 km, by bicycle, of which 10% (432.7 km) could allocated to the project. Biogenic carbon emissions from respiration were not included in this study and thus the burden associated with this individual's commute was zero across the categories of CO2, NOx, and PM. However, Walsh et al. (2008) puts forward CO2 emissions for bicycle use at 5 g/km. Using this figure, PI1 would have contributed 2.2 kg of CO2 to the project (0.03% of commuting GWP or 0.01% of the total GWP of the project). These figures demonstrate the reduced environmental burden associated with bicycle use as part of a commute. For example, if PI1 had used their private vehicle to commute the 432.7 km allocated they would have emitted 60.1 kg of CO2 eq. By using a bicycle, PI1 reduced their commuting emissions by a factor of 27.3.
The results of the analysis indicate that project personnel, who could in future change to an active commute, are PI2 (8 km) and PD1 (6 km). The impact reduction opportunities for these personnel through a shift from passive to active transportation would be a decrease in reference GWP 230.9 to 1.2 kg CO2 eq and 69.4 kg to 0.4 kg CO2 eq, a reduction of 99.5% of commuting GWP, respectively. With potential GWP reductions, such as these, a change in the mode of transportation used for commuting is something that each researcher must consider within their organization.
Flexible Working
By affording personnel the option to work from their place of residence, the need to commute is reduced.
As can be expected, the contribution to commuting impact was greater amongst the personnel who did the most driving and those who had older less efficient vehicles. This study also indicated that there was a hierarchy of impacts from the bottom up. The PIs had a reduced impact in comparison to all other project personnel.
In future, it may be more pertinent to include other metrics to determine impacts outside vehicle use. The monitoring of electronic devices, particularly, computers may better capture the impacts PIs contribute to projects. This same approach could also be included to monitor any laboratory analysis equipment (spectrophotometers and microscopes), storage equipment (fridges and freezers) and work PCs.
Allocation of contracted time to the commuting distance in the case of the project PIs was taken when concerning fuel. For this, fuel consumption and production impacts of said fuel were assigned to the driver. This was chosen as a suitable means of allocation as the driver operated the vehicle and was responsible for the vehicle, its occupants, vehicle maintenance, the fueling of the vehicle and driving in an efficient manner. The allocation of divided fuel production impacts would have artificially inflated the impacts for these personnel.
Global Events
The COVID-19 pandemic has led to dramatic changes in working and traveling patterns for significant portions of the global population. Government policies and the choices, which organizations enacted almost overnight, have made the once distant idea of remote working a daily reality. While the social and economic disruptions which have occurred due to this paradigm shift have had negative impacts on social structures and many countries' economies (Rossi et al., 2020) there has been an discernible reduction in travel and commuting emissions and impacts (Evans, 2020; Le Quéré et al., 2020). The reduction of global daily CO2 emissions by April 2020 were 17% lower than 2019 levels (Le Quéré et al., 2020). The reduction in emissions for the first half of 2020 is estimated as being 8.8% lower than the same period in 2019, and indeed represents the greatest annual decrease in CO2 emissions since 1900 (Liu et al., 2020). With rolling lockdowns and forced restrictions in movement to continue for the foreseeable future, it is likely that further decreases will be seen for the duration of these measures. The environmental relief which the pandemic has introduced has also highlighted that, in the instance of Ireland, the majority of workers would like to continue working remotely (with a mix of onsite work) once the pandemic has been curtailed, according to a recent survey (McCarthy et al., 2020a). A subsequent survey by the same authors saw the preference of respondents in working remotely, at least some of the time, increase from 83 to 94% (McCarthy et al., 2020a,b). This shift to a blend of onsite and remote working, as exemplified by the flexible working arrangement scenario in this study, highlights the environmental benefits of this practice and highlights the role that organizations play in travel or commuting patterns.
The counterpoint to the benefits offered with blended working practices are that there may be an increase in the use of private vehicles where remote working is not possible. With many countries limiting or reducing public transport capacity in-line with public health policy (Transport for Ireland, 2020a,b), an unintended consequence of this is that there may also be an increase in single occupant vehicle use either through choice or organizational guidelines (CCC, 2020; CIF, 2020; OECD, 2020). While this increase in private vehicle use may not have a significant impact at a regional or global scale, it may contribute to the impact associated with the associated project or organization.
Limitations, Strengths, and Opportunities
Vehicles
The use of manufacturers' figures and emissions factors is a double-edged sword. On the one hand, it provides vehicle specific figures which make impacts more discernible to individuals and supports the secondary goals of this study (ease of use for project management with readily available figures). Several questions must be asked of the manufacturers figures; (i) do these figures accurately represent real world use? (ii) Do these figures remain constant with increasing vehicle age? (iii) Do these figures account for the operation of a vehicle in heavy traffic with multiple and repeated starts and stops? And (iv) do these figures provide information on the effect that number of occupants has on emissions and fuel consumption? It must also be noted that after scandals in recent years concerning “cheat devices” used in feigning compliance with emission standards by automotive manufacturers that there are very real concerns over the veracity of the figures available (Brand, 2016; Zachariadis, 2016). This study was by no means focused on establishing the minutia of the projects impacts but instead focuses on the broad, higher scale information, which can be gleaned from such an approach. The manufacturers' figures on fuel consumption were used to determine fuel usage during the project and the indirect impacts of the project. From discussions with personnel, no individual had been able to achieve the manufacturers' figures on fuel use. Because of this, the indirect impact of the project is likely higher than indicated. The formation of an independent database on real-world vehicle emissions and fuel consumption would be a very welcome and indispensable resource for studies of this kind.
Energy
Information for energy or electricity usage was sourced from questionnaires, databases and the literature. While this a concern, it is also one of the strengths of this approach, in that it uses information that is available to all project management personnel and can be used to determine an approximate CO2, NOx, PM, and fuel footprints for a project even without access to expensive LCA software and databases.
There were differences between the ecoinvent dataset for emissions and the EirGrid figures (Irish national electric power transmission authority). This is most likely due to the increased use of renewable energies in the fuel mix of the Irish national grid in more recent times. Thus, the ecoinvent GWP for 1 kWh of electricity was 576 g of CO2 eq, whereas according to the Commission for Regulation of Utilities (Utilities C. f. R. o., 2018) the GWP for 2016 was 366 g CO2 eq/kWh. Applying this factor to electric car energy use reduces the GWP from 846.8 kg CO2 eq to 513.9 kg CO2 eq, a 39.3% reduction. However, the benefits of using the ecoinvent dataset are that it allows for a complete suite of information in the use of an LCIA and the use of other impact categories than GWP.
Scope
Following on from the above, the data available determined the scope of the study. For instance, for the EV scenario the allocation of the closest equivalent alternative vehicle was based on the vehicle, vehicle class and value. Changes in public transportation were not considered in this scenario i.e., a shift in public transport and air travel associated impacts, due to increased use of electric motors or other advances in fuels. Where these changes would have been significant, were in developments in air travel. While air travel accounted for 0.5% of events, it accounted for an average of 32.5% of direct emissions and was responsible for an average of 31% of impacts across all impact categories. Innovations in air travel and or aviation fuel would see a marked decrease in this scenario.
The shift to EVs from traditional ICEVs, offers very real impact reduction opportunities by using currently available models. In terms of an organization, this would indicate that organizations which wish to improve their sustainability could propose that EVs can be hired or rented from a project budget in lieu of using private cars. Alternatively, organizations can mandate that for suitable trips in-house EVs must be booked and used wherever possible. Utility vehicles (vans, 4x4's, SUVs) in this project accounted for 6,892 km, 3,055.7 kg CO2 eq and 476.9 L of fuel. By switching to the closest alternative commercial vehicles, the average reduction for tailpipe emissions was 85%.
Stakeholder Events
With regards to events organization and stakeholder engagement, the results were intriguing. In the context of this project, the alternative scenarios considered, represented the nature of the aquaculture industry in Ireland. The dramatic increase in travel distance and time further demonstrates that aquaculture activities occur in isolated, rural areas not readily serviced by public transportation. A way of reducing the impact of this scenario may be to arrange regional meetings, reducing the need for stakeholders to commute large distances or to increase the use of tele-conferencing, as was required during the COVID-19 pandemic. However, teleconferences may not provide the same degree of interaction that can make these events successful (as evidenced through the growth of attendees at the events in this case study). A further limitation on the uptake of teleconferences can be a lack of reliable and high-speed internet connectivity. The low availability of high-speed internet has long been an issue for regions in the West and Northwest of Ireland (where most aquaculture activities occur), and without this being addressed it is unlikely that tele-conferencing can replace face-to-face events.
Recommendations and Future Research
Most research projects are funded through public funding. As such, there is a social responsibility for researchers and projects working on and researching the areas of sustainability and efficiency to conduct their work using the most environmentally sustainable and efficient means available. The introspective approach outlined in this study allows an initial post-hoc approach to incorporate the concept of life cycle thinking in the management practices of a research project using simple and readily available information.
The natural evolution of this concept is into a form that would actively encourage the implementation of this approach as a requirement from funding bodies, for applicants to submit an estimated impact footprint. This would form the basis of an application or as part of the reporting structure to funders. The use of this in such applications would allow principal investigators and research groups to put forward a strong case for capital purchases instead of large travel and subsistence budgets. Remote monitoring technologies being a key example of a capital purchase which would reduce the need for regular site visits, associated impacts and time lost in traveling.
The extent to which a research project can implement significant changes in its operation may be somewhat limited, as they are generally a smaller collective in a larger organization. Research groups will generally not be in a position to purchase vehicles or other means of transportation from within specific research budgets but can approach funding organizations and their own institutes with recommendations to phase the organizations vehicle fleet with the most environmentally conscious option when upgrading to purchasing new vehicles. Particularly for ICE utility vehicles such as vans and 4x4s as there are currently alternate EVs models available. Furthermore, O-LCA should be implemented at third level institutions along the lines of Lo-Iacono-Ferreira et al. (2016). These institutions house and promote the research of sustainability and its application to the wider world and must move toward practicing what they preach.
The use of O-LCA as a means of quantifying the impacts of research programmes and research events has been outlined and demonstrated in the preceding pages of this article. Within broader research and academic circles, a simple and responsible use of O-LCA would be to include it within the planning of conferences. By asking delegates or attendees to provide, information on their travel arrangements as part of a registration process it would be possible to build up a profile of the events impacts, and to set reduction targets for future events.
It is likely that many workers may continue to work remotely after the COVID-19 pandemic which may lead to a paradigm shift in workers travel and commuting patterns. Striking a balance between public health, socio-economics and environmental burden is something which organizations and governments should consider post COVID-19.
Conclusions
The present study provided a case of the application of O-LCA as a project assessment tool. The introspective nature of this work and its concepts are something that researchers should include in their decision criteria. Particularly those researchers directly involved in the assessment of sustainability and resource efficiency. The presented framework, illustrated how researchers could estimate their environmental burden using accessible datasets (manufacturers data) to generate the impact associated with tailpipe emissions. Access to life cycle databases such as ecoinvent increased the scope of this to include the extraction of resources and their refinement. The use of open access impact assessment methodologies such as CML also means that researchers can avail of these and fulfill their social responsibility of accounting for their burden. As groups and consortiums funded by public funding there is a requirement to return not only high quality research but also efficiency in our activities.
The analysis of the MOREFISH project identified several areas in which the project could have operated with less of an environmental burden than it did. The aspects identified have led to the increased use of public transportation to meetings and conferences, a reduction in the number of face-to-face meetings, the uptake of remote monitoring technologies to reduce fieldwork related impacts and the enshrinement of an environmentally efficient approach to project management.
The incorporation of life cycle thinking into project management at an earlier stage may have instigated much more robust and apt interventions if it had been implemented into the funding application. This post-hoc approach, while informative will have missed out on some of the finer nuances of the project, having it run within normal project management procedures, the impact reduction opportunities may have been greater.
The use of O-LCA is a tool which academic researchers and research groups should utilize in their projects to allow for continuing improvements in environmental performance and resource efficiency.
Data Availability Statement
The raw data supporting the conclusions of this article will be made available by the authors, without undue reservation.
Author Contributions
RC: conceptualization, methodology, and writing—original draft. AT: validation, investigation, and writing—review & editing. AK: validation, project administration, and writing—review & editing. EC: funding acquisition, supervision, and writing—review & editing. All authors contributed to the article and approved the submitted version.
Funding
This work was supported by the MOREFISH (14SF872) and EcoAqua (17/KGS/004) projects.
Conflict of Interest
The authors declare that the research was conducted in the absence of any commercial or financial relationships that could be construed as a potential conflict of interest.
Acknowledgments
The authors wish to acknowledge the participation and contribution of travel data from the wider MOREFISH team – Prof. Neil Rowan, Dr. Richard FitzGerald, and Dr. Sarah Naughton.
Abbreviations
ABP, abiotic depletion potential; AP, acidification potential; BEV, battery electric vehicle; CO2, carbon dioxide; COVID-19, Coronavirus disease 2019; EP, eutrophication potential; EV, electric vehicle; FWAETP, freshwater aquatic ecotoxicity potential; GWP, global warming potential; HEV, hybrid electric vehicle; HTP, human toxicity potential; ICEV, internal combustion engine vehicle; LCA, life cycle assessment; LCI, life cycle inventory; LCIA, life cycle impact assessment; MAETP, marine aquatic ecotoxicity potential; MJ, megajoules; NOx, nitrous oxides; ODP, ozone depletion potential; O-LCA, Organizational life cycle assessment; PD, post doctoral researcher; PG, post graduate researchers; PHEV, plug in hybrid electric vehicle; PI, principal investigator; PM, particulate matter; POP, photochemical oxidation potential; PTR, public transportation route; RF, research fellow; SBR, shuttle bus return; SETAC, Society of Environmental Toxicology and Chemistry; SUV, sports utility vehicle; TETP, terrestrial ecotoxicity potential; UNEP, United Nations Environment Program.
Footnotes
1. ^The values were taken from model specific manufacturers figures.
2. ^Sustainable Energy Authority of Ireland - Electric Vehicle Comparison Calculator. https://www.seai.ie/sustainable-solutions/electric-vehicles/grant-eligible-cars/ (accessed July 23, 2018)
3. ^Travel time was estimated using Google maps (https://www.google.com/maps/). Journey times were estimated based on the time of public transportation departure.
References
Alexander, J. K. (2008). The Mantra of Efficiency From Waterwheel to Social Control. Baltimore, MD: The Johns Hopkins University Press.
Brand, C. (2016). Beyond ‘Dieselgate’: implications of unaccounted and future air pollutant emissions and energy use for cars in the United Kingdom. Energy Policy 97, 1–12. doi: 10.1016/j.enpol.2016.06.036
de Camargo, A. M., Forin, S., Macedo, K., Finkbeiner, M., and Martínez-Blanco, J. (2018). The implementation of organizational LCA to internally manage the environmental impacts of a broad product portfolio: an example for a cosmetics, fragrances, and toiletry provider. Int. J. Life Cycle Assess. 24, 104–116. doi: 10.1007/s11367-018-1502-4
Egbue, O., and Long, S. (2012). Barriers to widespread adoption of electric vehicles: an analysis of consumer attitudes and perceptions. Energy Policy 48, 717–729. doi: 10.1016/j.enpol.2012.06.009
Evans, S. (2020). Coronavirus Set to Cause Largest Ever Annual Fall in CO2 Emissions. Available online at: www.carbonbrief.org.
Forin, S., Martínez-Blanco, J., and Finkbeiner, M. (2018). Facts and figures from road testing the guidance on organizational life cycle assessment. Int. J. Life Cycle Assess. 24, 866–880. doi: 10.1007/s11367-018-1533-x
Grealis, E., Hynes, S., O'Donoghue, C., Vega, A., Van Osch, S., and Twomey, C. (2017). The economic impact of aquaculture expansion: an input-output approach. Mar. Policy 81, 29–36. doi: 10.1016/j.marpol.2017.03.014
Guinée, J. B. (2002). Handbook on Life Cycle Assessment: Operational Guide to the ISO Standards. Dordrecht; Boston, MA: Kluwer Academic Publishers.
Hansen, K. B., and Nielsen, T. A. S. (2014). Exploring characteristics and motives of long distance commuter cyclists. Transp. Policy 35, 57–63. doi: 10.1016/j.tranpol.2014.05.001
Heinen, E., Van Wee, B., and Maat, K. (2010). Commuting by bicycle: an overview of the literature. Transp. Rev. 30, 59–96. doi: 10.1080/01441640903187001
Hidrue, M. K., Parsons, G. R., Kempton, W., and Gardner, M. P. (2011). Willingness to pay for electric vehicles and their attributes. Resour. Energy Econ. 33, 686–705. doi: 10.1016/j.reseneeco.2011.02.002
IEA (2018). Global EV Outlook 2018, International Energy Agency. Available online at: https://webstore.iea.org/global-ev-outlook-2018
Jungbluth, N., Keller, R., and König, A. (2016). ONE TWO WE—life cycle management in canteens together with suppliers, customers and guests. Int. J. Life Cycle Assess. 21, 646–653. doi: 10.1007/s11367-015-0982-8
Kelliher, C., and Anderson, D. (2009). Doing more with less? Flexible working practices and the intensification of work. Hum. Relat. 63, 83–106. doi: 10.1177/0018726709349199
Larsen, J. (2018). Commuting, exercise and sport: an ethnography of long-distance bike commuting. Soc. Cult. Geogr. 19, 39–58. doi: 10.1080/14649365.2016.1249399
Le Quéré, C., Jackson, R. B., Jones, M. W., Smith, A. J. P., Abernethy, S., Andrew, R. M., et al. (2020). Temporary reduction in daily global CO2 emissions during the COVID-19 forced confinement. Nat. Clim. Change 10, 647–653. doi: 10.1038/s41558-020-0797-x
Liu, Z., Ciais, P., Deng, Z., Lei, R., Davis, S. J., Feng, S., et al. (2020). Near-real-time monitoring of global CO2 emissions reveals the effects of the COVID-19 pandemic. Nat. Commun. 11:5172. doi: 10.1038/s41467-020-20254-5
Lo-Iacono-Ferreira, V. G., Torregrosa-López, J. I., and Capuz-Rizo, S. F. (2016). Use of life cycle assessment methodology in the analysis of ecological footprint assessment results to evaluate the environmental performance of universities. J. Clean. Prod. 133, 43–53. doi: 10.1016/j.jclepro.2016.05.046
Martínez-Blanco, J., Inaba, A., and Finkbeiner, M. (2015a). Scoping organizational LCA—challenges and solutions. Int. J. Life Cycle Assess. 20, 829–841. doi: 10.1007/s11367-015-0883-x
Martínez-Blanco, J., Inaba, A., and Finkbeiner, M. (2016). “Life cycle assessment of organizations,” in Special Types of Life Cycle Assessment. LCA Compendium – The Complete World of Life Cycle Assessment, ed M. Finkbeiner (Dordrecht: Springer). doi: 10.1007/978-94-017-7610-3_8
Martínez-Blanco, J., Inaba, A., Quiros, A., Valdivia, S., Milà-i-Canals, L., and Finkbeiner, M. (2015b). Organizational LCA: the new member of the LCA family—introducing the UNEP/SETAC Life Cycle Initiative guidance document. Int. J. Life Cycle Assess. 20, 1045–1047. doi: 10.1007/s11367-015-0912-9
McCarthy, A., Ahearne, A., Bohle Carbonell, K., Síocháin, T. Ó., and Frost, D. (2020a). Remote Working During COVID-19: Ireland's National Survey Initial Report. Galway: NUI Galway Whitaker Institute and Western Development Commission.
McCarthy, A., Bohle Carbonell, K., Síocháin, T. Ó., and Frost, D. (2020b). Remote Working during COVID-19: Ireland's National Survey - Phase II Report. Galway: NUI Galway Whitaker Institute and Western Development Commission.
Neppach, S., Nunes, K. R. A., and Schebek, L. (2017). Organizational Environmental Footprint in German construction companies. J. Clean. Prod. 142, 78–86. doi: 10.1016/j.jclepro.2016.05.065
NI Transport (2018). Available online at: https://www.infrastructure-ni.gov.uk/system/files/publications/infrastructure/TSNI-headline-report-2015-2017.pdf (accessed July 2, 2018)
OECD (2020). Environmental Health and Strengthening Resilience to Pandemics, Tackling Coronavirus (COVID-19). Organisation for Economic Co-Operation and Development, 13. Available online at: www.oecd.org.
Plötz, P., Schneider, U., Globisch, J., and Dütschke, E. (2014). Who will buy electric vehicles? Identifying early adopters in Germany. Transp. Res. Part A Policy Pract. 67, 96–109. doi: 10.1016/j.tra.2014.06.006
Pretty, J. N., Noble, A. D., Bossio, D., Dixon, J., Hine, R. E., Penning de Vries, F. W. T., et al. (2006). Resource-conserving agriculture increases yields in developing countries. Environ. Sci. Technol. 40, 1114–1119. doi: 10.1021/es051670d
Resta, B., Gaiardelli, P., Pinto, R., and Dotti, S. (2016). Enhancing environmental management in the textile sector: an Organisational-Life Cycle Assessment approach. J. Clean. Prod. 135, 620–632. doi: 10.1016/j.jclepro.2016.06.135
ROI Transport (2018). Available online at: https://www.cso.ie/en/releasesandpublications/ep/p-cp6ci/p6cii/p6td/ (accessed July 23, 2018)
Rossi, R., Socci, V., Talevi, D., Mensi, S., Niolu, C., Pacitti, F., et al. (2020). COVID-19 pandemic and lockdown measures impact on mental health among the general population in Italy. Front. Psychiatry 11:790. doi: 10.3389/fpsyt.2020.00790
UNEP (2015). Guidance on Organisational Life Cycle Assessment. Life Cycle Imitative, United Nations Environment Programme and Society for Environmental Toxicology and Chemistry. Paris: UNEP, 152. Available online at: http://www.lifecycleinitiative.org/wp-content/uploads/2015/04/o-lca_24.4.15-web.pdf
UNEP/SETAC (2012). Greening the Economy Through Life Cycle Thinking. Available online at: https://www.lifecycleinitiative.org/wp-content/uploads/2013/03/2012_LCI_10_years_28.3.13.pdf (accessed January 11, 2018)
Utilities C. f. R. o. (2018). Green Source Product Verification Report 2016. Available online at: https://www.cru.ie/wp-content/uploads/2018/04/CRU18080-Green-Source-Product-Verification-Report-2016.pdf
Walsh, C., Jakeman, P., Moles, R., and O'regan, B. (2008). A comparison of carbon dioxide emissions associated with motorised transport modes and cycling in Ireland. Transp. Res. Part D 13, 392–399. doi: 10.1016/j.trd.2008.07.002
Wernet, G., Bauer, C., Steubing, B., Reinhard, J., Moreno-Ruiz, E., and Weidema, B. (2016). The ecoinvent database version 3 (part I): overview and methodology. Int. J. Life Cycle Assess. 21, 1218–1230. doi: 10.1007/s11367-016-1087-8
Zachariadis, T. (2016). After ‘dieselgate’: regulations or economic incentives for a successful environmental policy?. Atmos. Environ. 138, 1–3. doi: 10.1016/j.atmosenv.2016.04.045
Keywords: project management, organizational life cycle assessment, sustainability, social responsibility, decision-making, stakeholders, research management, guidance
Citation: Cooney R, Tahar A, Kennedy A and Clifford E (2021) Accounting for Research Induced Environmental Impacts Using Life Cycle Assessment. Front. Sustain. 2:631685. doi: 10.3389/frsus.2021.631685
Received: 20 November 2020; Accepted: 22 February 2021;
Published: 18 March 2021.
Edited by:
Klodian Zaimi, Institute of GeoSciences, Energy, Water and Environment, AlbaniaReviewed by:
Shady Attia, University of Liège, BelgiumRuojue Lin, Hong Kong Polytechnic University, Hong Kong
Copyright © 2021 Cooney, Tahar, Kennedy and Clifford. This is an open-access article distributed under the terms of the Creative Commons Attribution License (CC BY). The use, distribution or reproduction in other forums is permitted, provided the original author(s) and the copyright owner(s) are credited and that the original publication in this journal is cited, in accordance with accepted academic practice. No use, distribution or reproduction is permitted which does not comply with these terms.
*Correspondence: Ronan Cooney, rcooney@nuigalway.ie