 Ayumi Hashimoto
 Hiroyuki Kawaguchi2
- 1Graduate School of Medicine, University of Tokyo, Tokyo, Japan
- 2Economics Faculty, Seijo University, Tokyo, Japan
- 3Department of Health and Social Behavior, School of Public Health, University of Tokyo, Tokyo, Japan
To achieve the Sustainable Development Goals, strengthening investments in health service inputs has been widely emphasized, but less attention has been paid to tackling variation in the technical efficiency of services. In this study, we estimated the technical efficiency of local public health programs for the prevention of unintentional childhood injury and explored its contribution to national trend changes and regional health disparities in Japan. Efficiency scores were estimated based on the Cobb–Douglas and translog production functions using a true fixed effects model in a stochastic frontier analysis to account for unobserved time-invariant heterogeneity across prefectures. Using public data sources, we compiled panel data from 2001 to 2017 for all 47 prefectures in Japan. We treated disability-adjusted life years (DALYs) as the output, coverage rates of public health programs as inputs, and caregivers' capacity and environmental factors as constraints. To investigate the contribution of efficiency to trend changes and disparities in output, we calculated the predicted DALYs with several measures of inefficiency scores (2001 average, yearly average, and prefecture-year-specific estimates). In the translog model, mean efficiency increased from 0.62 in 2001 to 0.85 in 2017. The efficiency gaps among prefectures narrowed until 2007 and then remained constant until 2017. Holding inefficiency score constant, inputs and constraints contributed to improvements in average DALYs and widened regional gaps. Improved efficiency over the years further contributed to improvements in average DALYs. Efficiency improvement in low-output regions and stagnated improvement in high-output regions offset the trend of widening regional health disparities. Similar results were obtained with the Cobb–Douglas model. Our results demonstrated that assessing the inputs, constraints, output, and technical efficiency of public health programs could provide policy leverage relevant to region-specific conditions and performance to achieve health promotion and equity.
Introduction
The child health burden has dramatically reduced in the last three decades. Total disability-adjusted life years (DALYs) for those aged under 20 years decreased by 46% from 1990 to 2017, dropping from 1.31 billion to 709 million. This decline was led by drastic improvements in communicable, maternal, neonatal, and nutritional diseases in low- and middle- income countries (LMICs) (1, 2). Further improvement can be expected as universal health coverage increases and economic growth proceeds. However, in LMICs, injuries have grown in relative importance for total DALYs from 1990 to 2017, climbing from 5.7 to 6.5% in low-income countries and from 12.6 to 14.0% in middle-income countries, in contrast to a drop from 19.9 to 13.5% in high-income countries. Nonetheless, unintentional injury has been a leading cause of health burden among children in high-income countries (3–5), suggesting that socioeconomic development does not necessary solve these problems. Public health interventions targeting parenting quality are essential to prevent unintentional injuries, especially for preschool children, an effort that is likely to be resource consuming. To achieve the Sustainable Development Goals (SDGs), in addition to strengthening investments in health service inputs, the question of how to prepare high-quality public health programs in an efficient manner will be key (6).
Parental health education is known to be an effective vehicle for preventing unintentional childhood injury; health education enhances parental supervision and environmental preparedness at home in terms of using safety equipment and removing home hazards (7–11). Mental health support for mothers with depression or high levels of stress also has the potential to reduce unintentional childhood injuries resulting from poor parenting quality (9, 12, 13). Moreover, community-based interventions for safety such as public campaigns and infrastructure management have been caried out (14, 15).
There are several potential providers of these interventions, including health care institutions, schools, and private organizations (9–11, 14–16). Unlike most Organization for Economic Co-operation and Development (OECD) countries, where primary care practitioners are responsible for delivering public health services, Japan relies on a public health division in regional government offices to play a major role in administering its legally established free public health programs (17–19). Specifically, the prefecture-level public health divisions administer the public health programs, and program operation is conducted by municipal level centers to better meet the needs of local communities. Under the nationwide standardized protocol that designates which types of programs are to be provided for preschool children and their caregivers, Japan's decentralized system allows local discretion in priority setting and budgeting (17) so that local authorities can choose the size and frequency of service provision. Program operations regarding the mode of target population segmentation, health needs assessment, and selection of health education content are locally decided (20–22).
Although childhood injury mortality has declined nationally, there are considerable geographic disparities across Japan (23, 24). Given the relatively high educational attainment (25) and affordable universal health coverage since 1961 (26), the change in Japan's national trends and remaining geographic disparities may not be explained solely by local demographic characteristics and environmental uniqueness (27). Instead, investment in public health programs and changes in their effectiveness may provide an alternative explanation, with important policy implications. However, previous studies have failed to distinguish between the contributions of input, constraint conditions, and technical efficiency in the assessment of the effectiveness of public health programs (14, 15).
In this study, we estimated the technical efficiency of public health programs aiming to prevent unintentional childhood injury in Japan, and we distinguished the contribution of technical efficiency to national trend changes and regional health disparities from those of input and constraints. Overall cost efficiency is a product of technical efficiency and allocative efficiency; here, we focused specifically on technical efficiency because it reflects the current state of technology with regard to potentially producing the maximum output attainable at each input level (28, 29). Because the human and financial resources available for public services are often limited, we considered separate assessments of inputs, constraints, and technical efficiency promising in terms of providing policy leverage for improving and equalizing health outcomes across regions.
In the following section, we briefly review previous studies that have estimated technical efficiency in health, before presenting a theoretical model of the production function of unintentional childhood injury. We relied on stochastic frontier analysis (SFA) and a true fixed effects model (TFEM) to obtain efficiency estimations, accounting for time-invariant local heterogeneity. Our estimation revealed the existence of disparities. We also showed different trajectories of improvement in technical efficiency over time, which contributed to narrowing geographic health disparities. The final section discusses several policy implications for the SDGs, including closing the health gap.
Materials and Methods
Short Review of Technical Efficiency in Health
In health economics, there are two categories of production function—namely, the production function of health care and the production function of health (30, 31). A number of studies have concentrated on the production function of health care in hospitals and nursing homes (32–37), whereas the production function of health has been used for the evaluation of national health systems' performance (38–42).
In the production function of health care, the output is usually defined as the number of treated cases, and the inputs are physical capital investment (e.g., the number of beds and other medical equipment) and the health care labor force (e.g., the number of physicians and nurses). In the production function of health, the output is health status, and the inputs are health care services, along with demographic characteristics, personal health habits, and environmental factors.
Using the production function of health, in 2000, the World Health Organization published a league table ranking the efficiency of the health systems of 191 countries (38, 39), which was criticized for ignoring heterogeneity among OECD countries and non-OECD countries (40, 41). A recent meta-analysis of cross-country comparisons of OECD countries revealed inconsistent country rankings on efficiency and argued that the lack of a theoretical foundation for the production function of health systems may cause this inconsistency (42).
Another potential explanation for these inconsistent results may be found in the lack of differentiation of curative medical care and preventive public health services. Compared with curative medical care, preventive services may have a larger influence on certain health consequences when the effectiveness of post-hoc medical intervention is limited. Unintentional injury is such a case. Medical care after children sustain serious injuries has limited effectiveness in terms of reducing mortality and morbidity because most trauma deaths (i.e., 57–85%) occur before hospitalization (43–45), and the in-hospital mortality of pediatric trauma patients has remained around 4–7% in developed countries (43, 46, 47). Moreover, seriously injured children often have lifelong disabilities (48, 49). Therefore, the prevention of the initial injury-causing event is a major way to effectively reduce mortality and morbidity from injury among children.
Although public health services play a major role in promoting population health by preventing diseases and injuries, studies on these services' technical efficiency are scarce (32, 33). Studies on local public health departments in China and the United States exist, but they have only measured the production function of health care (50, 51). To our knowledge, no studies have estimated the technical efficiency of public health programs using the production function of health.
Theoretical Model of the Production Function of Unintentional Childhood Injury
Preventive services achieve health improvement through increased health-related knowledge and the subsequent modification of individual attitudes and targeted behaviors in the targeted population. These achievements are known to be affected by the quality of the education program, the receivers' health literacy, and the supportive environment (52–59).
Considering the above points, we defined the production function of unintentional childhood injury as a structural equation:
The output of the production function (Y) denotes population health outcomes related to unintentional childhood injury. Y is assumed to be a function of X, which represents inputs, in addition to the constraining factors (Z). More specifically, X denotes the volume of public health programs on preventing unintentional childhood injury. Public health programs potentially modify caregivers' knowledge, attitudes, and behaviors (7–11). Z denotes the caregivers' capacity and environmental factors. For the caregivers' capacity, we assume that caregivers' educational level and occupational status reflect their health literacy (55–57). In terms of environmental factors, traffic and the natural environment are related to the occurrence of unintentional childhood injury (57, 58). Access to emergency medical care providing specialized treatment for trauma patients is assumed to improve survival rates and functional outcomes (47, 59).
Empirical Model to Estimate Technical Efficiency
We used SFA rather than nonparametric data envelopment analysis because SFA can account for random error. SFA is more robust to outlying observations and changes in the input and output variables, compared with data envelopment analysis (28, 60). Nevertheless, SFA-estimated efficiency is still confounded by heterogeneity across samples. Greene has proposed the TFEM (40, 61), which can distinguish unobserved time-invariant heterogeneity across samples from estimated efficiency. Moreover, the TFEM assumes that efficiency is time-variant without assuming any functional form of time trend or the same time trend across samples. We believed that this assumption better reflected the reality of local technical efficiency.
For functional form, we adopted the conventional Cobb–Douglas form, as shown in equation (2), and the more flexible translog form, as shown in Equation (3):
Here, Y, X, and Z are the output (the health outcome of unintentional childhood injury), input (the volume of public health programs), and constraining factors (caregivers' capacity and environmental factors), respectively. Prefecture is denoted by i, year is denoted by t, and the random error term is denoted by vit. uit is the inefficiency term, which is assumed to be half-normally distributed. αi is the time-invariant prefecture-specific fixed effect, which may represent unmeasurable environmental factors such as the safety culture in communities. Y, X, and Z were natural log-transformed. Some variables were linearly transformed before being natural log-transformed for the model conversion. We assumed no time lag between input and output because we supposed that the major vehicle for reducing injury risk was parental behavioral change, which should happen in a short time (10, 22). The parameters were estimated by maximum likelihood. The efficiency score was estimated using the estimator proposed by Jondrow et al. (62). The “sfpanel” command with the “model (tfe)” option in Stata 16.0 (StataCorp, College Station, USA) was used for the analyses (63).
As a robustness check, we estimated technical efficiency using models assuming different distributions of the inefficiency terms (i.e., exponential and truncated-normal distributions) (40, 61, 63) and models assuming interactions between the input (X) and constraining factors (Z), as shown in Equation (4):
We also estimated technical efficiency excluding the areas damaged by the Great East Japan Earthquake (i.e., Miyagi, Fukushima, and Iwate).
Sample and Variables for the Efficiency Estimation Model
Panel data were compiled from 2001 to 2017 for all 47 prefectures in Japan (n = 799) because prefectures are the legislative units for public health policy in Japan. For the output (Y), prefecture-level numbers of DALYs by age, cause, and year were obtained from the Global Burden of Disease Study 2017 (2). The number of DALYs is a composite measure of disease burden that reflects both premature mortality and the prevalence and severity of ill health; it is the sum of the years of life lost and the years lived with disability (27, 64). In this study, we used linearly transformed DALYs for unintentional injury per 100,000 population aged under 5 years as the output; higher output values indicate better production of health. More specifically, we subtracted the number of DALYs from the median DALYs and linearly transformed the result so that the minimum value would be one. Population numbers were obtained from the population census and official population estimates (25, 65). Unintentional injury was categorized as pulmonary aspiration or foreign body in the airway; falling; drowning; fire, heat, or hot substances; transport injury; or other unintentional injury. Injuries caused by exposure to forces of nature were excluded to remove the influence of the Great East Japan Earthquake that hit the northeastern regions of Japan in 2011.
In terms of inputs (X), we compiled the prefecture-level coverage rates of all public health programs related to childhood injuries for which provision is not mandatory but is strongly recommended by national laws—namely, health checkups for children aged under 1 year, home visits for children aged under 1 year (i.e., home visits for newborns, premature babies, and children aged under 1 year), health guidance at the individual or group level, and health education at the group or community level (13, 14, 17, 20–22, 66, 67). We excluded some legally mandated services (i.e., health checkups for children aged 1.5 years and 3 years) from the list of inputs because nearly all children in all prefectures undergo these health checkups, and strictly standardized programs are less likely to contribute to regional variation in technical efficiency.
Trained public health nurses are the main providers of these programs, which are intended to enhance parental supervision and environmental preparedness. The main purposes of the health checkups are monitoring child growth and providing caregivers with childcare knowledge. Home visits are conducted to support caregivers to reduce behavioral risks based on an assessment of the home environment. Health guidance at the individual or group level is defined as guidance on specific topics such as child health, nutrition, and exercise. Health education at the group or community level is defined as health promotion activities to improve maternal and child health, mainly targeting women of reproductive age.
The coverage rate of each program was calculated based on the program characteristics by dividing the number of program participants by the target population size, as described in Table 1. The data on public health programs were obtained from government reports that all local governments are required to submit each fiscal year (66). We replaced only one missing observation for health checkup with the value from the previous year. Because the report for fiscal year 2010 did not include data from municipalities that were affected by the Great East Japan Earthquake in Iwate, Miyagi, and Fukushima prefectures, coverage rates for these prefectures in 2010 were calculated without the affected municipalities.
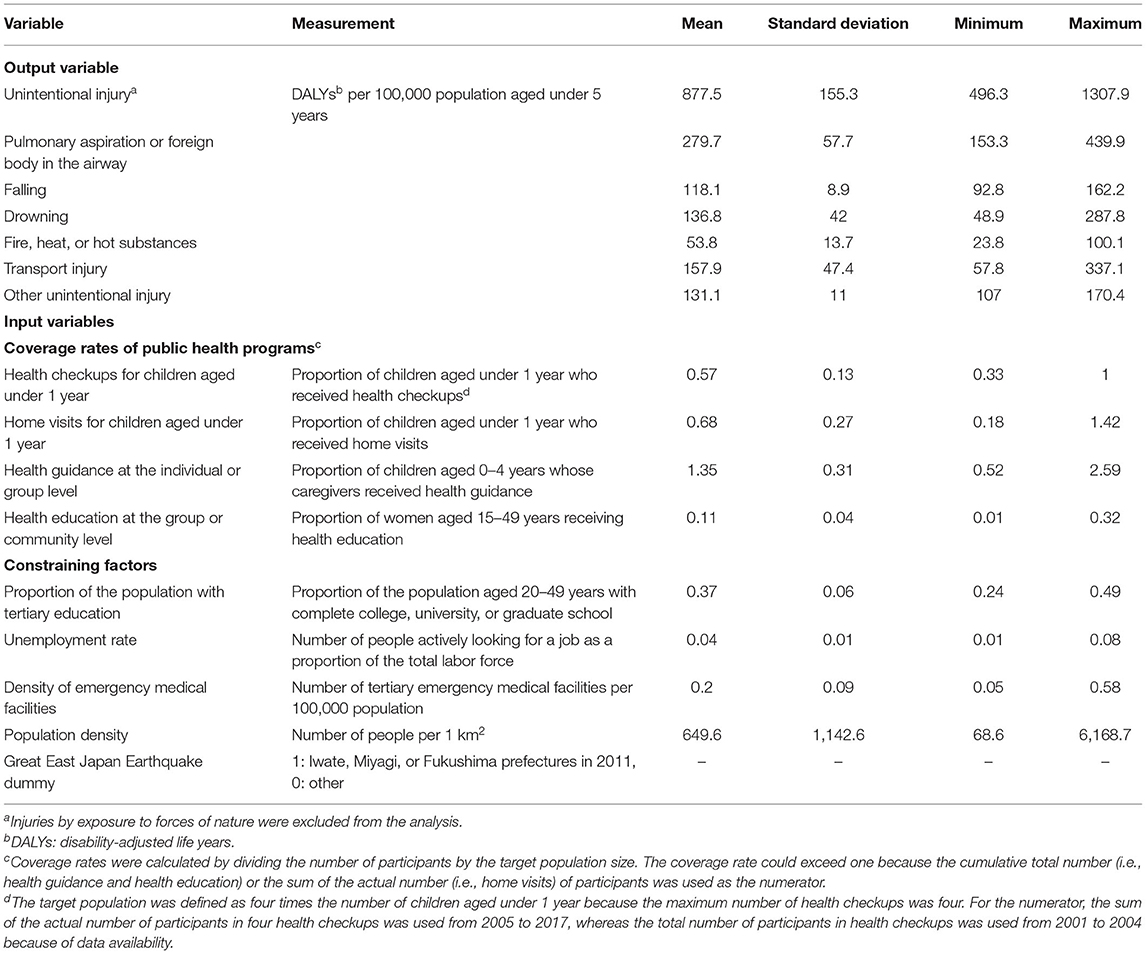
Table 1. Descriptive statistics of output, input, and constraining factors from 2001 to 2017 (n = 799).
In terms of caregivers' capacity (Z), the regional education level and unemployment rate were used as indicators of health literacy. The regional education level of the child-rearing generation was measured as the proportion of people aged 20–49 years in the total population who had completed tertiary education, which was derived from the 2000 and 2010 Population Censuses and allocated to 2001–2009 and 2010–2017, respectively (25). The region-level (i.e., set of prefectures) annual unemployment rate was obtained from the Labour Force Survey (68) and allocated to each corresponding prefecture.
Several environmental factors (Z) were assessed. To gauge access to emergency medical care including specialized treatment for trauma patients, the number of tertiary emergency medical facilities per 100,000 population was obtained from the Survey of Medical Institutions (69). Data from 1999, 2002, 2005, 2008, 2011, 2014, and 2017 were allocated to 2001, 2002–2004, 2005–2007, 2008–2010, 2011–2013, 2014–2016, and 2017, respectively. Data from 2011 were missing for some areas damaged by the Great East Japan Earthquake (i.e., Miyagi and Fukushima); thus, we allocated the values in the 2014 data to 2011–2016 for these areas. Population density, which was assumed to represent the level of traffic and the natural environment, was obtained from the Population Census (25). Data from 2000, 2005, 2010, and 2015 were allocated to 2001–2004, 2005–2009, 2010–2014, and 2015–2017, respectively. Because the Great East Japan Earthquake in 2011 severely damaged the living environment and the overall public health system in Iwate, Miyagi, and Fukushima prefectures (70), a dummy variable for these three affected prefectures in 2011 was also included.
Contributions of Inputs, Constraints, and Technical Efficiency to National Trends and Regional Disparities in Unintentional Childhood Injury
To investigate the contributions of inputs, constraints, and technical efficiency to average changes and disparities in DALYs, we compared the time trend of predicted DALYs using three types of inefficiency scores. First, to examine only the influences of inputs and constraining factors on DALYs, we predicted the counter-factual DALYs, holding the inefficiency score constant at its mean value for 2001 (i.e., Σuit/47; t = 2001) and leaving the fixed effects of prefecture, inputs, and constraints as they were in Equations (2) and (3). Second, to investigate the influence of technical efficiency trends, we predicted the DALYs using the annual mean score of inefficiency (i.e., Σuit/47; t = 2001–2017). Finally, we prepared the predicted DALYs using the actual prefecture-year-specific inefficiency estimates (i.e., uit).
By comparing these three sets of predicted DALYs, we were able to distinguish national trends and geographic disparities attributable to inputs, constraining factors, and the fixed effects of prefecture from those attributable to technical efficiency. We used the coefficient of variance (CV; the standard deviation of the value divided by the mean) to summarize the magnitude of regional disparities in the examined variables.
Because our study involved secondary analysis of anonymous data, the requirement for ethical approval and informed consent was waived under governmental-use approval and under the approval of the Institute for Health Metrics and Evaluation of the University of Washington for use of the Global Burden of Disease Study 2017 by non-commercial users.
Results
Descriptive Statistics of Variables Used to Estimate Technical Efficiency
Table 1 shows the descriptive statistics of the output, input, and constraining factors. The mean DALYs for unintentional injury per 100,000 population aged under 5 years decreased from 1,097.4 in 2001 to 698.1 in 2017. Similar time trends in DALYs were found across the 47 prefectures. The disparities in DALYs among prefectures did not narrow during the study period; the standard deviation of DALYs was 109.2 in 2001 and 90.5 in 2017, and the CV of DALYs was 0.10 in 2001 and 0.13 in 2017. The mean years of life lost and the mean years lived with disability because of unintentional injury were 539.6 and 158.6, respectively, in 2017. On average, all inputs and constraining factors increased from 2001 to 2017, except for unemployment rate, which decreased. For most inputs and constraining factors, the prefectural disparities measured by the standard deviation remained constant during the study period.
Estimation of Technical Efficiency
Following the results of the F-test in the pooled ordinary least squares model (P < 0.0001) and the Hausman test to select between the fixed effects regression model and the random-effects generalized least squares regression model (P < 0.0001), TFEM was selected to estimate technical efficiency in the Cobb–Douglas and translog models. The correlations between the fixed effect terms and estimated technical efficiency by year ranged from −0.15 to 0.29 in the Cobb–Douglas model and from −0.15 to 0.42 in the translog model. These correlations were not statistically significant except in 2001 in the Cobb–Douglas model and in 2001, 2010, and 2012 in the translog model (P < 0.05), which suggests no or low correlations between the two estimates.
The TFEM estimations are presented in Table 2. In the Cobb–Douglas model, all variables were statistically significant. For the inputs, the coefficients of the coverage rates of home visits, health guidance, and health education were positive, as expected, which suggests that these programs decreased injury burden. Only the coefficient of the coverage rate of health checkups was negative. Turning to the constraining factors, a positive coefficient of the proportion of the population with tertiary education and negative coefficients of unemployment rate and the Great East Japan Earthquake dummy were found as expected. Contrary to our expectations, the coefficients of density of emergency medical facilities and population density were negative, although the coefficient of emergency medical facilities was small.
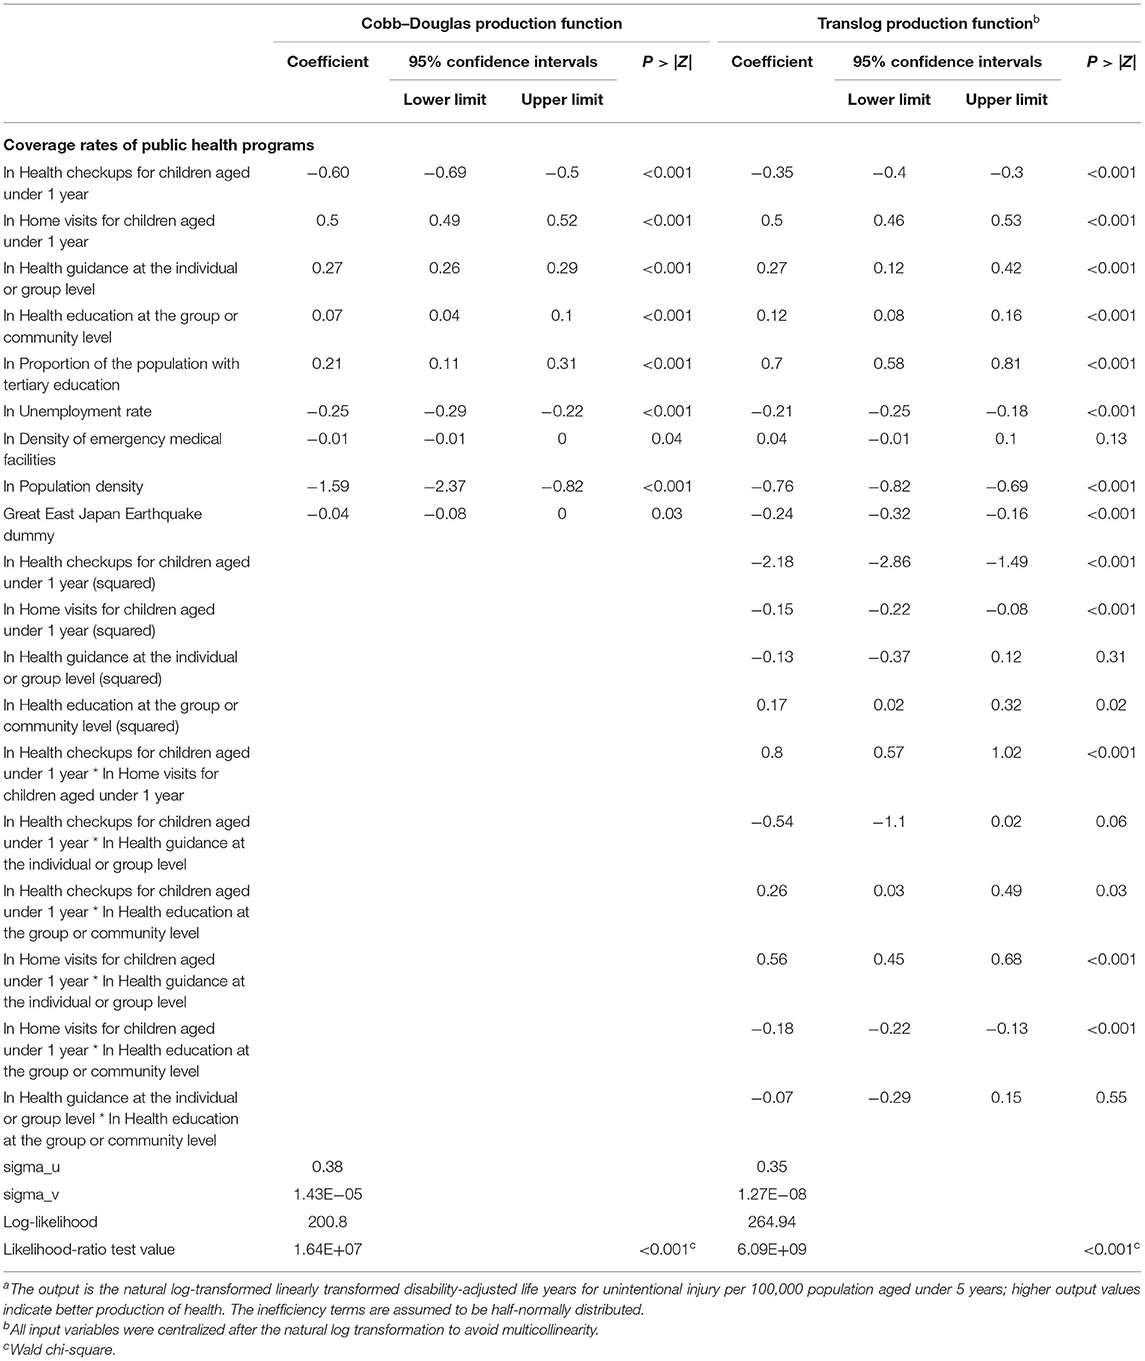
Table 2. Estimated production function using a true fixed effects model (N = 47 for 17 years)a.
The translog model yielded similar results to those from the Cobb–Douglas model. Pearson's correlation coefficient for technical efficiency estimated from the Cobb–Douglas and the translog models was 0.85 (P < 0.0001).
The mean technical efficiency in the 47 prefectures increased from 0.59 in 2001 to 0.85 in 2017 in the Cobb–Douglas model and from 0.62 in 2001 to 0.85 in 2017 in the translog model, as shown in Figure 1. Both models revealed that the efficiency gaps among prefectures narrowed dramatically from 2001 to 2007. However, the narrowing trend stagnated in 2007, and the gaps remained almost constant from that point until 2017. Specifically, in the translog model, the standard deviation of technical efficiency in 2001, 2007, and 2017 was 0.24, 0.09, and 0.10, respectively. The range of the technical efficiency in 2001, 2007, and 2017 was 0.01–1.00, 0.62–1.00, and 0.65–1.00, respectively.
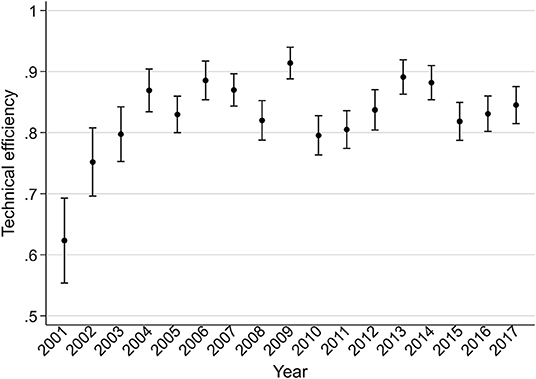
Figure 1. Technical efficiency of 47 prefectures from 2001 to 2017 based on the translog production function. The means of technical efficiency are indicated by point symbols and 95% confidence intervals are indicated by capped bars.
The time trend of technical efficiency by prefecture using the translog model is shown in Figure 2. Prefectures with low efficiency (i.e., <0.3) in 2001, such as Toyama, Okayama, Tokushima, Saga, and Kagoshima, reached a high level (i.e., >0.85) in 2017. Conversely, some prefectures, including Yamagata, Fukushima, Aichi, Oita, and Okinawa, showed decreases, reaching the lowest level in 2017. Other prefectures had constant technical efficiency or moderate change in technical efficiency over time.
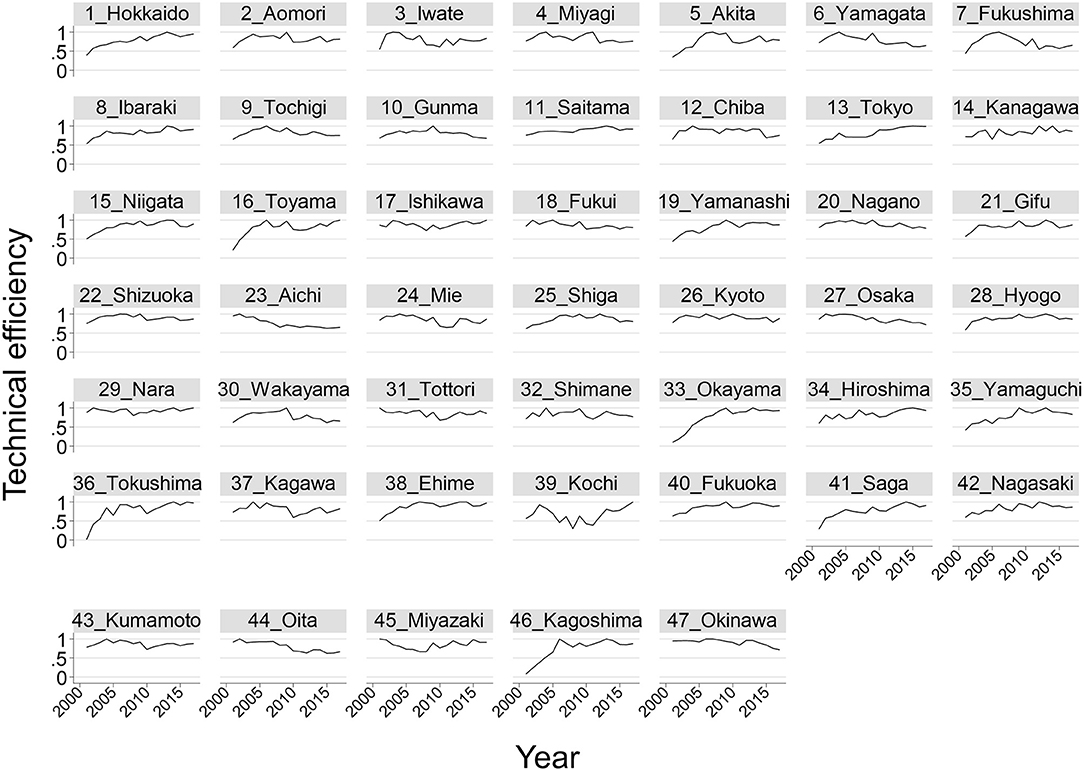
Figure 2. Technical efficiency by prefecture from 2001 to 2017 based on the translog production function. The number listed before each prefecture's name is the prefecture's ID.
Robustness Checks of the Estimation of Technical Efficiency
The estimations were robust to different distributions of the inefficiency terms in the translog model; the Cobb–Douglas models with these distributions did not converge (data not shown; available on request). The translog model assuming interactions between the inputs and constraining factors [Equation (4)] yielded findings that were similar to the main results [Equation (3)] (data not shown; available on request). The results of the estimations excluding areas damaged by the Great East Japan Earthquake were also similar to the main results in the Cobb–Douglas and translog models (data not shown; available on request).
Contributions of Inputs, Constraints, and Technical Efficiency to National Trends and Regional Disparities in Unintentional Childhood Injury
In the translog model, from 2001 to 2017, the mean DALYs predicted with the mean score of inefficiency in 2001 decreased from 1135.3 to 918.6, and the CV increased from 0.04 to 0.09 (Figure 3A), indicating that national improvements in inputs and constraints decreased the mean DALYs but that the disparities in inputs and constraints widened the regional DALYs gap.
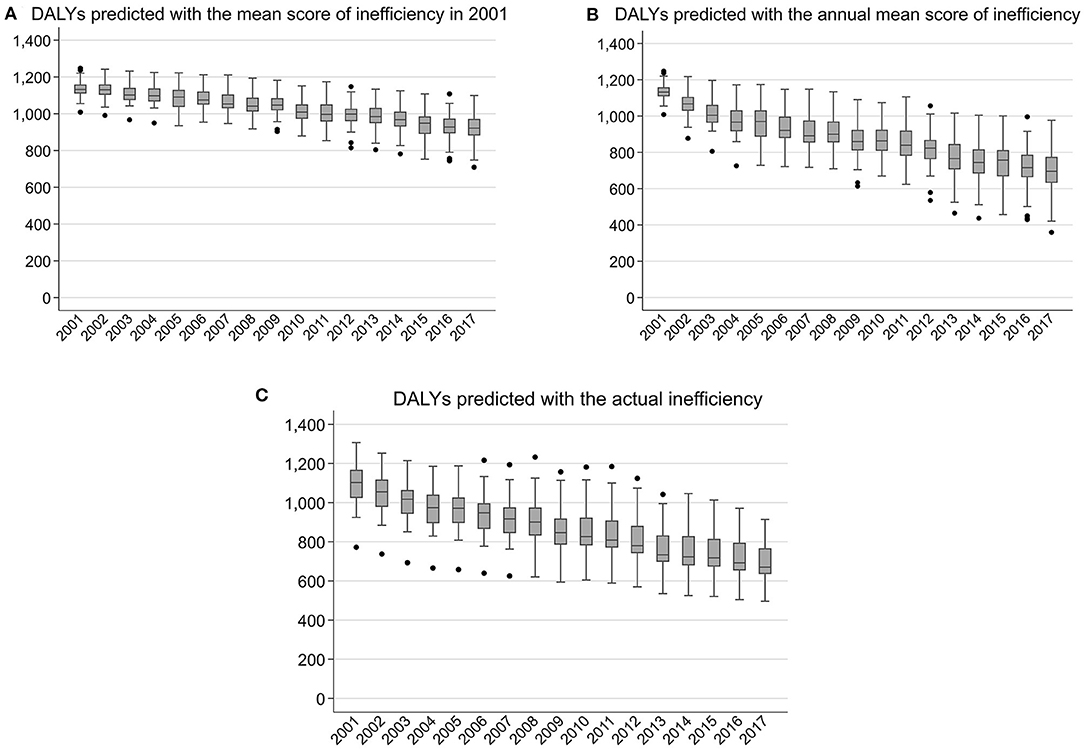
Figure 3. Predicted DALYs from 2001 to 2017 based on the translog production function. DALYs, disability-adjusted life years. DALYs per 100,000 population aged under 5 years.
Compared with the trend depicted in Figure 3A, the mean DALYs predicted with the annual mean score of inefficiency showed a steeper decrease, falling from 1135.3 in 2001 to 691.3 in 2017, indicating that the improvement of mean efficiency further contributed to the decrease in mean DALYs (Figure 3B). Figure 3B also shows an increase in the CV from 0.04 in 2001 to 0.19 in 2017, indicating that the regional DALYs gap would have been amplified if mean efficiency improved while inputs and constraints remaining at the current level. However, the CV of DALYs predicted with the actual inefficiency estimates increased only from 0.10 in 2001 to 0.13 in 2017, indicating that the trend of a widening DALYs gap was offset by the actual trajectory of efficiency changes (Figures 3B,C). Specifically, prefectures with low output (high DALYs) improved their efficiency, reaching DALYs lower than those as expected with inputs and constraints. In contrast, prefectures with high output (low DALYs) stagnated efficiency improvement, reaching DALYs higher than those as expected with inputs and constraints. Similar results were obtained with the Cobb–Douglas model (data not shown; available on request).
Discussion
Our results revealed that the technical efficiency of public health programs has improved and that the disparities in efficiency across prefectures narrowed dramatically until 2007 and then remained constant until 2017. National improvements in inputs, constraints, and technical efficiency contributed to an overall reduction in unintentional childhood injury in Japan. Regional disparities in inputs and constraints widened the population health disparities, but different efficiency improvement trajectories counterbalanced this effect, offsetting the trend of widening health disparities. This study contributes to existing efficiency research by presenting a novel application of efficiency measurement to the assessment of regional health disparity in the context of public health.
Interpretation of the Estimation of Technical Efficiency
According to a systematic review on the technical efficiency of the overall health systems of OECD countries, Japan has consistently shown the highest efficiency, with an average value of one (42). In this study, however, local disparities were observed in the technical efficiency of public health programs aiming to prevent unintentional childhood injury. Since the 1994 amendment to the Community Health Act, decentralization, or delegating responsibilities to lower-level governments, has strengthened in Japan (17–19). Although decentralization is expected to increase efficiency by using local initiatives for service delivery and procurement budgeting (71), our results suggest that not all local governments make full use of their ability to operate public health programs.
Nevertheless, technical efficiency has improved nationally, and the disparities among prefectures narrowed dramatically from 2001 to 2007. In this study, the mean technical efficiency in the 47 prefectures increased from 0.62 in 2001 to 0.85 in 2017 in the translog model. Similar technical efficiency scores have been reported in studies on local public health sectors in the United States and China (i.e., scores of 0.4–0.7) (50, 51). Although simple comparisons are difficult because of differences in the targeted outputs and the mode of production function, we estimated the average impact of improved technical efficiency on DALYs to be 227.3 DALYs per 100,000 population aged under 5 years from 2001 to 2017.
The national health promotion plan “Healthy Parents and Children 21,” which was initiated in 2001 in Japan (72), is supposed to be one of several nationwide factors reducing efficiency disparities. Because prefectures and municipalities plan and evaluate their public health programs with reference to the national plan, the use of standardized benchmarking for evaluation may reduce the gap in technical efficiency among local governments. Moreover, similar time trends in technical efficiency were observed in most injury categories (data not shown; available on request). The national road safety policies introduced in the first decade of the twenty-first century, such as strengthening punishment for driving under the influence of alcohol and compulsory child restraint seat use (73), could also have reduced the gap in efficiency by enhancing social norms on safety. Nonetheless, the reasons for some prefectures with the lowest levels of efficiency in 2001 seeing drastic improvements in efficiency remain unknown. There is a need for further studies on the program management, political, and organizational factors influencing efficiency.
However, the narrowing trend in the efficiency gaps stagnated in 2007 and subsequently remained constant until 2017. Some prefectures even showed decreased efficiency. Although the exact reasons for these findings are unknown, local governments' prioritization of preventing unintentional injury may have been lowered because of the conflicting demands of other public health programs (e.g., on developmental disability and child abuse prevention) that were newly emphasized because of increased societal awareness (21, 74).
For the production function of unintentional childhood injury, the coefficients of inputs were positive except for the coverage rate of health checkups, which had a negative effect. Although the frequency of health checkups is predetermined by local governments on the basis of policy rather than annual changes in health needs, areas at high risk for childhood injury may promote health staff members' efforts to follow up with children with no visits, which may have led to the negative coefficient of health checkups.
Policy Implications
Our findings suggest several policy implications. First, public health program efficiency is an important—but ignored—policy target for the SDGs, including closing the regional health gap. To achieve the SDGs, developing strategies based on separate assessments of inputs, constraints, and efficiency is required to identify points of intervention for individual local governments. For example, prefectures with good health outcomes because of high input and an advantageous situation in terms of constraints but low efficiency need to make efforts to improve their efficiency. In contrast, prefectures with poor health outcomes because of low input and a disadvantageous situation in terms of constraints but high efficiency need to increase their input or address their constraints. This study suggests possibilities for creating an assessment system to provide this information using practical regional health sector reports. Additionally, to advocate investments in the SDGs in LMICs, efficiency estimations can be used to produce projections of financial resource needs that are more realistic than the current estimates, which assume efficient practices or simple scenarios (i.e., less efficient or linearly increasing efficiency) (6). Second, with the limited human and financial resources available, policy makers and practitioners should find ways to establish efficient locally operating public health systems. Our estimations suggest that most prefectures in Japan have possibilities for reducing unintentional childhood injury by improving efficiency with the current input level—that is, without increasing expenditures. Further studies are needed to support practitioners to flexibly meet regional demands for the efficient operation of local public health systems.
The Study's Strengths and Limitations
This study's main strength lies in its estimation of the technical efficiency of preventive public health programs using the production function of health. Our empirical model can be applied to other population health topics where preventive services may have a larger influence than curative medical care, such as dental diseases and frailty among older adults.
The study also had several limitations. First, the calculation of DALYs in this public data source relied on the imputation of missing data on mortality and disease prevalence using the Bayesian meta-regression tool DisMod-MR (64, 75). Our estimation confirmed the high accuracy of the prediction of DALYs because the R-squared of the ordinary least squares model regressing original DALYs on DALYs predicted with the actual inefficiency estimates was 1.0. However, the lack of randomness may be attributed to the use of imputation in the DALYs estimation, which may be one of the reasons why the standard deviation of the random error in the TFEM (i.e., sigma_v) was quite small in this study. Although prefecture-level data on mortality from unintentional injuries are available for Japan, we adopted DALYs as the health output because the prevention programs intend to reduce not only death but also injury-related disabilities. Additionally, DALYs have advantages over mortality in that DALYs take into account random errors and deal with the garbage code of deaths. We confirmed that the estimates of efficiency using under-five mortality rate of unintentional injury (Supplementary Table 1 and Supplementary Figure 1) are moderately correlated with the estimations using DALYs; Pearson's correlation coefficient for technical efficiency was 0.30 (P < 0.001). The injury incidence rate could be used as the direct output, but these data were not available. Whether re-estimation with such health outcomes would change the results should be investigated in future studies.
Second, there are other potential inputs in the production function of unintentional childhood injury that were not investigated because of a lack of data availability—namely, programs only targeting families at high risk of adverse child outcomes, prefecture- or municipality-specific parenting support services, and programs with unclear target populations (i.e., optional home visits for children aged over 1 year and health checkups for children aged 4–6 years). The influences of these potential inputs on DALYs, which were included in the fixed effect or inefficiency terms in this study, may be minor because the program scale and target populations are small. Estimations including these programs are needed in future studies. Additionally, public health programs and child protective services are linked, but this study focused solely on the former because the decision-making units for the two types of programs differ (20, 21). Although adjustments for the quality of health care are required in the production function of health care (34, 76), the quality of health care should be included in technical efficiency in the production function of health, given that the output is health status, which relates to care quality. Even though unintentional childhood injury can be attributed primarily to the caregivers' behaviors and the environment, and their impacts may differ by injury categories, it is not feasible to distinguish the contributions of prefectural public health interventions from those of other sources, which may contaminate our estimation of technical efficiency at prefectural levels.
Third, if persistent inefficiency exists, it is completely absorbed in prefecture-specific heterogeneity as fixed effect terms in the TFEM. We believe that the time-variant assumption regarding efficiency in the TFEM (40, 61) is reasonable because the 17-year study period was long enough to observe a change in technical efficiency.
Finally, differences in technical efficiency across municipalities within a single prefecture remain unknown. Although our selection of prefecture as the unit of analysis seems reasonable because it is prefectures that administer public health programs, future studies should investigate efficiency at the municipality level because the programs are operated by municipality-level centers (17–19).
Conclusions
This study demonstrates that regional disparities exist in the technical efficiency of legally established public health programs aiming to prevent unintentional childhood injury in Japan. The assessment of inputs, constraints, output, and technical efficiency of public health programs could provide policy leverage relevant to region-specific conditions and performance, contributing to the achievement of health promotion and equity.
Data Availability Statement
Publicly available datasets were analyzed in this study. This data can be found here: “Global Burden of Disease Study 2017” at http://ghdx.healthdata.org/, “Vital statistics 2001–2017” at https://www.mhlw.go.jp/english/database/db-hw/vs01.html, “Population Census 2000, 2005, 2010, 2015” at https://www.stat.go.jp/english/data/kokusei/index.html, “Population estimates 2001–2017” at https://www.stat.go.jp/english/data/jinsui/index.html, “Report on regional public health services and health promotion services 2001–2017” at https://www.mhlw.go.jp/english/database/db-hss/rrphshps.html, “Labour Force Survey 2001–2017” at https://www.stat.go.jp/english/data/roudou/index.html, and “Survey of Medical Institutions 1999–2017” at https://www.mhlw.go.jp/english/database/db-hss/smi.html.
Author Contributions
AH was responsible for the conception and design of the study, acquisition of the data, analysis and interpretation of the data, drafting the manuscript, and obtaining funding. HK contributed to the analysis and interpretation of the data, provided technical support, and participated in the critical revision of the manuscript. HH was responsible for the conception and design of the study, analysis and interpretation of the data, critical revision of the manuscript, obtaining funding, and providing supervision. All authors approved the final version of the manuscript.
Funding
This work was supported by the Institute for Health Economics and Policy for fiscal year 2019 (Wakate-kenkyusya-ikusei-kenkyu-josei), and by JSPS KAKENHI Grant Numbers JP21J10730 and JP18H04070. The funding sources had no involvement in the study design, data collection, analysis, interpretation, or preparation of the manuscript.
Conflict of Interest
The authors declare that the research was conducted in the absence of any commercial or financial relationships that could be construed as a potential conflict of interest.
Publisher's Note
All claims expressed in this article are solely those of the authors and do not necessarily represent those of their affiliated organizations, or those of the publisher, the editors and the reviewers. Any product that may be evaluated in this article, or claim that may be made by its manufacturer, is not guaranteed or endorsed by the publisher.
Acknowledgments
We would like to express our gratitude to Dr. Rei Goto of Keio University for discussing the theoretical model of the production function at the 15th Annual Conference of the Japan Health Economics Association (JHEA). We are grateful to Dr. Haruko Noguchi of Waseda University and Dr. Reo Takaku of Hitotsubashi University for providing us with valuable suggestions on efficiency estimation. We thank Dr. Narimasa Kumagai of Seinan Gakuin University and Mr. Yuichi Watanabe of Waseda University for their helpful comments at the 15th JHEA conference. We thank Dr. Shuhei Nomura of Keio University for providing us with valuable information on estimating disability-adjusted life years. We would like to express our gratefulness to the Institute for Health Metrics and Evaluation, which provided the Global Burden of Disease Study 2017 data. We are grateful for financial support from by the Institute for Health Economics and Policy for fiscal year 2019 (Wakate-kenkyusya-ikusei-kenkyu-josei), and from JSPS KAKENHI Grant Numbers JP21J10730 and JP18H04070. We presented abstracts of this research at the 15th JHEA conference, at the 79th Annual Meeting of the Japanese Society of Public Health, and at the 2020 European Health Economics Association Conference. Ayumi Hashimoto published the abstract as a grant report for the Institute for Health Economics and Policy for fiscal year 2019 in Monthly IHEP No. 302. The abstract will be published as part of Ayumi Hashimoto's doctoral dissertation in the UTokyo Repository.
Supplementary Material
The Supplementary Material for this article can be found online at: https://www.frontiersin.org/articles/10.3389/fpubh.2022.913875/full#supplementary-material
References
1. GBD 2017 Child and Adolescent Health Collaborators Reiner RC Olsen HE Ikeda CT Echko MM Ballestreros KE . Diseases, injuries, and risk factors in child and adolescent health, 1990 to 2017: findings from the global burden of diseases, injuries, and risk factors 2017 study. JAMA Pediatr. (2019) 173:E190337. doi: 10.1001/jamapediatrics.2019.0337
2. Global Health Data Exchange. Global Burden of Disease Study 2017. Institute for Health Metrics and Evaluation: University of Washington. (2017). Available online at: http://ghdx.healthdata.org/ (accessed May 27, 2020).
3. Alonge O, Hyder AA. Reducing the global burden of childhood unintentional injuries. Arch Dis Child. (2014) 99:62–69. doi: 10.1136/archdischild-2013-304177
4. Haagsma JA, Graetz N, Bolliger I, Naghavi M, Higashi H, Mullany EC, et al. The global burden of injury: incidence, mortality, disability-adjusted life years and time trends from the Global Burden of Disease study 2013. Inj Prev. (2016) 22:3–18. doi: 10.1136/injuryprev-2015-041616
5. Sekii H, Ohtsu T, Shirasawa T, Ochiai H, Shimizu T, Kokaze A. Childhood mortality due to unintentional injuries in Japan, 2000-2009. Int J Environ Res Public Health. (2013) 10:528–40. doi: 10.3390/ijerph10020528
6. Stenberg K, Hanssen O, Edejer TTT, Bertram M, Brindley C, Meshreky A, et al. Financing transformative health systems towards achievement of the health Sustainable Development Goals: a model for projected resource needs in 67 low-income and middle-income countries. Lancet Global Health. (2017) 5:E875–87. doi: 10.1016/S2214-109X(17)30263-2
7. Bhatta S, Mytton J, Deave T. Environmental change interventions to prevent unintentional home injuries among children in low- and middle-income countries: a systematic review and meta-analysis. Child Care Health Dev. (2020) 46:537–51. doi: 10.1111/cch.12772
8. Hubbard S, Cooper N, Kendrick D, Young B, Wynn PM, He Z, et al. Network meta-analysis to evaluate the effectiveness of interventions to prevent falls in children under age 5 years. Inj Prev. (2015) 21:98–108. doi: 10.1136/injuryprev-2013-041135
9. Kendrick D, Mulvaney CA, Ye L, Stevens T, Mytton JA, Stewart-Brown S. Parenting interventions for the prevention of unintentional injuries in childhood. Cochrane Database Syst Rev. (2013) CD006020. doi: 10.1002/14651858.CD006020.pub3
10. Kendrick D, Young B, Mason-Jones AJ, Ilyas N, Achana FA, Cooper NJ, et al. Home safety education and provision of safety equipment for injury prevention (review). Evidence-Based Child Heal. (2013) 8:761–939. doi: 10.1002/ebch.1911
11. Kendrick D, Ablewhite J, Achana F, Benford P, Clacy R, Coffey F, et al. Keeping Children Safe: a multicentre programme of research to increase the evidence base for preventing unintentional injuries in the home in the under-fives. Program Grants Appl Res. (2017) 5:1–834. doi: 10.3310/pgfar05140
12. Pierce M, Hope HF, Kolade A, Gellatly J, Osam CS, Perchard R, et al. Effects of parental mental illness on children's physical health: systematic review and meta-analysis. Br J Psychiat. (2020) 217:354–63. doi: 10.1192/bjp.2019.216
13. Yamaoka Y, Fujiwara T, Tamiya N. Association between maternal postpartum depression and unintentional injury among 4-month-old infants in Japan. Matern Child Health J. (2016) 20:326–36. doi: 10.1007/s10995-015-1832-9
14. Spinks A, Turner C, Nixon J, McClure RJ. The “WHO Safe Communities” model for the prevention of injury in whole populations. Cochrane Database Syst Rev. (2009) CD004445. doi: 10.1002/14651858.CD004445.pub3
15. Vecino-Ortiz AI, Jafri A, Hyder AA. Effective interventions for unintentional injuries: a systematic review and mortality impact assessment among the poorest billion. Lancet Glob Heal. (2018) 6:E523–34. doi: 10.1016/S2214-109X(18)30107-4
16. Orton E, Whitehead J, Mhizha-Murira J, Clarkson M, Watson MC, Mulvaney CA, et al. School-based education programmes for the prevention of unintentional injuries in children and young people. Cochrane Database Syst Rev. (2016) 12:CD010246. doi: 10.1002/14651858.CD010246.pub2
17. OECD. OECD Reviews of Public Health: Japan: A Healthier Tomorrow. Paris: OECD Publishing (2019). (accessed May 1, 2021).
18. Sakamoto H, Rahman M, Nomura S, Okamoto E, Koike S, Yasunaga H. Japan Health System Review. New Delhi: World Health Organization, Regional Office for South-East Asia (2018). Available online at: https://apps.who.int/iris/handle/10665/259941 (accessed May 1, 2021).
19. Takemura S, Ohmi K, Sone T. Public health center (Hokenjo) as the frontline authority of public health in Japan: contribution of the National Institute of Public Health to its development. J Natl Inst Public Heal. (2020) 69:2–13. doi: 10.1109/JBHI.2022.3181205
20. Boshi hoken hou [Maternal Child Health Act]. (1965). Available online at: https://elaws.e-gov.go.jp/document?lawid=340AC0000000141 (accessed July 29, 2020).
21. Jidou fukushi hou [Child Welfare Act]. (1947). Available online at: http://www.japaneselawtranslation.go.jp/law/detail/?printID=andid=11andre=andvm=02 (accessed July 29, 2020).
22. Sampei M, Kato T, Piedvache A, Morisaki N, Saito J, Akiyama Y, et al. Municipality-level checklist to promote parental behaviors related to prevention of unintentional injury in young children: a multilevel analysis of national data. J Epidemiol. (2020) 30:450–56. doi: 10.2188/jea.JE20190079
23. Ministry Ministry of Health Labour and Welfare. Jinkou doutai chousa 2001–2017 [Vital statistics 2001–2017]. Available online at: https://www.mhlw.go.jp/english/database/db-hw/vs01.html (accessed May 4, 2021).
24. Nagata C, Moriichi A, Morisaki N, Gai-Tobe R, Ishiguro A, Mori R. Inter-prefecture disparity in under-5 mortality: 115 year trend in Japan. Pediatr Int. (2017) 59:816–20. doi: 10.1111/ped.13304
25. Statistics Bureau and Ministry of Internal Affairs and Communications. Kokusei Chousa 2000, 2005, 2010, 2015 [Population Census 2000, 2005, 2010, 2015]. Available online at: https://www.stat.go.jp/english/data/kokusei/index.html (accessed July 10, 2020).
26. Ikegami N, Yoo BK, Hashimoto H, Matsumoto M, Ogata H, Babazono A, et al. Japanese universal health coverage: evolution, achievements, and challenges. Lancet. (2011) 378:1106–15. doi: 10.1016/S0140-6736(11)60828-3
27. Nomura S, Sakamoto H, Glenn S, Tsugawa Y, Abe SK, Rahman MM, et al. Population health and regional variations of disease burden in Japan, 1990–2015: a systematic subnational analysis for the Global Burden of Disease Study 2015. Lancet. (2017) 390:1521–38. doi: 10.1016/S0140-6736(17)31544-1
28. Coelli TJ, Rao DSP, O'Donnell CJ, Battese GE. An Introduction to Efficiency and Productivity Analysis, 2nd ed. New York: Springer (2005).
29. Farrell MJ. The measurement of productive efficiency. J R Stat Soc Series A. (1957) 120:253–90. doi: 10.2307/2343100
30. Cohen JP. Production functions for medical services. In: Culyer AJ, editors. Encyclopedia of Health Economics, Volume 3. Amsterdam, Netherlands: Elsevier (2014). p. 180–83.
31. Hollingsworth B. Evaluating efficiency of a health care system in the developed world. In: Culyer AJ, editor. Encyclopedia of Health Economics, Volume 1. Amsterdam, Netherlands: Elsevier (2014). p. 292–99.
32. Cylus J, Papanicolas I, Smith PC. Health System Efficiency: How to Make Measurement Matter for Policy Management. (2016). Available online at: https://www.euro.who.int/__data/assets/pdf_file/0004/324283/Health-System-Efficiency-How-make-measurement-matter-policy-management.pdf (accessed July 5, 2020).
33. Hollingsworth B. The measurement of efficiency and productivity of health care delivery. Health Econ. (2008) 17:1107–28. doi: 10.1002/hec.1391
34. Kawaguchi H, Hashimoto H, Matsuda S. Efficacy of a numerical value of a fixed-effect estimator in stochastic frontier analysis as an indicator of hospital production structure. BMC Health Serv Res. (2012) 12:334. doi: 10.1186/1472-6963-12-334
35. Varabyova Y, Schreyögg J. International comparisons of the technical efficiency of the hospital sector : panel data analysis of OECD countries using parametric and non-parametric approaches. Health Policy. (2013) 112:70–79. doi: 10.1016/j.healthpol.2013.03.003
36. Tran A, Nguyen KH, Gray L, Comans T. A systematic literature review of efficiency measurement in nursing homes. Int J Environ Res Public Health. (2019) 16:2186. doi: 10.3390/ijerph16122186
37. Zakowska I, Godycki-Cwirko M. Data envelopment analysis applications in primary health care: a systematic review. Fam Pract. (2020) 37:147–53. doi: 10.1093/fampra/cmz057
38. Evans DB, Tandon A, Murray CJL, Lauer JA. The Comparative Efficiency of National Health Systems in Producing Health: An Analysis of 191 Countries. GPE Discussion Paper Series: No. 29. (2000). Available online at: https://www.who.int/healthinfo/paper29.pdf (accessed June 9, 2020).
39. World Health Organization. The World Health Report 2000: Health Systems: Improving Performance. (2000). Available online at: https://www.who.int/whr/2000/en/ (accessed June 8, 2020).
40. Greene W. Distinguishing between heterogeneity and inefficiency: stochastic frontier analysis of the World Health Organization's panel data on national health care systems. Health Econ. (2004) 13:959–80. doi: 10.1002/hec.938
41. Hollingsworth B, Wildman J. The efficiency of health production: re-estimating the WHO panel data using parametric and non-parametric approaches to provide additional information. Health Econ. (2003) 12:493–504. doi: 10.1002/hec.751
42. Varabyova Y, Müller J-M. The efficiency of health care production in OECD countries: a systematic review and meta-analysis of cross-country comparisons. Health Policy. (2016) 120:252–63. doi: 10.1016/j.healthpol.2015.12.005
43. Aoki M, Abe T, Saitoh D, Oshima K. Epidemiology, patterns of treatment, and mortality of pediatric trauma patients in Japan. Sci Rep. (2019) 9:917. doi: 10.1038/s41598-018-37579-3
44. Beck B, Smith K, Mercier E, Gabbe B, Bassed R, Mitra B, et al. Differences in the epidemiology of out-of-hospital and in-hospital trauma deaths. PLoS ONE. (2019) 14:E0217158. doi: 10.1371/journal.pone.0217158
45. Gedeborg R, Chen L-H, Thiblin I, Byberg L, Melhus H, Michaelsson K, et al. Prehospital injury deaths—Strengthening the case for prevention: nationwide cohort study. J Trauma Acute Care Surg. (2012) 72:765–72. doi: 10.1097/TA.0b013e3182288272
46. Beck B, Teague W, Cameron P, Gabbe BJ. Causes and characteristics of injury in paediatric major trauma and trends over time. Arch Dis Child. (2019) 104:256–61. doi: 10.1136/archdischild-2018-315565
47. Wang NE, Saynina O, Vogel LD, Newgard CD, Bhattacharya J, Phibbs CS. The effect of trauma center care on pediatric injury mortality in California, 1999 to 2011. J Trauma Acute Care Surg. (2013) 75:704–16. doi: 10.1097/TA.0b013e31829a0a65
48. Gabbe BJ, Simpson PM, Sutherland AM, Palmer CS, Williamson OD, Butt W, et al. Functional and health-related quality of life outcomes after pediatric trauma. J Trauma. (2011) 70:1532–38. doi: 10.1097/TA.0b013e31820e8546
49. Zwingmann J, Mehlhorn AT, Hammer T, Bayer J, Südkamp NP, Strohm PC. Survival and neurologic outcome after traumatic out-of-hospital cardiopulmonary arrest in a pediatric and adult population: a systematic review. Crit Care. (2012) 16:R117. doi: 10.1186/cc11410
50. Li C, Sun M, Shen JJ, Cochran CR, Li X, Hao M. Evaluation on the efficiencies of county-level centers for disease control and prevention in China: results from a national survey. Trop Med Int Heal. (2016) 21:1106–14. doi: 10.1111/tmi.12753
51. Mukherjee K, Santerre RE, Zhang NJ. Explaining the efficiency of local health departments in the U.S.: an exploratory analysis. Health Care Manag Sci. (2010) 13:378–87 doi: 10.1007/s10729-010-9136-5
52. Commission on Social Determinants of Health. Closing the Gap in a Generation: Health Equity Through Action on the Social Determinants of Health. Final Report of the Commission on Social Determinants of Health. (2008). Available online at: https://www.who.int/publications/i/item/WHO-IER-CSDH-08.1 (accessed July 17, 2020).
53. Launiala A. How much can a KAP survey tell us about people's knowledge, attitudes and practices? Some observations from medical anthropology research on malaria in pregnancy in Malawi. Anthropol Matters. (2009) 11:1–13. doi: 10.22582/am.v11i1.31
54. Sallis JF, Owen N. Ecological models of health behavior. In: Glanz K, Rimer BK, Viswanath K, editors. Health Behavior: Theory, Research, and Practice. 5th ed. San Francisco: Jossey-Bass (2015). p. 43–64.
55. Sørensen K, Van Den Broucke S, Fullam J, Doyle G, Pelikan J, Slonska Z, et al. Health literacy and public health: a systematic review and integration of definitions and models. BMC Public Health. (2012) 12:80. doi: 10.1186/1471-2458-12-80
56. Cutler DM, Lleras-Muney A. Understanding differences in health behaviors by education. J Health Econ. (2010) 29:1–28. doi: 10.1016/j.jhealeco.2009.10.003
57. Hong J, Lee B, Ha EH, Park H. Parental socioeconomic status and unintentional injury deaths in early childhood: consideration of injury mechanisms, age at death, and gender. Accid Anal Prev. (2010) 42:313–19. doi: 10.1016/j.aap.2009.08.010
58. Kim K, Ozegovic D, Voaklander DC. Differences in incidence of injury between rural and urban children in Canada and the USA: a systematic review. Inj Prev. (2012) 18:264–71. doi: 10.1136/injuryprev-2011-040306
59. Pracht EE, Tepas JJ, Langland-Orban B, Simpson L, Pieper P, Flint LM. Do pediatric patients with trauma in Florida have reduced mortality rates when treated in designated trauma centers? J Pediatr Surg. (2008) 43:212–21. doi: 10.1016/j.jpedsurg.2007.09.047
60. Jacobs R, Smith PC. Street A: Measuring Efficiency in Health Care—Analytic Techniques and Health Policy. Cambridge: Cambridge University Press (2006).
61. Greene W. Reconsidering heterogeneity in panel data estimators of the stochastic frontier model. J Econom. (2005) 126:269–303. doi: 10.1016/j.jeconom.2004.05.003
62. Jondrow J, Knox Lovell CA, Materov IS, Schmidt P. On the estimation of technical inefficiency in the stochastic frontier production function model. J Econom. (1982) 19:233–38. doi: 10.1016/0304-4076(82)90004-5
63. Belotti F, Daidone S, Ilardi G, Atella V. Stochastic frontier analysis using Stata. Stata J. (2013) 13:719–758. doi: 10.1177/1536867X1301300404
64. GBD 2017 DALYs and HALE Collaborators. Global, regional, and national disability-adjusted life-years (DALYs) for 359 diseases and injuries and healthy life expectancy (HALE) for 195 countries and territories, 1990-2017: a systematic analysis for the Global Burden of Disease study 2017. Lancet. (2018) 392:1859–922. doi: 10.1016/S0140-6736(18)32335-3
65. Statistics Bureau Ministry of Internal Affairs Communications. Jinkou suikei 2001–2017 [Population estimates 2001–2017]. Available online at: https://www.stat.go.jp/english/data/jinsui/index.html (accessed July 1, 2020).
66. Ministry of Health Labour Welfare. Chiiki hoken kenkou zoushin jigyo houkoku 2001–2017 [Report on regional public health services and health promotion services 2001–2017]. Available online at: https://www.mhlw.go.jp/english/database/db-hss/rrphshps.html (accessed May 31, 2020).
67. Fujiwara T, Natsume K, Okuyama M, Sato T, Kawachi I. Do home-visit programs for mothers with infants reduce parenting stress and increase social capital in Japan? J Epidemiol Community Health. (2012) 66:1167–76. doi: 10.1136/jech-2011-200793
68. Statistics Bureau Ministry Ministry of Internal Affairs Communications. Roudouryoku chousa 2001–2017 [Labour Force Survey 2001–2017]. Available online at: https://www.stat.go.jp/english/data/roudou/index.html (accessed July 1, 2020).
69. Ministry of Health Labour Welfare. Iryou sisetsu chousa 1999–2017 [Survey of Medical Institutions 1999–2017]. Available online at: https://www.mhlw.go.jp/english/database/db-hss/smi.html (Accessed October 13, 2020).
70. Nohara M. Impact of the Great East Japan Earthquake and tsunami on health, medical care and public health systems in Iwate Prefecture, Japan, 2011. West Pacific Surv. Res. J. (2012) 2:24–30. doi: 10.5365/wpsar.2011.2.4.002
71. Abimbola S, Baatiema L, Bigdeli M. The impacts of decentralization on health system equity, efficiency and resilience: a realist synthesis of the evidence. Health Policy Plan. (2019) 34:605–17. doi: 10.1093/heapol/czz055
72. Osawa E, Ojima T, Akiyama Y, Yamagata Z. National campaign to promote maternal and child health in 21st-century Japan:Healthy Parents and Children 21. J Natl Inst Public Heal. (2019) 68:2–7.
73. Nakahara S, Ichikawa M, Kimura A. Population strategies and high-risk-individual strategies for road safety in Japan. Health Policy. (2011) 100:247–55. doi: 10.1016/j.healthpol.2010.11.003
74. Uehara R, Shinohara R, Akiyama Y, Ichikawa K, Ojima T, Matsuura K, et al. Shichouson ni okeru boshihoken taisaku no torikumi joukyou: “Sukoyaka oyako 21” no suishin joukyou ni kansuru jittai chousa o mochiita todoufuken betsu kansatsu [Implementations of maternal and child health programs of municipalities: prefectural level observations based on progress survey of “Healthy Parents and Children 21”]. Kousei no Shihyou. (2017) 64:1–7.
75. Peterson HM, Flaxman AD. Meta-regression with DisMod-MR: how robust is the model? Lancet. (2013) 381:S110. doi: 10.1016/S0140-6736(13)61364-1
Keywords: efficiency, public health, injuries, child, Japan
Citation: Hashimoto A, Kawaguchi H and Hashimoto H (2022) Contribution of the Technical Efficiency of Public Health Programs to National Trends and Regional Disparities in Unintentional Childhood Injury in Japan. Front. Public Health 10:913875. doi: 10.3389/fpubh.2022.913875
Received: 06 April 2022; Accepted: 21 June 2022;
Published: 12 July 2022.
Edited by:
Ronny Westerman, Bundesinstitut für Bevölkerungsforschung, GermanyReviewed by:
Michio Yuda, Tohoku University, JapanSoonman Kwon, Seoul National University, South Korea
Copyright © 2022 Hashimoto, Kawaguchi and Hashimoto. This is an open-access article distributed under the terms of the Creative Commons Attribution License (CC BY). The use, distribution or reproduction in other forums is permitted, provided the original author(s) and the copyright owner(s) are credited and that the original publication in this journal is cited, in accordance with accepted academic practice. No use, distribution or reproduction is permitted which does not comply with these terms.
*Correspondence: Ayumi Hashimoto, ahashimoto140@gmail.com