 Miguel Alfaro1
 Diego Muñoz-Godoy2Manuel Vargas1
 Guillermo Fuertes1,3*
 Claudia Duran4Rodrigo Ternero1,5Jorge Sabattin6Sebastian Gutierrez7,8Natalia Karstegl2
- 1Departamento de Ingeniería Industrial, Universidad de Santiago de Chile, Santiago, Chile
- 2Facultad de Ingeniería y Tecnología, Universidad San Sebastián, Santiago, Chile
- 3Facultad de Ingeniería, Ciencia y Tecnología, Universidad Bernardo O'Higgins, Santiago, Chile
- 4Departamento de Industria, Facultad de Ingeniería, Universidad Tecnológica Metropolitana, Santiago, Chile
- 5Escuela de Construcción, Universidad de las Américas, Santiago, Chile
- 6Facultad de Ingeniería, Universidad Andres Bello, Santiago, Chile
- 7Facultad de Economía, Gobierno y Comunicaciones, Universidad Central de Chile, Santiago, Chile
- 8Facultad de Ciencias, Universidad Mayor, Chile, Santiago, Chile
Coronavirus disease 2019 (COVID-19) has placed stress on all National Health Systems (NHSs) worldwide. Recent studies on the disease have evaluated different variables, namely, quarantine models, mitigation efforts, damage to mental health, mortality of the population with chronic diseases, diagnosis, use of masks and social distancing, and mortality based on age. This study focused on the four NHSs recognized by the WHO. These systems are as follows: (1) The Beveridge model, (2) the Bismarck model, (3) the National Health Insurance (NHI) model, and (4) the “Out-of-Pocket” model. The study analyzes the response of the health systems to the pandemic by comparing the time in days required to double the number of disease-related deaths. The statistical analysis was limited to 56 countries representing 70% of the global population. Each country was grouped into the health system defined by the WHO. The study compared the median death toll DT, between health systems using Mood's median test method. The results show high variability of the temporal trends in each group; none of the health systems for the three analyzed periods maintain stable interquartile ranges (IQRs). Nevertheless, the results obtained show similar medians between the study groups. The COVID-19 pandemic saturates health systems regardless of their management structures, and the result measured with the time for doubling death rate variable is similar among the four NHSs.
Introduction
Over the last 15 months, coronavirus disease 2019 (COVID-19) has spread from China to the rest of the world. National Health Systems (NHSs) have implemented different strategies to control the disease (1–9) and to reduce the rate of infection and mortality. Different authorities have identified different factors associated with the distinctive dynamic system of the disease, such as, climatic factors (10–14), preexisting disease conditions (15), mental illnesses (16–21), prediction models (22) and (23), social distancing (24), and use of masks (25–28). Currently, the pandemic has more than 130 million confirmed cases worldwide with more than 2,800,000 deaths. America is the continent with the most active cases.
The capacity of NHSs is usually measured by health expenditure, health expenditure per capita (29, 30), and country classifications by income level or World Economic Situation and Prospects (WESP) classifier of the United Nations (31). Comparisons between the different health systems have been made by analyzing different quantitative and qualitative variables. The results allow the study of the performance of NHSs by comparing groups with different health requirements; each national health system creates action plans according to the most recurrent morbidities in its population according to its culture and lifestyle. The COVID pandemic allows us, for the first time, to compare different NHSs under the same global health requirement. The study evaluated the relationship between NHSs and COVID-19 death toll doubling time (DT) to evaluate the performance of different health systems in their response to the pandemic.
There are four types of NHSs. (1) The Beveridge model, which is financed by direct taxes, where the person being treated does not pay for care. In this model, most of the clinics and hospitals are owned by the government, and most of the employees are government employees. This system is implemented in countries such as Great Britain and Spain. (2) The Bismarck model is financed by private health insurance. Employers and employees jointly finance this system through payroll deduction. Medical care is paid for and reimbursed by insurance and health centers, and doctors are generally private. This system is applied in Germany, France, and Japan. (3) The NHI model is financed through payroll and tax deductions. These payments are turned over to the NHI program, which is administered by the government. Private hospitals and doctors provide health services. Some countries only allow the provision of health services to non-profit private foundations to achieve cost containment. This system is applied in countries like Canada and South Korea, among others. The last health system corresponds to the so-called (4) “Out-of-Pocket” system based on the lack of universal health coverage. In this system, the patient must pay for their health expenses. Those with the highest income will take care of themselves, and the poor will continue to be ill or die. This system is applied in Latin America, Africa, Eastern Europe, and Asia (32–34). Each system has its characteristics and different approaches, and they are heterogeneously distributed in different countries.
The study evaluated the relationship between NHSs and COVID-19 death toll DT to evaluate the performance of different health systems in their response to the pandemic.
Materials and Methods
The Four National Health Systems
The Beveridge model was founded in 1948 by William Beveridge. In this system, health coverage is universal; the healthcare system (HCS) is available to all citizens without direct payment, and the government finances it through taxes. The government owns most hospitals and clinics, and the officials are public employees. The state pays the healthcare, managing to regulate prices and to define the quality and costs of healthcare. Private clinics are also financed by the state, which defines the healthcare and the value of each health benefit. The greatest disadvantage of the system is the long waiting times for medical attention. This system is known globally as the National Health Service (NHS).
The Bismarck model was established by the Prussian Chancellor Otto von Bismarck during the German unification in the nineteenth century; this system uses an insurance system called sickness funds. These insurances are jointly financed between employers and employees under payroll discounts. In this case, all members contribute to a defined insurance fund, and this provides defined benefits. Private insurance companies must be non-profit; they exist for self-employed citizens and those who wish to receive elective services that sickness funds do not cover. This model has a multi-payer system, where each country has a different number of insurers to choose from. This system has universal coverage and stringent regulations with the sole objective of reaching the entire population and being a non-profit entity.
The NHI model is based on a universal and unique health insurance system defined in a geographic area and financed by the government through different sources such as taxes and social security contributions. The NHI model maintains strict independence between the universal insurance system provided by the government and the medical providers made up by foundations or private companies. A general benefit contract regulates the benefits. This contract allows (1) to limit an increase in providers, (2) to share the risk of diseases among the entire population, (3) to ensure the universal availability for all citizens, (4) to provide a general regulation for all providers, and (5) to ensure adequate and timely provision of medical services. The fundamental difference between the NHS and the NHI is the separation between universal government insurance and the provision of medical services. In the NHI system, the government negotiates prices and benefits with private companies and foundations; the government delegates the provision of all medical services to independent entities. This HCS has been adopted by the governments of Canada, Taiwan, and South Korea. Finally, the model based on universality does not require advertising expenses, reduces the cost of uncertainty by sharing risk, has no financial incentives for denial of service, does not cause bankruptcies in the population, and generates savings for the population due to its public nature.
The Out-of-Pocket model corresponds to health systems in impoverished and disorganized nations where the provision of medical services is not universal and corresponds to an economic transaction between the citizen and private medical service. Large areas of China, India, and rural Africa do not have adequate medical services for their population. About 40 industrialized countries maintain robust NHSs. The United States has a health system where each citizen can be classified in one of the four NHSs based on their social and economic position.
Methodology
We reviewed the literature study regarding the mortality associated with the COVID-19 disease in different countries; however, the analysis was limited to 56 nations representing 70% of the global population. The countries were classified into one of the four NHS models. The information for classification was obtained from the WHO and the reports associated with each country. The characteristics of these nations are described in Table 1 with a mortality analysis of up to 360 days after the first 10 deaths in each country.
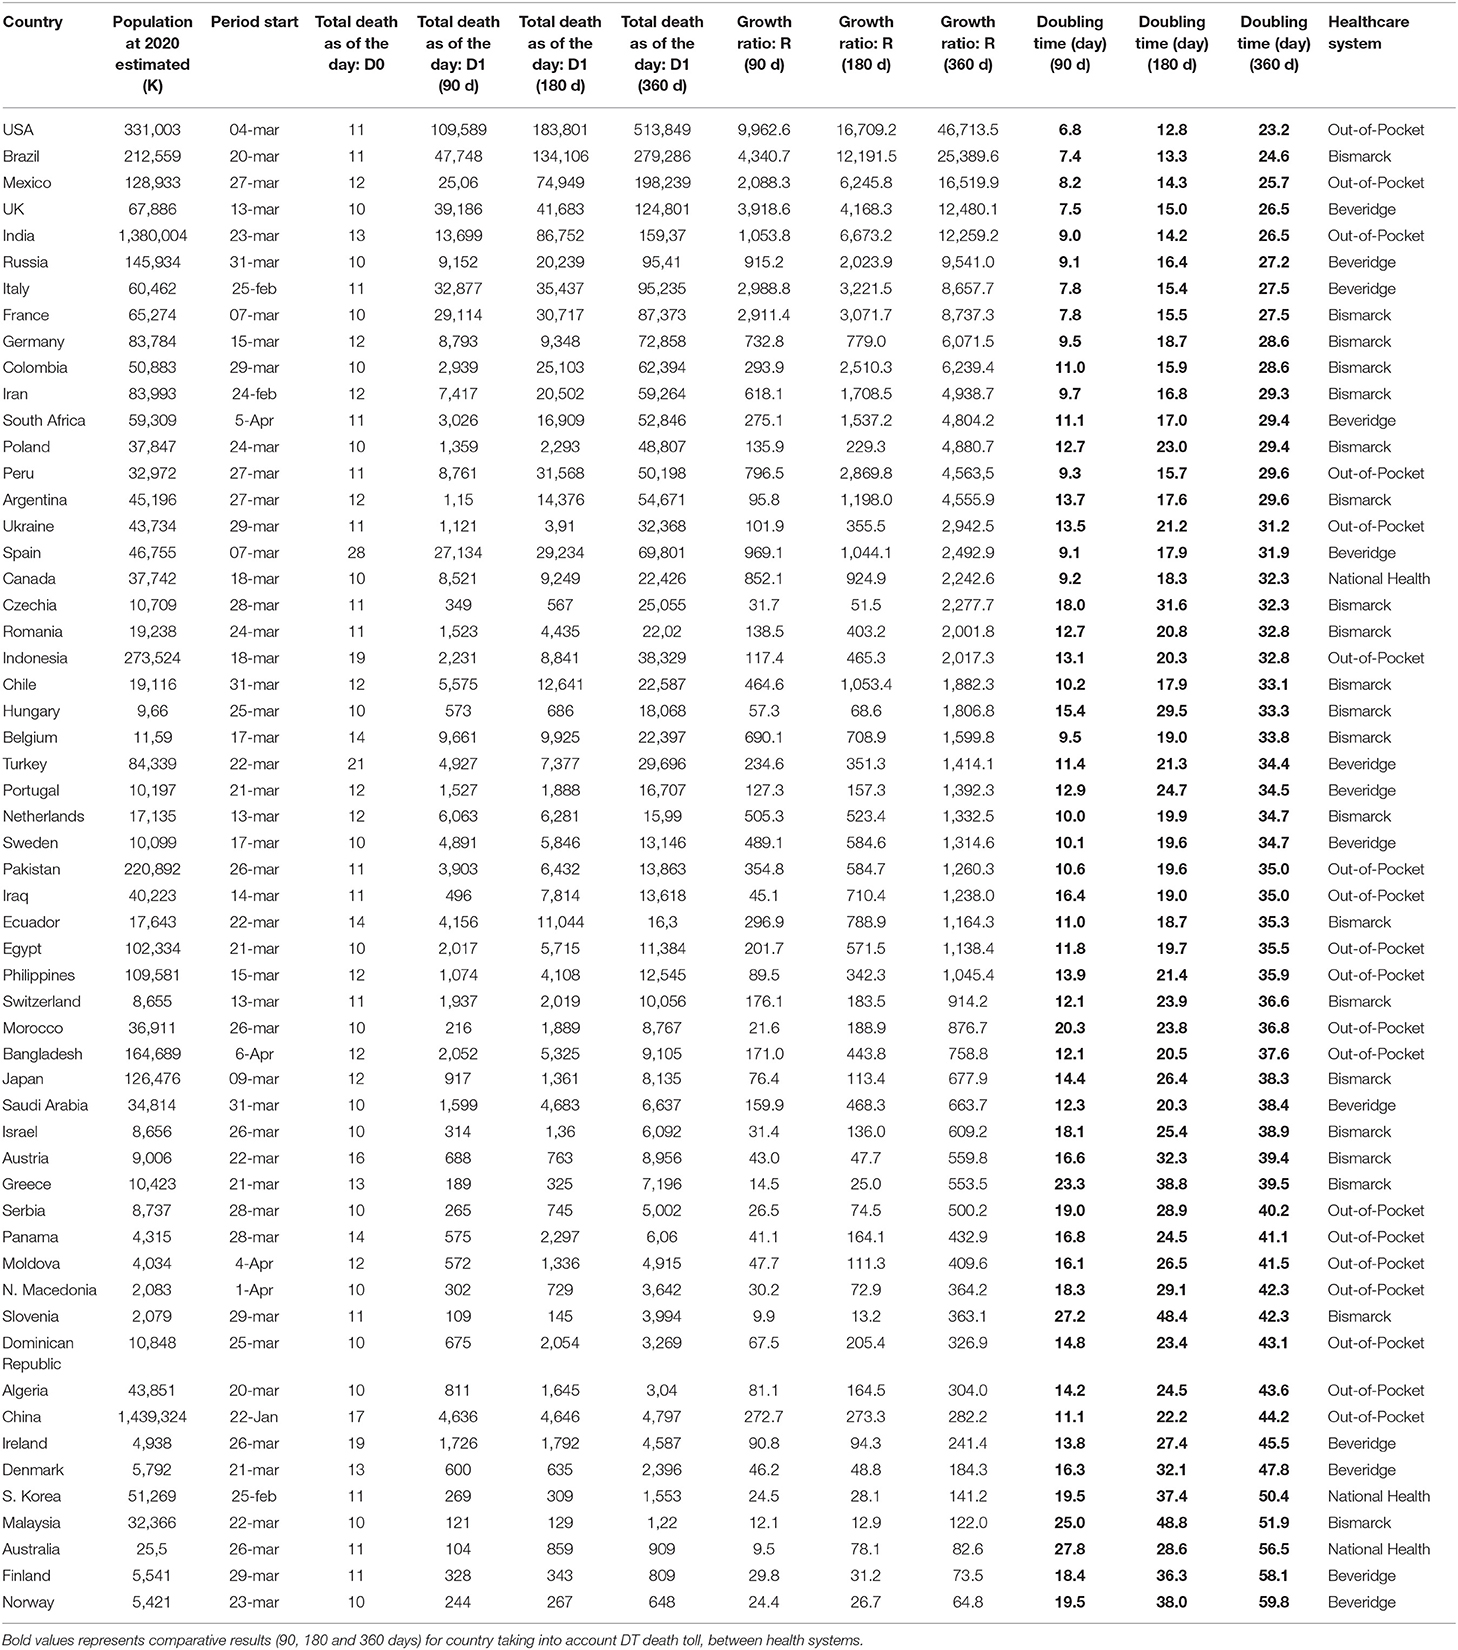
Table 1. DT of the number of deaths by country.
The death toll DT variable is presented in Equation 1. It represents the time in days it takes for the disease to double the number of deaths.
where D0 is the first day with accumulated deaths equal to 10 deaths, and D1 is the day i with n accumulated deaths. The period length (L) corresponds to the time elapsed from the start day (baseline) to the evaluation day. The start day for each country was the date when 10 deaths were accumulated. Three study periods of 90, 180, and 360 days were considered for the study.
Non-parametric tests are used when the data do not meet the assumptions of normality and homoscedasticity. Assuming normality using goodness-of-fit tests must also consider the sample size of data. Statistical tests not adjusted to the sample size resulted in errors of the real distribution and established erroneous conclusions. Normality tests can be performed using the Kolmogorov–Smirnov, Kolmogorov–Smirnov–Lilliefors, Shapiro–Wilk, Anderson–Darling, and Jarque–Bera goodness-of-fit tests. For small sample sizes, the tests with the best non-normality detection power are Kolmogorov–Smirnov–Lilliefors and Anderson–Darling.
We used the Anderson–Darling and Kolmogorov–Smirnov–Lilliefors goodness-of-fit tests for the samples of the COVID-19 death toll DT variable for each health system present in all the countries. The results of the normality goodness-of-fit tests are rejected for the studied samples; therefore, for the analysis of the samples of the COVID-19 death toll DT variable, non-parametric tests were used. The graphs represent the results of the Anderson–Darling goodness-of-fit test for the Bismarck Health System data (Figure 1) and the Anderson–Darling goodness-of-normality test for the general data of countries (Supplementary Figure 1).
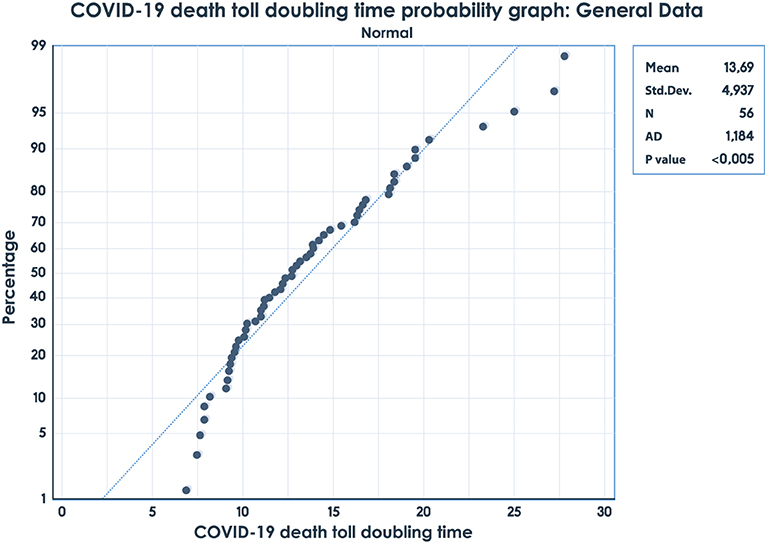
Figure 1. Anderson–Darling goodness-of-fit test for Bismarck Health System data.
The statistical model uses Mood's median test; in this study, we have one categorical factor and a continuous response of the distributions. Using this test, we can determine whether the medians of two or more groups differ. The selected level of significance is set at 0.05. The entire test was performed using the software MatLab.
The research study that proposes the statistical analysis of the comparison of medians of the death toll DT was performed with Mood's technique, using different cutoff dates to see the impact of the pandemic on each health system.
Results
The analysis dates correspond to 90, 180, and 360 days after day 1, with a cumulative number of 10 deaths. For comparative analysis, this study only shows results of 180 and 360 days, the results of 90 days are shown in Supplementary Figure 2. Box charts in Figures 2, 3 show similar medians for each NHS. The two graphs demonstrate the difficulty of establishing COVID-19 trends. When comparing the three time periods which were analyzed, none of the health systems have a clear trend; the IQRs are not stable. Another interesting feature observed in Figures 2, 3 is the absence of outliers. No country has values outside the range of box charts (1.5 IQR).
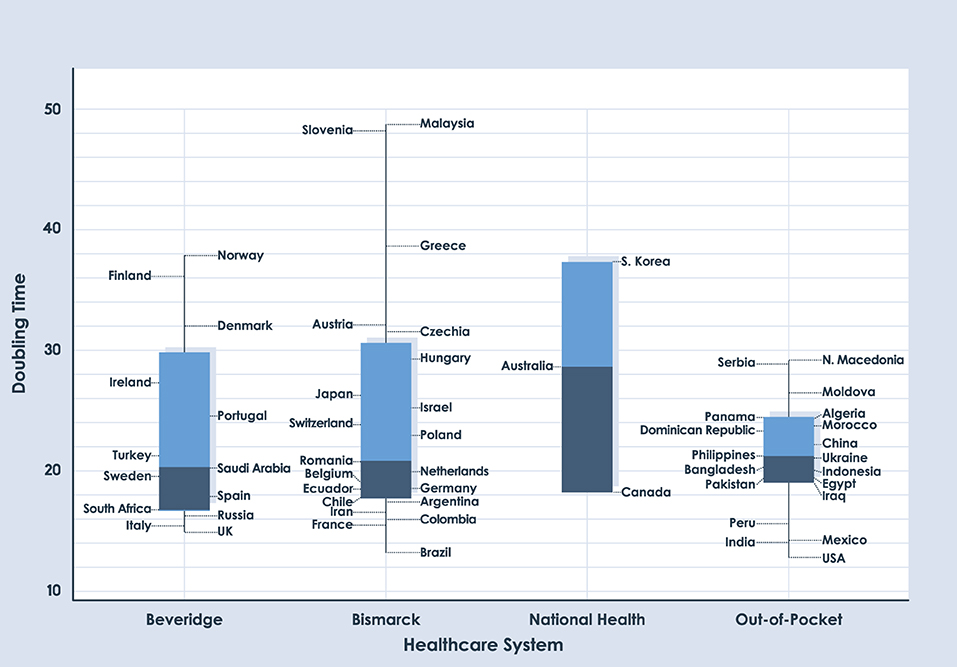
Figure 2. Box plot for DT of deaths with a period length of 180 days.
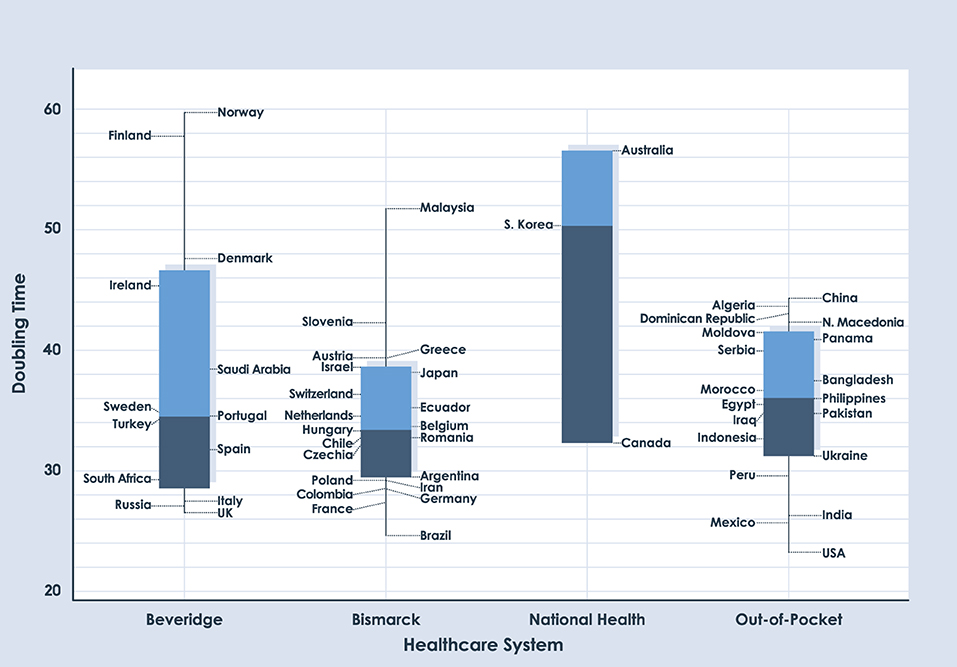
Figure 3. Box plot for DT of deaths with a period length of 360 days.
We used Mood's median test to determine whether there are significant differences in the information for each date of the study. Based on Mood's non-parametric test, the distributions of these four groups were not significantly different when using a significance value of 0.05 (p=0.671 for 90 days, p=0.917 for 180 days, and p = 0.187 for 360 days). As seen in Table 1, the p-value for each date shows the absence of statistical differences between different health systems regarding their capacity to respond to the COVID-19 pandemic. Supplementary Tables 1–3 show the variables analyzed in the study.
Discussion
Health policymakers are concerned about the performance of their NHSs, and many countries have introduced reforms aimed at improving performance. Different authors have established the capacity of a health system according to (1) its structure, (2) the health expenditure concerning the gross domestic product (GDP), (3) some indicators of development of a country, (4) or a combination of the aforementioned variables.
Some research studies consider that increasing resources for NHSs are critical to improving health in developing countries. Still, in most countries, significant progress can be made by using existing resources more efficiently. The efficiency of NHSs depends directly on the organizational structure; this research study classifies countries according to their NHS and compares the results of these classifications regarding health performance in the face of the pandemic. This comparison is made under the variable COVID-19 death toll DT.
The four NHSs compared in this study were as follows: (1) The Beveridge model, (2) the Bismarck model, (3) the NHI model, and (4) the “Out-of-Pocket” model. The classification of each model in different countries has been studied by international organizations such as the WHO.
The tables show eight countries with the highest mortality doubling rates in all ranges (90, 180, and 360 days). Those countries are the USA, Brazil, the UK, Italy, France, Mexico, India, and Russia. In addition, the USA is the country in the study with the highest doubling death rate in the three time ranges.
There is no clear trend based on the health system; in each time period analyzed, the IQRs are not stable. The absence of outliers is observed in the graphs, which is an uncommon phenomenon in box plots. No country has values outside the range of box charts.
The p-values of the different time periods (180 and 360 days) show no significant difference in the COVID-19 death toll DT between the different NHSs. Mood's median test confirms with a p-value of 0.05 that the four NHSs do not have statistical differences of the median.
In the future, the use of this methodology will allow new analyses of NHSs to be carried out against other global health requirements, for example, vaccination against COVID-19, HIV/AIDS, and new emerging diseases.
We used MatLab software to develop this study. The databases of the three study periods of 90, 180, and 360 days and the function code to execute in MatLab are available in the GitHub repository.
Conclusions
The COVID-19 pandemic has been studied from numerous aspects, namely, climatic factors, preexisting disease conditions, mental illnesses, quarantine models, social distancing, age, and use of masks, among others.
This study evaluated the relationship between the NHS and the COVID-19 death toll DT of each country to evaluate their performance during the pandemic.
The study establishes no difference in the performance of the different NHSs during the COVID-19 pandemic. However, multidimensional modeling must be carried out to discover the causes of COVID-19 death toll DT.
Data Availability Statement
The datasets generated for this study can be found in online repositories. The names of the repository/repositories and accession number(s) can be found at: https://github.com/owid/covid-19-data/tree/master/public/data.
Author Contributions
All authors listed have made a substantial, direct and intellectual contribution to the work, and approved it for publication.
Funding
This research has been supported by DICYT (Scientific and Technological Research Bureau) of the University of Santiago of Chile (USACH) and the Department of Industrial Engineering. This research was supported in part by the National Fund for Scientific and Technological Development (FONDECYT, Chile), grant no. 11200993 (MV).
Conflict of Interest
The authors declare that the research was conducted in the absence of any commercial or financial relationships that could be construed as a potential conflict of interest.
Supplementary Material
The Supplementary Material for this article can be found online at: https://www.frontiersin.org/articles/10.3389/fpubh.2021.669038/full#supplementary-material
Supplementary Figure 1. Anderson-Darling goodness-of-fit test for general country data.
Supplementary Figure 2. Box Plot for doubling time of deaths with period length 90 days.
References
1. Peak CM, Kahn R, Grad YH, Childs LM, Li R, Lipsitch M, et al. Individual quarantine versus active monitoring of contacts for the mitigation of COVID-19: a modelling study. Lancet Infect Dis. (2020) 20:1025–33. doi: 10.1016/S1473-3099(20)30361-3
2. Volpert V, Banerjee M, Petrovskii S. On a quarantine model of coronavirus infection and data analysis. Math Model Nat Phenom. (2020) 15:24. doi: 10.1051/mmnp/2020006
3. Wilder-Smith A, Freedman DO. Isolation, quarantine, social distancing and community containment: pivotal role for old-style public health measures in the novel coronavirus (2019-nCoV) outbreak. J Travel Med. (2020) 27:taaa020. doi: 10.1093/jtm/taaa020
4. Yousefpour A, Jahanshahi H, Bekiros S. Optimal policies for control of the novel coronavirus disease (COVID-19) outbreak. Chaos Solitons Fractals. (2020) 136:109883. doi: 10.1016/j.chaos.2020.109883
5. Lau H, Khosrawipour V, Kocbach P, Mikolajczyk A, Schubert J, Bania J, et al. The positive impact of lockdown in Wuhan on containing the COVID-19 outbreak in China. J Travel Med. (2021) 27:1–7. doi: 10.1093/jtm/taaa037
6. Wang J, Liao Y, Wang X, Li Y, Jiang D, He J, et al. Incidence of novel coronavirus (2019-nCoV) infection among people under home quarantine in Shenzhen, China. Travel Med Infect Dis. (2020) 37:101660. doi: 10.1016/j.tmaid.2020.101660
7. Shen M, Peng Z, Guo Y, Rong L, Li Y, Xiao Y, et al. Assessing the effects of metropolitan-wide quarantine on the spread of COVID-19 in public space and households. Int J Infect Dis. (2020) 96:503–5. doi: 10.1016/j.ijid.2020.05.019
8. Mishra BK, Keshri AK, Rao YS, Mishra BK, Mahato B, Ayesha S, et al. COVID-19 created chaos across the globe: three novel quarantine epidemic models. Chaos Solitons Fractals. (2020) 138:109928. doi: 10.1016/j.chaos.2020.109928
9. Zhu W, Li X, Wu Y, Xu C, Li L, Yang J, et al. Community quarantine strategy against coronavirus disease 2019 in Anhui: an evaluation based on trauma center patients. Int J Infect Dis. (2020) 96:417–421. doi: 10.1016/j.ijid.2020.04.016
10. Ma Y, Zhao Y, Liu J, He X, Wang B, Fu S, et al. Effects of temperature variation and humidity on the death of COVID-19 in Wuhan, China. Sci Total Environ. (2020) 724:138226. doi: 10.1016/j.scitotenv.2020.138226
11. Sobral MFF, Duarte GB, da Penha Sobral AIG, Marinho MLM, de Souza Melo A. Association between climate variables and global transmission oF SARS-CoV-2. Sci Total Environ. (2020) 729:138997. doi: 10.1016/j.scitotenv.2020.138997
12. Zoran MA, Savastru RS, Savastru DM, Tautan MN. Assessing the relationship between surface levels of PM2.5 and PM10 particulate matter impact on COVID-19 in Milan, Italy. Sci Total Environ. (2020) 738:139825. doi: 10.1016/j.scitotenv.2020.139825
13. Li H, Xu XL, Dai DW, Huang ZY, Ma Z, Guan YJ. Air pollution and temperature are associated with increased COVID-19 incidence: a time series study. Int J Infect. Dis. (2020) 97:278–282. doi: 10.1016/j.ijid.2020.05.076
14. Domingo JL, Rovira J. Effects of air pollutants on the transmission and severity of respiratory viral infections. Environ Res. (2020) 187:109650. doi: 10.1016/j.envres.2020.109650
15. Kuderer NM, Choueiri TK, Shah DP, Shyr Y, Rubinstein SM, Rivera DR, et al. Clinical impact of COVID-19 on patients with cancer (CCC19): a cohort study. Lancet. (2020) 395:1907–18. doi: 10.1016/S0140-6736(20)31187-9
16. Yuan R, Xu QH, Xia CC, Lou CY, Xie Z, Ge QM, et al. Psychological status of parents of hospitalized children during the COVID-19 epidemic in China. Psychiatry Res. (2020) 288:112953. doi: 10.1016/j.psychres.2020.112953
17. Xu J, Hui Xu Q, ming Wang C, Wang J. Psychological status of surgical staff during the COVID-19 outbreak. Psychiatry Res. (2020) 288:112955. doi: 10.1016/j.psychres.2020.112955
18. Brooks SK, Webster RK, Smith LE, Woodland L, Wessely S, Greenberg N, et al. The psychological impact of quarantine and how to reduce it: rapid review of the evidence. Lancet. (2020) 395:912–20. doi: 10.1016/S0140-6736(20)30460-8
19. Duan L, Zhu G. Psychological interventions for people affected by the COVID-19 epidemic. Lancet Psychiatry. (2020) 7:300–2. doi: 10.1016/S2215-0366(20)30073-0
20. Montemurro N. The emotional impact of COVID-19: from medical staff to common people. Brain Behav Immun. (2020) 87:23–4. doi: 10.1016/j.bbi.2020.03.032
21. Yao H, Chen JH, Xu YF. Rethinking online mental health services in China during the COVID-19 epidemic. Asian J Psychiatr. (2020) 50:102015. doi: 10.1016/j.ajp.2020.102015
22. Fong SJ, Li G, Dey N, Crespo RG, Herrera-Viedma E. Composite Monte Carlo decision making under high uncertainty of novel coronavirus epidemic using hybridized deep learning and fuzzy rule induction. Appl Soft Comput J. (2020) 93:106282. doi: 10.1016/j.asoc.2020.106282
23. Tuli S, Tuli S, Tuli R, Gill SS. Predicting the growth and trend of COVID-19 pandemic using machine learning and cloud computing. Internet Things. (2020) 11:100222. doi: 10.1016/j.iot.2020.100222
24. Liotta G, Marazzi MC, Orlando S, Palombi L. Is social connectedness a risk factor for the spreading of COVID-19 among older adults? The Italian paradox. PLoS ONE. (2020) 15:e0233329. doi: 10.1371/journal.pone.0233329
25. Wu HL, Huang J, Zhang CJP, He Z, Ming WK. Facemask shortage and the novel coronavirus disease (COVID-19) outbreak: reflections on public health measures. EClinicalMedicine. (2020) 21:100329. doi: 10.1016/j.eclinm.2020.100329
26. Das O, Neisiany RE, Capezza AJ, Hedenqvist MS, Försth M, Xu Q, et al. The need for fully bio-based facemasks to counter coronavirus outbreaks: a perspective. Sci Total Environ. (2020) 736:139611. doi: 10.1016/j.scitotenv.2020.139611
27. Cheng VC, Wong SC, Chuang VW, So SY, Chen JH, Sridhar S, et al. The role of community-wide wearing of face mask for control of coronavirus disease, 2019 (COVID-19) epidemic due to SARS-CoV-2. J Infect. (2020) 81:107–14. doi: 10.1016/j.jinf.2020.04.024
28. Amendola L, Saurini MT, Di Girolamo F, Arduini F. A rapid screening method for testing the efficiency of masks in breaking down aerosols. Microchem J. (2020) 157:104–28. doi: 10.1016/j.microc.2020.104928
29. Gerdtham U-G, Löthgren M. New panel results on cointegration of international health expenditure and GDP. Appl Econ. (2010) 34:1679–86. doi: 10.1080/00036840110116397
30. Harding AJE, Pritchard C. UK and twenty comparable countries GDP-expenditure-on-health 1980-2013: The historic and continued low priority of UK health-related expenditure. Int J Heal Policy Manag. (2016) 5:519–23. doi: 10.15171/ijhpm.2016.93
31. Daly M, Boyce C, Wood A. A social rank explanation of how money influences health. Heal Psychol. (2015) 34:222–30. doi: 10.1037/hea0000098
32. Cuadrado C, Crispi F, Libuy M, Marchildon G, Cid C. National Health Insurance: a conceptual framework from conflicting typologies. Health Policy. (2019) 123:621–9. doi: 10.1016/j.healthpol.2019.05.013
33. Tulchinsky TH. Bismarck and the long road to universal health coverage. In: Case Studies in Public Health, United Kingdom. Jerusalem: Academic Press; Elsevier (2018). pp. 131–79.
Keywords: COVID-19, coronavirus, national health systems, death rate, non-parametric test
Citation: Alfaro M, Muñoz-Godoy D, Vargas M, Fuertes G, Duran C, Ternero R, Sabattin J, Gutierrez S and Karstegl N (2021) National Health Systems and COVID-19 Death Toll Doubling Time. Front. Public Health 9:669038. doi: 10.3389/fpubh.2021.669038
Received: 17 February 2021; Accepted: 07 June 2021;
Published: 15 July 2021.
Edited by:
Samer A. Kharroubi, American University of Beirut, LebanonReviewed by:
Ralitsa Raycheva, Plovdiv Medical University, BulgariaRuchi Tiwari, Pranveer Singh Institute of Technology PSIT, India
Copyright © 2021 Alfaro, Muñoz-Godoy, Vargas, Fuertes, Duran, Ternero, Sabattin, Gutierrez and Karstegl. This is an open-access article distributed under the terms of the Creative Commons Attribution License (CC BY). The use, distribution or reproduction in other forums is permitted, provided the original author(s) and the copyright owner(s) are credited and that the original publication in this journal is cited, in accordance with accepted academic practice. No use, distribution or reproduction is permitted which does not comply with these terms.
*Correspondence: Guillermo Fuertes, guillermo.fuertes@usach.cl