 Shivang Mishra1*
 Anurag Kumar Singh1*
 Sumit Rajotiya1
 Pratima Singh2
 Preeti Raj1
 Hemant Bareth1
 Mahaveer Singh3*
 Tushar Jagawat4
 Deepak Nathiya1,5,6*Balvir Singh Tomar5,6,7
- 1Department of Pharmacy Practice, Institute of Pharmacy, Nims University Rajasthan, Jaipur, India
- 2School of Public Health, University of Alberta, Edmonton, AB, Canada
- 3Department of Endocrinology, National Institute of Medical Sciences, Nims University Rajasthan, Jaipur, India
- 4Department of Psychiatry, National Institute of Medical Sciences, Nims University Rajasthan, Jaipur, India
- 5Department of Clinical Studies, Fourth Hospital of Yulin (Xingyuan), Yulin, Shaanxi, China
- 6Department of Clinical Sciences, Shenmu Hospital, Shenmu, Shaanxi, China
- 7Institute of Pediatric Gastroenterology and Hepatology, Nims University Rajasthan, Jaipur, India
Background: Data on the correlation between glycemic variability and depression in nondiabetic patients remain limited. Considering the link between increased glycemic variability and cardiovascular risks, this relationship could be significant in depressed patients.
Methods: In this single-center pilot study, we utilized Flash Glucose Monitoring (Abbott Libre Pro) to study glycemic variability. The CES-D (Center for Epidemiological Studies– Depression) scale was employed to measure depression levels. Based on CES-D scores, patients were classified into two groups: those with scores ≥ 33 and those with scores < 33. We analyzed various glycemic variability indices, including HBGI, CONGA, ADDR, MAGE, MAG, LI, and J-Index, employing the EasyGV version 9.0 software. SPSS (version 28) facilitated the data analysis.
Results: We screened patients with depression visiting the department of psychiatry, FGM was inserted in eligible patients of both the groups which yielded a data of 196 patient-days (98 patient-days for CES-D ≥ 33 and 98 patient-days for CES-D < 33). The glycemic variability indices CONGA (mg/dl), (76.48 ± 11.9 vs. 65.08 ± 7.12) (p = 0.048), MAGE (mg/dl) (262.50 ± 25.65 vs. 227.54 ± 17.72) (p = 0.012), MODD (mg/dl) (18.59 ± 2.77 vs. 13.14 ± 2.39) (p = 0.002), MAG(mg/dl) (92.07 ± 6.24vs. 63.86 ± 9.38) (p = <0.001) were found to be significantly higher in the CES-D ≥ 33 group.
Conclusion: Patients with more severe depressive symptoms, as suggested by CES-D ≥ 33, had higher glycemic variability.
1. Introduction
Diabetes mellitus, a global health issue, stands as one of the prevalent non-communicable diseases impacting millions worldwide. Beyond the well-researched complications of neuropathy, nephropathy, retinopathy, and cardiovascular sequelae, there emerges a significant shadow of psychological morbidity, most profoundly depression. This complex relationship is substantiated by recent meta-analyses, such as those conducted by Mezuk et al. (1) and Chireh et al. (2), which indicate that diabetes increases the risk of developing depression by approximately 25% (1, 2). The relationship between diabetes and depression is bidirectional. Diabetes can elevate the risk of developing depression, and similarly, depression can predispose one to diabetes. When they coexist in an individual, it’s not just a simple overlap. This confluence exacerbates the progression and complicates the outcomes of both disorders.
Depression, characterized by pervasive mood disturbances, underpins profound implications for metabolic health, particularly glycemic control. A confluence of pathophysiological mechanisms including inflammation, neuroendocrine dysfunction, and alterations in insulin dynamics have been implicated in mediating this association (3). Longitudinal studies further emphasize the chronic impact of depression on glycemic variability (GV), a parameter depicting fluctuations in blood glucose levels that has been linked to microvascular complications and oxidative stress (4).
However, the majority of these studies are conducted in diabetic populations and rely on traditional glucose monitoring systems, which may not accurately capture the day to day spectrum of GV. Recent innovations like the FreeStyle Libre flash glucose monitoring system offer a more nuanced window into these fluctuations, yet there is a paucity of research exploring the depression-GV nexus in non-diabetic individuals using this technology. Observational studies have highlighted the potential connections, but more targeted research is needed (5).
The objective of this research is to fill this research gap through a pilot study examining the relationship between depression severity and GV in non-diabetic individuals, employing the advanced FreeStyle Libre system. This cross-sectional GlyDep Pilot Study seeks to extend the current understanding of this complex interplay by focusing on a population often overlooked in conventional research. By shedding light on the mechanisms at play in non-diabetic individuals, the findings may pave the way for early interventions and personalized therapeutic strategies that account for both mental and metabolic health. By engaging with cutting-edge technology and a novel demographic, this study endeavors to contribute a fresh perspective to the ongoing discourse surrounding depression, GV, and their broader implications for public health (6).
2. Methodology
The present study was conducted in compliance with the ethical principles of the Declaration of Helsinki, and approval for the study was obtained from the Institutional Review Board (approval number: NIMSUR/IEC/2022/211). All study subjects provided informed consent for this observational analysis.
2.1. Design and participants
The present study, called GlyDep, is a primary quantitative exploratory research project aimed at analyzing glycemic variability (GV) in individuals with depressive disorder. Recruitment of participants, aged 18 years and older, diagnosed with depression (ICD-10) was conducted at the Department of Psychiatry, National Institute of Medical Science and Research in Jaipur, India, from April 2022 to November 2022. Diagnosis of incident depression was based on ICD-10 codes F32 (all mild to severe depressive episodes) or F33 (all recurrent depressive disorders) with cognitive behavioral therapy for management of diabetes (7). The study utilized a set of inclusion and exclusion criteria. Inclusion criteria consisted of a proven diagnosis of depression, glycated hemoglobin indices A1c (HbA1c) levels <5.6%, and willingness to give consent for the study. Patients were excluded if they did not meet the clinical diagnosis according to ICD-10, had unstable severe medical conditions such as active malignant diseases, heart failure, or chronic liver diseases, were below 18 years of age, or had HbA1c levels above 5.6%.
2.2. Data collection and recruitment of the study population
2.2.1. Demographic factors
Customized data collection forms were designed and used to collect the study data. Participants’ age, gender, marital status, smoking habits, and educational status were documented in the data collection forms. Weight and height were measured as per protocol and the body mass index (BMI) was calculated. The criteria established by the World Health Organization for overweight (23.0 kg/m2) and obesity (25.0 kg/m2) were used to determine BMI status (8). Body composition was assessed with waist and hip measurements, which was obtained from standard measuring tape. Waist-to-hip ratio (WHR) was calculated by dividing the waist circumference by the hip circumference (9).
2.2.2. Laboratory parameters
The participants lipid profile was assessed, including Low-Density Lipoprotein (LDL), High-Density Lipoprotein (HDL), and Triglycerides (TG), following the guidelines of the American Heart Association (AHA) (10). Additionally, Blood Urea Nitrogen (BUN), Serum Creatinine (SCr), Aspartate Aminotransferase (AST), and Alanine Transaminase (ALT) levels were measured. These particular measurements are integral for monitoring kidney function and liver health, ensuring a comprehensive evaluation of the participants’ overall metabolic health.
2.2.3. Glucose assessment
2.2.3.1. HbA1c measurement
HbA1c serves as a sensitive indicator of long-term glycemic control, reflecting average blood glucose levels over a period of approximately 2 to 3 months. In this study, HbA1c levels were measured via high-performance liquid chromatography (HPLC) of hemolysates from whole blood (<5.6%) which is a reliable and gold standard technique for HbA1C determination. Glucose levels in fasting serum samples were assessed using glucose oxidase peroxidase and a Siemens Dimension EXL 200 analyzer.
2.2.3.2. Flash glucose monitoring (Freestyle libre Pro)
In this study, the ambulatory glucose profile was calculated using interstitial sensor glucose data obtained from the Freestyle Libre Pro system (Abbott Diabetes Care, Oxon, UK). The system comprised a sensor worn by patients for 2 weeks, which tested interstitial glucose levels at 15-min intervals (11). All study participants were instructed to wear the sensor for the entire two-week period, resulting in a total of 196 patient-days.
Glycemic variability indices, such as mean sensor glucose and its standard deviation (SD), absolute means of daily differences (MODD), continuous overall net glycemic action (CONGA), mean amplitude of glycemic excursion (MAGE), high blood glucose index (HBGI), mean absolute glucose (MAG), liability index (LI), average daily risk ratio (ADRR), and J-Index were among the glycemic variability indices. EasyGV version 9.0 software (University of Oxford, OX2 6GG, United Kingdom) was utilized to compute the above indices using the data collected for 196 patient-days (Review Supplementary Table 1) (12–17).
2.2.4. Measures for depressive symptoms (CES-D)
The Center for Epidemiological Research Depression Scale (CES-D) was devised by the National Institute of Mental Health in the 1970s. Its primary intent was to assess depressive symptomatology in the general population, bridging the gap between clinical diagnosis and population-based assessment. Over the years, it has been adapted for various subpopulations and has become one of the widely accepted tools for screening depression symptoms in epidemiological studies.
Compared to other depression scales, CES-D uniquely incorporates a range of symptoms, capturing diverse domains such as mood, somatic complaints, and interpersonal interactions. This holistic approach ensures a comprehensive understanding of an individual’s depressive state. The Center for Epidemiological Research Depression Scale (CES-D) was employed to screen for depression symptoms under the guidance of a designated psychiatrist (18) The CES-D contains 20 items commonly used in screening for depression and depressive symptoms. The CES-D response options were based on recent symptoms and a 4-point Likert scale ranging from “rarely or none of the time” to “most or all of the time.” The scale goes from 0 to 60, with a higher score indicating more significant depressive symptoms (19).
Cronbach’s alpha was 0.85 in reliability testing (20). Furthermore, significant correlations with other depression measurement scales were observed, supporting the convergent validity of the CES-D, and construct validity was established by differences between psychiatric inpatients and the general population (19).
2.3. Statistical analysis
We used IBM SPSS version 28.0 from Chicago, IL, United States for our statistical analysis. We summarized continuous variables with mean and standard deviation, while categorical variables were presented as frequency and percentage. To compare differences between groups, we used t-tests for continuous variables and Fisher’s exact test for categorical variables. Acknowledging our cautious approach toward our small sample’s uniqueness and potential data non-normality, we found non-parametric statistical methods to be necessary. Since finding non-diabetic participants posed challenges, we explored alternative methods. Non-parametric tests, known for their reliability with limited data, became suitable choices. We emphasize awareness of assumptions and limitations in both parametric and non-parametric analyses. Furthermore, Microsoft Excel 2015 facilitated data visualization.
3. Results
3.1. Study population
At the psychiatry outpatient department of NIMS hospital, we screened 62 patients for our study. Out of 62 patients with depression, thirty-one patients were found to be eligible for the study. Out of thirty-one, thirteen patients were excluded from the study. The reasons for the exclusion were as follows: (1) difficulty in interviewing patients due to aggressive or irregular behavior (n = 3); (2) refusal to use FGMS (n = 6); (3) refusal to participate in the study (n = 4). Finally, eighteen patients were enrolled, with a loss of follow-up (n = 4). The study flow chart is shown in Figure 1.
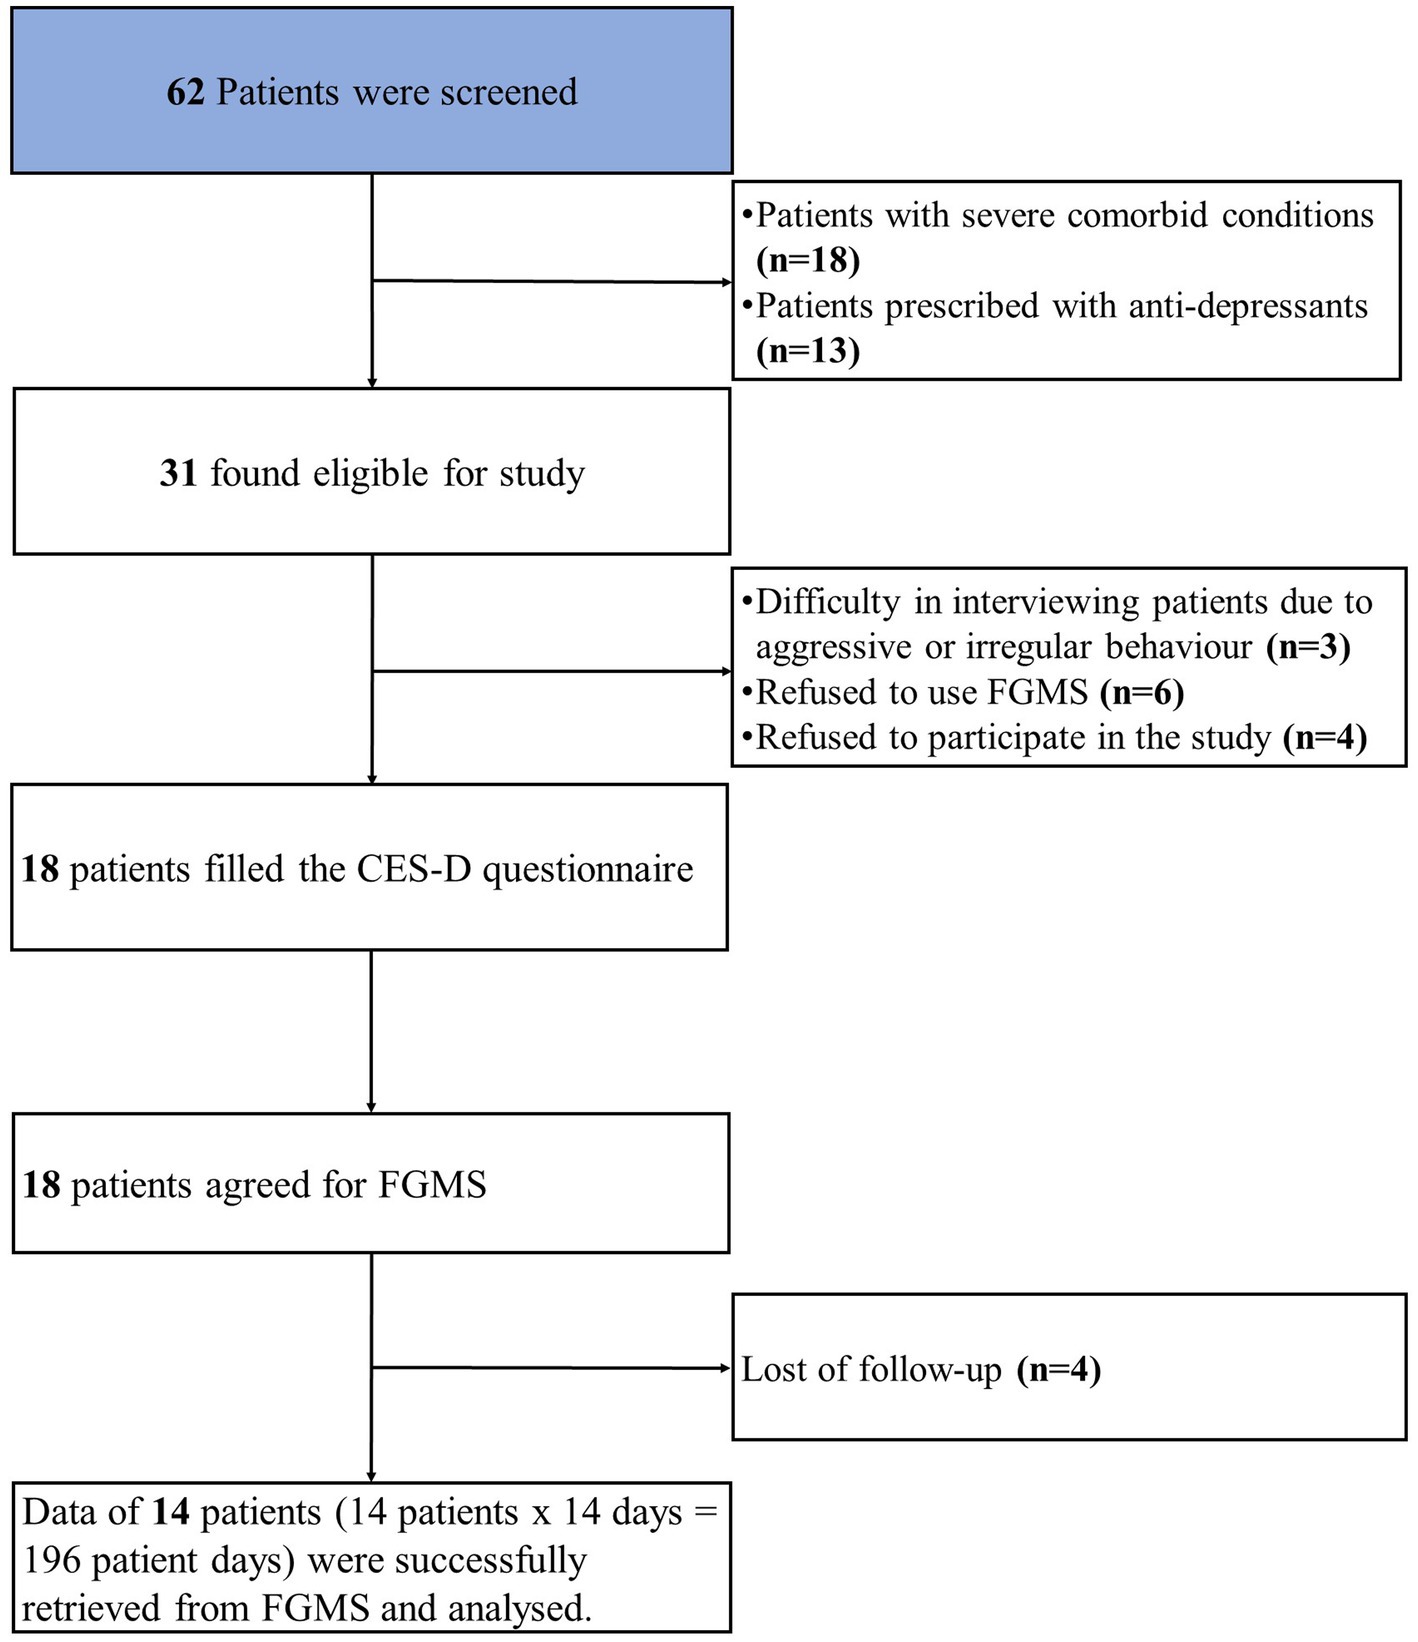
Figure 1. Study flow chart showing enrollment and exclusion of the study subjects.
The study included 14 participants with a total of 196 patient-days. Of 14 participants 10 were males and 4 were females with an average age of 29.53 ± 1.77 years. We made two groups depicting the severity of depression: CES-D scores≥33 (6 males, 1 female) and < 33 (4 males, 3 females). The overall CES-D score was 33.46 ± 7.32 (range: 0–60), 39.71 ± 3.81 for the CES-D ≥ 33 group, and 27.00 ± 2.70 for the CES-D < 33 group. The comparison of the data of patients who had CES-D > 33 to those who had CES-D < 33 is shown in Table 1. Age and HbA1C were significantly higher in the patients with CES-D ≥ 33 (Table 1).
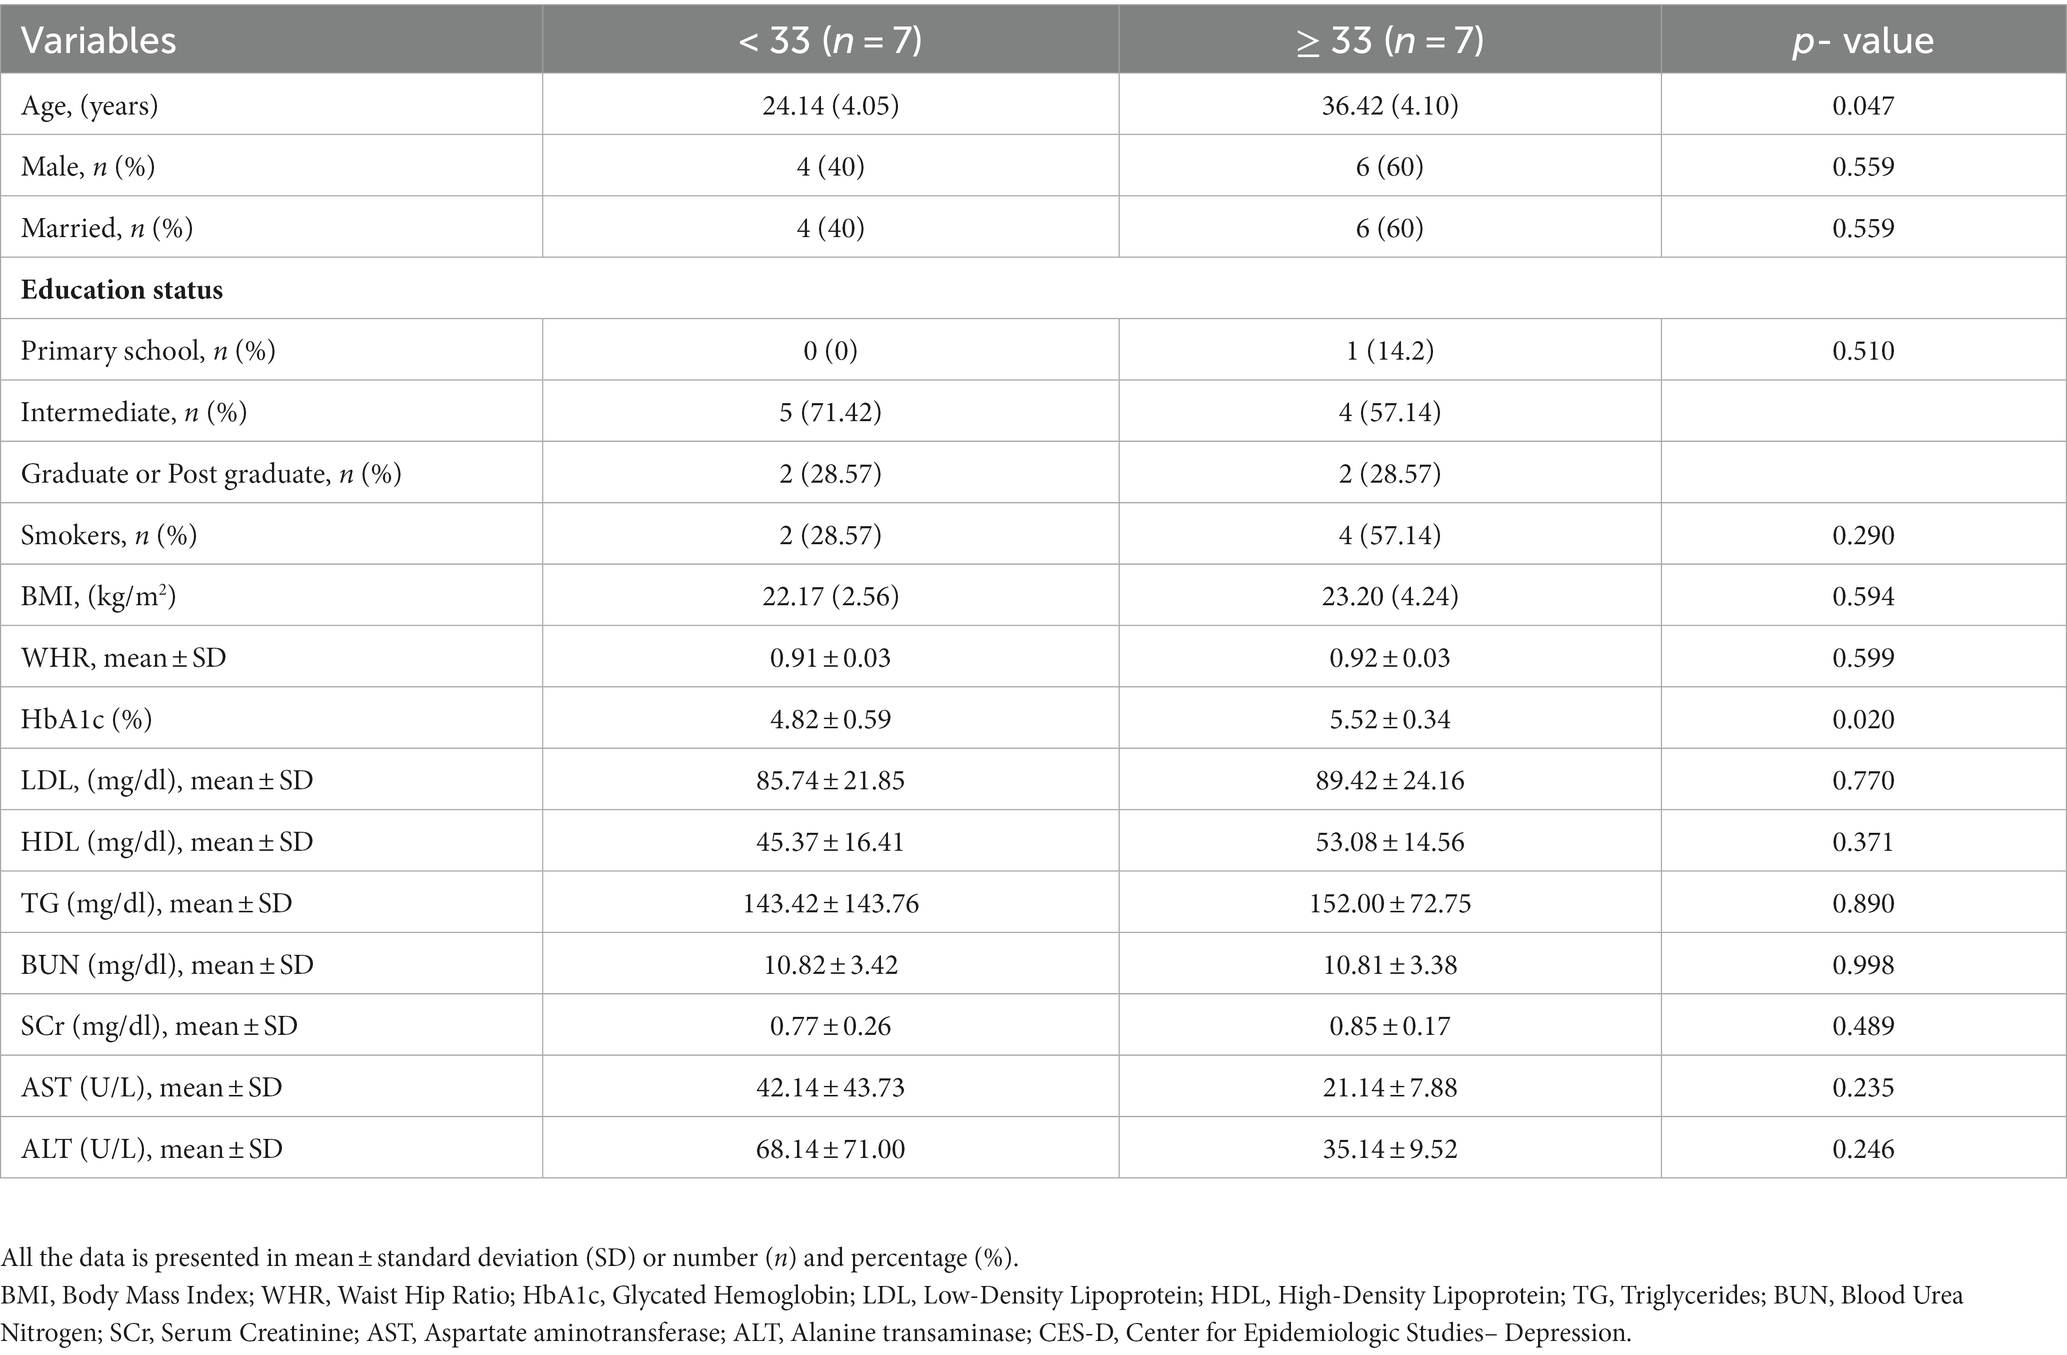
Table 1. Baseline comparison of the patients as per the CES-D score, a score used to depict the severity of depression.
3.2. Distribution of glycemic variability indices
Supplementary Table 2 shows an explanatory version of the measures of glycemic variability, along with their mean and standard deviations. The standard deviation of the blood glucose, a marker of glycemic variability, was higher in CES-D ≥ 33 group (Figures 2A,B).
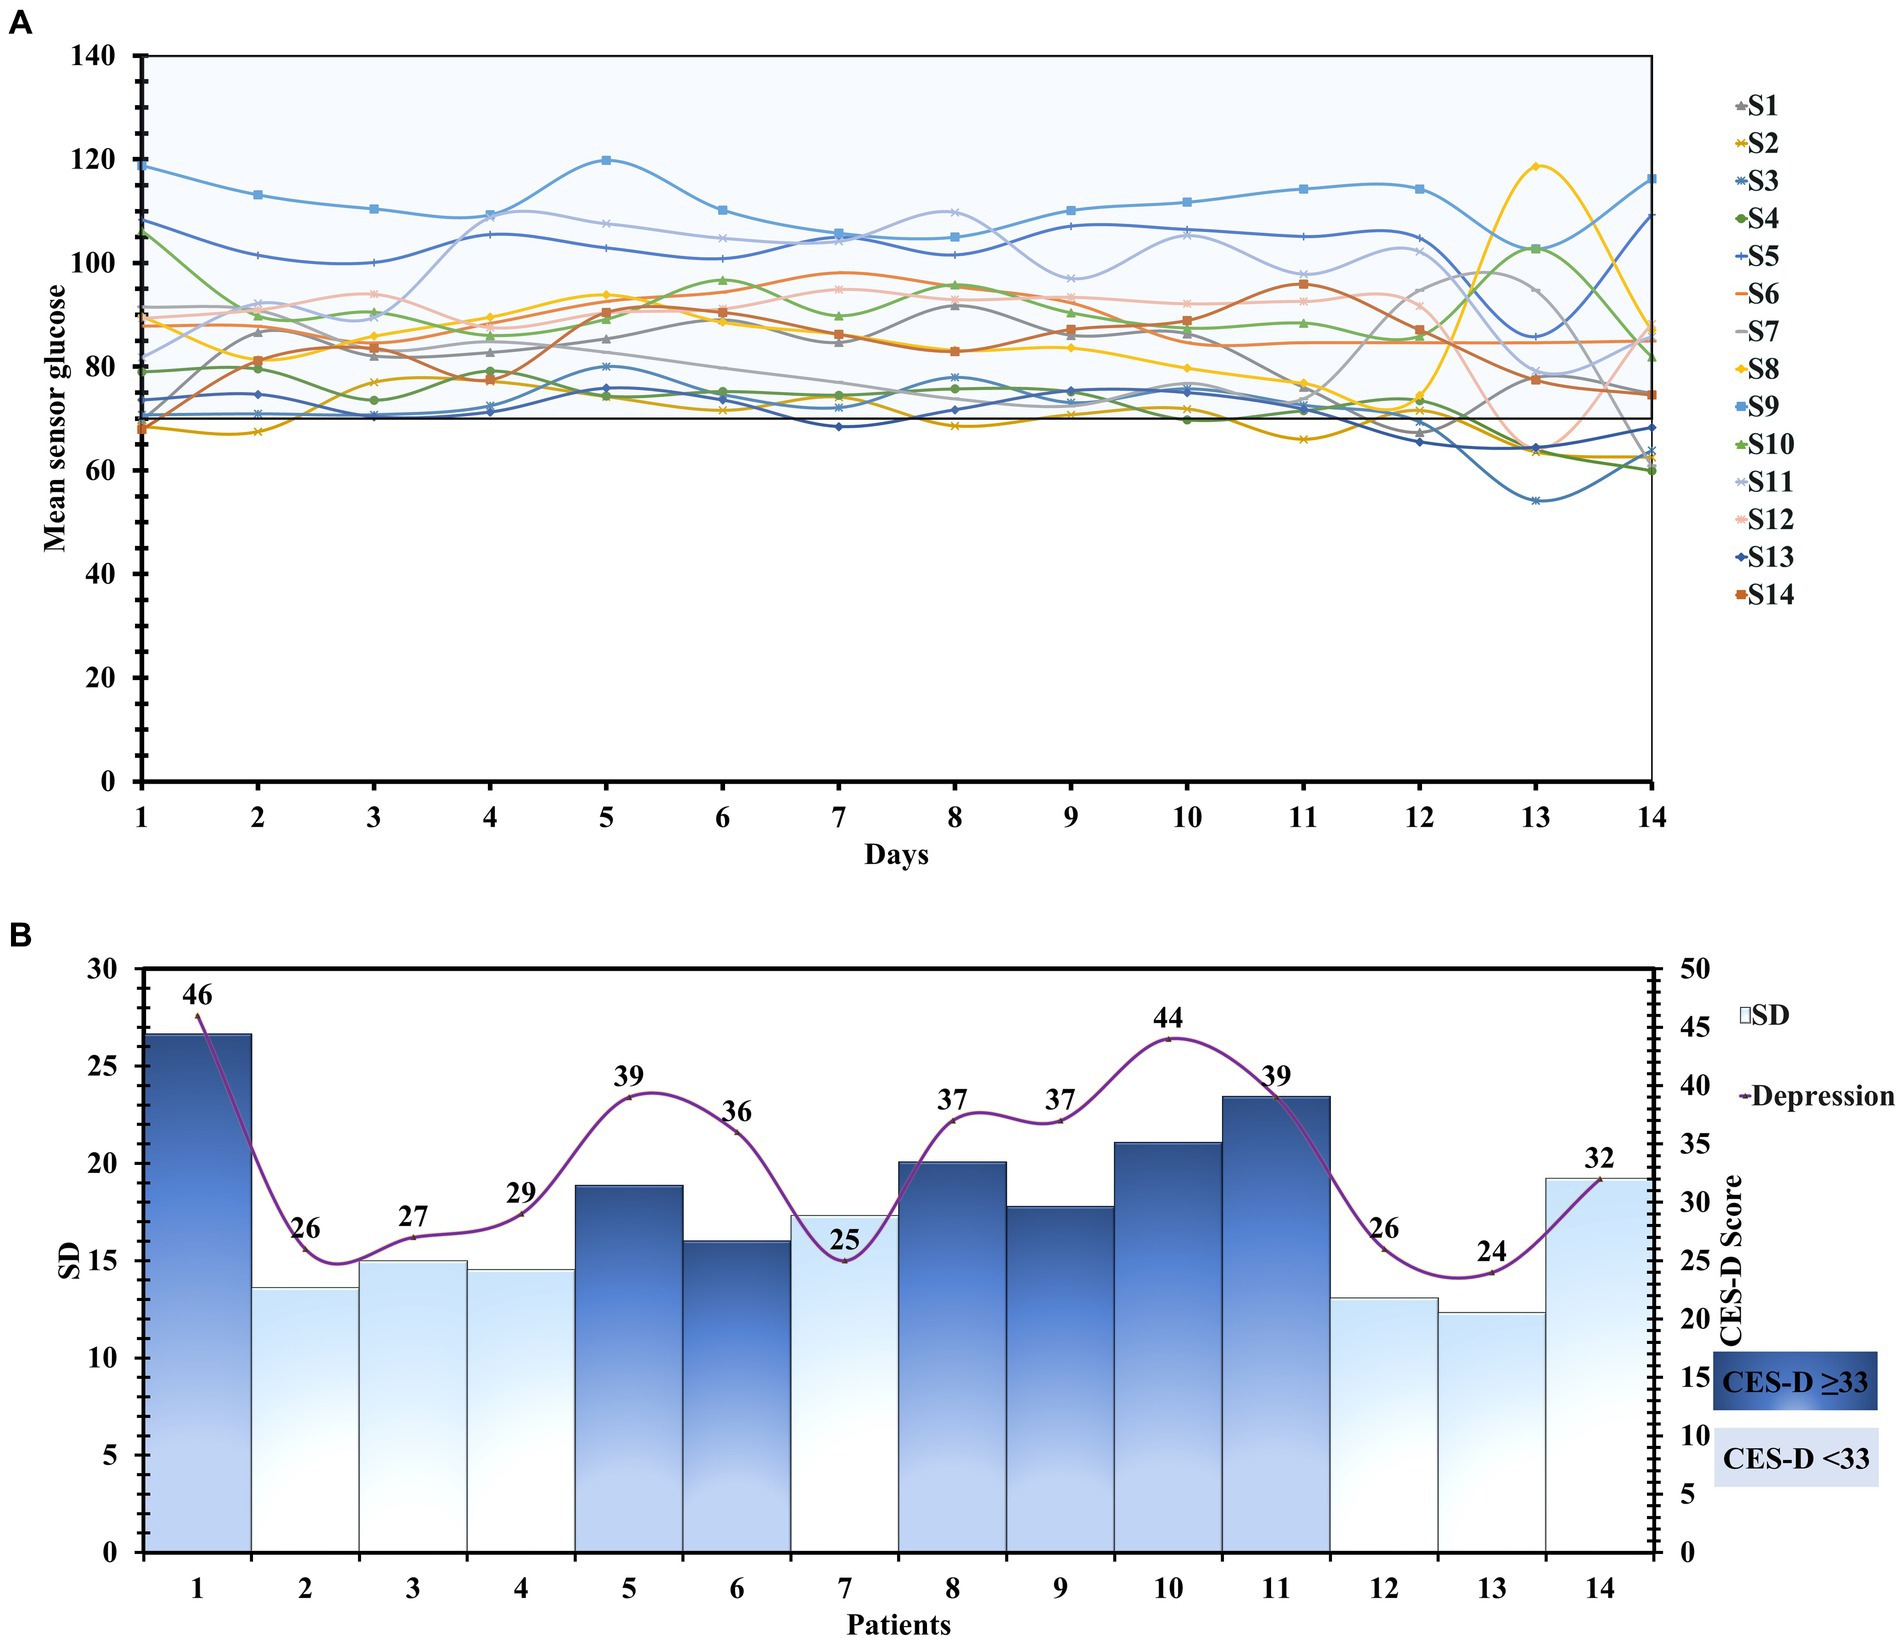
Figure 2. (A) Detailed day-wise tracing of the sensor glucose values of 196 patient-days. (B) The Mean glucose level and Standard deviation of all the patients with their CES-D scores.
3.3. Glycemic variability and depression
We compared the glycemic variability indices of the patients who had CES-D ≥ 33 to those who had CES-D < 33. The HbA1c was higher in the patients who had CES-D ≥ 33 (5.52 ± 0.34 vs. 4.82 ± 0.59) (p = 0.020) (Table 1).
CONGA (mg/dl) was higher in CES-D ≥ 33 group (76.48 ± 11.9 mg/dL vs. 65.08 ± 7.12 mg/dL) (p = 0.048) (Figure 3A). Likewise, HBGI (mg/dl) and MAGE (mg/dl) values were also higher (50.41 ± 5.21 vs. 36.89 ± 4.09) (p = <0.001), (262.50 ± 25.65 vs. 227.54 ± 17.72) (p = 0.012) respectively (Figures 3B,C) Other glycemic variability indices like J-Index (mg/dl) (4296.49 ± 777.98 vs. 2822.79 ± 526.53) (p = 0.001), MODD (mg/dl) (18.59 ± 2.77 vs. 13.14 ± 2.39) (p = 0.002), LI(mg/dl) (766.74 ± 266.28vs. 384.41 ± 72.98) (p = 0.003), ADDR (mg/dl) (384.14 ± 15.43 vs. 332.71 ± 17.21) (p = <0.001) and MAG(mg/dl) (92.07 ± 6.24vs. 63.86 ± 9.38) (p = <0.001) were also found to be significantly higher in the CES-D ≥ 33 group (Figures 3D–H). These findings show that glycemic variability was higher in patients with a CES-D score ≥ 33.
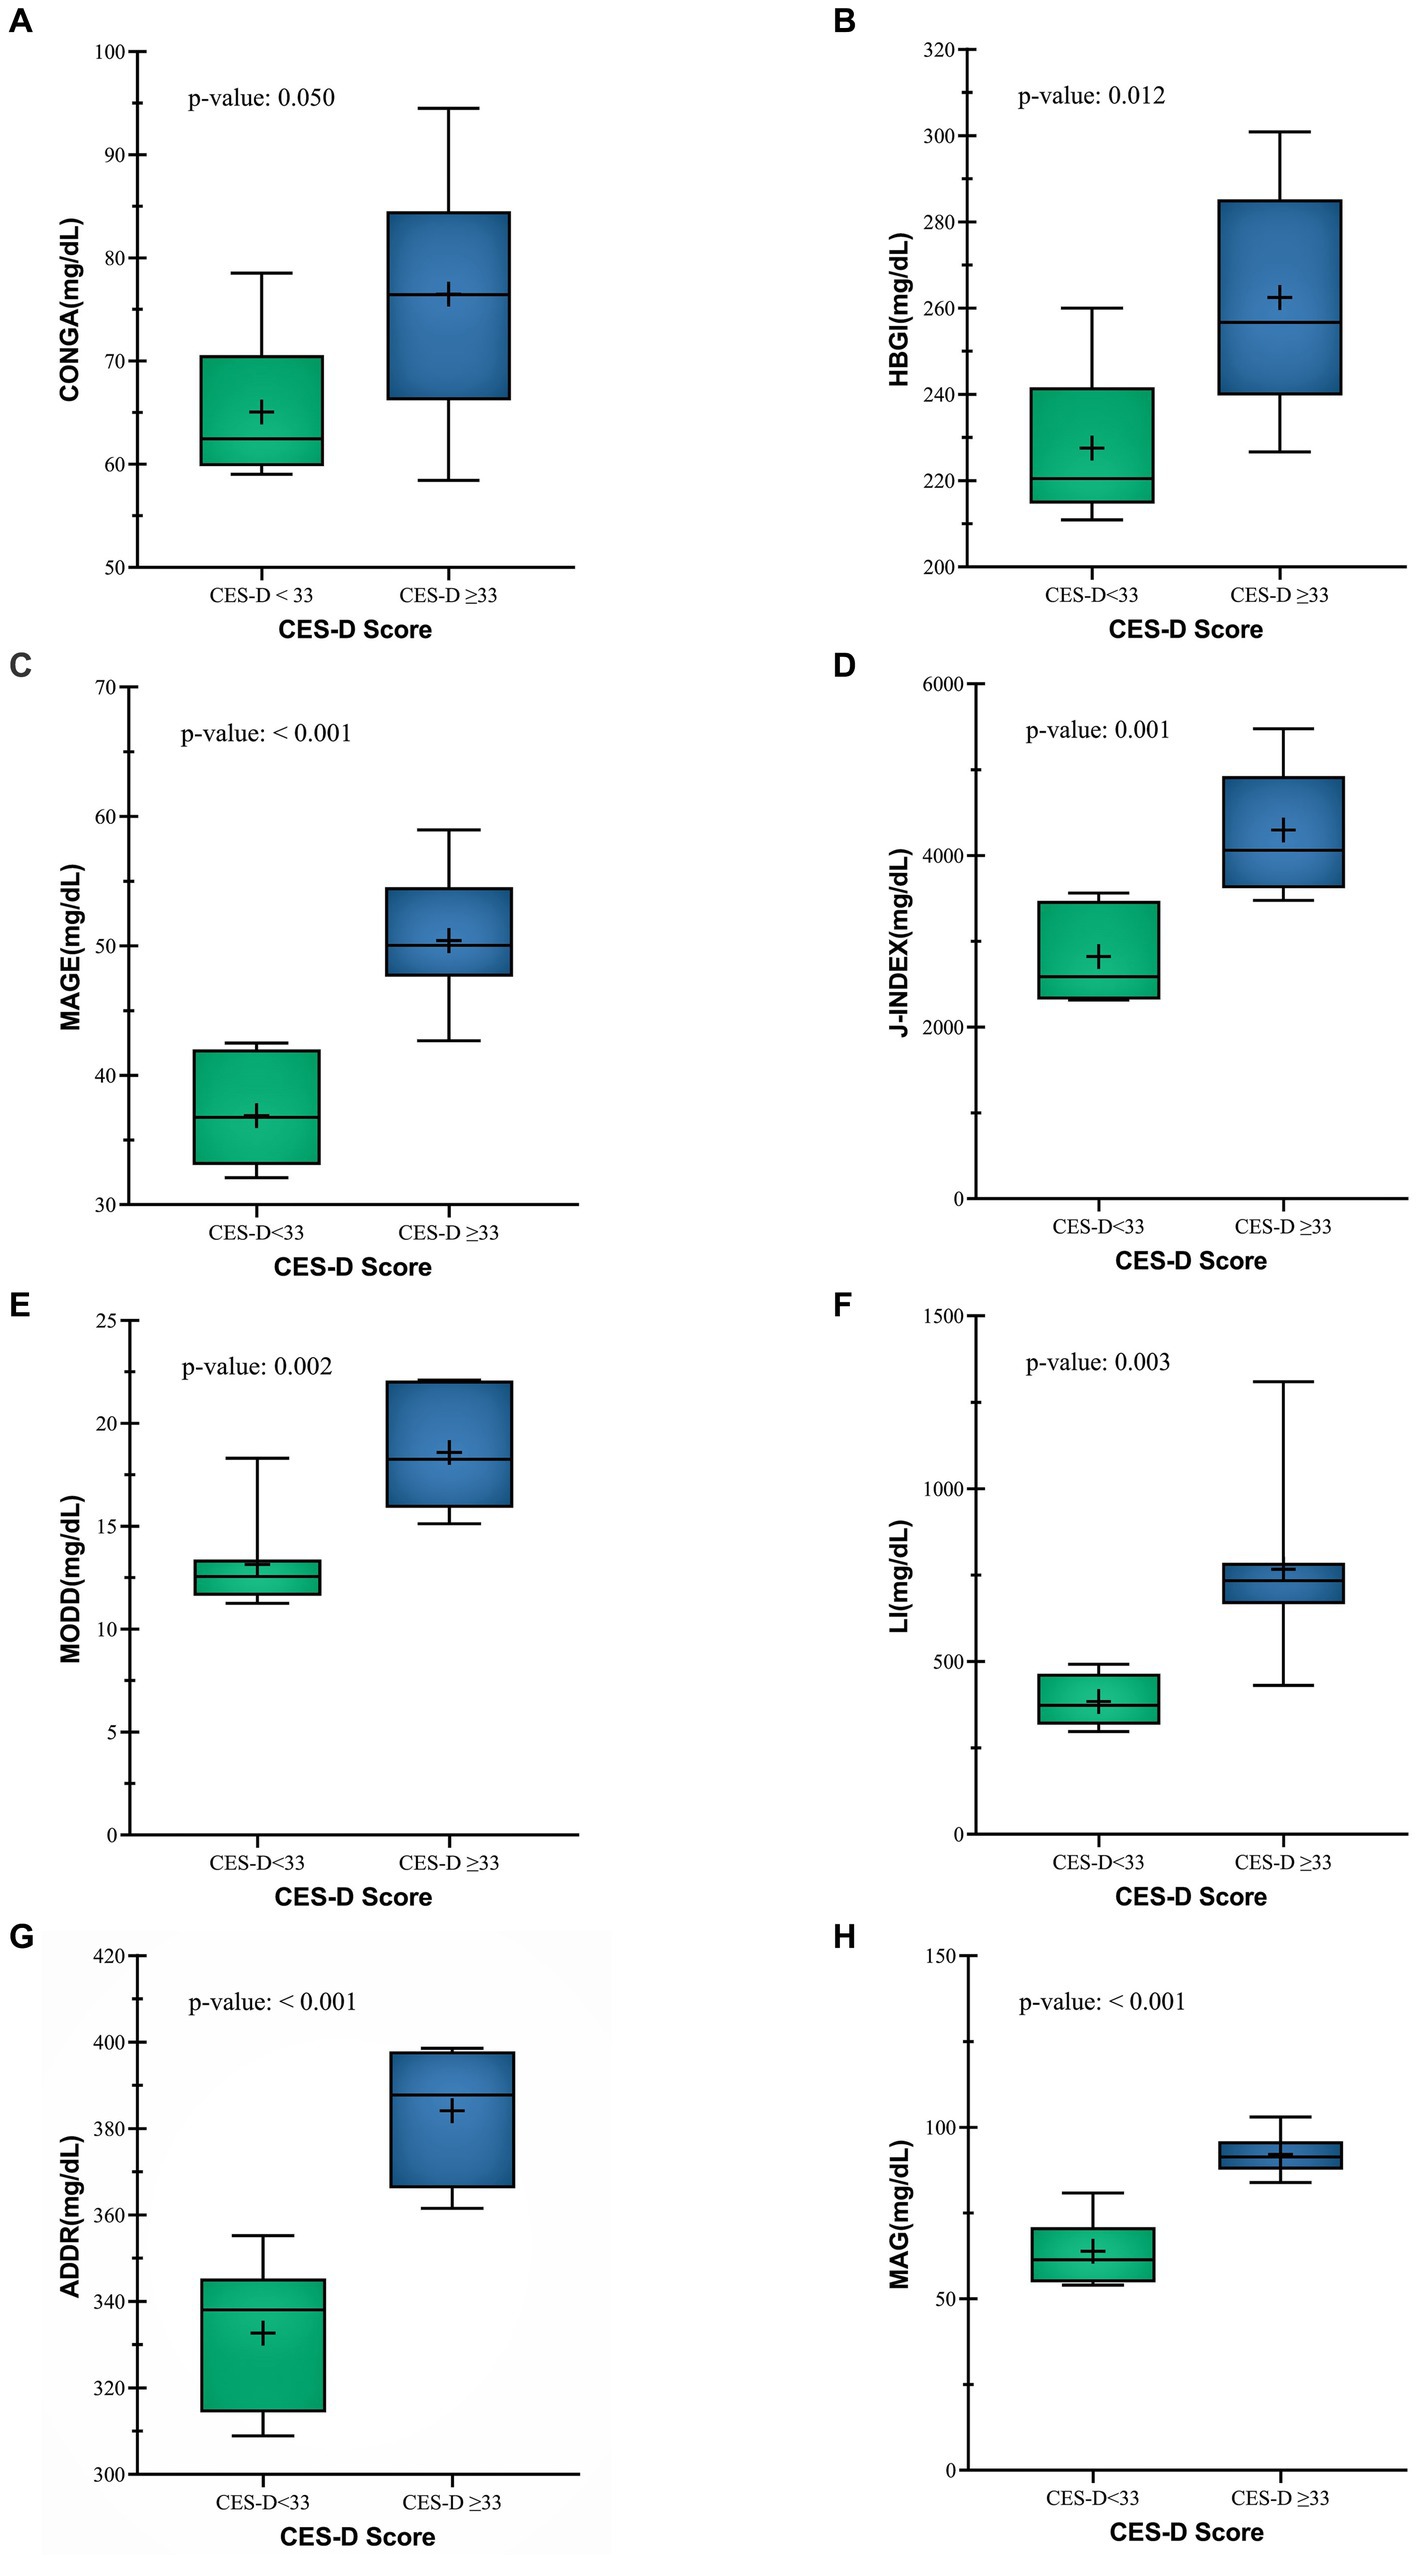
Figure 3. Comparison between Glycemic variability indices (A) CONGA (B) HBGI (C) MAGE (D) J-INDEX (E) MODD (F) LI (G) ADDR (H) MAG of both CES-D groups.
4. Discussion
This research endeavors to fill the void of understanding concerning glycemic variability in non-diabetic patients with depression. To assess the patients’ glycemic variability, the FGMS was utilized for a period of 2 weeks, which generated an ambulatory glucose profile of 196 patient-days. The glycemic indices were calculated via the utilization of EasyGV version 9.0 software. Depression was assessed using the CES-D scale, which has been validated in the Indian population. Patients were assigned to two groups based on their CES-D scores, with scores <33 and scores ≥33. The results of this study reveal that patients with CES-D scores ≥33 exhibited increased glycemic variability.
The etiology of elevated glycemic variability in individuals with depression is multifactorial. In depression, there is an upsurge in stress hormones, particularly cortisol, which can be severe enough to result in pseudo- cushing syndrome (21). The elevated cortisol acts on the subcortical area, including the hippocampus and hypothalamus (22). These two areas are crucial for the control of the autonomic nervous system regulation. Autonomic dysfunction, as observed in patients with diabetes, has been linked to elevated glycemic variability. This has been seen in patients with diabetes, who have autonomic dysfunction, and had high glycemic variability (23, 24). The glycemic variability was also found to be associated with incident depression. In a retrospective study from the Korean National Health Insurance Service–National Health Screening Cohort from 2002 to 2007, patients (n-264,480) who have at least three fasting serum glucose were later observed during 2008–2013 (n-198,267), and their hazard ratios (HR) of incident depression were calculated. After adjustment, it was found that the highest glycemic variability was associated with a 9% increased risk of depression (HR, 1.09; 95% CI, 1.02–1.16). The risk of incident depression heightened with increasing GV (p for trend < 0.001) (22). In our pilot study, we tried to explore the glycemic variability in depressive patients. Our pilot study had the objective of exploring glycemic variability among non-diabetic individuals with depression. The heightened glycemic variability observed in patients with CES-D scores ≥33 suggests an elevation in stress hormone levels.
Additionally, there exists a connection between glycemic variability and endothelial dysfunction, which is a precursor to atherosclerosis and cardiovascular incidents. Notably, depression itself is also linked to endothelial dysfunction. The coexistence of both conditions may potentially contribute to an increased risk of cardiovascular events.
In summary, our pilot study illuminates the correlation between glycemic variability and depression in individuals without diabetes. The noted rise in stress hormones among those exhibiting higher CES-D scores highlights the importance of this link. Moreover, the interaction among glycemic variability, endothelial dysfunction, and depression underscores potential repercussions for cardiovascular well-being (25).
4.1. Future recommendations
In this study, our objective is to underscore patient education and awareness initiatives that highlight the link between glycemic variability and depression. Advocating for holistic care includes integrating comprehensive management strategies and interdisciplinary consultations. Expanding this research to a larger, diverse cohort is imperative to bolster the association regarding glycemic variability, particularly in non-diabetic populations. Our recommendation is to enhance robust methodologies by controlling confounders and predictors, encompassing dietary habits, physical activity, medication usage, and lifestyle factors. Embracing these approaches propels progress in patient care and scientific understanding, ultimately enhancing overall well-being.
4.2. Limitations
This pilot research represents a pioneering application of a flash glucose monitoring system to evaluate glycemic variability among patients afflicted with depression, who do not suffer from diabetes. Moreover, the glycemic variability is analyzed relative to the severity of the depression. Nevertheless, certain constraints were observed during the study. The principal restriction was the restricted sample size, which may limit the generalizability of the findings. Additionally, the low screening-to-enrollment ratio was attributed to the social stigma surrounding depression in India, which also served as a significant contributing factor to the attrition of study participants.
5. Conclusion
Patients who have more severe depression (CES-D scores≥33) have high glycemic variability (SD, MAGE, CONGA, and MODD) than the patients who have less severe depression (CES < 33).
Data availability statement
The data collected and/or evaluated in this study are intended for academic research and can be accessed upon suitable request to the corresponding authors.
Ethics statement
The study was conducted in accordance with the Declaration of Helsinki, and approved by the Institutional Ethics Committee, NIMS University Rajasthan, Jaipur (IEC Approval number: NIMSUR/IEC/2022/211) on 26 March 2022 for studies involving humans. The participants provided their written informed consent to participate in this study.
Author contributions
MS: conceptualization, investigation, validation, and writing—original draft. SM: conceptualization, investigation, validation, and writing—original draft. PS: methodology and project administration. DN: conceptualization, validation, resources, writing—original draft, supervision, and funding. SR and AS: investigation, validation, and writing—original draft. PR: investigation, formal analysis, and writing—original draft. HB: investigation, formal analysis, writing, reviewing, and editing. TJ: investigation, writing, reviewing, and editing. BT: conceptualization, resources, writing, reviewing, editing, supervision, and funding. All authors contributed to the article and approved the submitted version.
Funding
This work was supported by Nims University Rajasthan, Jaipur, India. No other funding source was involved in the study. All the decisions on design, data collection, analysis, interpretation and publication were independent of the funding source.
Acknowledgments
All the authors would like to express their sincere gratitude and appreciation to the staff and doctors of Department of Psychiatry and Department of Endocrinology, Nims hospital, Jaipur for their unwavering support and guidance throughout our journey. We would also like to thank all the professors of the Pharmacy department for their constant support and help.
Conflict of interest
The authors declare that the research was conducted in the absence of any commercial or financial relationships that could be construed as a potential conflict of interest.
Publisher’s note
All claims expressed in this article are solely those of the authors and do not necessarily represent those of their affiliated organizations, or those of the publisher, the editors and the reviewers. Any product that may be evaluated in this article, or claim that may be made by its manufacturer, is not guaranteed or endorsed by the publisher.
Supplementary material
The Supplementary material for this article can be found online at: https://www.frontiersin.org/articles/10.3389/fpsyt.2023.1196866/full#supplementary-material
References
1. Mezuk, B, Eaton, WW, Albrecht, S, and Golden, SH. Depression and type 2 diabetes over the lifespan: a meta-analysis. Diabetes Care. (2008) 31:2383–90. doi: 10.2337/dc08-0985
2. Chireh, B, Li, M, and D’Arcy, C. Diabetes increases the risk of depression: a systematic review, meta-analysis and estimates of population attributable fractions based on prospective studies. Prev Med Rep. (2019) 14:100822. doi: 10.1016/j.pmedr.2019.100822
3. Merabet, N, Lucassen, PJ, Crielaard, L, Stronks, K, Quax, R, Sloot, PM, et al. How exposure to chronic stress contributes to the development of type 2 diabetes: a complexity science approach. Front Neuroendocrinol. (2022) 65:100972. doi: 10.1016/j.yfrne.2021.100972
4. Zhou, Z, Sun, B, Huang, S, Zhu, C, and Bian, M. Glycemic variability: adverse clinical outcomes and how to improve it? Cardiovasc Diabetol. (2020) 19:1–4. doi: 10.1186/s12933-020-01085-6
5. O’Neil, M, Berkman, N, Hartling, L, Chang, S, Anderson, J, Motu’apuaka, M, et al. Observational evidence and strength of evidence domains: case examples. Syst Rev. (2014) 3:1–8. Available at: https://www.ncbi.nlm.nih.gov/books/NBK202087/
6. Reddy, N, Verma, N, and Dungan, K. Monitoring technologies-continuous glucose monitoring, mobile technology, biomarkers of glycemic control. Endotext [Internet]. (2020). Available at: https://www.ncbi.nlm.nih.gov/books/NBK279046/
7. ICD-10 Version:2019 [Internet]. [cited 2023 Mar 11]. Available at: https://icd.who.int/browse10/2019/en
8. Tham, KW, Abdul Ghani, R, Cua, SC, Deerochanawong, C, Fojas, M, Hocking, S, et al. Obesity in south and Southeast Asia—a new consensus on care and management. Obes Rev. (2023) 24:e13520. doi: 10.1111/obr.13520
9. Talati, KN, Parmar, A, Zalavadiya, D, Shinde, M, and Madan-Patel, G. Epidemiological insights into anthropometric indices and their correlates among college students through a university-level screening program in Western India. Indian J Community Med. (2022) 47:445–8. doi: 10.4103/ijcm.ijcm_1219_21
10. Grundy, SM, Stone, NJ, Bailey, AL, Beam, C, Birtcher, KK, Blumenthal, RS, et al. 2018 AHA/ACC/AACVPR/AAPA/ABC/ACPM/ADA/AGS/APhA/ASPC/NLA/PCNA guideline on the management of blood cholesterol: a report of the American College of Cardiology/American Heart Association task force on clinical practice guidelines. Circulation. (2019) 139:e1082–143. doi: 10.1161/CIR.0000000000000625
11. Blum, A. Freestyle Libre Glucose Monitoring System. Clinical Diabetes. (2018) 36:203–4. doi: 10.2337/cd17-0130
12. Schlichtkrull, J, Munck, O, and Jersild, M. The m-valve, an index of blood-sugar control in diabetics. Acta Med Scand. (1965) 177:95–102. doi: 10.1111/j.0954-6820.1965.tb01810.x
13. Kovatchev, BP, Cox, DJ, Kumar, A, Gonder-Frederick, L, and Clarke, WL. Algorithmic evaluation of metabolic control and risk of severe hypoglycemia in type 1 and type 2 diabetes using self-monitoring blood glucose data. Diabetes Technol Ther. (2003) 5:817–28. doi: 10.1089/152091503322527021
14. Kovatchev, BP, Otto, E, Cox, D, Gonder-Frederick, L, and Clarke, W. Evaluation of a new measure of blood glucose variability in diabetes. Diabetes Care. (2006) 29:2433–8. doi: 10.2337/dc06-1085
15. Wójcicki, JM. “J”-index. A new proposition of the assessment of current glucose control in diabetic patients. Horm Metab Res. (1995) 27:41–2. doi: 10.1055/s-2007-979906
16. McDonnell, CM, Donath, SM, Vidmar, SI, Werther, GA, and Cameron, FJ. A novel approach to continuous glucose analysis utilizing glycemic variation. Diabetes Technol Ther. (2005) 7:253–63. doi: 10.1089/dia.2005.7.253
17. Service, FJ, Molnar, GD, Rosevear, JW, Ackerman, E, Gatewood, LC, and Taylor, WF. Mean amplitude of glycemic excursions, a measure of diabetic instability. Diabetes. (1970) 19:644–55.
18. Zich, JM, Attkisson, CC, and Greenfield, TK. Screening for depression in primary care clinics: the CES-D and the BDI. Int J Psychiatry Med. (1990) 20:259–77. doi: 10.2190/LYKR-7VHP-YJEM-MKM2
19. Carleton, RN, Thibodeau, MA, Teale, MJ, Welch, PG, Abrams, MP, Robinson, T, et al. The center for epidemiologic studies depression scale: a review with a theoretical and empirical examination of item content and factor structure. PLoS One. (2013) 8:e58067. doi: 10.1371/journal.pone.0058067
20. Marbaniang, I, Borse, R, Sangle, S, Kinikar, A, Chavan, A, Nimkar, S, et al. Development of shortened HIV-related stigma scales for young people living with HIV and young people affected by HIV in India. Health Qual Life Outcomes. (2022) 20:1. doi: 10.1186/s12955-022-02030-9
21. Stetler, C, and Miller, GE. Depression and hypothalamic-pituitary-adrenal activation: a quantitative summary of four decades of research. Psychosom Med. (2011) 73:114–26. doi: 10.1097/PSY.0b013e31820ad12b
22. Kim, JJ, and Diamond, DM. The stressed hippocampus, synaptic plasticity and lost memories. Nat Rev Neurosci. (2002) 3:453–62. doi: 10.1038/nrn849
23. Kim, HJ, Kim, SM, Lee, G, Choi, S, Son, JS, Oh, YH, et al. Association between visit-to-visit fasting glycemic variability and depression: a retrospective cohort study in a representative Korean population without diabetes. Sci Rep. (2022) 12:4. doi: 10.1038/s41598-022-27160-4
24. Fleischer, J. Diabetic autonomic imbalance and glycemic variability. J Diabetes Sci Technol. (2012) 6:1207–15. doi: 10.1177/193229681200600526
Keywords: depression, glycemic variability, risk of diabetes, FGM, CES-D, glycemic variability indices
Citation: Mishra S, Singh AK, Rajotiya S, Singh P, Raj P, Bareth H, Singh M, Jagawat T, Nathiya D and Tomar BS (2023) Exploring the risk of glycemic variability in non-diabetic depressive individuals: a cross-sectional GlyDep pilot study. Front. Psychiatry. 14:1196866. doi: 10.3389/fpsyt.2023.1196866
Edited by:
Chi-Shin Wu, National Health Research Institutes (Taiwan), TaiwanReviewed by:
Yang-Pei Chang, Kaohsiung Medical University, TaiwanChen-Cheng Yang, Kaohsiung Municipal Siaogang Hospital, Taiwan
Copyright © 2023 Mishra, Singh, Rajotiya, Singh, Raj, Bareth, Singh, Jagawat, Nathiya and Tomar. This is an open-access article distributed under the terms of the Creative Commons Attribution License (CC BY). The use, distribution or reproduction in other forums is permitted, provided the original author(s) and the copyright owner(s) are credited and that the original publication in this journal is cited, in accordance with accepted academic practice. No use, distribution or reproduction is permitted which does not comply with these terms.
*Correspondence: Shivang Mishra, shivang.mishra23@gmail.com; Anurag Kumar Singh, anuragkrsingh06@gmail.com; Mahaveer Singh, drms.mamcmed@gmail.com; Deepak Nathiya, dnathiya@nimsuniversity.org