 Xue Chai1†Rongrong Zhang2†
 Chen Xue1Zonghong Li1Wang Xiao1
 Qingling Huang1
 Chaoyong Xiao1*Shiping Xie2*
- 1Department of Radiology, The Affiliated Brain Hospital of Nanjing Medical University, Nanjing, China
- 2Department of Psychiatry, The Affiliated Brain Hospital of Nanjing Medical University, Nanjing, China
Background: An early and correct diagnosis is crucial for treatment of unipolar depression (UD) and bipolar disorder (BD). The fractional amplitude of low-frequency fluctuations (fALFFs) has been widely used in the study of neuropsychiatric diseases, as it can detect spontaneous brain activities. This study was conducted to survey changes of fALFF within various frequency bands of the UD and BD patients, as well as to explore the effects on changes in fALFF on cognitive function.
Methods: In total, 58 drug-naive first-episode patients, including 32 UD and 26 BD, were enrolled in the study. The fALFF values were calculated under slow-5 band (0.01–0.027 Hz) and slow-4 band (0.027–0.073 Hz) among UD patients, BD patients, and healthy control (HC). Additionally, we conducted correlation analyses to examine the association between altered fALFF values and cognitive function.
Results: Under the slow-5 band, compared to the HC group, the UD group showed increased fALFF values in the right cerebellum posterior lobe, whereas the BD group showed increased fALFF values in the left middle temporal gyrus (MTG). Under the slow-4 band, in comparison to HC, the UD group showed increased fALFF values in the left superior temporal gyrus, whereas the right inferior parietal lobule (IPL) and BD group showed increased fALFF values in the bilateral postcentral gyrus. Notably, compared to BD, the UD group showed increased fALFF values in the right IPL under the slow-4 band. Furthermore, altered fALFF values in the left MTG and the right IPL were significantly positively correlated with Verbal Fluency Test scores.
Conclusions: This current study indicated that there were changes in brain activities in the early UD and BD groups, and changes were related to executive function. The fALFF values can serve as potential biomarker to diagnose and differentiate UD and BD patients.
Introduction
Unipolar depression (UD) and bipolar disorder (BD) are highly disabling diseases that seriously impact the patients' quality of life and are associated with high suicide rates (1, 2). In particular, studies have suggested that anxiety/depression, alexithymia, and extreme sensory processing patterns in psychiatric disorders are risk factors for suicide (3, 4) The distinction between UD and BD depends on whether the patient presents with a manic or hypomanic episode (2, 5, 6). It is almost impossible to correctly diagnose BD patients without a history of mania/hypomania episode (6, 7). Studies have shown that about 60% of BD patients are initially misdiagnosed as UD, and they are treated differently, which can cause serious consequences, including inducing manic episodes and emotional instability. These disabling consequences are often associated with abnormal use of antidepressants (8, 9). Therefore, promoting an understanding of the pathological mechanism of UD and BD will be of great help to diagnosis and treat this disease. According to previous studies, brain activities in the resting state, which reflect the baseline status of the brain, contributes to a better understanding of the pathophysiological features of mental illness, including UD and BD.
The resting-state functional magnetic resonance imaging (fMRI), a non-invasive fMRI technique, has been suggested as a useful way to measure spontaneous brain activities and detect internal changes in brain function that are inherent in pathological condition, including mental disorders such as UD and BD (10). The amplitude of low-frequency fluctuations (ALFFs) and the fractional ALFF (fALFF) are two credible indicators that are used to examine the regional features of low-frequency oscillations (LFOs) (11, 12). The ALFF measures voxel-wise amplitude of LFOs at very low frequencies (typically 0.01–0.08 Hz) and reflects local characteristics of brain oscillatory activities, whereas fALFF is the ALFF of a given frequency band and is part of the sum of amplitudes over an entire frequency range (13). Notably, the fALFF is a modified index of ALFF, which is less likely to produce any noise and is more sensitive and specific to the detection of spontaneous brain activities in comparison to ALFF (13). Convergent evidence suggests that the whole frequency range can be divided into four bands, including slow-5: 0.01–0.027 Hz, slow-4: 0.027–0.073 Hz, slow-3: 0.073–0.198 Hz, and slow-2: 0.198–0.25 Hz, in which the slow-4 and slow-5 bands can sensitively reveal pathology behind neuropsychiatric disorders (13, 14). Previous studies have indicated that ALFF/fALFF values under slow-4 and slow-5 bands are of great significance in the diagnosis of depression, but few studies have assessed its application in the UD and BD patients (14).
Most neuroimaging studies of UD and BD patients have found abnormal neuronal activities, which manifest as abnormal ALFF/fALFF values (15, 16). Chun et al. found that the BD group indicated abnormal ALF values that mainly exist in the prefrontal-limbic networks and associated striatal systems (17). The pediatric BD patients have also shown abnormal ALFF values in the basal ganglia, parietal cortex, and occipital cortex (10). Moreover, ALFF values in the bilateral superior frontal gyrus and left superior temporal gyrus can contribute to differentiate early-onset depression from late-onset depression (18). Notably, studies have shown that suicidal ideation is relevant to the changing resting-state brain activities in major depressive disorder (19). Electroconvulsive therapy, as a quick and effective treatment for severe depression, can relieve symptoms of depression, as well as alter resting-state brain activities (20). Therefore, application of ALFF in depression can play a role in diagnosing depression, judging the period of depression, and even providing a new perspective for selection of therapeutic targets.
In this current study, we calculated fALFF values in the slow-4 and slow-5 bands in drug and treatment-naive, first-episode, and short-illness-duration patients with UD and BD. In addition, correlation analyses were applied to study the relationship between altered fALFF values of UD and BD and cognitive function. We hypothesized the fALFF values were conducive to identification of UD and BD patients, and changed fALFF values affected cognitive function of patients.
Materials and Methods
Subjects
In total, 58 drug-naive first-episode patients, including 32 UD and 26 BD patients, were recruited from the inpatient and outpatient clinic at the Affiliated Brain Hospital of Nanjing Medical University, Jiangsu Province, China. The inclusion criteria for UD patients included the following: (1) met the criteria outlined in the fourth edition of the Diagnostic and Statistical Manual of Mental Disorders, Fourth Edition (DSM-IV) for major depressive episode; (2) had a 17-item Hamilton Depression Rating Scale (HAMD17) score ≥17; (3) between the ages of 14 and 45 years; (4) right-handed Han Chinese; and (5) never received psychotropic medication, electroconvulsive therapy, or psychotherapy. The inclusion criteria for BD patients included the following: (1) met the DSM-IV criteria for BD; (2) currently in the midst of a depressive episode; (3) Young Mania Rating Scale (YMRS) score <7 and 17-item HAMD score ≥17; (4) between the ages of 14 and 45 years; (5) right-handed Han Chinese; and (6) never received psychotropic medication, electroconvulsive therapy, or psychotherapy. The exclusion criteria for the patients included the following: (1) diagnosis of other mental disorders; (2) a history of severe brain injury, organic brain diseases, or systemic illnesses; (3) alcohol or drug abuse; (4) pregnancy and lactation; and (5) contraindications to MRI scanning. Overall, 30 healthy control (HC) individuals were recruited from the community. The inclusion criteria for HC comprise (1) no history of mental disorders, according to DSM-IV; (2) HAMD17 score <7; and (3) no family history of mental disorders. All participants and their families provided written informed consent, and the study was granted approval by the Institutional Ethical Committee for Clinical Research of Nanjing Brain Hospital.
Neurocognitive Assessments
The study adopted the Chinese version of the MATRICS Consensus Cognitive Battery (MCCB) in order to assess cognitive function. The MCCB is a comprehensive and systematic assessment that can be divided into seven domains: (1) speed of processing: Trail Making Test A, Brief Assessment of Cognition in Schizophrenia, and Semantic Verbal Fluency Test (VFT); (2) verbal learning: Hopkins Vocabulary Learning Test; (3) working memory: Wechsler Memory Scale; (4) reasoning and problem-solving: Neuropsychological Assessment Battery (NAB); (5) visual learning: the Brief Visuospatial Memory Test; (6) social cognitive: Mayer–Salovey–Caruso Emotional Intelligence Test; and (7) attention/vigilance: Continuous Performance Test, Identical Pairs version (CPT-IP) (21).
MRI Data Acquisition
Neuroimaging was conducted through the use of a 3.0-T Verio Siemens scanner with an eight-channel head-coil at the Nanjing Brain Hospital. Participants were instructed to rest with their eyes open, to not fall asleep, and to not think about anything in particular.
The gradient-echo echoplanar imaging sequence contained 149 volumes. The parameters included repetition time (TR) = 2,500 ms, echo time (TE) = 30 ms, flip angle = 90°, slice thickness = 3.5 mm, number of slices = 37, field of view (FOV) = 224 × 224 mm2, matrix size = 64 × 64, and voxel size = 3.5 × 3.5 × 3.5 mm3.
High-resolution T1-weighted images were obtained using magnetization-prepared rapid gradient-echo sequence. The parameters included TR = 2,300 ms, TE = 2.98 ms, flip angle = 9°, inversion time = 900 ms, thickness = 1 mm, number of slices = 192, FOV = 256 × 240 mm2, and voxel size = 1 × 1 × 1 mm3.
Image Preprocessing
The fMRI data were preprocessed using Data Processing and Analysis for Brain Imaging (DPABI, http://rfmri.org/DPABI) software in MATLAB 2013b (http://www.mathworks.com/products/matlab/). The first five volumes of functional images were discarded, and the remaining 142 volumes were used for subsequent processing, including slice timing, head-motion correction, and nuisance covariate regression. There were no subjects with excessive head motion (>2.5 mm of displacement or >2.5° of rotation in any direction). Next, 24 motion parameters, global signal, white matter signal, and cerebrospinal fluid signal were chosen as nuisance covariate. Then, the functional images were spatially normalized to the standard space of the Montreal Neurological Institute and resampled to an isotropic voxel size of 3 mm. Finally, the resulting functional images were smoothed with a 6-mm full-width half-maximum Gaussian kernel, and the linear trends were removed.
fALFF Measurement
The fALFF computed using the DPABI software. The time series of each voxel was transformed into a frequency domain, and the power spectrum was obtained using the fast Fourier transform. The square root was measured at each frequency of the power spectrum, and the averaged square root, i.e., ALFF value, was acquired over the range of 0.01–0.08 Hz. The fALFF value was obtained by dividing total ALFF values from 0.01 to 0.025 Hz. Finally, the resulting fALFF maps were normalized with each voxel divided by mean of the fALFF values of the whole-brain signal, providing mfALFF spatial maps. In addition, this study calculated and analyzed fALFF at slow-4 band (0.027–0.073) and slow-5 band (0.01–0.027), according to previous studies.
Statistical Analysis
The Statistical Package for the Social Sciences software version 22.0 (IBM, Armonk, New York) was used for statistical analysis. The analysis of variance (ANOVA), the two-sample t-test, and χ2-test were performed compared with the demographics and neurocognition among the groups, including UD, BD, and HC. The threshold for statistical significance difference was set at p < 0.05.
One-way ANOVA was conducted in order to compare differences in mfALFF value between the three groups, including UD, BD, and HC using age, gender, and education as covariates, Non-parametric permutation test was conducted in the study in order to reduce the false-positive rate, and the permutation times were set at 1,000. p < 0.05 was set for statistical significance, and cluster size >200 voxels (5,400 mm3) was used for multiple comparisons. The post-hoc comparisons were calculated using a mask obtained from ANOVA using age, gender, and education as covariates. The non-parametric threshold-free cluster enhancement (TFCE) and the family-wise error (FWE) corrected at p < 0.05 with cluster size >20 voxels (540 mm3) were set for statistical significance. The mfALFF values of significantly changed regions were extracted using the Resting-State fMRI Data Analysis Toolkit (Rest) (http://www.restfmri.net/forum/REST_V1.8) and used for correlation analysis. The correlation analysis was conducted to reveal the relationships between altered mfALFF values and MCCB assessments with age, gender, and years of education as covariates (p < 0.05, Bonferroni-corrected).
Results
Demographic and Neurocognitive Characteristics
The demographic and MCCB information of all subjects, including 32 UD, 26 BD, and 30 HC patients, is shown in Table 1. The results indicated significant differences in NAB, VFT, and CPT-IP across the three groups. In comparison to HC, both UD and BD showed significantly reduced NAB and VFT scores, whereas only BD showed significantly reduced CPT-IP (p < 0.05). All results were obtained using age, gender, and education as covariates.
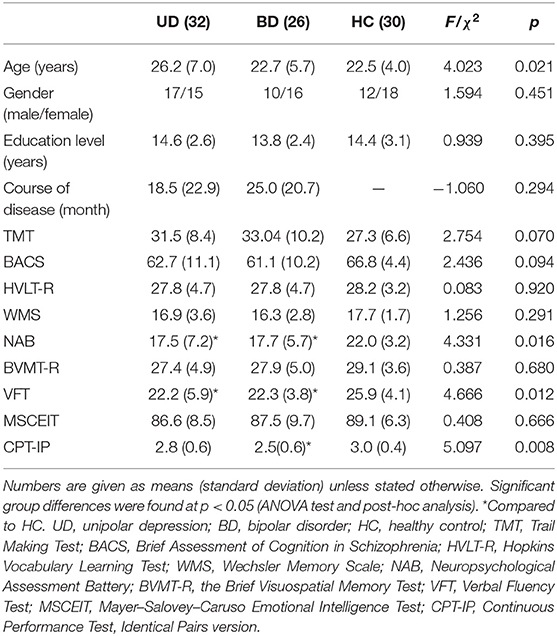
Table 1. Demographics and MCCB assessments of patients with UD, BD, and HC subjects.
Altered mfALFF Values in the Three Groups
For mfALFF values in slow-5, the ANOVA indicated significant differences across the three groups, including UD, BD, and HC, and included the right cerebellum posterior lobe (CPL), the left middle temporal gyrus (MTG), the bilateral thalamus, the left inferior parietal lobule (IPL), and the left precentral gyrus. Compared to HC, the BD group showed significantly increased mfALFF value in the left MTG, whereas the UD group demonstrated increased mfALFF value in right CPL (TFCE-FWE corrected, cluster size ≥20, p < 0.05). All results were obtained using age, gender, and education as covariates (Table 2, Figure 1).
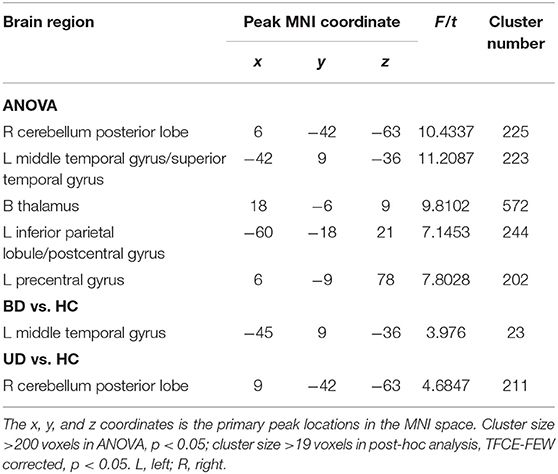
Table 2. The difference of fALFF values under slow-5 band across three groups.
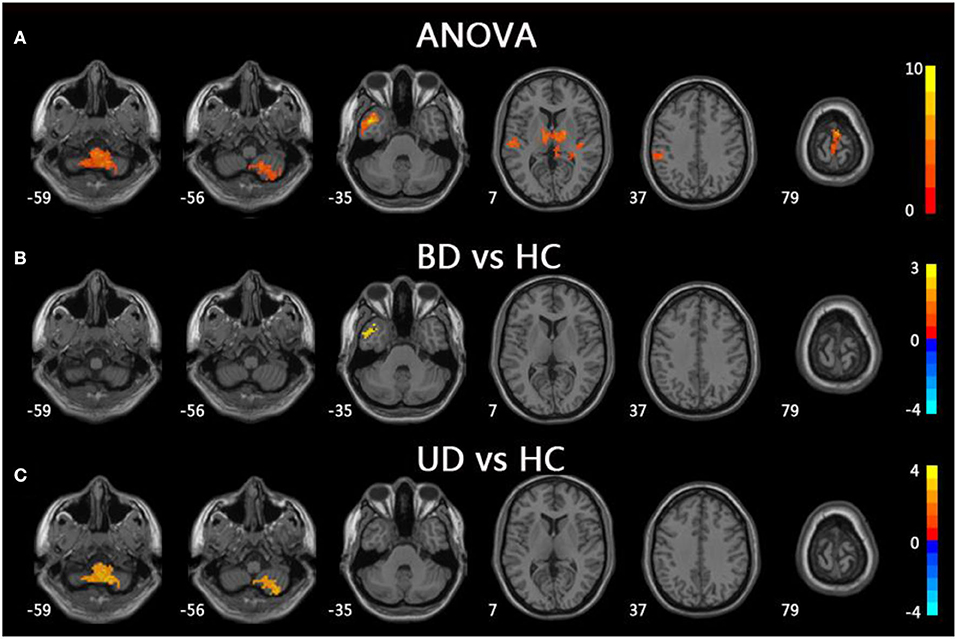
Figure 1. Brain regions exhibiting significant differences from ANOVA and post-hoc analysis in fALFF values under slow-5 band. (A) Brain regions showing significant differences in fALFF values between UD, BD, and HC (cluster size >200, p < 0.05). (B) Brain regions showing significant differences in fALFF values between BD and HC (cluster size >19, TFCE-FWE corrected, p < 0.05). (C) Brain regions showing significant differences in fALFF values between UD and HC (cluster size > 19, TFCE-FWE corrected, p < 0.05). UD, unipolar depression; BD, bipolar disorder; HC, healthy control.
For mfALFF values in slow-4, ANOVA showed significant differences across three groups, including UD, BD, and HC, as well as the bilateral lingual, the left superior temporal gyrus (STG), the left postcentral gyrus (PoCG), the right IPL, the right PoCG, and the bilateral middle cingulum gyrus. Compared to the HC group, the BD group showed significantly increased mfALFF values in the bilateral PoCG, whereas the UD group showed significantly increased mfALFF values in the left STG and right IPL. Notably, in comparison to the BD group, the UD group showed increased mfALFF values in the right IPL (TFCE-FWE corrected, cluster size ≥20, p < 0.05). All results were obtained using age, gender, and education as covariates (Table 3, Figure 2).
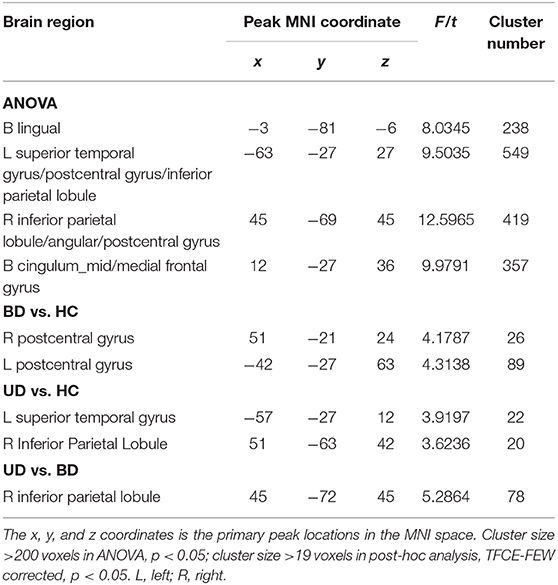
Table 3. The difference of fALFF values under slow-4 band across three groups.
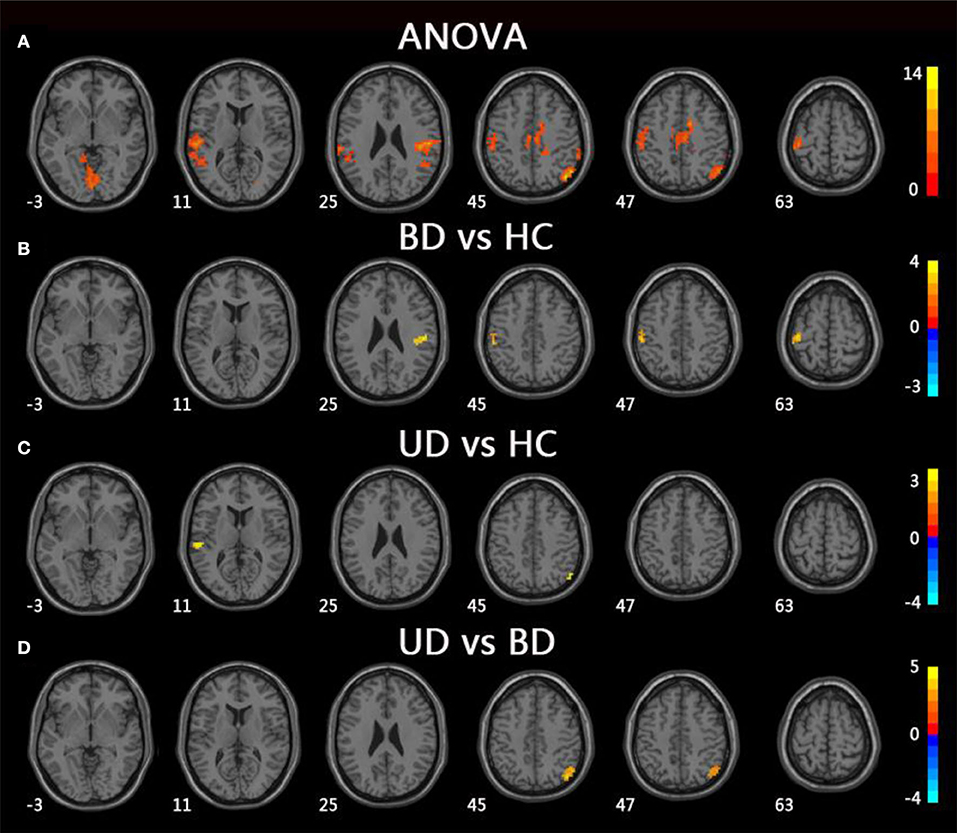
Figure 2. Brain regions exhibiting significant differences from ANOVA and post-hoc analysis in fALFF values under slow-4 band. (A) Brain regions showing significant differences in fALFF values between UD, BD, and HC (cluster size >200, p < 0.05). (B) Brain regions showing significant differences in fALFF values between BD and HC (cluster size >19, TFCE-FWE corrected, p < 0.05). (C) Brain regions showing significant differences in fALFF values between UD and HC (cluster size >19, TFCE-FWE corrected, p < 0.05). (D) Brain regions showing significant differences in fALFF values between UD and BD (cluster size >19, TFCE-FWE corrected, p < 0.05). UD, unipolar depression; BD, bipolar disorder; HC, healthy control.
Correlations Between the Abnormal mfALFF Values and MCCB in the Three Groups
Pearson correlation analysis was performed between altered mfALFF-values regions and MCCB assessments using age, gender, and years of education as covariates (p < 0.05, Bonferroni corrected). Under the slow-5 band, mfALFF values of the left MTG were significantly positively correlated with VFT scores in the BD and HC groups (r = 0.574, p = 0.010). Under the slow-4 band, the mfALFF values of the right IPL were significantly positively correlated with VFT scores in the groups of BD and MD (r = 0.374, p = 0.007) and the mfALFF values of the right IPL were positively associated with VFT scores in the MD and HC groups (r = 0.490, p = 0.007) (Figure 3).
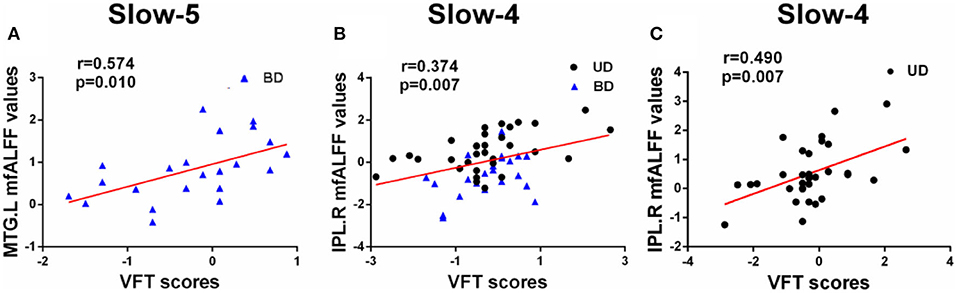
Figure 3. (A–C) Significant correlations between altered fALFF values under slow-5 and slow-4 bands and MCCB assessments (Bonferroni corrected, p < 0.05). UD, unipolar depression; BD, bipolar disorder; VFT, Verbal Fluency Test; MTG, middle temporal gyrus; IPL, inferior parietal lobule; R, right; L, left.
Discussion
This current study analyzed fALFF values under the slow-4 (0.027–0.073) and slow-5 (0.01–0.027 Hz) bands in BD and UD patients and further explored the relationship between altered fALFF values and MCCB assessments. Our study had several findings that were highly congruent with our hypothesis. First, local brain regions, including the left MTG, the right CPL, the bilateral PoCG, the left STG, and the right IPL, showed significantly increased fALFF under the two separate frequency bands of the patient group. Second, under the slow-4 band, the fALFF values of the right IPL served as a potential biological marker in order to identify the BD and UD groups. Finally, Pearson correlation analysis proved that regions with altered fALFF were positively correlated with impaired VFT scores. In conclusion, the present study revealed that the fALFF values under slow-4 and slow-5 bands play an important and different role in the identification and diagnosis of the very early BD and UD.
Increased fALFF Values in the BD and UD Groups Under Slow-4 and Slow-5 Bands
Our study indicated that several regions of the BD and UD groups had significantly increased fALFF values in the slow-4 and slow-5 bands. In general, abnormal fALFF values in early BD and UD patients were mainly located in the temporal and parietal lobes, similar to previous studies (22–24).
Under the slow-5 band, compared to the HC group, BD patients showed increased fALFF values in the left MTG, whereas UD patients showed increased fALFF values in the right CPL. Evidence also suggested that BD patients had structural and functional abnormalities in the temporal lobe and that increased fALFF values in the left MTG were consistent with the results of previous studies (15, 25). The cerebellum was thought to be involved in motor processing. However, a growing body of research suggests that the cerebellum is involved in pathogenesis of depression and CPL, which belongs to the default mode network (DMN) and regulates emotional processing and cognition (26). Sun et al. found that both major depressive disorder and cognitive vulnerability to depression showed increased regional homogeneity (ReHo) compared to the HC group, and the abnormal ReHo values were associated with the Center for Epidemiologic Studies Depression Scale (27). Additionally, the decreased functional connection in the bilateral CPL, as well as decreased cerebellar volume, was reported in UD patients in prior studies (28). In combination with increased fALFF values in UD patients of the study, our data suggest that the CPL abnormal resting-state brain activities of CPL may be potential biomarkers of UD patients (29, 30).
Under the slow-4 bands, compared to the HC group, the BD group showed increased fALFF values in the bilateral PoCG, whereas the UD group showed increased fALFF values in the left STG and right IPL. The PoCG, part of the parietal lobe, is widely known to be an important region that is responsible for proprioception (31). A growing body of study suggests that the PoCG is important in emotional processing, including the production of an emotional state and regulation of emotion (31). Abnormalities in the emotional processing circuit in BD patients are related to abnormal brain activities in the PoCG. Moreover, numerous studies have discovered that STG is the key brain region for pathological development of BD patients (32–34). An abnormal fatty acid pattern in STG was even believed to be the specific change in BD patients (35). Interestingly, results from this study showed that fALFF values were increased in the UD group, which is consistent with a meta-analysis, suggesting that both BD and UD patients had functional changes in STG (36). Notably, compared to the BD group, the UD group showed increased fALFF values in the right IPL. The IPL, which is widely considered to be the posterior region of the DMN, is a heterogeneous area that integrates information from different sensory patterns (37, 38). Moreover, the IPL was thought to be involved in cognitive functions, including executive control and episodic memory (39). Previous studies have reported that the UD group showed significantly increased ReHo in the right IPL compared to the HC group. Additionally, Sawamura et al. found that the average kurtosis of gray matter in the right IPL can help distinguish BD from major depressive disorder with a high accuracy (40, 41). It is worth noting that there were no significant differences with regard to the fALFF values of right IPL between BD patients and the HC group, and there was significantly increased fALFF of right IPL in the UD group compared to the HC group. This might suggest the fALFF of right IPL is a specific indicator that can be used to diagnose and identify UD patients.
It is worth noting that there is no reduction in fALFF values of the BD and UD groups in either the slow-4 or slow-5 band, which is clearly inconsistent with prior studies. The reason may be that the patients enrolled in this study were first-episode, drug-naive patients and had a short illness duration and thus belonged to a very early stage of depression and had not yet progressed to a decline in fALFF values. The increased fALFF values might be a compensatory mechanism for early BD and UD. In conclusion, the fALFF values under slow-4 and slow-5 bands can reveal the difference in brain activities between the depression patients and HC. Compared to the slow-5 band, the slow-4 band was more sensitive to differences in brain activities between the BD and UD groups. The combination of the slow-4 and slow-5 bands is beneficial to a clinical diagnosis and differentiation of UD and BD patients.
Behavioral Significance of Altered fALFF in Three Groups
The current study showed a significantly positive relationship between altered fALFF values and VFT scores in UD and BD patients. Under the slow-5 band, increased fALFF values of the MTG in BD patients were obviously positively correlated with VFT scores. Under the slow-4 band, increased fALFF values of the right IPL in BD and UD patient groups were positively correlated with VFT scores, and increased fALFF values of the right IPL in UD patients were positively correlated to VFT scores. The VFT scale is an important scale that can effectively reflect executive function. The IPL is considered to support control processes, and IPL activity is related to performance accuracy (42, 43). Notably, MTG and IPL are part of the DMN, which is deemed to be involved in self-referential processing, including internal monitoring, memory retrieval, theory of mind, and future planning (44, 45). Therefore, the left MTG and right IPL are regarded to play vital roles in executive function in early BD and UD patients.
Limitations
There are two limitations in the current study that should be mentioned. First, the small sample size in the study may influence the authenticity of results. Therefore, we will continue to recruit volunteers and continue the analysis. Second, there were significant differences in age among the three groups, which may have influenced the results. To solve this problem, we performed all statistical analyses using age, gender, and years of education as covariates.
Conclusion
Distinctively abnormal fALFF values were found among three groups, including UD, BD, and HC under the slow-4 and slow-5 bands, which revealed varying degrees of altered brain activities in UD and BD patients. In comparison to slow-5 bands, the slow-4 bands were more sensitive to differences in brain activities between the BD and UD groups. Moreover, the positive correlation between altered fALFF values and VFT scores further suggested that abnormal fALFF may contribute to a cognitive decline in UD and BD patients. In summary, the fALFF values can be used as a biological marker in the BD and UD patients.
Data Availability Statement
The raw data supporting the conclusions of this article will be made available by the authors, without undue reservation.
Ethics Statement
The studies involving human participants were reviewed and approved by the Institutional Ethical Committee for clinical research of Nanjing Brain Hospital. Written informed consent to participate in this study was provided by the participants' legal guardian/next of kin.
Author Contributions
XC, RZ, CXi, and SX: designed the study. XC, RZ, CXu, ZL, WX, QH, CXi, and SX: collected the data. XC and RZ: analyzed the data and prepared the manuscript. All authors contributed to the article and approved the submitted version.
Funding
This study was supported by Nanjing Municipal Commission of Science and Technology (No. 21803032); the Nanjing Medical Science and Technique Development Foundation (No. QRX17181 and YKK17134).
Conflict of Interest
The authors declare that the research was conducted in the absence of any commercial or financial relationships that could be construed as a potential conflict of interest.
References
1. Murray CJ, Vos T, Lozano R, Naghavi M, Flaxman AD, Michaud C, et al. Disability-adjusted life years (DALYs) for 291 diseases and injuries in 21 regions, 1990-2010: a systematic analysis for the global burden of disease study 2010. Lancet. (2012) 380:2197–223. doi: 10.1016/S0140-6736(12)61690-0
2. Cardoso de Almeida JR, Phillips ML. Distinguishing between unipolar depression and bipolar depression: current and future clinical and neuroimaging perspectives. Biol Psychiatry. (2013) 73:111–8. doi: 10.1016/j.biopsych.2012.06.010
3. Engel-Yeger B, Muzio C, Rinosi G, Solano P, Geoffroy PA, Pompili M, et al. Extreme sensory processing patterns and their relation with clinical conditions among individuals with major affective disorders. Psychiatry Res. (2016) 236:112–8. doi: 10.1016/j.psychres.2015.12.022
4. De Berardis D, Fornaro M, Orsolini L, Valchera A, Carano A, Vellante F, et al. Alexithymia and suicide risk in psychiatric disorders: a mini-review. Front Psychiatry. (2017) 8:148. doi: 10.3389/fpsyt.2017.00148
5. Perlis RH, Brown E, Baker RW, Nierenberg AA. Clinical features of bipolar depression versus major depressive disorder in large multicenter trials. Am J Psychiatry. (2006) 163:225–31. doi: 10.1176/appi.ajp.163.2.225
6. Grotegerd D, Suslow T, Bauer J, Ohrmann P, Arolt V, Stuhrmann A, et al. Discriminating unipolar and bipolar depression by means of fMRI and pattern classification: a pilot study. Eur Arch Psychiatry Clin Neurosci. (2013) 263:119–31. doi: 10.1007/s00406-012-0329-4
7. Woo YS, Shim IH, Wang HR, Song HR, Jun TY, Bahk WM. A diagnosis of bipolar spectrum disorder predicts diagnostic conversion from unipolar depression to bipolar disorder: a 5-year retrospective study. J Affect Disord. (2015) 174:83–8. doi: 10.1016/j.jad.2014.11.034
8. Han KM, De Berardis D, Fornaro M, Kim YK. Differentiating between bipolar and unipolar depression in functional and structural MRI studies. Prog Neuropsychopharmacol Biol Psychiatry. (2019) 91:20–7. doi: 10.1016/j.pnpbp.2018.03.022
9. Burger C, Redlich R, Grotegerd D, Meinert S, Dohm K, Schneider I, et al. Differential abnormal pattern of anterior cingulate gyrus activation in unipolar and bipolar depression: an fMRI and pattern classification approach. Neuropsychopharmacology. (2017) 42:1399–408. doi: 10.1038/npp.2017.36
10. Lu D, Jiao Q, Zhong Y, Gao W, Xiao Q, Liu X, et al. Altered baseline brain activity in children with bipolar disorder during mania state: a resting-state study. Neuropsychiatr Dis Treat. (2014) 10:317–23. doi: 10.2147/NDT.S54663
11. Zang YF, He Y, Zhu CZ, Cao QJ, Sui MQ, Liang M, et al. Altered baseline brain activity in children with ADHD revealed by resting-state functional MRI. Brain Dev. (2007) 29:83–91. doi: 10.1016/j.braindev.2006.07.002
12. Zou QH, Zhu CZ, Yang Y, Zuo XN, Long XY, Cao QJ, et al. An improved approach to detection of amplitude of low-frequency fluctuation (ALFF) for resting-state fMRI: fractional ALFF. J Neurosci Methods. (2008) 172:137–41. doi: 10.1016/j.jneumeth.2008.04.012
13. Zuo XN, Di Martino A, Kelly C, Shehzad ZE, Gee DG, Klein DF, et al. The oscillating brain: complex and reliable. Neuroimage. (2010) 49:1432–45. doi: 10.1016/j.neuroimage.2009.09.037
14. Wang L, Kong Q, Li K, Su Y, Zeng Y, Zhang Q, et al. Frequency-dependent changes in amplitude of low-frequency oscillations in depression: a resting-state fMRI study. Neurosci Lett. (2016) 614:105–11. doi: 10.1016/j.neulet.2016.01.012
15. Liu CH, Li F, Li SF, Wang YJ, Tie CL, Wu HY, et al. Abnormal baseline brain activity in bipolar depression: a resting state functional magnetic resonance imaging study. Psychiatry Res. (2012) 203:175–9. doi: 10.1016/j.pscychresns.2012.02.007
16. Xu K, Liu H, Li H, Tang Y, Womer F, Jiang X, et al. Amplitude of low-frequency fluctuations in bipolar disorder: a resting state fMRI study. J Affect Disord. (2014) 152–154:237–42. doi: 10.1016/j.jad.2013.09.017
17. Liu CH, Ma X, Wu X, Li F, Zhang Y, Zhou FC, et al. Resting-state abnormal baseline brain activity in unipolar and bipolar depression. Neurosci Lett. (2012) 516:202–6. doi: 10.1016/j.neulet.2012.03.083
18. Guo WB, Liu F, Xun GL, Hu MR, Guo XF, Xiao CQ, et al. Reversal alterations of amplitude of low-frequency fluctuations in early and late onset, first-episode, drug-naive depression. Prog Neuropsychopharmacol Biol Psychiatry. (2013) 40:153–9. doi: 10.1016/j.pnpbp.2012.08.014
19. Lan MJ, Rizk MM, Pantazatos SP, Rubin-Falcone H, Miller JM, Sublette ME, et al. Resting-state amplitude of low-frequency fluctuation is associated with suicidal ideation. Depress Anxiety. (2019) 36:433–41. doi: 10.1002/da.22888
20. Kong XM, Xu SX, Sun Y, Wang KY, Wang C, Zhang J, et al. Electroconvulsive therapy changes the regional resting state function measured by regional homogeneity (ReHo) and amplitude of low frequency fluctuations (ALFF) in elderly major depressive disorder patients: an exploratory study. Psychiatry Res Neuroimaging. (2017) 264:13–21. doi: 10.1016/j.pscychresns.2017.04.001
21. Smelror RE, Jorgensen KN, Lonning V, Kelleher I, Cannon M, DeRosse P, et al. Healthy adolescent performance with standardized scoring tables for the MATRICS consensus cognitive battery: a multisite study. Schizophr Bull. (2019) 45:773–83. doi: 10.1093/schbul/sby131
22. Yang C, Zhang A, Jia A, Ma JX, Sun N, Wang Y, et al. Identify abnormalities in resting-state brain function between first-episode, drug-naive major depressive disorder and remitted individuals: a 3-year retrospective study. Neuroreport. (2018) 29:907–16. doi: 10.1097/WNR.0000000000001054
23. Guo W, Liu F, Yu M, Zhang J, Zhang Z, Liu J, et al. Functional and anatomical brain deficits in drug-naive major depressive disorder. Prog Neuropsychopharmacol Biol Psychiatry. (2014) 54:1–6. doi: 10.1016/j.pnpbp.2014.05.008
24. Xu Z, Zhang S, Huang L, Zhu X, Zhao Q, Zeng Y, et al. altered resting-state brain activities in drug-naive major depressive disorder assessed by fmri: associations with somatic symptoms defined by Yin-Yang theory of the traditional Chinese medicine. Front Psychiatry. (2018) 9:195. doi: 10.3389/fpsyt.2018.00195
25. Jones LD, Payne ME, Messer DF, Beyer JL, MacFall JR, Krishnan KR, et al. Temporal lobe volume in bipolar disorder: relationship with diagnosis and antipsychotic medication use. J Affect Disord. (2009) 114:50–7. doi: 10.1016/j.jad.2008.07.003
26. Liu X, Hou Z, Yin Y, Xie C, Zhang H, Zhang H, et al. CACNA1C Gene rs11832738 polymorphism influences depression severity by modulating spontaneous activity in the right middle frontal gyrus in patients with major depressive disorder. Front Psychiatry. (2020) 11:73. doi: 10.3389/fpsyt.2020.00073
27. Sun H, Luo L, Yuan X, Zhang L, He Y, Yao S, et al. Regional homogeneity and functional connectivity patterns in major depressive disorder, cognitive vulnerability to depression and healthy subjects. J Affect Disord. (2018) 235:229–35. doi: 10.1016/j.jad.2018.04.061
28. Wang Y, Zhong S, Jia Y, Zhou Z, Wang B, Pan J, et al. Interhemispheric resting state functional connectivity abnormalities in unipolar depression and bipolar depression. Bipolar Disord. (2015) 17:486–95. doi: 10.1111/bdi.12315
29. Wang L, Dai W, Su Y, Wang G, Tan Y, Jin Z, et al. Amplitude of low-frequency oscillations in first-episode, treatment-naive patients with major depressive disorder: a resting-state functional MRI study. PLoS ONE. (2012) 7:e48658. doi: 10.1371/journal.pone.0048658
30. Liu F, Guo W, Liu L, Long Z, Ma C, Xue Z, et al. Abnormal amplitude low-frequency oscillations in medication-naive, first-episode patients with major depressive disorder: a resting-state fMRI study. J Affect Disord. (2013) 146:401–6. doi: 10.1016/j.jad.2012.10.001
31. Kropf E, Syan SK, Minuzzi L, Frey BN. From anatomy to function: the role of the somatosensory cortex in emotional regulation. Braz J Psychiatry. (2019) 41:261–9. doi: 10.1590/1516-4446-2018-0183
32. Takahashi T, Malhi GS, Wood SJ, Yucel M, Walterfang M, Kawasaki Y, et al. Gray matter reduction of the superior temporal gyrus in patients with established bipolar I disorder. J Affect Disord. (2010) 123:276–82. doi: 10.1016/j.jad.2009.08.022
33. Ratnanather JT, Poynton CB, Pisano DV, Crocker B, Postell E, Cebron S, et al. Morphometry of superior temporal gyrus and planum temporale in schizophrenia and psychotic bipolar disorder. Schizophr Res. (2013) 150:476–83. doi: 10.1016/j.schres.2013.08.014
34. Kandilarova S, Stoyanov D, Sirakov N, Maes M, Specht K. Reduced grey matter volume in frontal and temporal areas in depression: contributions from voxel-based morphometry study. Acta Neuropsychiatr. (2019) 31:252–7. doi: 10.1017/neu.2019.20
35. McNamara RK, Rider T, Jandacek R, Tso P. Abnormal fatty acid pattern in the superior temporal gyrus distinguishes bipolar disorder from major depression and schizophrenia and resembles multiple sclerosis. Psychiatry Res. (2014) 215:560–7. doi: 10.1016/j.psychres.2013.12.022
36. Zhou M, Hu X, Lu L, Zhang L, Chen L, Gong Q, et al. Intrinsic cerebral activity at resting state in adults with major depressive disorder: a meta-analysis. Prog Neuropsychopharmacol Biol Psychiatry. (2017) 75:157–64. doi: 10.1016/j.pnpbp.2017.02.001
37. Wang J, Fan L, Zhang Y, Liu Y, Jiang D, Zhang Y, et al. Tractography-based parcellation of the human left inferior parietal lobule. Neuroimage. (2012) 63:641–52. doi: 10.1016/j.neuroimage.2012.07.045
38. Xue C, Yuan B, Yue Y, Xu J, Wang S, Wu M, et al. Distinct disruptive patterns of default mode subnetwork connectivity across the spectrum of preclinical alzheimer's disease. Front Aging Neurosci. (2019) 11:307. doi: 10.3389/fnagi.2019.00307
39. Vilberg KL., Rugg MD. Memory retrieval and the parietal cortex: a review of evidence from a dual-process perspective. Neuropsychologia. (2008) 46:1787–99. doi: 10.1016/j.neuropsychologia.2008.01.004
40. Sawamura D, Narita H, Hashimoto N, Nakagawa S, Hamaguchi H, Fujima N, et al. Microstructural alterations in bipolar and major depressive disorders: a diffusion kurtosis imaging study. J Magn Reson Imaging. (2020) 52:1187–96. doi: 10.1002/jmri.27174
41. Liang MJ, Zhou Q, Yang KR, Yang XL, Fang J, Chen WL, et al. Identify changes of brain regional homogeneity in bipolar disorder unipolar depression using resting-state FMRI. PLoS ONE. (2013) 8:e79999. doi: 10.1371/journal.pone.0079999
42. Chan YC, Lavallee JP. Temporo-parietal and fronto-parietal lobe contributions to theory of mind and executive control: an fMRI study of verbal jokes. Front Psychol. (2015) 6:1285. doi: 10.3389/fpsyg.2015.01285
43. Stegmayer K, Bohlhalter S, Vanbellingen T, Federspiel A, Wiest R, Muri RM, et al. Limbic interference during social action planning in schizophrenia. Schizophr Bull. (2018) 44:359–68. doi: 10.1093/schbul/sbx059
44. Buckner RL, Andrews-Hanna JR, Schacter DL. The brain's default network: anatomy, function, and relevance to disease. Ann N Y Acad Sci. (2008) 1124:1–38. doi: 10.1196/annals.1440.011
Keywords: bipolar disorder, unipolar depression, amplitude of low-frequency fluctuations, fractional amplitude low-frequency fluctuations, resting-state functional magnetic resonance imaging
Citation: Chai X, Zhang R, Xue C, Li Z, Xiao W, Huang Q, Xiao C and Xie S (2020) Altered Patterns of the Fractional Amplitude of Low-Frequency Fluctuation in Drug-Naive First-Episode Unipolar and Bipolar Depression. Front. Psychiatry 11:587803. doi: 10.3389/fpsyt.2020.587803
Received: 27 July 2020; Accepted: 12 October 2020;
Published: 17 November 2020.
Edited by:
Zsigmond Tamás Kincses, University of Szeged, HungaryReviewed by:
Gianluca Serafini, San Martino Hospital (IRCCS), ItalyYu-Feng Zang, Hangzhou Normal University, China
Copyright © 2020 Chai, Zhang, Xue, Li, Xiao, Huang, Xiao and Xie. This is an open-access article distributed under the terms of the Creative Commons Attribution License (CC BY). The use, distribution or reproduction in other forums is permitted, provided the original author(s) and the copyright owner(s) are credited and that the original publication in this journal is cited, in accordance with accepted academic practice. No use, distribution or reproduction is permitted which does not comply with these terms.
*Correspondence: Chaoyong Xiao, xchaoyong@163.com; Shiping Xie, xieshiping@njmu.edu.cn
†These authors have contributed equally to this work and share first authorship