 Yong Zhang
 Daxun Wang*
 Yan Cai
 Dongbo Tu
- School of Psychology, Jiangxi Normal University, Nanchang, China
Internet addiction disorder has become one of the most popular forms of addiction in psychological and behavioral areas, and measuring it is growing increasingly important in practice. This study aimed to develop a computerized adaptive testing to measure and assess internet addiction (CAT-IA) efficiently. Four standardized scales were used to build the original item bank. A total of 59 polytomously scored items were finally chosen after excluding 42 items for failing the psychometric evaluation. For the final 59-item bank of CAT-IA, two simulation studies were conducted to investigate the psychometric properties, efficiency, reliability, concurrent validity, and predictive validity of CAT-IA under different stopping rules. The results showed that (1) the final 59 items met IRT assumptions, had high discrimination, showed good item-model fit, and were without DIF; and (2) the CAT-IA not only had high measurement accuracy in psychometric properties but also sufficient efficiency, reliability, concurrent validity, and predictive validity. The impact and limitations of CAT-IA were discussed, and several suggestions for future research were provided.
Introduction
Internet addiction (IA) disorder is now recognized as one of the most popular forms of addiction in psychological and behavioral areas. According to a report released by the International Telecommunication Union (2016), with the rapid development of advanced mobile networks, the number of users over the last 3 years has climbed to nearly four billion people, which is equivalent to 47% of the global population. Although the internet brings many benefits, excessive access to the network can lead to internet addiction (IA). A recent meta-analysis reported that the global prevalence of IA is 30.1% among university students pursuing a professional degree (Zhang et al., 2018). In Asia, the prevalence of IA ranged from 6.2% in Japanese adolescents to 21% in Filipino adolescents (Mak et al., 2014b). IA is associated with sleep disturbance (Zhang et al., 2017), poor quality of life (Tran et al., 2017a), and other psychiatric illnesses (Ho et al., 2014). Therefore, the assessment and prevention of IA are particularly important in practice. IA symptoms have been evaluated primarily by questionnaires that have been developed based on classical test theory. The commonly used questionnaires include the Internet Addiction Test (IAT; Young, 1998), Generalized Problematic Internet Use Scale (GPIUS; Caplan, 2002), Gaming Addiction Scale (GAS; Lemmens et al., 2009), and Revised Chen Internet Addiction Scale (CIAS-R; Mak et al., 2014a). The current questionnaires classify IA symptoms into loss of control or of time management (Tran et al., 2017b), craving and social problems (Lai et al., 2013). Although these questionnaires are frequently used in practice, they have certain weaknesses. One of the most notable drawbacks is that participants must finish all of the questionnaire items. However, many items may be “off target” for different test takers (Fliege et al., 2005). For participants with high ability levels, easy items have less contribution to measuring their actual ability level, and as such, these items may be redundant or unnecessary. Meanwhile, for participants with low ability levels, the requirement of responding to the difficult items results in the difficulty to measure their actual ability level. Therefore, it is essential to have a more effective method to evaluate IA.
One way to deal with the above issues is through computerized adaptive testing (CAT), which is a new kind of test that uses item response theory (IRT) to establish an item bank, and then automatically selects items according to the current theta of each participant, and finally estimates the ability of each test taker (Almond and Mislevy, 1999). In CAT, the test-taker continues to take test items until his/her estimated θ reaches a predefined level of precision, as indicated by its standard error. Compared with a linear test, CAT cannot only present items, input answers, and automatically score through the computer but also automatically select the most appropriate items for each responder according to the different answers to items, and then finally reach the most appropriate estimation of ability.
Many studies have shown that a CAT program has several advantages over paper-and-pencil questionnaires. Flens et al. (2016) revealed that compared with paper-and-pencil questionnaires, the number of used items based on CAT procedures decreases by 26–44%. Linacre (2000) pointed out that CAT programs can improve validation, reduce individuals’ burden, and have more excellent measurement precision. In addition, with the selection of items based on a respondent’s current theta, the floor and ceiling effects can be decreased in CAT procedures (Revicki and Cella, 1997). Further, the development of CAT procedures improves clinical assessment. However, CAT also has a number of disadvantages: high costs of research and development, complex technical requirements, and the need for timely maintenance of the item bank to prevent items from leaking in advance (Tan et al., 2018). Nonetheless, the virtues of a CAT program importantly overweigh the defects.
Initially, the development and applications of CAT programs mainly occurred in intelligence and ability testing (e.g., Tinsley, 1972; Ireland, 1977; Young, 1990). In recent years, many researchers have paid attention to the field of mental health. For example, Flens et al. (2017) used the IRT model to assess the Dutch-Flemish version of depression. Smits et al. (2011) established and evaluated CAT procedures for depression based on the Epidemiologic Studies-Depression scale. Walter et al. (2007) developed a German version of Anxiety CAT within IRT. However, to the best of our knowledge, the use of CAT to IA, a common disorder, has not been applied.
This study aimed to develop CAT to assess IA (CAT-IA) without loss of measurement precision. More specifically, this work addressed the following. First, a calibrated item bank with high psychometric qualities was developed. Second, in different stopping rules, we evaluated the psychometric properties, efficiency, reliability, and validity of CAT-IA via two CAT simulation studies. Third, we sought to extend the applications of CAT in the field of mental health and introduce IRT and CAT to readers who want to understand and apply adaptive testing.
Materials and Methods
Participants
The total sample consisted of 1,368 participants. All of the participants were surveyed at different schools in China from June to September 2017. Table 1 reveals the characteristics of the participants. The sample included 687 females (50.2%) and 681 men (49.8%). Their average age was 18.72 years (SD = 2.19, ranged from 12 to 28 years). The participants came from two regions: rural (58.9%) and urban (41.1%).
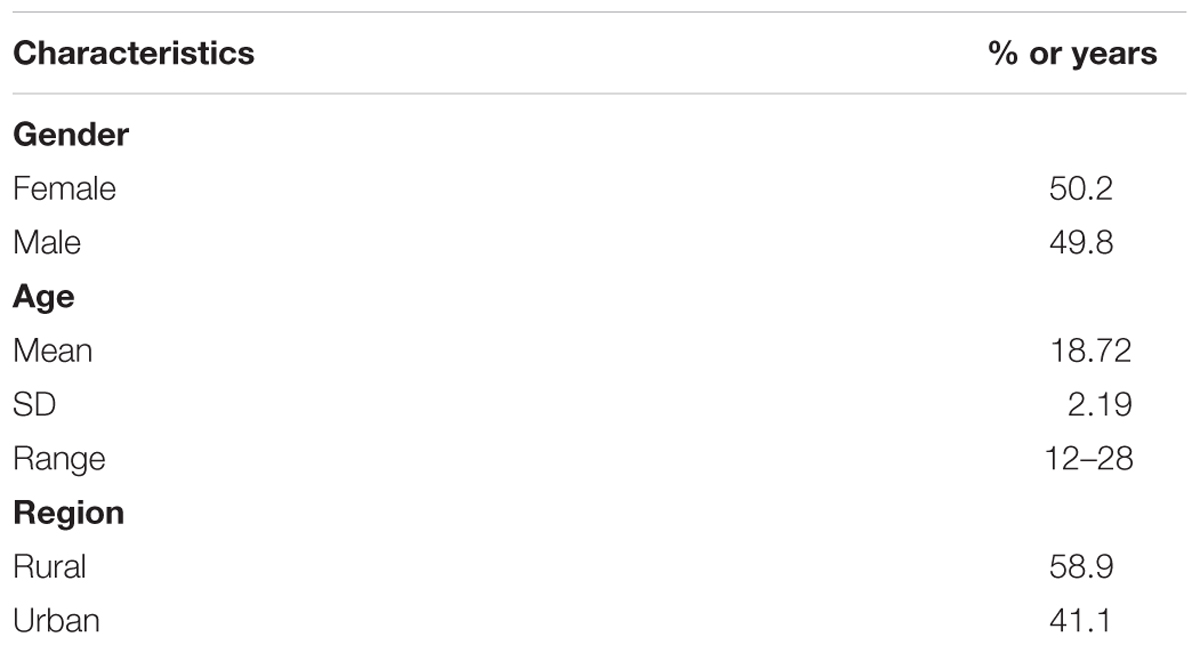
Table 1. The characteristics of participants (n = 1,368).
This study was conducted at the Research Center of Mental Health, Jiangxi Normal University, following the recommendations of psychometrics studies on mental health. It was approved by the Research Center of Mental Health, Jiangxi Normal University and the Ethics Committee of the Department of Psychology at Jiangxi Normal University. Written informed consent was obtained from all of the participants in accordance with the Declaration of Helsinki. Parental consent was also obtained for all participants under the age of 16 years.
Measures and the Initial Item Pool
The initial item pool of CAT-IA consisted of 101 items (see Table 2). These items were selected from four standardized scales: IAT (Young, 1998), GPIUS (Caplan, 2002), GAS (Lemmens et al., 2009), and Chinese Internet Addiction Test (CIAT; Huang et al., 2007). All of them used five-point Likert-type item scores (never, rarely, sometimes, often, always; scored with 1, 2, 3, 4, and 5, respectively). A higher cumulative sum in all of the items represented more severe symptoms of IA. Based on previous studies, 101 items from the four selected standardized scales could be classified into seven domains (Young, 1998; Caplan, 2002; Huang et al., 2007; Lemmens et al., 2009): salience, tolerance, mood modification, relapse, withdrawal, negative outcomes, and benefits (i.e., compared with offline, individuals are more likely to participate in social behavior online and surfing the internet can reduce negative emotions).
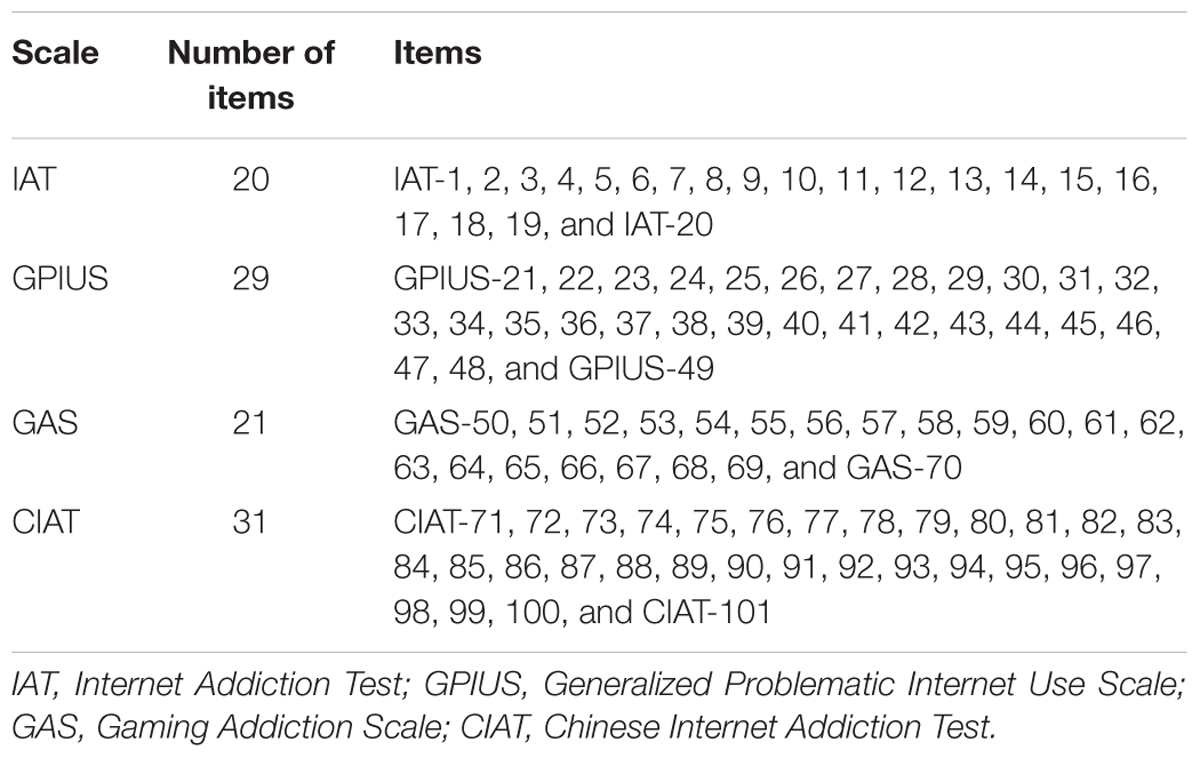
Table 2. Items from four scales.
Item Bank Construction of CAT-IA
To obtain a high-quality item bank, psychometric evaluations were performed on the individuals’ actual data as follows.
Step 1: Test the unidimensional assumption of the item pool.
Unidimensionality means that the test measures only one main latent trait; that is, responses on each item are affected by one main latent trait of the participants (Embretson and Reise, 2013). Both exploratory factor analysis (EFA) and confirmatory factor analysis (CFA) were used to assess the unidimensional assumption. In EFA, the unidimensional assumption is deemed sufficient when the first factor explains at least 20% of the variance (Reckase, 1979), and the ratio of the explained variance in the first and second factor is greater than 4 (Reeve et al., 2007). The CFA of a single-factor was used to assess the unidimensional assumption. We adopted two indicators: factor loading and root mean square error of approximation (RMSEA) estimated by the weighted least square means and variance adjusted method using Mplus7.0 (Muthén and Muthén, 2012). According to the rule of thumb of Browne and Cudeck (1993), the model has a close fit, is fair or acceptable, mediocre, or poor if the RMSEA value is below 0.05, between 0.06 and 0.08, between 0.09 and 0.10, or above 0.10, respectively. We excluded items with factor loadings smaller than 0.4 because factor loadings below 0.4 could easily be over-interpreted (Nunnally, 1978).
Step 2: Select the appropriate IRT model according to the test-level model-fit indices.
Selecting the appropriate model is one of the most important procedures to make valid inferences. In this study, four commonly used polytomous IRT models were considered: Graded Response Model (GRM; Samejima, 1969), Generalized Partial Credit Model (GPCM; Muraki, 1992), Graded Ratings Scale Model (GRSM; Andrich, 1978), and Nominal Response Model (NRM; Bock, 1972). The test-level model-fit indices were used to compare and select IRT models, which included Akaike’s information criterion (AIC; Akaike, 1974), Bayesian information criterion (BIC; Schwarz, 1978), and -2Log-Likelihood (-2LL; Spiegelhalter et al., 1998). The smaller values of these indices showed the better model fit; therefore, the model with the smallest test-fit indices was selected for further analysis. Model selection analysis was done in R package mirt (Version 1.10; Chalmers, 2012).
Step 3: Assess the local independence of the remaining items in the item pool.
Local independence includes two aspects: one is that the response of the same participants (or similar-level participants) to any one item will not be affected by any other items on the same test; and the other is that the responses of different participants (or different-level participants) on the same item do not affect each other (Embretson and Reise, 2013). Currently, the Q3 statistic (Yen, 1993) is commonly used to verify the dependent relationship between items. We calculated the Q3 values of any two items from the item pool under the selected IRT model in Step 2, via R package mirt (Version 1.10; Chalmers, 2012). As suggested by Cohen (2013), Q3 values below 0.36 represented local independence. Hence, one item with Q3 > 0.36 in item pairs was removed.
Step 4: Assess the monotonicity of the remaining items in the item pool.
Monotonicity, meaning that a person with higher latent trait levels raises the possibility of higher scores for an item, was assessed by scalability coefficients for the item pool and individual items via R package Mokken (Version 2.7.7; van der Ark, 2007). According to Mokken (1971), a scale or item has high quality if the scalability coefficient is above 0.3. Items with scalability coefficients below 0.30 were thus eliminated until all of the scalability coefficients exceeded 0.3.
Step 5: Analyze the psychometric characteristics of the remaining items in item pool.
After items were excluded in the above four steps, psychometric characteristics (i.e., item-fit, differential item functioning [DIF], and discrimination) were evaluated for the remaining items. First, the S-X2 statistic (Orlando and Thissen, 2003) was used to exam item fit using R package mirt (Version 1.10; Chalmers, 2012). Second, ordinal logistic regression, a nimbler method in detecting DIF, was used to test DIF for gender (male and female), age (under 18 years, and 18 and above), and region groups (rural and urban), respectively, via R package lordif (Version 0.2-2; Choi et al., 2011). DIF was assessed by means of change in McFadden’s R2 between different groups; items with R2 change greater than 0.02 indicated DIF (Choi et al., 2011). The item parameters, namely, the discrimination (a) and difficulty parameters (b), were estimated under the selected model.
Step 6: Choose high-quality items to develop the final item bank of CAT-IA.
According to the psychometric characteristics in Step 5, poor model-fit (p < 0.01), DIF, and low discrimination items (a < 1.00) were all excluded. This procedure was repeated until no item was excluded.
CAT Simulation
To evaluate the psychometric properties, efficiency, reliability, concurrent validity, and predictive validity of CAT-IA, two CAT simulation studies were carried out. A CAT study is generally composed of six parts: the item bank, item response models, selection methods of initial items, evaluation methods of latent trait, item selection methods, and the stopping rules (Weiss and Kingsbury, 1984). First, the 59-item bank of CAT-IA was established, and the item parameters were estimated under the selected IRT model. Second, an item from the 59-item bank was randomly selected as the initial item to control the exposure rate. Ability estimation methods mainly include maximum likelihood estimation (MLE), weighted likelihood estimation (WLE), maximum a posteriori estimation (MAP), and expected a posterior estimation (EAP) in CAT procedures (e.g., Chen et al., 1998; Wang and Vispoel, 1998; Gorin et al., 2005). The MAP, MLE, and EAP methods regard the maximum point of the likelihood function (or posterior distribution) as the estimated ability value, which may result in multiple extreme points at the beginning of tests (Magis and Raîche, 2010). However, the mean value of the whole posterior distribution is adopted in EAP algorithm. Thus, the information provided by the entire posterior distribution can be effectively utilized, and the stability of the EAP algorithm is higher than that of the other three methods. The EAP method uses the mean value of the entire posterior distribution; therefore, it need not be iterated, and the calculation process is simpler. Compared with the MLE and WLE methods, the EAP method has a larger bias and belongs to biased estimation (Wang et al., 1999). Compared with the EAP method, the main advantage of MAP is that it requires fewer items in the variable-length test, which means that the test is more efficient (Wang and Vispoel, 1998). However, the virtues of the EAP algorithm importantly overweigh its drawbacks. The simplicity and stability of the EAP method makes it an optimal method for CAT simulations (e.g., Warm, 1989; Chen et al., 1998; Bulut and Kan, 2012). Further, maximum information criterion (MIC; Lord, 1980) is the most widely used item selection strategy in CAT programs because of its relatively simple implementation method. The purpose of this strategy is to improve the accuracy of measurement (Brunel and Nadal, 1998), but it can easily lead to uneven exposure of items in the item bank and reduced security of the test (Barrada et al., 2008). Different from the exam, a Likert-type scale without correct answers requires participants to respond in the usual way, which greatly reduces the test security problem. Therefore, MIC was selected as the item selection method in the CAT-IA simulation study. Finally, several stopping rules with different SEs were performed, including None (i.e., the entire item bank was used), SE ≤ 0.2, SE ≤ 0.3, SE ≤ 0.4, and SE ≤ 0.5, respectively.
Simulation Study 1: Psychometric Properties of CAT-IA
When a CAT-IA program is established, its psychometric properties should be evaluated, especially in terms of measurement accuracy. The results of CAT-IA may result in high-risk outcomes that are similar to the entrance exam. Therefore, the Monte-Carlo (MC) simulation method was used to evaluate the performance of CAT-IA. First, the ability of 1,000 virtual persons were generated randomly from the normal distribution (Mean = 0, SD = 1); this sample was regarded as the true ability values. Second, the item parameters of the final 59-item bank and selected IRT model were used to conduct the CAT-IA simulation study. Third, the MC method was used to estimate the ability value of each participant according to the true θ values, selected IRT model and item parameters. These abilities were the estimated values of 1,000 simulated persons. In addition, the CAT-IA performance was evaluated via several statistical indices, including conditional bias (CBIAS), conditional mean absolute error (CMAE), conditional root mean square error (CRMSE), and conditional standard error of estimation (CSEE) across all θ areas (Han, 2018). Simulation study 1 was done in the R package catR (Version 3.12; Magis and Barrada, 2017). These statistical indices for every participant were plotted under different stopping rules using SPSS (Version 23.0; George, 2016).
Simulation Study 2: Efficiency, Reliability, and Validity of CAT-IA
Efficiency and reliability of CAT-IA
To evaluate the efficiency and reliability of CAT-IA, a simulation based on the actual data was carried out via the R package mirtCAT (Version 0.5; Chalmers, 2015). In simulation study 2, the real responses to items were used instead of virtual responses generated by the MC method; the process of simulation study 2 was the same as that in simulation study 1. For each responder, the SE could be calculated in simulation study 2. Green et al. (1984) pointed out that a unitless reliability index is necessary for a CAT, even if this index is somewhat contrived. The index of marginal reliability was proposed by Green et al. (1984) to evaluate effectively the reliability of a CAT under different stopping rules. Marginal reliability is a relatively convenient way to monitor dynamically the reliability of a CAT, and can also be used to evaluate the stability of a CAT (Green et al., 1984). In general, marginal reliability is a function of standard error of measurement (SEM), as shown in formulas (1) and (2). The bigger the marginal reliability is, the smaller the SEM is. Therefore, marginal reliability is crucial for the assessment of SEM and the reliability of measurement in CAT. Marginal reliability is equal to the mean reliability under each stopping rule for all participants (Wainer et al., 2000b). The formula of marginal reliability is defined as:
Where n is the number of all participants, and SE(θi) is the standard error of examinee i at the finally estimated θ. Some statistics were investigated to examine the efficiency and reliability of CAT-IA, including the mean and standard deviation of the used items, mean SE, marginal reliability, and Pearson’s correlations between the estimated θ with the stopping rule of None and the remaining stopping rules. The number of used items with the reliability for every participant was plotted under different stopping rules using the R package ggplot2 (Version 2.2.1; Wickham, 2011).
Concurrent validity and predictive validity of CAT-IA
CAT-IA may take effect when CAT-IA estimation results have a favorable similarity to the results of the existing widely used scales. In other words, a person who is diagnosed with IA in a questionnaire has a higher latent trait in a CAT estimation compared with those without a diagnosis of IA. The similarities were evaluated by concurrent validity and predictive validity of CAT-IA using SPSS (Version 23.0; George, 2016) based on the initial responses that were used to establish the item bank of IA. The concurrent validity was evaluated by the Pearson’s correlations between the estimated θ of CAT-IA and the aggregate scores of each scale. Based on previous studies, only two scales (IAT and GAS) possess the definite diagnostic criteria for IA (Young, 1998; Caplan, 2002; Huang et al., 2007; Lemmens et al., 2009). Individuals whose sum scale scores of IAT exceed 39 are considered as having problematic network usage (Young, 1998). GAS includes seven diagnostic items (Lemmens et al., 2009); individuals with at least four items scoring 4 or 5 are considered to be addicted. The diagnostic results of IAT and GAS were used to compare the estimated results of CAT-IA. Then, the AUC (the area under ROC curve) index was employed to investigate the predictive effect of CAT-IA. According to the rule of Rice and Harris (2005), AUC values below 0.50 represent a small predictive effect; values between 0.51 and 0.70, a moderate predictive effect; and values higher than 0.71, a large predictive effect. In the ROC curve, determination of the critical points adopted the maximal Youden Index (YI = sensitivity + specificity - 1) (Schisterman et al., 2005). The sensitivity indicates the probability of a patient being diagnosed as a patient, and the specificity indicates the probability of a person without the symptoms being diagnosed as a normal person. Sensitivity and specificity are two important reference indicators for the accuracy of critical values, which are both ranged from 0 to 1, with the bigger values representing better predictive validation.
Results
Item Bank Construction of CAT-IA
Unidimensionality
In EFA, the ratio of variance explained by the first factor was 32.44% higher than the critical standard of 20% (Reckase, 1979), and the ratio of variance explained in the first and second factors was 5.89 higher than the critical standard of 4 (Reeve et al., 2007). In the single-factor CFA, five items were removed (see Table 3) owing to their factor loadings of below 0.4 (Nunnally, 1978). Both the EFA and single-factor CFA were again conducted on the remaining 96 items. The EFA results showed the ratio of variance explained by the first factor was 33.87%, and the ratio of variance explained in the first and second factors was 6.14. Results of the single-factor CFA indicated that the RMSEA value was 0.08, indicating that the single factor model was fair or acceptable; all factor loadings were above 0.4. The above results showed that the remaining 96 items, after deleting five items, basically met the unidimensional hypothesis.

Table 3. Reasons for stepwise exclusion of the items.
Model Selection
Table 4 documents the model-fit indices, including -2LL, AIC, and BIC, for the four IRT models. Compared with the other three IRT models, the GRSM fitted the worst in that it had the largest -2LL, AIC, and BIC values. Of the remaining three models, the GPCM model had the worst fitting indices. Although the -2LL value of NRM was smaller than that of GRM, the AIC and BIC values of NRM were both higher compared with the GRM. The GRM model overall fitted the remaining 96-item bank best compared with other three. Therefore, GRM was selected for later analysis.
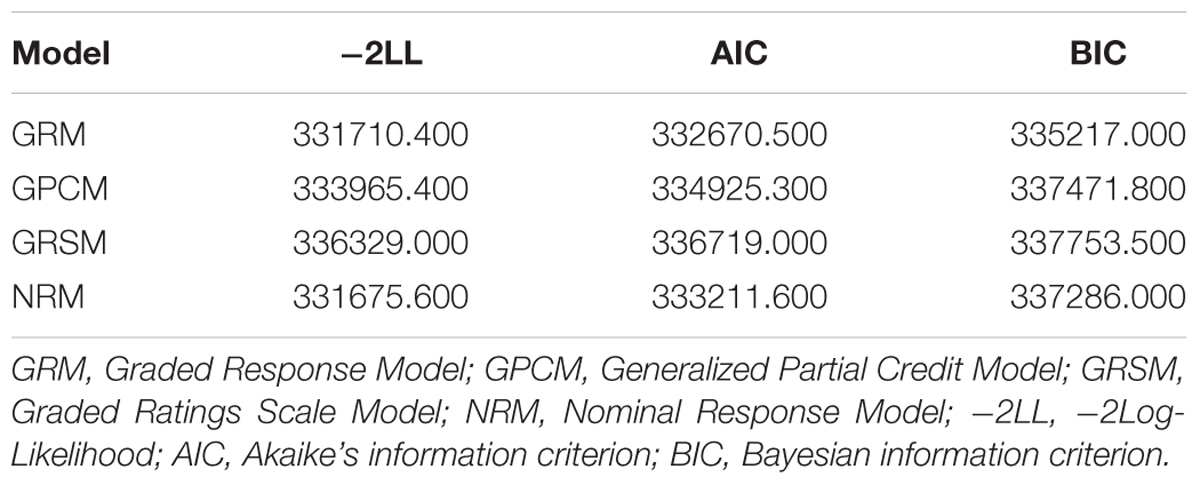
Table 4. Model-fit indices.
Local Independence
A total of 23 pairs of items showed local dependence: their Q3 values were above 0.36 (Cohen, 2013). Thus, 26 items were excluded owing to local dependence, including 2 IAT items, 11 GPIUS items, 10 GAS items, and 3 CIAT items (see Table 3). Then, the Q3 values of the remaining 70-item bank were reassessed, and the results showed all Q3 values were below 0.36.
Monotonicity
The scalability coefficient for the remaining 70-item bank was 0.4, which was higher the requirement of 0.3 (Mokken, 1971). However, for the scalability coefficient of the 70 items, there were still six items (see Table 3) with scalability coefficients below 0.3. After excluding these items, we reevaluated the scalability coefficients, and the results showed that the scalability coefficient of the 64-item bank was 0.39, whereas all scalability coefficients of the 64 items were above 0.3.
DIF
For the region and age groups, no DIF was found for all 64 items; the means of change in McFadden’s R2 between different groups were above the minimum requirement of 0.02 (Choi et al., 2011). However, for the gender group, four items (see Table 3), all belonging to GAS, were flagged for DIF. Therefore, we excluded these items and reassessed the DIF of 60 items. The results showed that the means of change in McFadden’s R2 all were below 0.02 for the region, age, and gender groups.
Item-Fit
Only one item (IAT-2) failed to fit the GRM for having a p-value of S-X2 that was less than 0.01. After removing this item, the remaining 59 items were reevaluated, and the results showed that the p-value of S-X2 of all the 59 items were above 0.01.
Discrimination
Graded Response Model was used again to calibrate the remaining 59 items. The item parameters are listed in Table 5. The discrimination parameters of the 59 items were all above the value of 1 with mean of 1.627 (SD = 14.5), which indicated the final item bank was of a high quality.
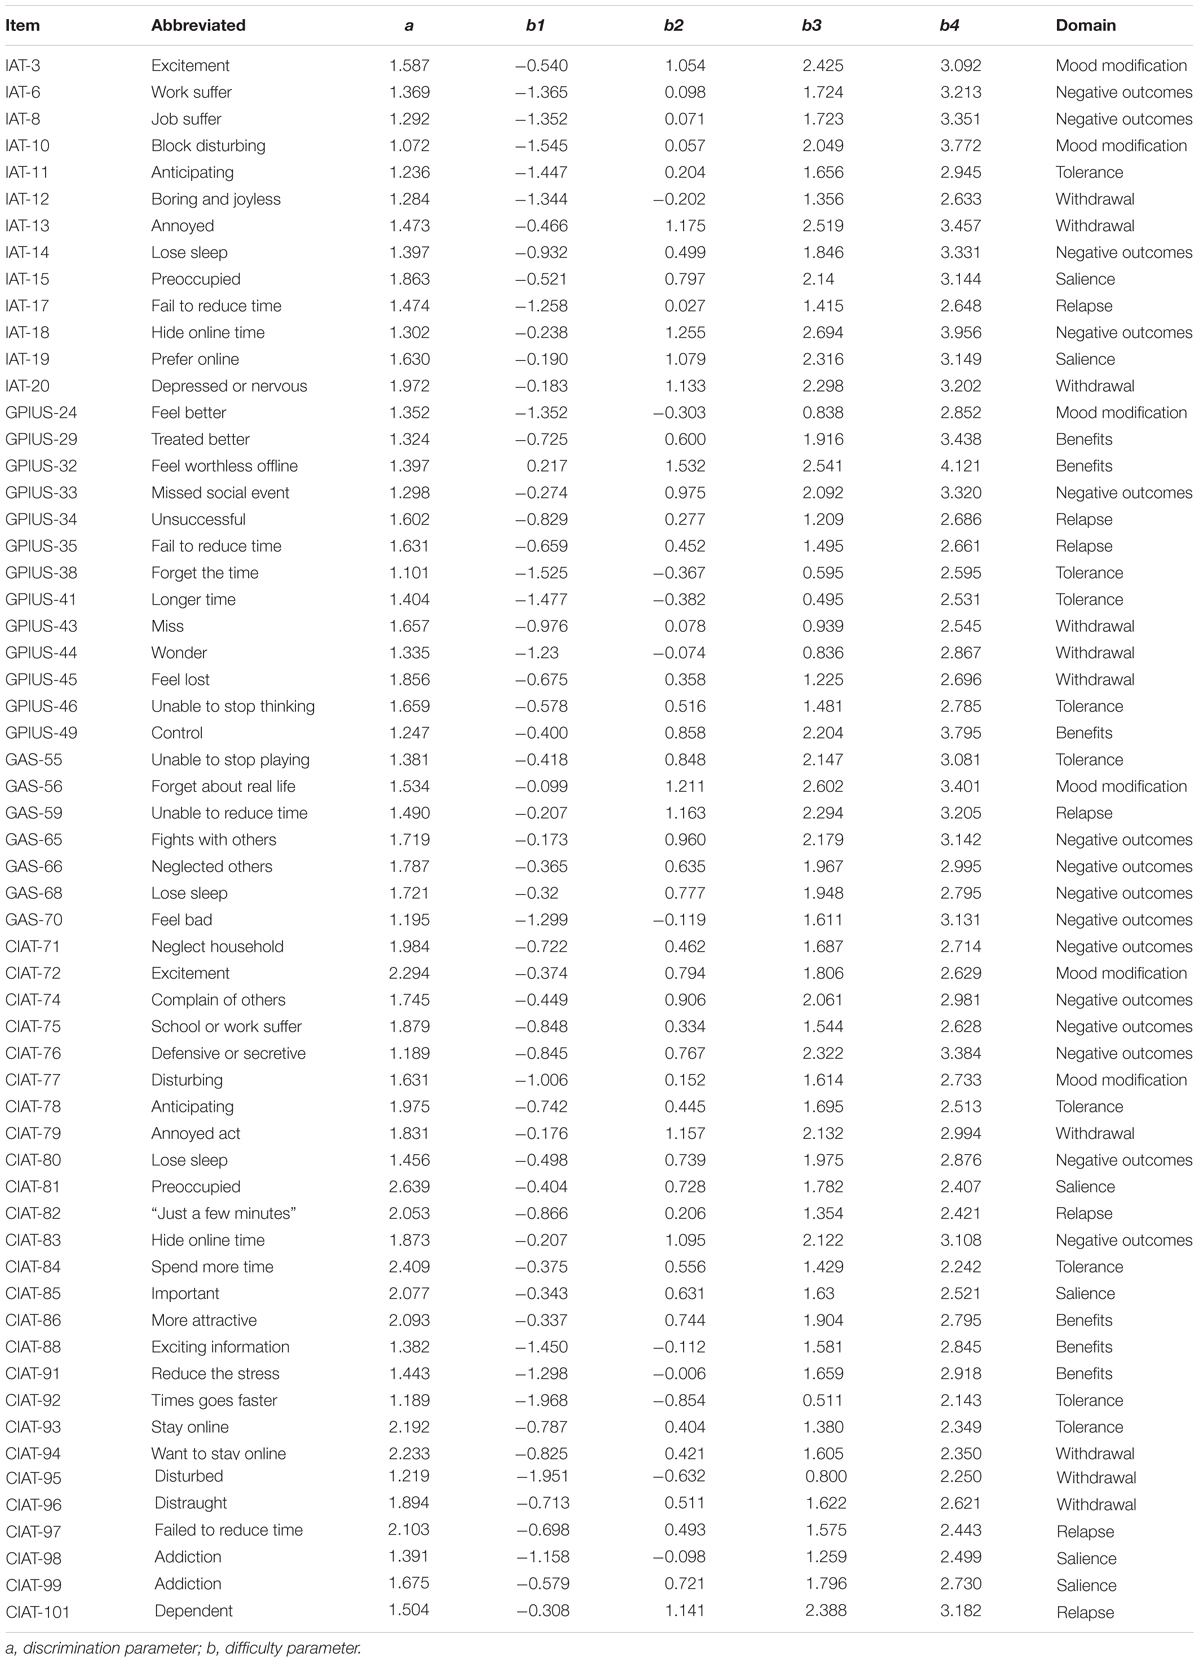
Table 5. Item parameters for 59-item bank with GRM.
After the above steps, the final item bank of CAT-IA included 59 items with high discrimination, good item-fit, no DIF, and meeting the assumptions of IRT. The eighth column in Table 5 shows the domains of the 59 items: 6 items measured salience, 9 items measured tolerance, 6 items measured mood modification, 7 items measured relapse, 10 items measured withdrawal, 16 items measured negative outcomes, and 6 items measured benefits.
Psychometric Properties of CAT-IA
In Table 6, the values of CBIAS, CMAE, CRMSE, and CSEE across all θ areas are displayed under several stopping rules. The second column documents the CSEE values across all θ areas, which ranged from 0.154 to 0.464. The values of CSEE across all θ areas that were less than the corresponding measurement precision decreased as measurement precision was made stricter. The third column reveals the values of CBIAS across all θ areas, which ranged from -0.016 to 0.008. Except for the stopping rule of SE (θ) ≤ 0.5, with CBIAS of -0.016 across all θ areas, the values of CBIAS across all θ areas decreased when the measurement precision was made stricter. The last two columns of Table 6 indicate that the CMAE and CRMSE values across all θ areas varied from 0.125 to 0.359, and 0.160 to 0.456, respectively. The values of CMAE and CRMSE across all θ areas decreased as measurement precision was made stricter, respectively. All these results indicated that the CAT-IA had high measurement accuracy in psychometric properties. The values of CBIAS, CMAE, CRMSE, and CSEE in each θ area under stopping rule SE (θ) ≤ 0.3 are displayed in Figures 1–4. Clearly, as shown in Figure 1, the CSEE values were closely commanded to less than 0.3 at -2 ≤ θ area. The values of CBIAS were inversely proportional to all θ areas. In addition, CBIAS values gradually decreased as the ability increased, as shown in Figure 2. The changing trends of CMAE and CRMSE were approximately consistent across all θ areas, as shown in Figures 3, 4. These results were consistent for all stopping rules.
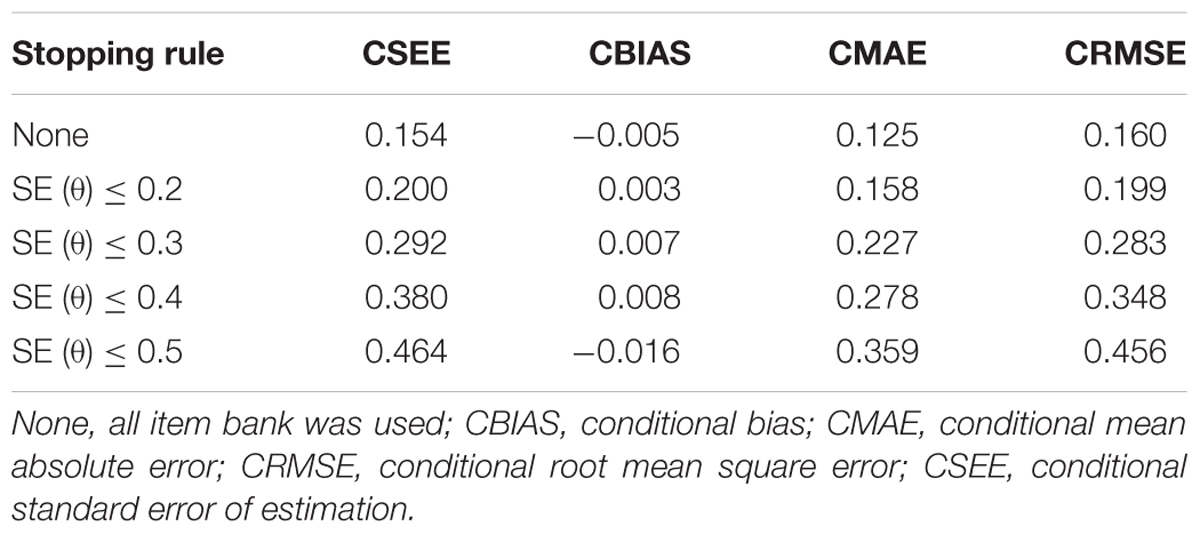
Table 6. The psychometric properties of CAT-IA using CBIAS, CMAE, CRMSE, and CSEE indices across all θ areas.
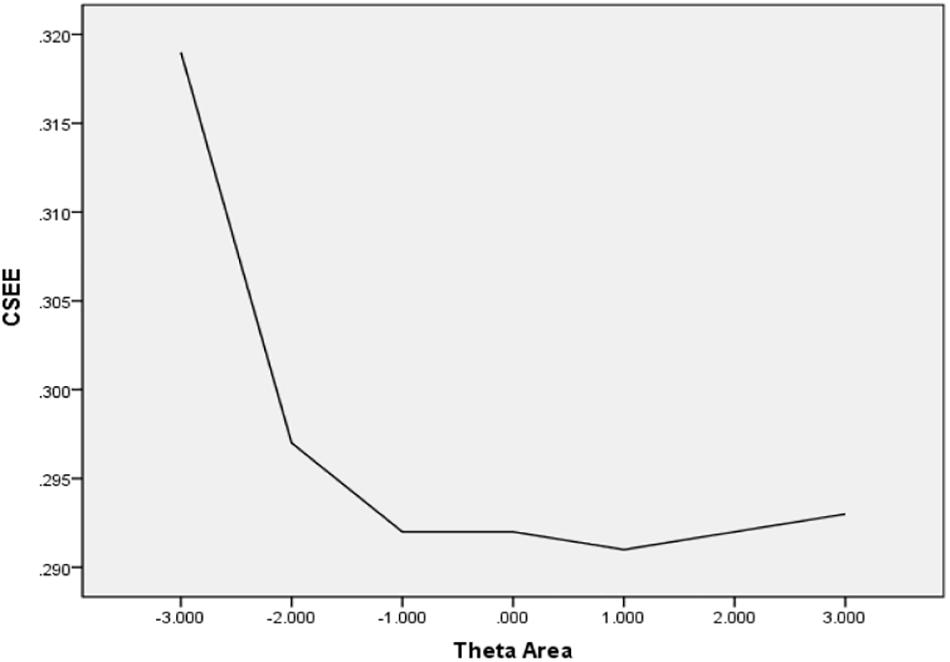
Figure 1. Conditional SEE (average SEE in each theta area).
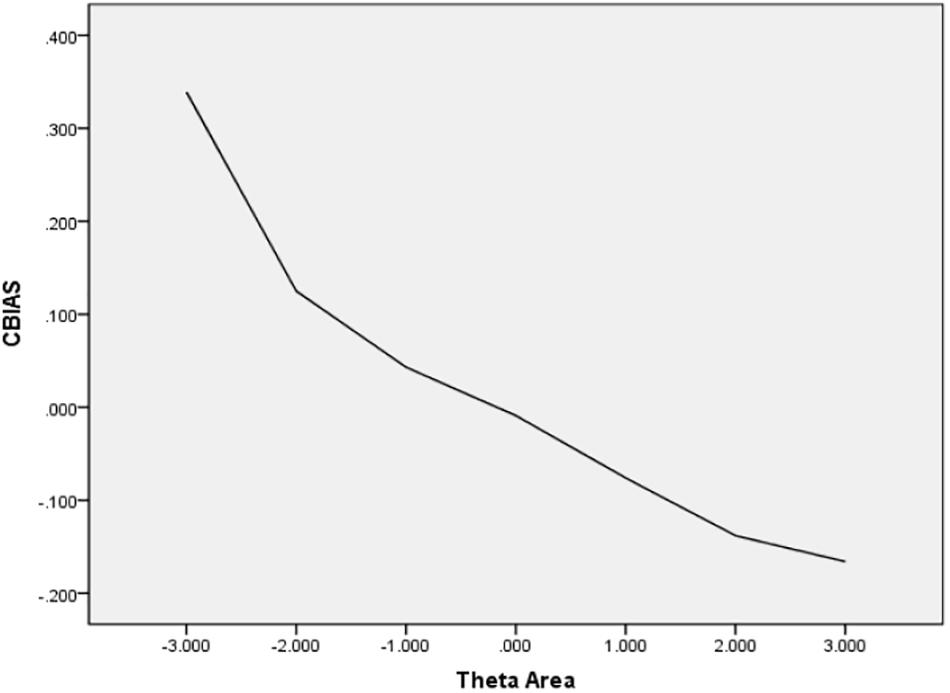
Figure 2. Conditional BIAS (average BIAS in each theta area).
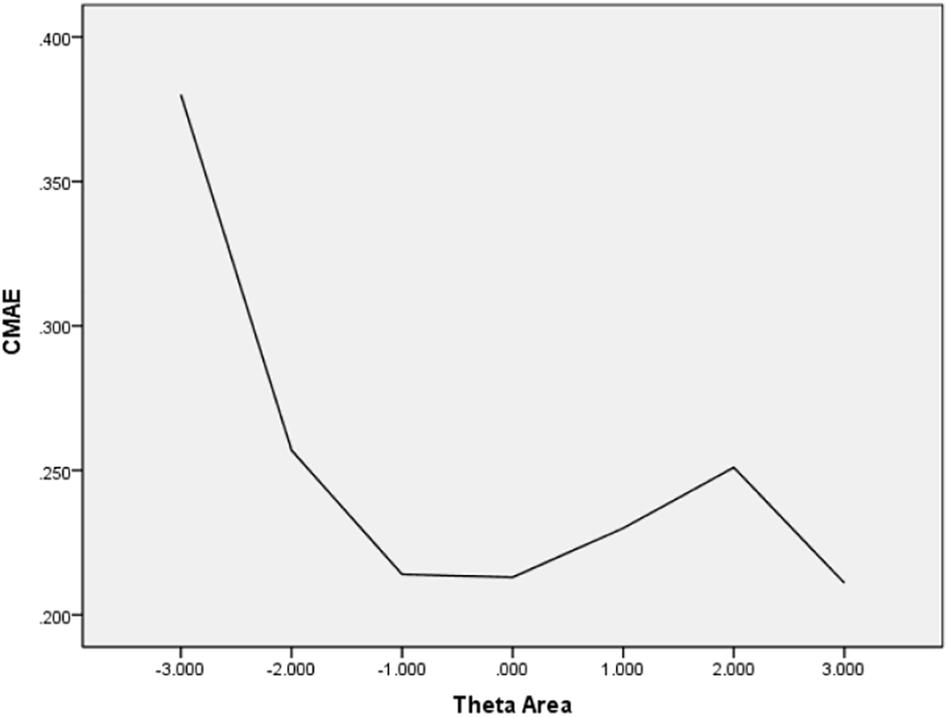
Figure 3. Conditional MAE (average MAE in each theta area).
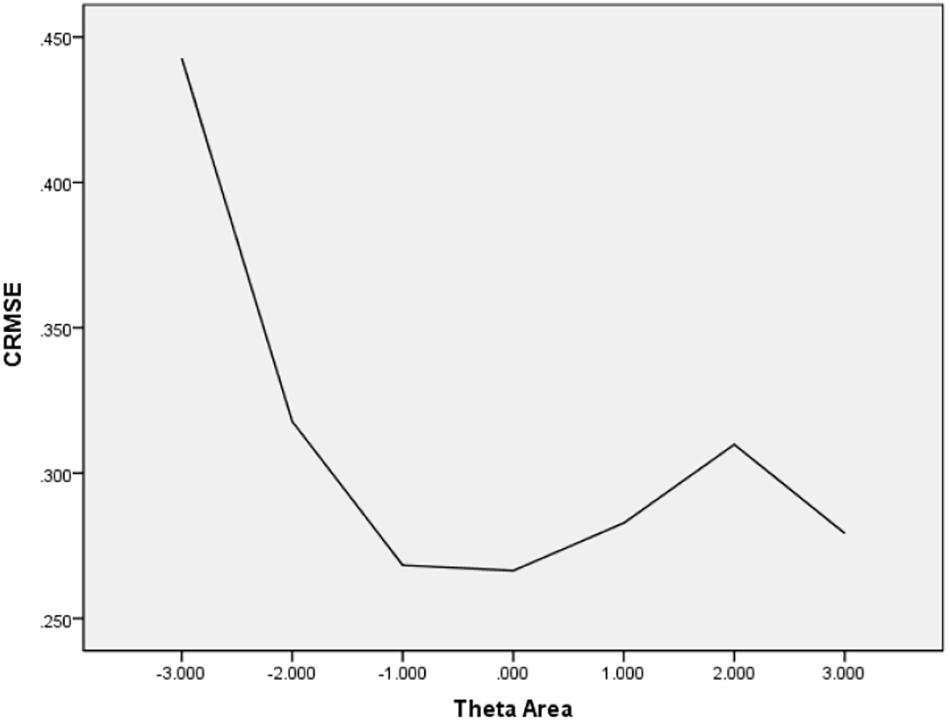
Figure 4. Conditional RMSE (average RMSE in each theta area).
Efficiency, Reliability, and Validity of CAT-IA
Efficiency and Reliability of CAT-IA
In Table 7, the CAT-IA simulation results are displayed under five measurement precision standards. As shown in the second column, the mean and SD of the items used both increased when the measurement precision was made stricter. In the third column, the mean SE of the latent traits for each stopping rule varied from 0.159 to 0.454. Except for the stopping rule of SE (θ) ≤ 0.2, the mean SEs were less than their corresponding measurement precision. Marginal reliability ranged from 0.794 to 0.973 with an average of 0.90, as shown in the fourth column. Evidently, marginal reliability increased as the measurement precision was made stricter. The last column in Table 7 shows the Pearson’s correlation between the estimated θ with stopping rule of None and the remaining stopping rules. The values of Pearson’s correlation ranged from 0.898 to 1 and were all significant at the 0.01 level (two-tailed), which showed that under different stopping rules, the algorithm of CAT-IA was effective. Table 7 also shows that the CAT-IA could greatly save item usage without loss of measurement precision. Under the stopping rule of SE (θ) ≤ 0.2, the Pearson’s correlation between the estimated theta by CAT-IA and the estimated theta by all of the items in the item bank reached 0.990; CAT-IA only used about half of the items (27.655 items) in the item bank. In brief, the CAT-IA saved 53.1% in item usage without loss of measurement precision. Under the two stopping rules of SE (θ) ≤ 0.3 and SE (θ) ≤ 0.4, the Pearson’s correlations were both above 0.90; CAT-IA thus saved 80.7 and 89.9% of item usage, respectively. All these results indicated that the CAT-IA had high efficiency and marginal reliability.
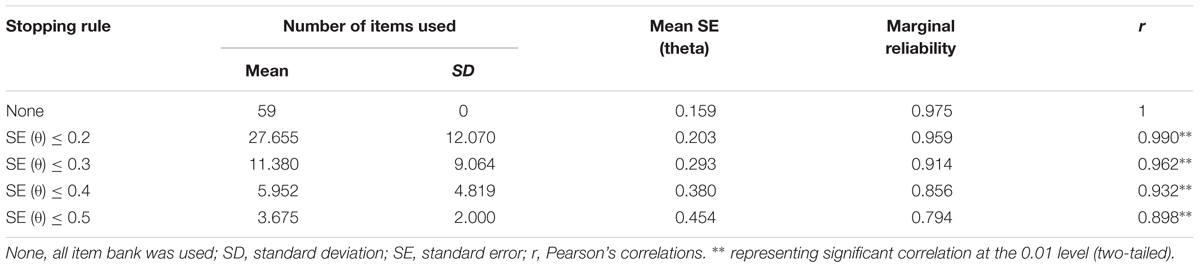
Table 7. CAT simulation statistics for CAT-IA under different stopping rules.
The reliability and number of used items in CAT-IA on levels of the latent trait under stopping rule SE (θ) ≤ 0.3 are displayed in Figure 5. We noted a remarkable connection between the number of used items and reliability. Despite only using about 11.38 items, the CAT-IA obtained high reliability (above 0.9) and high measurement precision for a large number of individuals (estimated theta ranged from -2 to +4). Conversely, when the reliability was below 0.9, more items were used. This result was consistent for all stopping rules.
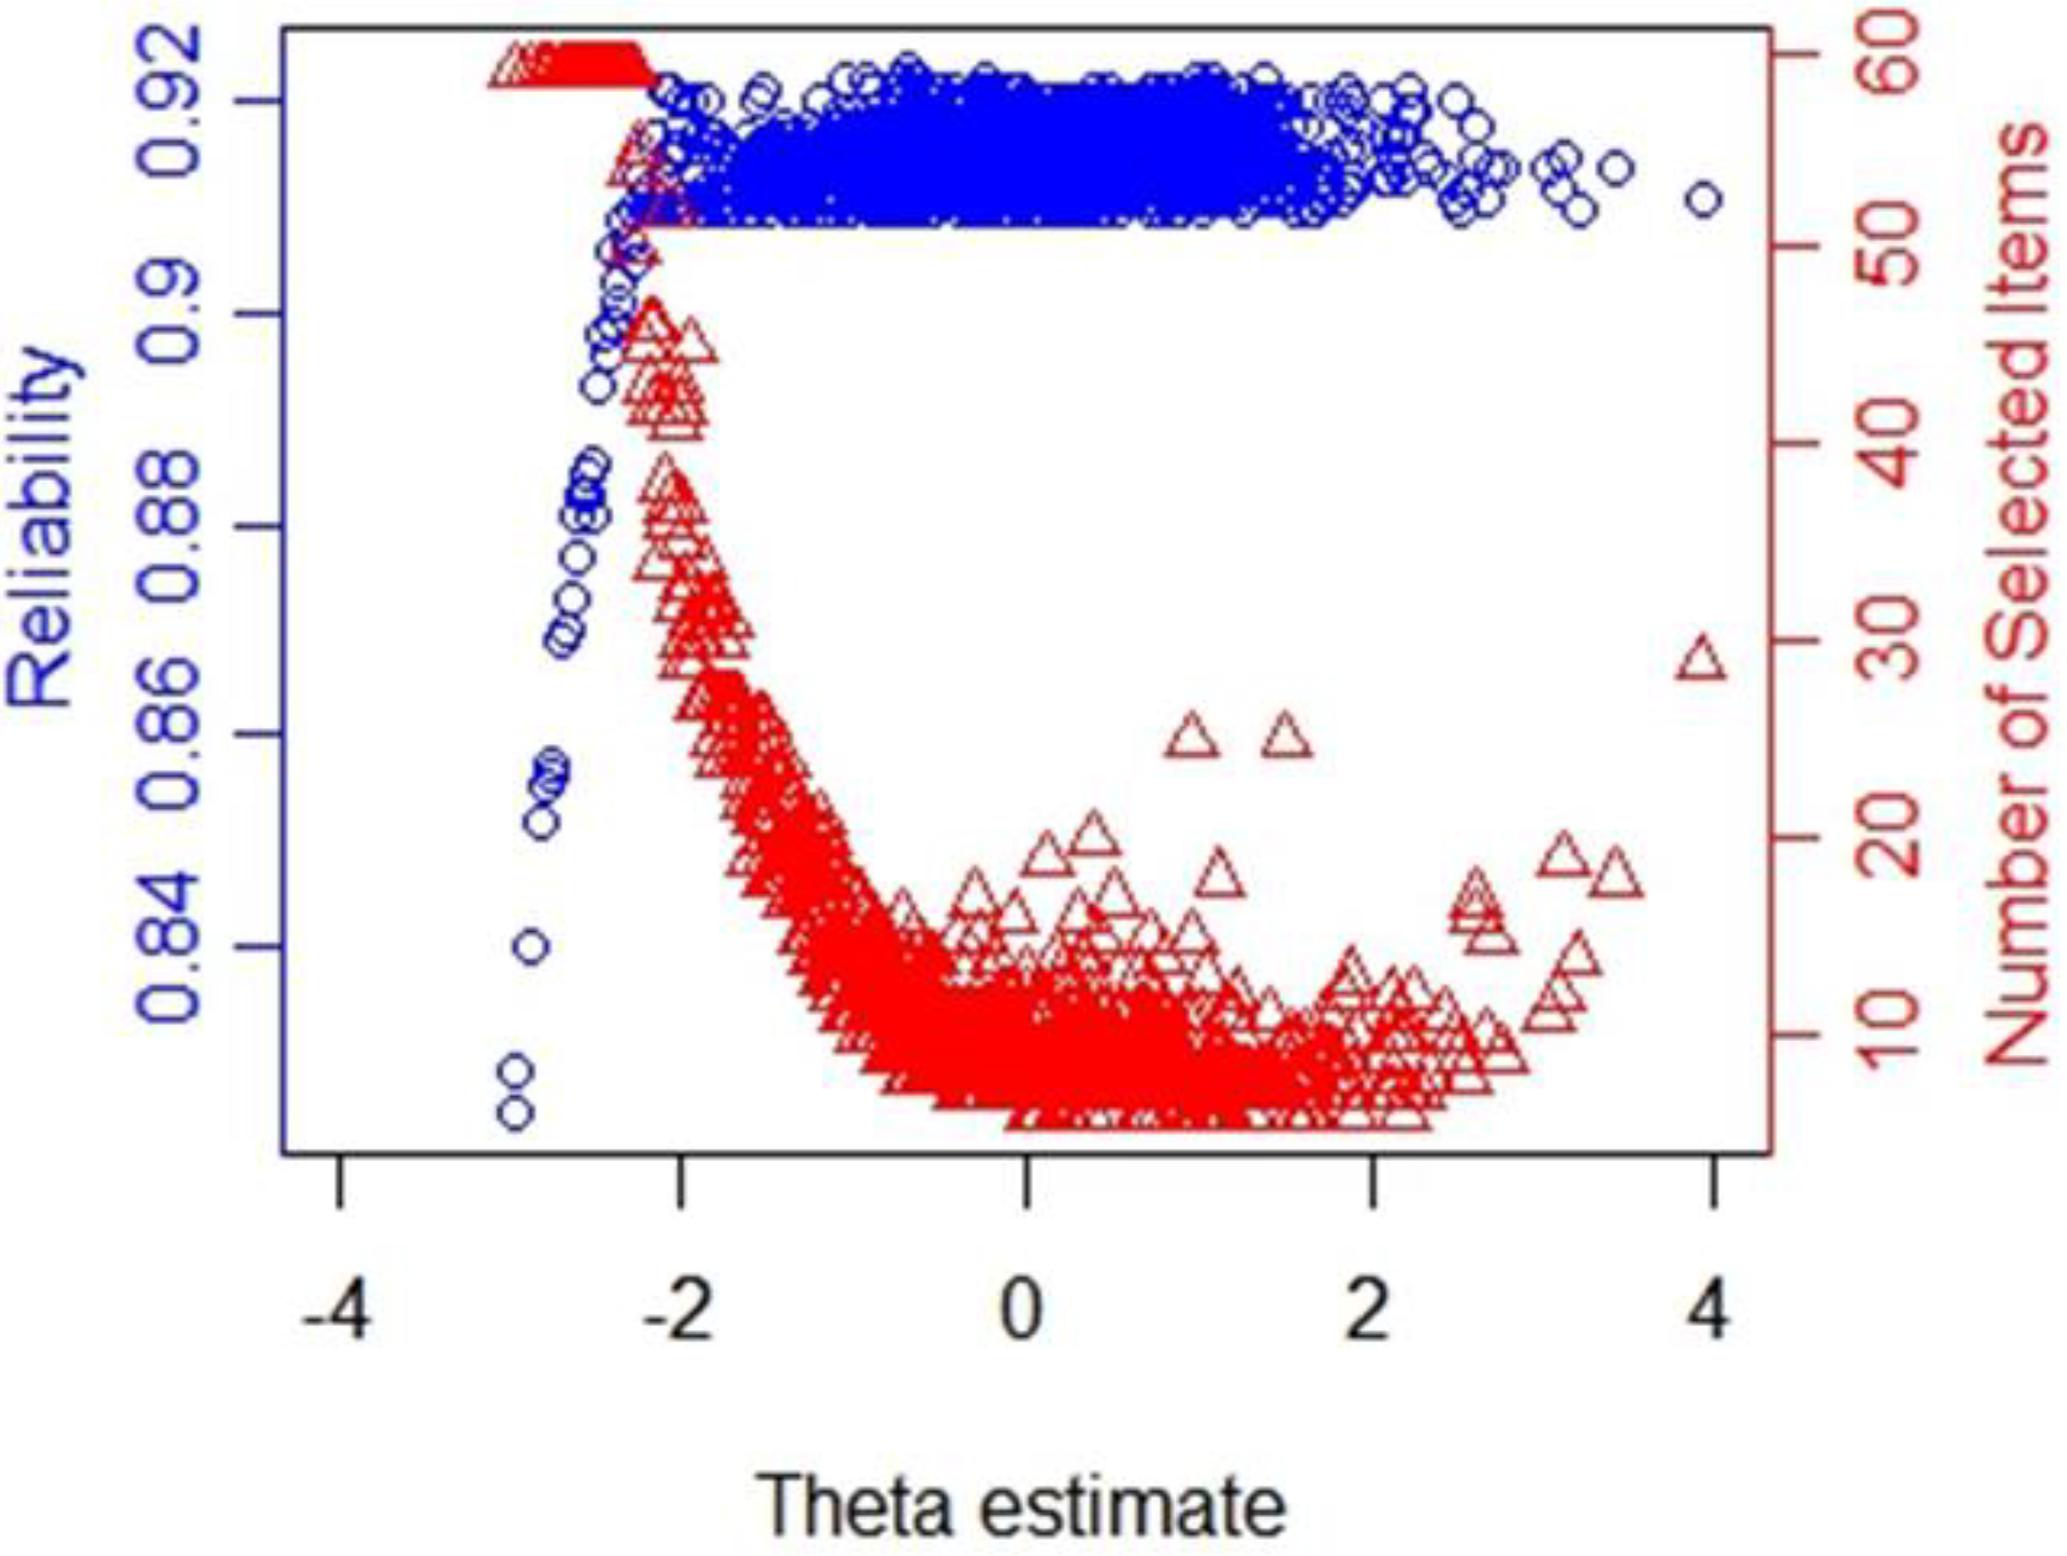
Figure 5. Number of selected items and reliability shown as a function of the final θ estimate under stopping rule SE (θ) ≤ 0.3.
Concurrent Validity and Predictive Validity of CAT-IA
The Pearson’s correlations between the estimated θ of CAT-IA and the aggregate scores of IAT, GPIUS, GAS, and CIAT are documented in Table 8. The values of Pearson’s correlations varied from 0.646 to 0.944 and were all significant at the 0.01 level (two-tailed), which revealed that the CAT-IA had high concurrent validity. In addition, comparing the other scales, the correlation coefficient of CIAT was the highest under each stopping rule, whereas that of GAS was the lowest.
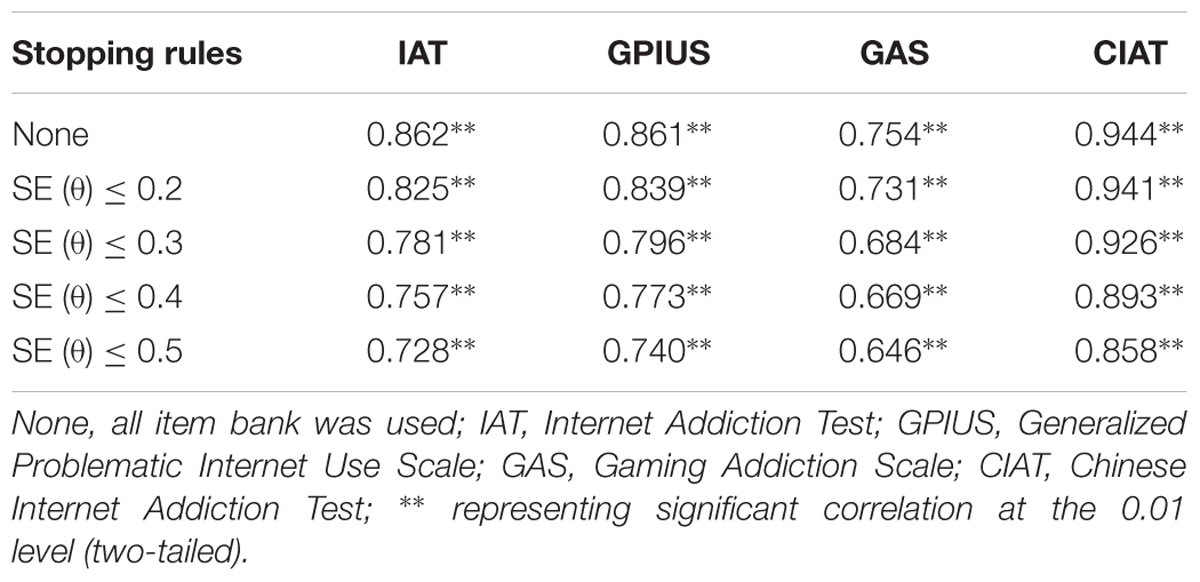
Table 8. Pearson’s correlations between the estimated θ of CAT-IA and the sum scores of four IA scales under different stopping rules.
The results of the predictive validity of CAT-IA are displayed in Table 9. All AUC values (with 95% confidence intervals) were above 0.71, indicating that CAT-IA had a large predictive effect (Rice and Harris, 2005). According to the large predictive effect, the cut-off point of IA was determined under each stopping rule for IAT and GAS, based on the values of sensitivity and specificity. For example, under the stopping rule of SE (θ) ≤ 0.2 in the diagnostic criteria of GAS, if the cut-off point of the 59-item bank was set to 0.801, the sensitivity and specificity of CAT-IA reached 0.922 and 0.862, respectively. These results showed that the CAT-IA had high predictive validity and had strong discrimination between individuals with IA disorder and healthy individuals.
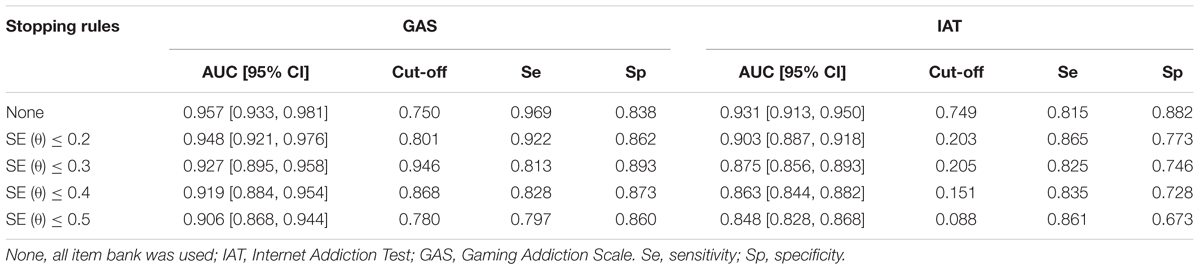
Table 9. Area under the curve Statistics for the IAT and GAS scale under different stopping rules, and 95% confidence intervals.
Discussion
CAT studies have focused on depression or anxiety for clinical individuals in the field of mental health (e.g., Fliege et al., 2005; Flens et al., 2016, 2017). However, to the best of our knowledge, there are no CAT studies on IA. In this research, we developed a CAT-IA to provide a new and effective assessment of IA. The original item bank of IA was subjected to psychometric evaluation; items were excluded until all of the remaining items in the item bank satisfied the requirements of psychometric evaluation. Subsequently, the efficiency, reliability, and validity of the final item bank of the CAT-IA were assessed under different stopping rules. The results showed that the final 59-item CAT-IA item bank met the three IRT assumptions, and possessed high discrimination, good item-model fit, and no DIF. Moreover, the CAT-IA could significantly save testing items and effectively reduce the test burden of participants, while also having high reliability, concurrent validity, and predictive validity.
Kocalevent et al. (2009) demonstrated that simulation and actual results of CAT tend to show high similarity. There are three reasons to implement actual CAT studies under different stopping rules. First, the same participants are used not only to estimate item parameters but also to simulate CAT studies, which could result in overfitting and more optimistic results (Friedman et al., 2010). Second, margin reliability and predictive validity might be overestimated because the data of CAT simulation studies come from the original database. Third, De Beurs et al. (2012) indicated that the results of a test are affected by the measurement tools. The original CAT study was done on a computer, but now it is conducted as a paper-and-pencil survey, which may lead to different outcomes.
When applying CAT-IA in clinical practice or research, CAT-IA may have different reliability results for different observers; that is, individuals of different abilities are provided with different information. For example, in the present study, under the stopping rule SE (θ) ≤ 0.3, reliability was very low and a large number of items were used when the individual has overly high or low abilities, indicating that small differences between two participants with either very high or very low abilities may not be detected, which was similar to Reise and Waller (2009) findings. To prevent the emergence of test bias, the reliability provided by the CAT-IA was set as similar and high for all test-takers. Nonetheless, we recognized the impact of the difficulty parameter distribution under the GRM. For example, in this study, there were no items to match persons whose abilities are below -1.968 in that the minimum value of the difficulty parameters was b1 = -1.968. Therefore, the CAT-IA provided these people with scarce information, and the measurement accuracy and reliability for them were very low despite the use of a large number of items of the 59-item bank. In future studies, researchers can increase the number of items with high or low difficulty parameter to make the difficulty parameter reasonable, which could not only provide high measurement accuracy and reliability for each participant but also greatly reduce the number of selected items for each person.
The standard IRT model is generally based on assumptions of unidimensionality and local independence. However, the single-dimensional and locally independent assumptions in real life may not be completely satisfied. For example, many researchers believe that the factor structure of IA should be multidimensional rather than unidimensional (e.g., Thatcher and Goolam, 2005; Lemmens et al., 2009; Caplan, 2010). Based on local dependency, Wainer et al. (2000a) proposed a widely used 3PL testlet model, in which dependent items did not need to be excluded when the testlet model was used in a CAT. According to these results, future studies can extend the unidimensional CAT into the multidimensional CAT and use the testlet model to solve local dependency between items.
In addition, concurrent validity in the present study was evaluated by Pearson’s correlations between the estimated θ. of CAT-IA and the aggregate scores of each scale. This method can result in item overlap that may overestimate the concurrent validity. Future studies should utilize other external scales to investigate concurrent validity. Further, De Beurs et al. (2012) proved that the same test applied in different situations may lead to changes in the measurement characteristics. Therefore, factorial invariance should be considered in future research. Lastly, although there are many methods for the selection of initial items, with respect to the estimation of latent trait, item selection, and exposure rate, this study failed to address enough methods (such as different parameter estimation and item selection methods), which should be fully considered in future studies.
Ethics Statement
All procedures performed in studies involving human participants were in accordance with the ethical standards of the institutional and/or national research committee and with the 1964 Helsinki Declaration and its later amendments or comparable ethical standards. Informed consent was obtained from all individual participants included in the study. The current study was conducted in conformity to the recommendations of psychometrics studies on mental health at the Research Center of Mental Health, Jiangxi Normal University and approved by the Research Center of Mental Health, Jiangxi Normal University and the Ethics Committee of Psychology Department in Jiangxi Normal University. The written informed consent was obtained from all participants in accordance with the Declaration of Helsinki. All participants gave their written informed consent. The parental consent was also obtained for all participants under the age of 16.
Author Contributions
YZ wrote the manuscript. YC and DT guided the manuscript writing and data processing. DW and XG processed the data.
Funding
This study was funded by the National Natural Science Foundation of China (Grant Nos. 31760288 and 31660278).
Conflict of Interest Statement
The authors declare that the research was conducted in the absence of any commercial or financial relationships that could be construed as a potential conflict of interest.
References
Akaike, H. (1974). A new look at the statistical model identification. IEEE Trans. Automat. Control 19, 716–723. doi: 10.1109/tac.1974.1100705
Almond, R. G., and Mislevy, R. J. (1999). Graphical models and computerized adaptive testing. Appl. Psychol. Meas. 23, 223–237. doi: 10.1177/0146621615590401
Andrich, D. (1978). A rating formulation for ordered response categories. Psychometrika 43, 561–573. doi: 10.1007/bf02293814
Barrada, J. R., Olea, J., Ponsoda, V., and Abad, F. J. (2008). Incorporating randomness in the fisher information for improving item-exposure control in CATs. Br. J. Math. Stat. Psychol. 61, 493–513. doi: 10.1348/000711007x230937
Bock, R. D. (1972). Estimating item parameters and latent ability when responses are scored in two or more nominal categories. Psychometrika 37, 29–51. doi: 10.1007/bf02291411
Browne, M. W., and Cudeck, R. (1993). “Alternative ways of assessing model fit,” in Testing Structural Equation Models, eds K. A. Bollen and J. S. Long. Newbury Park, CA: Sage
Brunel, N., and Nadal, J. P. (1998). Mutual information, fisher information, and population coding. Neural Comput. 10, 1731–1757. doi: 10.1162/089976698300017115
Bulut, O., and Kan, A. (2012). Application of computerized adaptive testing to entrance examination for graduate studies in Turkey. Eurasian J. Educ. Res. 49, 61–80.
Caplan, S. E. (2002). Problematic internet use and psychosocial well-being: development of a theory-based cognitive–behavioral measurement instrument. Comput. Hum. Behav. 18, 553–575. doi: 10.1016/s0747-5632(02)00004-3
Caplan, S. E. (2010). Theory and measurement of generalized problematic internet use: a two-step approach. Comput. Hum. Behav. 26, 1089–1097. doi: 10.1016/j.chb.2010.03.012
Chalmers, R. P. (2012). Mirt: a multidimensional item response theory package for the R environment. J. Stat. Softw. 48, 1–29.
Chalmers, R. P. (2015). mirtCAT: Computerized Adaptive Testing With Multidimensional Item Response Theory. R Package Version 0.6.
Chen, S. K., Hou, L., and Dodd, B. G. (1998). A comparison of maximum likelihood estimation and expected a posteriori estimation in CAT using the partial credit model. Educ. Psychol. Meas. 58, 569–595. doi: 10.1177/0013164498058004002
Choi, S. W., Gibbons, L. E., and Crane, P. K. (2011). Lordif: an R package for detecting differential item functioning using iterative hybrid ordinal logistic regression/item response theory and Monte Carlo simulations. J. Stat. Softw. 39, 1–30.
De Beurs, E., Barendregt, M., Flens, G., van Dijk, E., Huijbrechts, I., and Meerding, W. J. (2012). Equivalentie in responsiviteit van veel gebruikte zelfrapportage meet instrumenten in de geestelijke gezondheidszorg [Equivalence in responsiveness of commonly used self-report questionnaires in mental health]. Maandblad voor de Geestelijke Volksgezondheid 67, 259–264.
Flens, G., Smits, N., Carlier, I., van Hemert, A. M., and de Beurs, E. (2016). Simulating computer adaptive testing with the mood and anxiety symptom questionnaire. Psychol. Assess. 28:953. doi: 10.1037/pas0000240
Flens, G., Smits, N., Terwee, C. B., Dekker, J., Huijbrechts, I., and de Beurs, E. (2017). Development of a computer adaptive test for depression based on the dutch-flemish version of the PROMIS item bank. Eval. Health Prof. 40, 79–105. doi: 10.1177/0163278716684168
Fliege, H., Becker, J., Walter, O. B., Bjorner, J. B., Klapp, B. F., and Rose, M. (2005). Development of a computer-adaptive test for depression (D-CAT). Qual. Life Res. 14, 2277–2291. doi: 10.1007/s11136-005-6651-9
Friedman, J., Hastie, T., and Tibshirani, R. (2010). Regularization paths for generalized linear models via coordinate descent. J. Stat. Softw. 33, 1–22.
George, D. (2016). IBM SPSS Statistics 23 Step by Step: A Simple Guide and Reference. New York, NY: Routledge.
Gorin, J. S., Dodd, B. G., Fitzpatrick, S. J., and Shieh, Y. Y. (2005). Computerized adaptive testing with the partial credit model: estimation procedures, population distributions, and item pool characteristics. Appl. Psychol. Meas. 29, 433–456. doi: 10.1177/0146621605280072
Green, B. F., Bock, R. D., Humphreys, L. G., Linn, R. L., and Reckase, M. D. (1984). Technical guidelines for assessing computerized adaptive tests. J. Educ. Meas. 21, 347–360. doi: 10.1111/j.1745-3984.1984.tb01039.x
Han, K. C. T. (2018). Conducting simulation studies for computerized adaptive testing using SimulCAT: an instructional piece. J. Educ. Eval. Health Prof. 15:20. doi: 10.3352/jeehp.2018.15.20
Ho, R. C., Zhang, M. W., Tsang, T. Y., Toh, A. H., Pan, F., Lu, Y., et al. (2014). The association between internet addiction and psychiatric co-morbidity: a meta-analysis. BMC Psychiatry 14:183. doi: 10.1186/1471-244X-14-183
Huang, Z., Wang, M., Qian, M., Zhong, J., and Tao, R. (2007). Chinese internet addiction inventory: developing a measure of problematic internet use for Chinese college students. Cyberpsychol. Behav. 10, 805–812. doi: 10.1089/cpb.2007.9950
International Telecommunication Union (2016). ICT Facts and Figures 2016. Available at: https://www.itu.int/en/ITU-D/Statistics/Documents/facts/ICTFactsFigures2016pdf (accessed February 2018).
Ireland, C. M. (1977). An Application of the Rasch one Parameter Logistic Model to Individual Intelligence Testing in a Tailored Testing Environment. Ph.D. thesis, ProQuest Information & Learning, Michigan.
Kocalevent, R. D., Rose, M., Becker, J., Walter, O. B., Fliege, H., Bjorner, J. B., et al. (2009). An evaluation of patient-reported outcomes found computerized adaptive testing was efficient in assessing stress perception. J. Clin. Epidemiol. 62, 278–287. doi: 10.1016/j.jclinepi.2008.03.003
Lai, C. M., Mak, K. K., Watanabe, H., Ang, R. P., Pang, J. S., and Ho, R. C. (2013). Psychometric properties of the internet addiction test in Chinese adolescents. J. Pediatr. Psychol. 38, 794–807. doi: 10.1093/jpepsy/jst022
Lemmens, J. S., Valkenburg, P. M., and Peter, J. (2009). Development and validation of a game addiction scale for adolescents. Media Psychol. 12, 77–95. doi: 10.1080/15213260802669458
Linacre, J. M. (2000). “Computer-adaptive testing: a methodology whose time has come,” in Development of Computerised Middle School Achievement Tests, MESA Research Memorandum, Vol. 69, eds S. Chae, U. Kang, E. Jeon, and J. M. Linacre (Seoul: Komesa Press).
Lord, F. M. (1980). Applications of Item Response Theory to Practical Testing Problems. Hillsdale, NJ: Lawrence Erlbaum Associates.
Magis, D., and Barrada, J. R. (2017). Computerized adaptive testing with R: recent updates of the package catR. J. Stat. Softw. 76, 1–19.
Magis, D., and Raîche, G. (2010). An iterative maximum a posteriori estimation of proficiency level to detect multiple local likelihood maxima. Appl. Psychol. Meas. 34, 75–89. doi: 10.1177/0146621609336540
Mak, K. K., Lai, C. M., Ko, C. H., Chou, C., Kim, D. I., Watanabe, H., et al. (2014a). Psychometric properties of the revised chen internet addiction scale (CIAS-R) in Chinese adolescents. J. Abnorm. Child Psychol. 42, 1237–1245. doi: 10.1007/s10802-014-9851-3
Mak, K. K., Lai, C. M., Watanabe, H., Kim, D. I., Bahar, N., Ramos, M., et al. (2014b). Epidemiology of internet behaviors and addiction among adolescents in six Asian countries. Cyberpsychol. Behav. Soc. Netw. 17, 720–728. doi: 10.1089/cyber.2014.0139
Mokken, R. J. (1971). A Theory and Procedure of Scale Analysis: With Applications in Political Research, Vol. 1. Berlin: Walter de Gruyter.
Muraki, E. (1992). A generalized partial credit model: application of an EM algorithm. Appl. Psychol. Meas. 16, 159–176. doi: 10.1177/014662169201600206
Muthén, L. K., and Muthén, B. O. (2012). Mplus Version 7 User’s Guide. Los Angeles, CA: Muthén & Muthén.
Orlando, M., and Thissen, D. (2003). Further investigation of the performance of S-X2: an item fit index for use with dichotomous item response theory models. Appl. Psychol. Meas. 27, 289–298. doi: 10.1177/0146621603027004004
Reckase, M. D. (1979). Unifactor latent trait models applied to multifactor tests: results and implications. J. Educ. Stat. 4, 207–230. doi: 10.3102/10769986004003207
Reeve, B. B., Hays, R. D., Bjorner, J. B., Cook, K. F., Crane, P. K., Teresi, J. A., et al. (2007). Psychometric evaluation and calibration of health-related quality of life item banks: plans for the Patient-Reported Outcomes Measurement Information System (PROMIS). Med. Care 45, S22–S31.
Reise, S. P., and Waller, N. G. (2009). Item response theory and clinical measurement. Annu. Rev. Clin. Psychol. 5, 27–48. doi: 10.1146/annurev.clinpsy.032408.153553
Revicki, D. A., and Cella, D. F. (1997). Health status assessment for the twenty-first century: item response theory, item banking and computer adaptive testing. Qual. Life Res. 6, 595–600.
Rice, M. E., and Harris, G. T. (2005). Comparing effect sizes in follow-up studies: ROC Area, Cohen’s d, and r. Law Hum. Behav. 29, 615–620. doi: 10.1007/s10979-005-6832-7
Samejima, F. (1969). Estimation of latent ability using a response pattern of graded scores. Psychometrika Monograph 17, 5–17. doi: 10.1007/s11336-012-9273-5
Schisterman, E. F., Perkins, N. J., Liu, A., and Bondell, H. (2005). Optimal cut-point and its corresponding youden index to discriminate individuals using pooled blood samples. Epidemiology 16, 73–81. doi: 10.1097/01.ede.0000147512.81966.ba
Schwarz, G. (1978). Estimating the dimension of a model. Ann. Stat. 6, 461–464. doi: 10.1214/aos/1176344136
Smits, N., Cuijpers, P., and van Straten, A. (2011). Applying computerized adaptive testing to the CES-D scale: a simulation study. Psychiatry Res. 188, 147–155. doi: 10.1016/j.psychres.2010.12.001
Spiegelhalter, D. J., Best, N. G., Carlin, B. P., and Van der Linde, A. (1998). Bayesian Deviance, the Effective Number of Parameters, and the Comparison of Arbitrarily Complex Models. Research Report, 98–009. Available at: http://www.med.ic.ac.uk/divisions/60/biointro.asp (accessed February 2018).
Tan, Q., Cai, Y., Li, Q., Zhang, Y., and Tu, D. (2018). Development and validation of an item bank for depression screening in the chinese population using computer adaptive testing: a simulation study. Front. Psychol. 9:1225. doi: 10.3389/fpsyg.2018.01225
Thatcher, A., and Goolam, S. (2005). Development and psychometric properties of the problematic internet use questionnaire. S. Afr. J. Psychol. 35, 793–809. doi: 10.1177/008124630503500410
Tinsley, H. E. (1972). An Investigation of the Rasch Simple Logistic Model for Tests of Intelligence or Attainment. Ph.D. thesis, ProQuest Information & Learning, Michigan.
Tran, B. X., Hinh, N. D., Nguyen, L. H., Le, B. N., Nong, V. M., Thuc, V. T. M., et al. (2017a). A study on the influence of internet addiction and online interpersonal influences on health-related quality of life in young Vietnamese. BMC Public Health 17:138. doi: 10.1186/s12889-016-3983-z
Tran, B. X., Mai, H. T., Nguyen, L. H., Nguyen, C. T., Latkin, C. A., Zhang, M. W., et al. (2017b). Vietnamese validation of the short version of internet addiction test. Addict. Behav. Rep. 6, 45–50. doi: 10.1016/j.abrep.2017.07.001
Wainer, H., Bradlow, E. T., and Du, Z. (2000a). Testlet Response Theory: An Analog for the 3PL Model Useful in Testlet-Based Adaptive Testing. In Computerized Adaptive Testing: Theory and Practice. Netherlands: Springer, 245–269.
Wainer, H., Dorans, N. J., Flaugher, R., Green, B. F., and Mislevy, R. J. (2000b). Computerized Adaptive Testing: A Primer. Abingdon: Routledge.
Walter, O. B., Becker, J., Bjorner, J. B., Fliege, H., Klapp, B. F., and Rose, M. (2007). Development and evaluation of a computer adaptive test for ‘Anxiety’ (Anxiety-CAT). Qual. Life Res. 16, 143–155. doi: 10.1007/s11136-007-9191-7
Wang, T., Hanson, B. A., and Lau, C. M. A. (1999). Reducing bias in CAT trait estimation: a comparison of approaches. Appl. Psychol. Meas. 23, 263–278. doi: 10.1177/01466219922031383
Wang, T., and Vispoel, W. P. (1998). Properties of ability estimation methods in computerized adaptive testing. J. Educ. Meas. 35, 109–135. doi: 10.1111/j.1745-3984.1998.tb00530.x
Warm, T. A. (1989). Weighted likelihood estimation of ability in item response theory. Psychometrika 54, 427–450. doi: 10.1007/bf02294627
Weiss, D. J., and Kingsbury, G. (1984). Application of computerized adaptive testing to educational problems. J. Educ. Meas. 21, 361–375. doi: 10.1177/0146621617707509
Wickham, H. (2011). ggplot2. Wiley Interdiscip. Rev. Comput. Stat. 3, 180–185. doi: 10.1002/wics.147
Yen, W. M. (1993). Scaling performance assessments: strategies for managing local item dependence. J. Educ. Meas. 30, 187–213. doi: 10.1111/j.1745-3984.1993.tb00423.x
Young, J. W. (1990). Adjusting the cumulative GPA using item response theory. J. Educ. Meas. 27, 175–186. doi: 10.1111/j.1745-3984.1990.tb00741.x
Zhang, M. W., Lim, R. B., Lee, C., and Ho, R. C. (2018). Prevalence of internet addiction in medical students: a meta-analysis. Acad. Psychiatry 42, 88–93. doi: 10.1007/s40596-017-0794-1
Keywords: internet addiction, computer adaptive testing, item response theory, questionnaire, CAT-IA
Citation: Zhang Y, Wang D, Gao X, Cai Y and Tu D (2019) Development of a Computerized Adaptive Testing for Internet Addiction. Front. Psychol. 10:1010. doi: 10.3389/fpsyg.2019.01010
Received: 30 October 2018; Accepted: 16 April 2019;
Published: 07 May 2019.
Edited by:
Samuel Greiff, University of Luxembourg, LuxembourgReviewed by:
Ioannis Tsaousis, University of Crete, GreeceRoger Ho, National University of Singapore, Singapore
Copyright © 2019 Zhang, Wang, Gao, Cai and Tu. This is an open-access article distributed under the terms of the Creative Commons Attribution License (CC BY). The use, distribution or reproduction in other forums is permitted, provided the original author(s) and the copyright owner(s) are credited and that the original publication in this journal is cited, in accordance with accepted academic practice. No use, distribution or reproduction is permitted which does not comply with these terms.
*Correspondence: Daxun Wang, 447951689@qq.com Xuliang Gao, gaoxuliang8817@qq.com Yan Cai, cy1979123@aliyun.com Dongbo Tu, tudongbo@aliyun.com