 Lei Wang1,2*
 Qing-Lai Dang2*
- 1Jiyang College, Zhejiang A&F University, Zhuji, Zhejiang, China
- 2Faculty of Natural Resources Management, Lakehead University, Thunder Bay, ON, Canada
Introduction: Climate change-related CO2 increases and different forms of nitrogen deposition are thought to affect the performance of plants, but their interactions have been poorly studied.
Methods: This study investigated the responses of photosynthesis and growth in two invasive maple species, amur maple (Acer ginnala Maxim.) and boxelder maple (Acer negundo L.), to elevated CO2 (400 µmol mol-1 (aCO2) vs. 800 µmol mol-1 (eCO2) and different forms of nitrogen fertilization (100% nitrate, 100% ammonium, and an equal mix of the two) with pot experiment under controlled conditions.
Results and discussion: The results showed that eCO2 significantly promoted photosynthesis, biomass, and stomatal conductance in both species. The biochemical limitation of photosynthesis was switched to RuBP regeneration (related to Jmax) under eCO2 from the Rubisco carboxylation limitation (related to Vcmax) under aCO2. Both species maximized carbon gain by lower specific leaf area and higher N concentration than control treatment, indicating robust morphological plasticity. Ammonium was not conducive to growth under aCO2, but it significantly promoted biomass and photosynthesis under eCO2. When nitrate was the sole nitrogen source, eCO2 significantly reduced N assimilation and growth. The total leaf N per tree was significantly higher in boxelder maple than in amur maple, while the carbon and nitrogen ratio was significantly lower in boxelder maple than in amur maple, suggesting that boxelder maple leaf litter may be more favorable for faster nutrient cycling. The results suggest that increases in ammonium under future elevated CO2 will enhance the plasticity and adaptation of the two maple species.
1 Introduction
Global change can affect the structure and productivity of ecosystems via its effects on the physiological processes of individual plants (Campoy et al., 2021). Elevated atmospheric CO2, nitrogen (N) deposition and plant invasion are drivers of ecosystem changes (Bäurle et al., 2023; de Souza, 2023). A good understanding of plant phenotypic plasticity in response to elevated CO2 and N deposition is essential for predicting the survival and growth of plant species under the predicted future climate conditions (Du et al., 2019; Liu et al., 2022).
Studies have shown that elevated CO2 levels tend to have a fertilization effect on plants (Zhu et al., 2021)However, the increases in photosynthetic rate induced by elevated CO2 do not necessarily always lead to increased biomass accumulation and growth (Skinner et al., 2018; Cabon et al., 2022; Green and Keenan, 2022). Elevated CO2 can result in a downregulation of leaf photosynthetic capacity (maximum rate of ribulose-1,5-bisphosphate carboxylation, Vcmax; maximum of photosynthetic electron transport rate, Jmax) and stomatal conductance (gs) (Sperry et al., 2019; Tcherkez et al., 2020). Photosynthetic downregulation under elevated CO2 is generally resulted from increases in photosynthetic carbohydrate production and subsequent dilution in leaf nitrogen concentration (Yin et al., 2019). Under elevated CO2, the limitation of photosynthesis In C3 plants can shift to RuBP regeneration (indicated by Jmax) from Rubisco carboxylation (indicated by Vcmax) (Dusenge et al., 2019; Smith and Keenan, 2020) although co-limitation by the two processes is generally the norm in most C3 species (Smith and Keenan, 2020). Photosynthesis can also be limited by CO2 diffusions, such as gs and mesophyll conductance (gm) (Sakoda et al., 2021). The adaptability of invasive tree species under elevated CO2 should be fully explored.
Elevated CO2 can inhibit the absorption and assimilation of nitrate but magnify the effects of ammonium addition (Domiciano et al., 2020). Elevated CO2 may affect nitrate assimilation by inhibiting photorespiration because the assimilation process depends on reductants produced by photorespiration (Ainsworth and Long, 2021). Some studies suggest that elevated CO2 directly inhibits the activity of nitrate reductase (Wujeska-Klause et al., 2019). The relative abundance of ammonium and nitrate depends vary with soil type, microbial community, forest successional stage and atmospheric N deposition (Poucet et al., 2021; Wang et al., 2023). Ammonium is generally the main nitrogen source in late successional stages (Bloom, 2015). With the increasing proportion of ammonium in atmospheric N deposition, N source forms become more important in the study of plant response to climate change (Luo et al., 2022).
Plant invasion is also a driver of changes in plant communities associated with global change (Petruzzellis et al., 2021). Invasive plants can benefit more from elevated CO2 than local species and hence climate change can further promote plant invasion and changes in species composition (Rathee et al., 2021). Plants usually have higher phenotypic plasticity in photosynthesis and biomass allocation, especially in key leaf traits (Specific leaf area (SLA), Narea, and net photosynthesis rate (An)) (Onoda et al., 2017; Liu et al., 2022). Invasive plants also have higher capability for resource capture and utilization efficiency by reducing the cost of leaf construction (Barros et al., 2020). Plant invasion threatens biodiversity and ecosystem services (Petruzzellis et al., 2021). However, invasive plants can also lead to soil eutrophication and improve vegetation productivity (Lee et al., 2017). These paradoxes make it difficult to predict the response of plants to future global changes, especially elevated CO2 and different forms of N deposition. It has been found that increases in ammonium in the soil are conducive to plant invasion, but its interaction with elevated CO2 is poorly understood (Chen et al., 2021).
Amur maple (Acer ginnala Maxim.) is native tree species in northeast Asia and is popular as its leaves produce antioxidants similar to that of green tea (Bi et al., 2016). Amur maple has high ornamental value and is widely introduced in North America in the 1960s. Due to its tenacious adaptability, amur maple is listed as an invasive plant species by the Natural Resources Conservation Service and the Forestry Service of the United States Department of Agriculture (USDA, 2005). Boxelder maple (A. negundo L.) is a native pioneer tree species in North America with strong adaptability and has successfully invaded Europe, Asia, South America and Australia (Saccone et al., 2010; McEvoy et al., 2022). Boxelder maple has strong phenotypic plasticity and resource allocation ability but can promote the invasion by other species because of the fast nitrogen cycling of its litter (Porté et al., 2011). A recent genomic study suggests that boxelder maple has a smaller genome with recent gene family evolution which might be related to tendencies (McEvoy et al., 2022). However, there are few studies on the responses of these two invasive maple species to elevated CO2 and N forms. T The purpose of this study was to verify the following scientific questions: 1. Elevated CO2 promoted the photosynthetic rate of two maple trees and changed the biochemical limits of photosynthesis; 2. The morphological plasticity of leaves was sensitive to climate change; 3. Compared with nitrate, ammonium nitrogen was conducive to the growth of two maple under elevated CO2 condition.
2 Materials and methods
2.1 Plant materials and treatments
The seeds of Amur maple and boxelder maple were collected from 6 mature trees at least 50 m apart from each other in the natural forests (amur maple at 48.416N, 89.267W; boxelder maple at 48.429N, 89.261W) near Lakehead University Thunder Bay campus (Ontario, Canada). The seeds were stratified in wet sand at 4°C for about 60 days before being sown in germination trays. Seedlings with 10 cm high were transplanted into 4 L plastic pots filled with a mixture of vermiculite and peat moss (1:1, v:v) (Sun Gro®, 770 Silver Street, Agawam, MA, USA) and were treated with different CO2 and nitrogen form.
The experiment was conducted in four research greenhouses (G1, G2, G3, G4 see Table 1) on the Thunder Bay campus of Lakehead University. The experiment followed a split plot design with two [CO2] levels [ambient 400 µmol mol-1 (aCO2) and elevated 800 µmol mol-1 (eCO2)] as the main plot, and three nitrogen treatments as the split plot (10 mM ammonium, 10 mM nitrate, 10 mM N with equal proportion of ammonium and nitrate) (Table 1). The two tree species were nested within the N-CO2 combination. Each CO2 level had two replicates (two separate greenhouses). Each replicate of each treatment combination had 8 seedlings of each species (a total of 96 seedlings per species: 2 CO2 * 2 replicates * 3 N forms * 8 seedlings).

Table 1 Outline of the experimental design and treatments.
The nitrogen sources used ammonium-sulfonate (NH4)2SO4 for ammonium and sodium-nitrate NaNO3 for nitrate (BioBasic Inc. 20 Konrad Crescent, Markham, ON, Canada). All N treatments received identical amounts of other nutrient elements: 5 mM Potassium phosphate and 4 g L-1 Micromax Micronutrients Granular (Calcium 6%, Magnesium 3%, Sulphur 12%, Boron 0.1%, Copper 1%, Iron 17%, Manganese 2.5%, Molybdenum 0.05%, Zinc 1%) (Everris NA Inc. P.O. Box 3310, Dublin, OH, USA). The extra S provided with the ammonium formulation and the extra Na provided with the nitrate formulation were compensated in the nutrient solution to avoid differences in other elements between the different N treatments. The seedlings were fertilized twice a week and irrigated with 500 ml water within fertilizer according to the corresponding treatment every other day. The seedlings were randomly changed the position within the same greenhouse in each treatment every two weeks.
The CO2 concentration in each greenhouse was maintained using by a CO2 generator (GEN-2E, Custom Automated Products Inc., Riverside, California, USA). Other environmental conditions in all the greenhouses were 25/16°C (day/night) temperature, 50% RH and 16-h photoperiod. High-pressure sodium lamps (P.L. Systems, Grimsby, ON, Canada) were used to supplement then natural light when the ambient light intensity was below 500 µmol m-2 s-1 or the natural daylength was shorter than 16-h. All the environmental variables in each greenhouse were monitored and controlled by an Argus Titan Environment System (Argus Control Systems Ltd. Vancouver, BC, Canada).
2.2 Gas exchange and pigment measurement
After three months treatments, six seedlings were randomly selected from each treatment combination and foliar gas exchange was measured between 9:00 am and 16:00 pm on a unshaded mature leaf on the near the top of the canopy using a LI-6800 Portable Photosynthesis System (LI-COR Biosciences, 4647 Superior Street, Lincoln, Nebraska, USA). The gas exchange under treatment CO2 was measured at the corresponding growth [CO2] (aCO2 at 400 µmol mol-1, eCO2 at 800 µmol mol-1), 25°C temperature, 1.1 - 1.3 kPa water vapor pressure deficit, 1000 µmol m-2 s-1 photosynthetically active radiation flux density. At least 30 minutes was allowed before a steady state reading was taken. The net photosynthetic rate (An-g), stomatal conductance (gs), intercellular [CO2] to ambient [CO2] ratio (Ci/Ca), and photosynthetic nitrogen uses efficiency (PNUE = An-g/Narea) were subjected to statistical analyses.
Photosynthetic response to intercellular [CO2] (A/Ci) curves were measured at 400, 300, 200, 100, 50, 400, 500, 600, 800, 1000, 1200, 1500 µmol mol-1 [CO2], 25°C temperature, 1.1 - 1.3 kPa VPD, and 1000 µmol m-2 s-1 PAR. The maximum rate of Rubisco carboxylation Vcmax and maximum rate of photosynthetic electron transport Jmax were estimated using the fitaci function, and the transition point (Ci-t, An-t) of biochemical limitation from Rubisco to RuBP regeneration was estimated using findCiTranstion function in the Plantecophys R package from A/Ci data (Duursma, 2015). The initial slope of A/Ci was estimated as apparent carboxylation efficiency (ACE), and the X-axis intercept was evaluated as the CO2 compensation point (ΓACi).
The photosynthetic light response curve (lrc) was measured at 400 µmol mol-1 [CO2] and 1000, 1500, 1200, 900, 600, 300, 150, 50, 0 µmol m-2 s-1 PAR (Figure 1A). Other measurement environment conditions were the same as A/Ci curve measurement. Curvature (θ) and photosynthetic rate of saturation light (An-max) were fitted from the lrc data by non-rectangular hyperbola model using non-linear least squares in R (Salter et al., 2019). The initial slope of the lrc was estimated as the apparent quantum yield (AQY) and the X-axis intercept was estimated as the light compensation point (LCP). The fitting line of An vs. Ci from lrc dataset (Figure 1B) was used to estimate An-total by the Y-axis intercept and An-total/Ca as the initial slope (Wang and Dang, 2023).
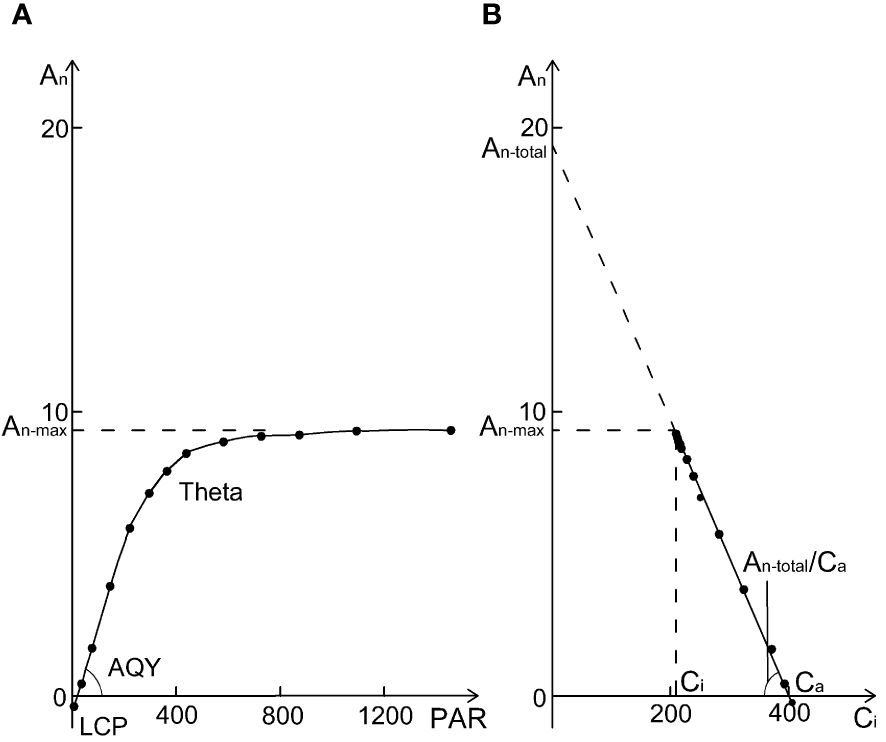
Figure 1 A sample of a photosynthetic light response curve (lrc) with relevant parameters (A) the photosynthetic rate at saturation light and 400 µmol mol−1 CO2 (An-max), the curvature of the lrc (Theta, θ), apparent quantum yield (the initial slope of lrc, AQY), and light compensation point (LCP). An vs. Ci derived from the lrc database (B), where An-total and An-total/Ca are the y-intercept and slope of the An - Ci regression line. From (B), An-total/Ca = An-max/(Ca - Ci), so An-max/An-total = (Ca - Ci)/Ca, which means that An-max/An-total + Ci/Ca = 1.
The initial line portions of three A/Ci were measured with 200, 150, 100, and 50 µmol mol-1 of [CO2], and 300, 150, and 75 µmol m-2 s-1 PAR, from which the daytime respiratory rate (Rd) and intercellular CO2 compensation point (Ci*) were calculated using Walker’s slope intercept method (Walker et al., 2016). The variable J method was employed to calculate mesophyll conductance (gm) (Harley et al., 1992), using the equation Γ* = Ci* + Rd/gm ( (Walker et al., 2016), where Γ* is the CO2 compensation point in absence of day respiration.
After the gas exchange measurement, the tested leaves were immediately removed and stored in a refrigerator (-70°C). Leaf pigment was extracted using 80% acetone and the absorbance at 645 nm and 663 nm measured. Chlorophyll concentration (Chl) of the leaves was calculated with Chl = 20.2 * A645 + 8.02 * A663 (Wellburn, 1994).
2.3 Relative photosynthetic limitation and nitrogen partitioning
The relative limitations of photosynthesis by biochemical (lb), mesophyll conductance (lm) and stomatal conductance (ls) were calculated according to Grassi and Magnani (Grassi and Magnani, 2005): lb = gt/(gt + әAn/әCc); ls = (gt/gs * әAn/әCc)/(gt + әAn/әCc); lm = (gt/gm * әAn/әCc)/(gt + әAn/әCc), where gt is the total conductivity of CO2 diffusion (gt = 1/(1/gm + 1/gs)), әAn/әCc is the initial slope of the An to Cc response curve and was calculated using the equation әAn/әCc = Vcmax/(Γ* + Km) (Farquhar et al., 1980), where Γ* was as noted previously and Km was calculated by Km = Kc (1 + O/Ko) (Bernacchi et al., 2001).
We investigated the partitioning of leaf N into carboxylation (Ncb), electron transfer (Net), light capture (Nlc) and respiration (Nresp). The calculation is based on Trouwborst’s method (Trouwborst et al., 2011).
2.4 Biomass and nitrogen measurement
After three months CO2 and nitrogen form treatments, the height of all the seedlings was measured. Leaf area was measured using a Regent WinFolia system (Regent Instruments Inc., Quebec City, QC, Canada). The seedlings were then harvested and separated into roots, stems, and leaves, and oven-dried at 75°C for 48 hours to constant weight to determine the biomass of different organs and specific leaf area (SLA). Leaf mass-based N concentration (Nmass) and carbon concentration (C) were measured using the dry combustion method on a CNS-2000 (LECO Corp., St. Joseph, MI, USA) at the Lakehead University Centre for Analytical Services. Area-based leaf N concentration (Narea) and total leaf N content per plant (Nleaf) were determined from leaf biomass and SLA.
2.5 Statistical analysis
The effects of CO2 and N forms on photosynthetic and growth traits of individual tree species were investigated using two-way analysis of variance using the agricolae package in R. A three-way (CO2, N forms and species) ANOVA was performed for An-g and PNUE. Logarithmic or power transformation was used to transform variables that did not meet the normality and homogeneity assumptions before ANOVA was carried out. When a interaction was statistically significant, Tukey post hoc pairwise comparisons were conducted for the means. The principal component analysis (PCA) function of the FactoMineR package was used for PCA to investigate the relationship and clustering of physiological and growth-related parameters. The Bowen method (Bowen et al., 2017) was used to investigate the direct/indirect effects of CO2 and N sources as categorical variables on biomass and An-g using the structural equation model (SEM) and the psem function in the pieceweSEM package (Lefcheck, 2016). Based on the leaf economic spectroscopy (LES) and a prior structural model (Onoda et al., 2017; Liu et al., 2022), biomass was explained by An-g, Narea and SLA, and An-g was explained by photosynthetic capacity, Chl and gt. The photosynthetic capacity was obtained by the regression equations from Vcmax and Jmax. All the statistical analyses were performed using R.
3 Results
3.1 Growth in response CO2 and N form
The eCO2 significantly increased the biomass of both maple species but the effect was much bigger seedlings fertilized with NH4 or a combination of NH4 and NO3 than those fertilized with NO3 only (Figure 2). While the general response patterns were similar in the two species, there were differences in the responses between the two species: under the aCO2, no significant effect of N form on the biomass was observed in amur maple (Figure 2A) but it was significantly lower in the boxelder maple seedlings that were supplied with ammonium only than those of seedlings that were fertilized with the other two N treatments (Figure 2B); Under eCO2 treatment, the nitrate nitrogen only treatment significantly decreased the biomass of both maple species (Figure 2). CO2 treatment significantly affected seedling height and leaf area (Tables 1, 3). However, these values of the boxelder maple were influenced by the interaction of the two treatments and showed a trend similar to that of biomass (Table 3). In general, the eCO2 treatment significantly reduced SLA, except for amur maple treated with nitrate and boxelder maple treated with ammonium (Tables 2, 3).
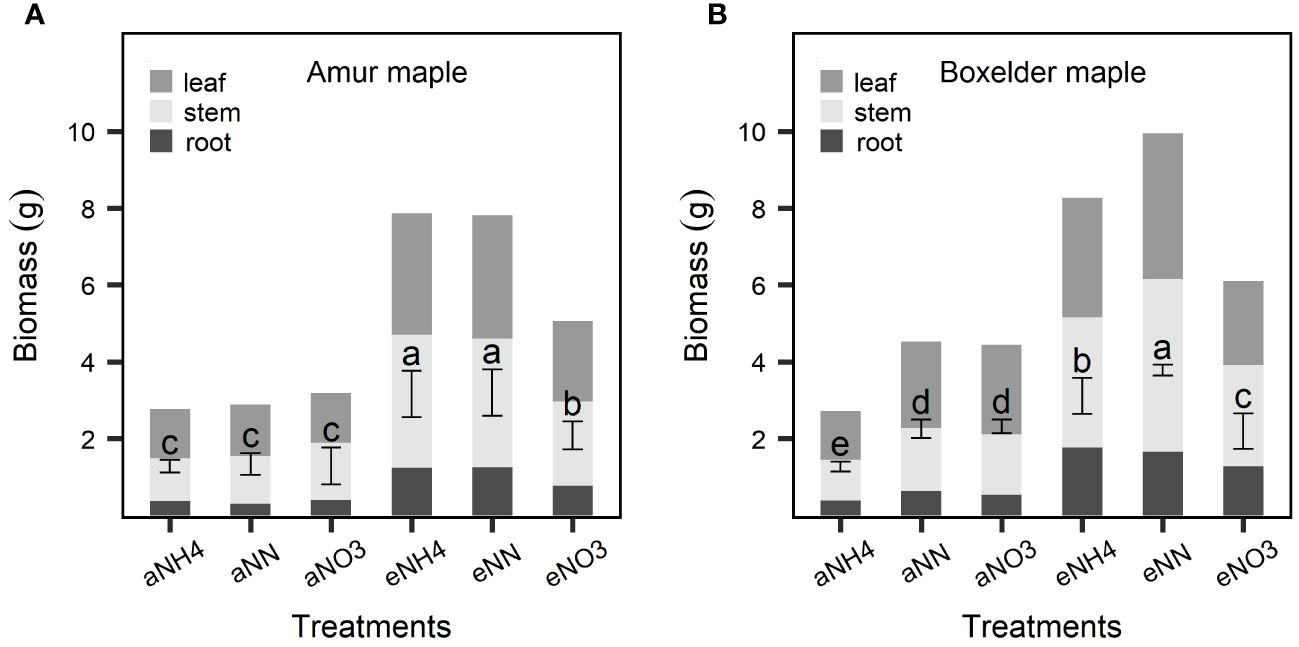
Figure 2 Biomass responses to CO2 and N form treatments in amur maple (A) and boxelder maple (B). “a-” means ambient CO2 (400 µmol mol−1) and “e-” means elevated CO2 (800 µmol mol−1) treatments. NH4: fertilized 10 mM (NH4)2SO4; NN: fertilized with a combination of 5 mM (NH4)2SO4 and 5 mM NaNO3; NO3: fertilized with 10 mM NaNO3. Means (± SE, n=6) with different letters indicated significant differences between treatments (Tukey host hoc test, P<0.05).
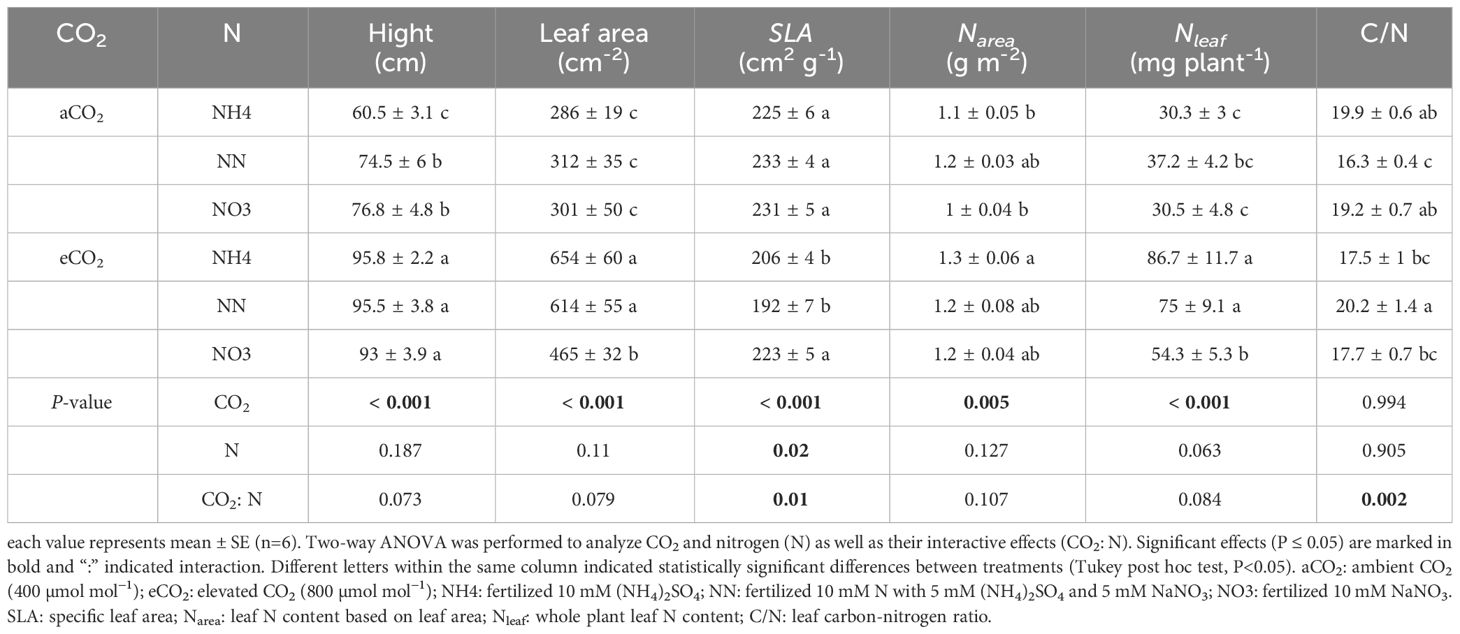
Table 2 Height, leaf area, specific leaf area (SLA), and nitrogen-related traits of amur maple seedlings at ambient and elevated CO2 in response to different forms of N supply.
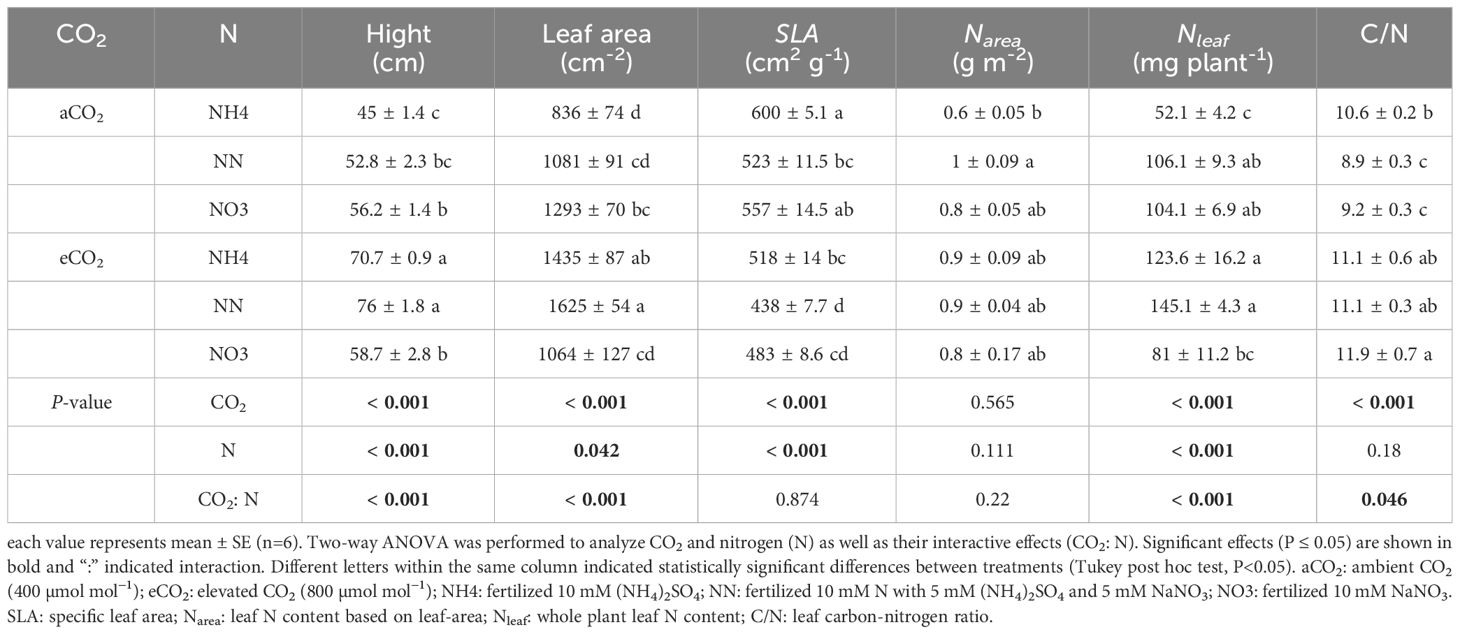
Table 3 Hight, leaf area, specific leaf aera (SLA), and nitrogen-related traits of boxelder maple grown at ambient and elevated CO2 response different forms of N supply.
3.2 Leaf nitrogen and PNUE
Treatment of eCO2 significantly increased Narea in amur maple (Table 2) but not in boxelder maple (Table 3). In general, eCO2 treatment promoted the Nleaf of the two tree species with the except of boxelder maple fertilized with nitrate (Table 3). The eCO2 treatment significantly promoted the leaf C/N value of boxelder maple (Table 3) but not of amur maple (Table 2).
Amur maple distributed relatively larger proportions of leaf N to Ncb, Net and Nlc than did of boxelder maple while N allocation to Nresp was larger in boxelder maple than amur maple (Figure 3). Nitrate and eCO2 treatment slightly limited leaf N allocation to carboxylation in both species (Figure 2). In general, the PNUE of boxelder maple was higher than that of amur maple, except for NN treatment under aCO2 and nitrate treatment under eCO2 (Figure 4A). Ammonium significantly reduced PNUE in amur maple under aCO2 treatment (Figure 4A).
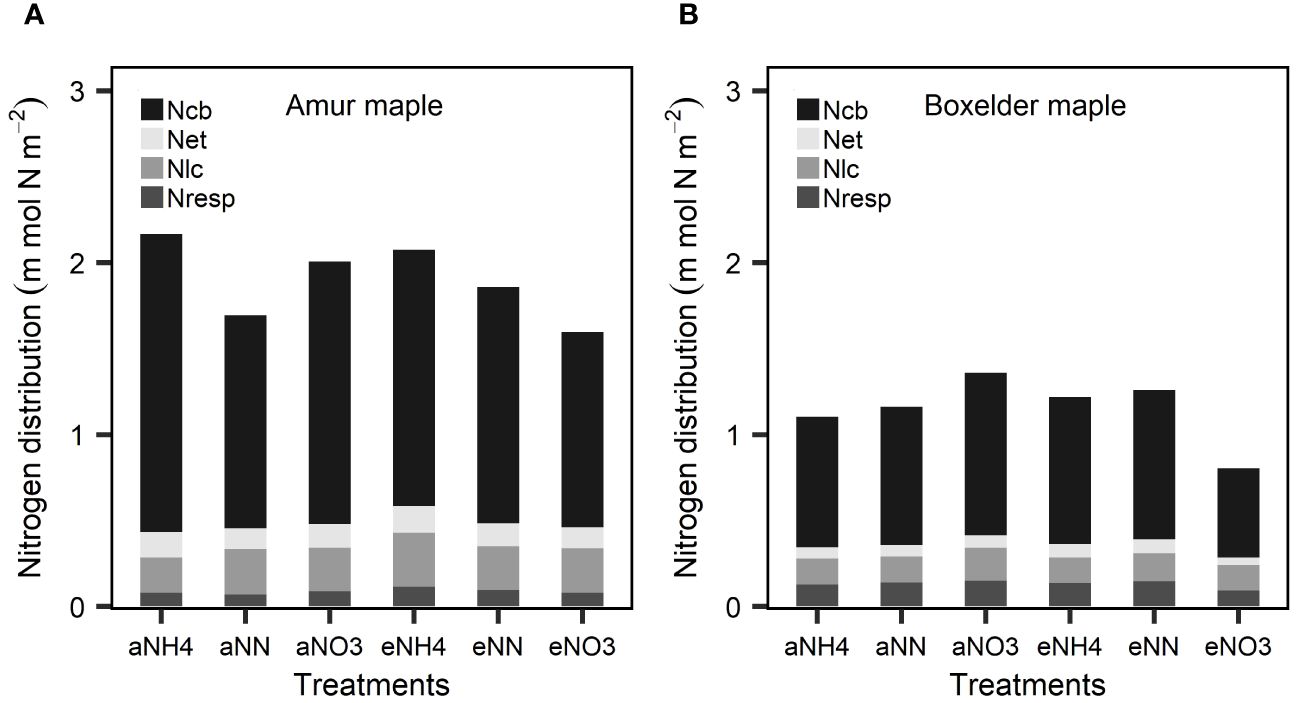
Figure 3 Leaf N partitioning into carboxylation (Ncb), electron transfer (Net), light capture systems (Nlc), and respiratory (Nresp) in response to CO2 and different N forms in amur maple (A) and boxelder maple (B). “a-” means ambient CO2 (400 µmol mol−1) and “e-” means elevated CO2 (800 µmol mol−1) treatments. NH4: fertilized with 10 mM (NH4)2SO4; NN: fertilized with a combination of 5 mM (NH4)2SO4 and 5 mM NaNO3; NO3: fertilized with 10 mM NaNO3.
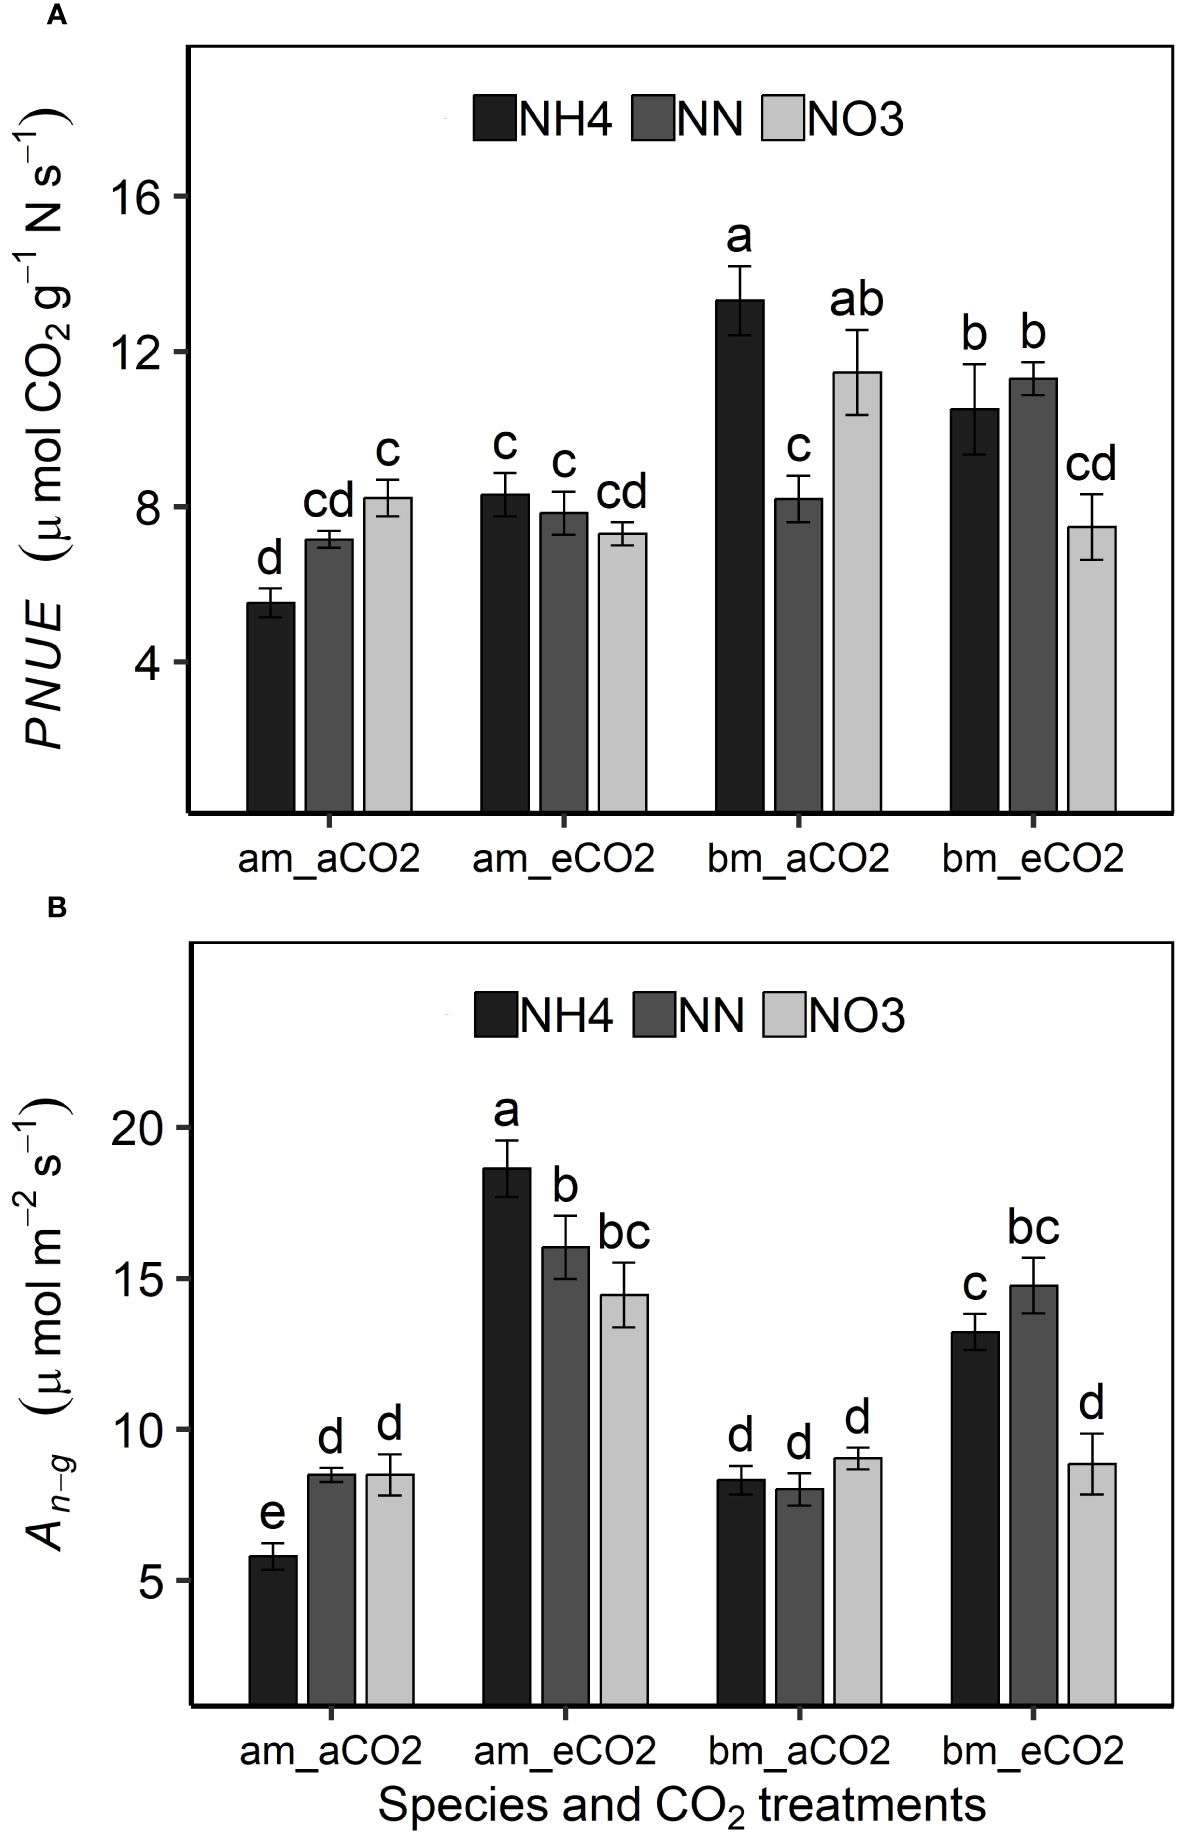
Figure 4 Effects of CO2 and N forms on photosynthetic nitrogen use efficiency [PNUE, (A) and photosynthetic rate at growth CO2 (An-g, (B)] in amur maple (am) and boxelder maple (bm). aCO2: ambient CO2 (400 µmol mol−1); eCO2: elevated CO2 (800 µmol mol−1); NH4: fertilized with 10 mM (NH4)2SO4; NN: fertilized with a combination of 5 mM (NH4)2SO4 and 5 mM NaNO3; NO3: fertilized with 10 mM NaNO3. Means (± SE, n=6) with different letters indicated significant differences between treatments (Tukey host hoc test, P<0.05).
3.3 Photosynthesis traits
An-g was promoted by eCO2 and its response in both tree species was similar to that of biomass under different treatments (Figure 4B). The promoting effect of eCO2 on An-g was smaller or not statistically significant under nitrate treatment (Figure 4B). Nitrate decreased both Vcmax and Jmax in both species under eCO2 although the effect was not always statistically significant but did not significantly affect either variable in either species aCO2 treatment (Tables 4, 5). Ammonium significantly increased leaf Chl concentration of amur maple grown under eCO2 (Table 4) while nitrate significantly increased leaf Chl of boxelder maple grown under aCO2 (Table 5).
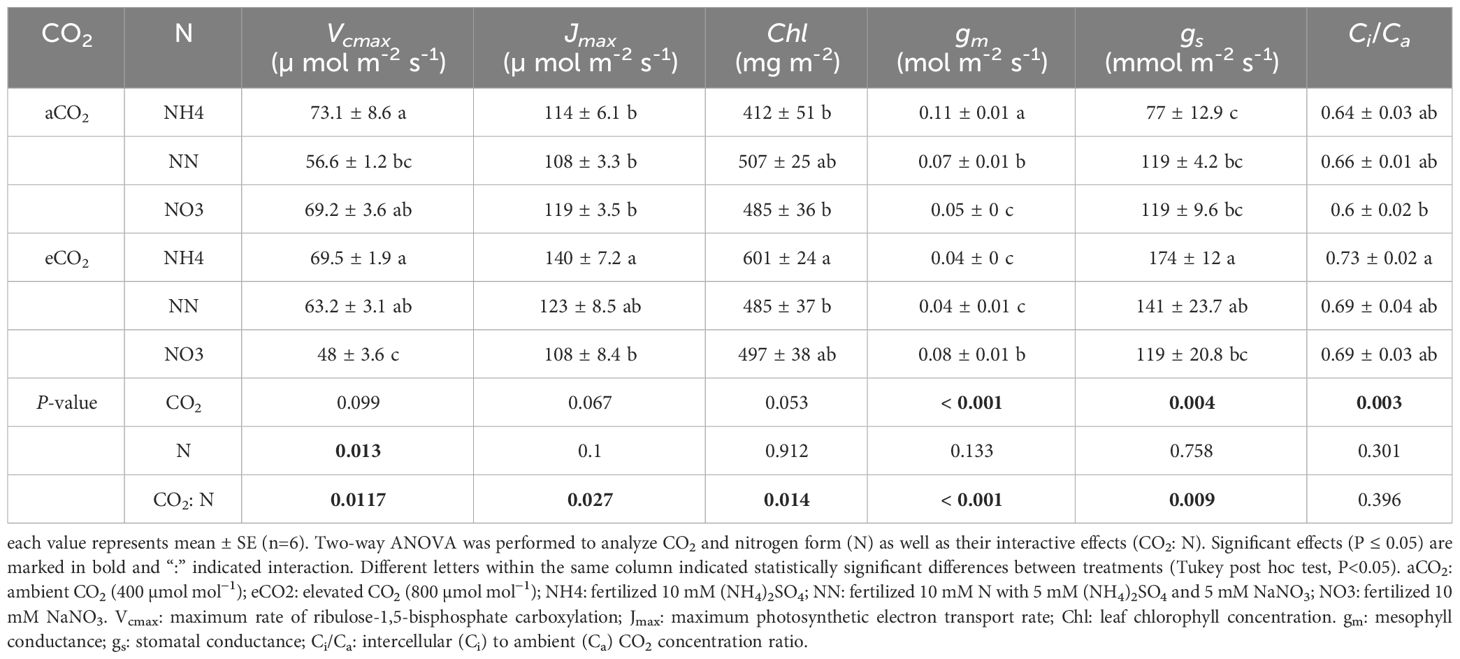
Table 4 Photosynthetic capacity, chlorophyll concentration, conductance to CO2 diffusion, and intercellular to external CO2 concentration ratio in amur maple seedlings grown at ambient or elevated CO2 in response to different forms of N source.
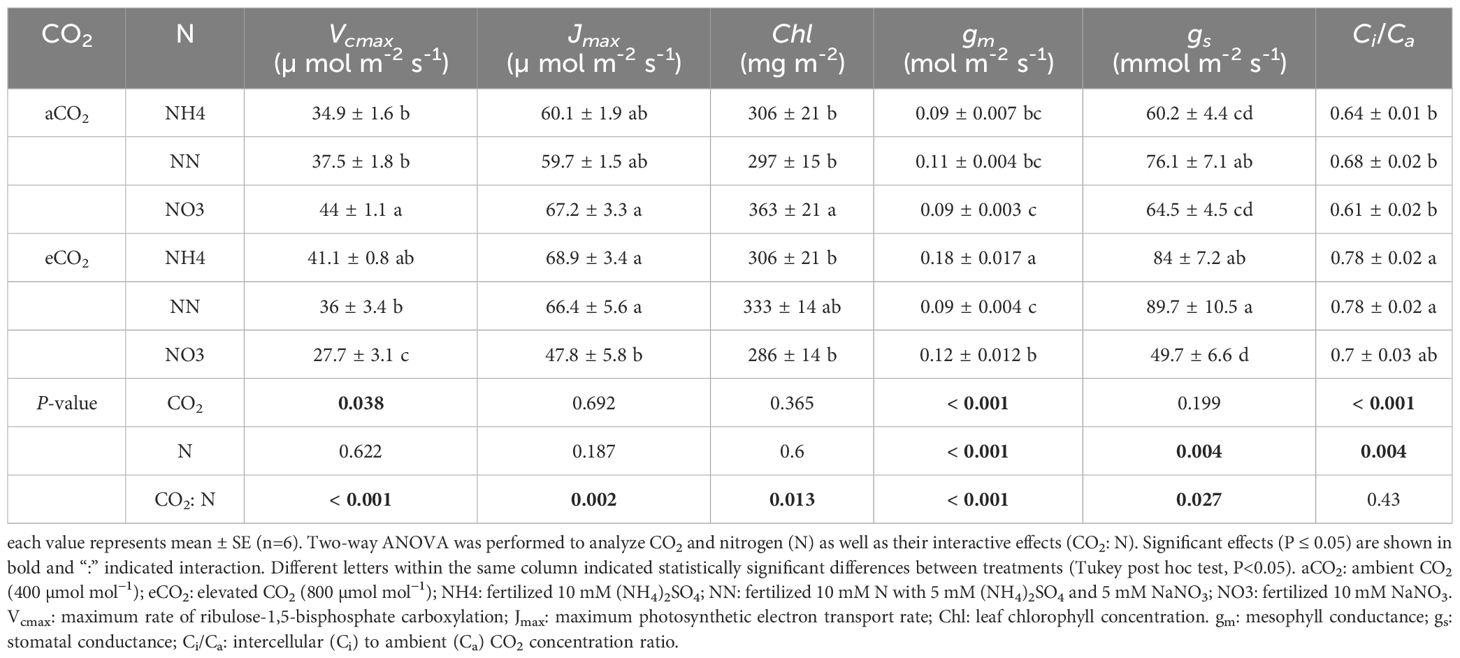
Table 5 Photosynthesis capacity, chlorophyll concentration, and CO2 diffusion conductance in boxelder maple seedlings grown at ambient and elevated CO2 in response to different forms of N source.
Nitrate significantly decreased gm of amur maple under aCO2 condition but increased it under eCO2 (Table 4). In contrast, the gm of boxelder maple was intermediate in seedlings fertilized with nitrate under eCO2 while there was not significant difference among N treatments under aCO2 (Table 5). Ci/Ca was generally higher in eCO2 than under cCO2, especially in boxelder maple (Tables 4, 5).
3.4 A/Ci traits and photosynthetic limitations
The transition point (Ci-t, An-t) of photosynthetic limitation from Rubisco carboxylation to RuBP regeneration ion shifted to higher Ci-g and higher An-g under eCO2 in both species (Figure 5). The transition point was much lower in amur maple seedlings fertilized with ammonium than other N treatments under aCO2, but ΓACi was greater (Figures 5A–C). Ammonium significantly promoted (Ci-g, An-g) and (Ci-t, An-t) in amur maple (Figures 5D–F), nitrate lowered the transition point in boxelder maple under eCO2 (Figures 5J–L).
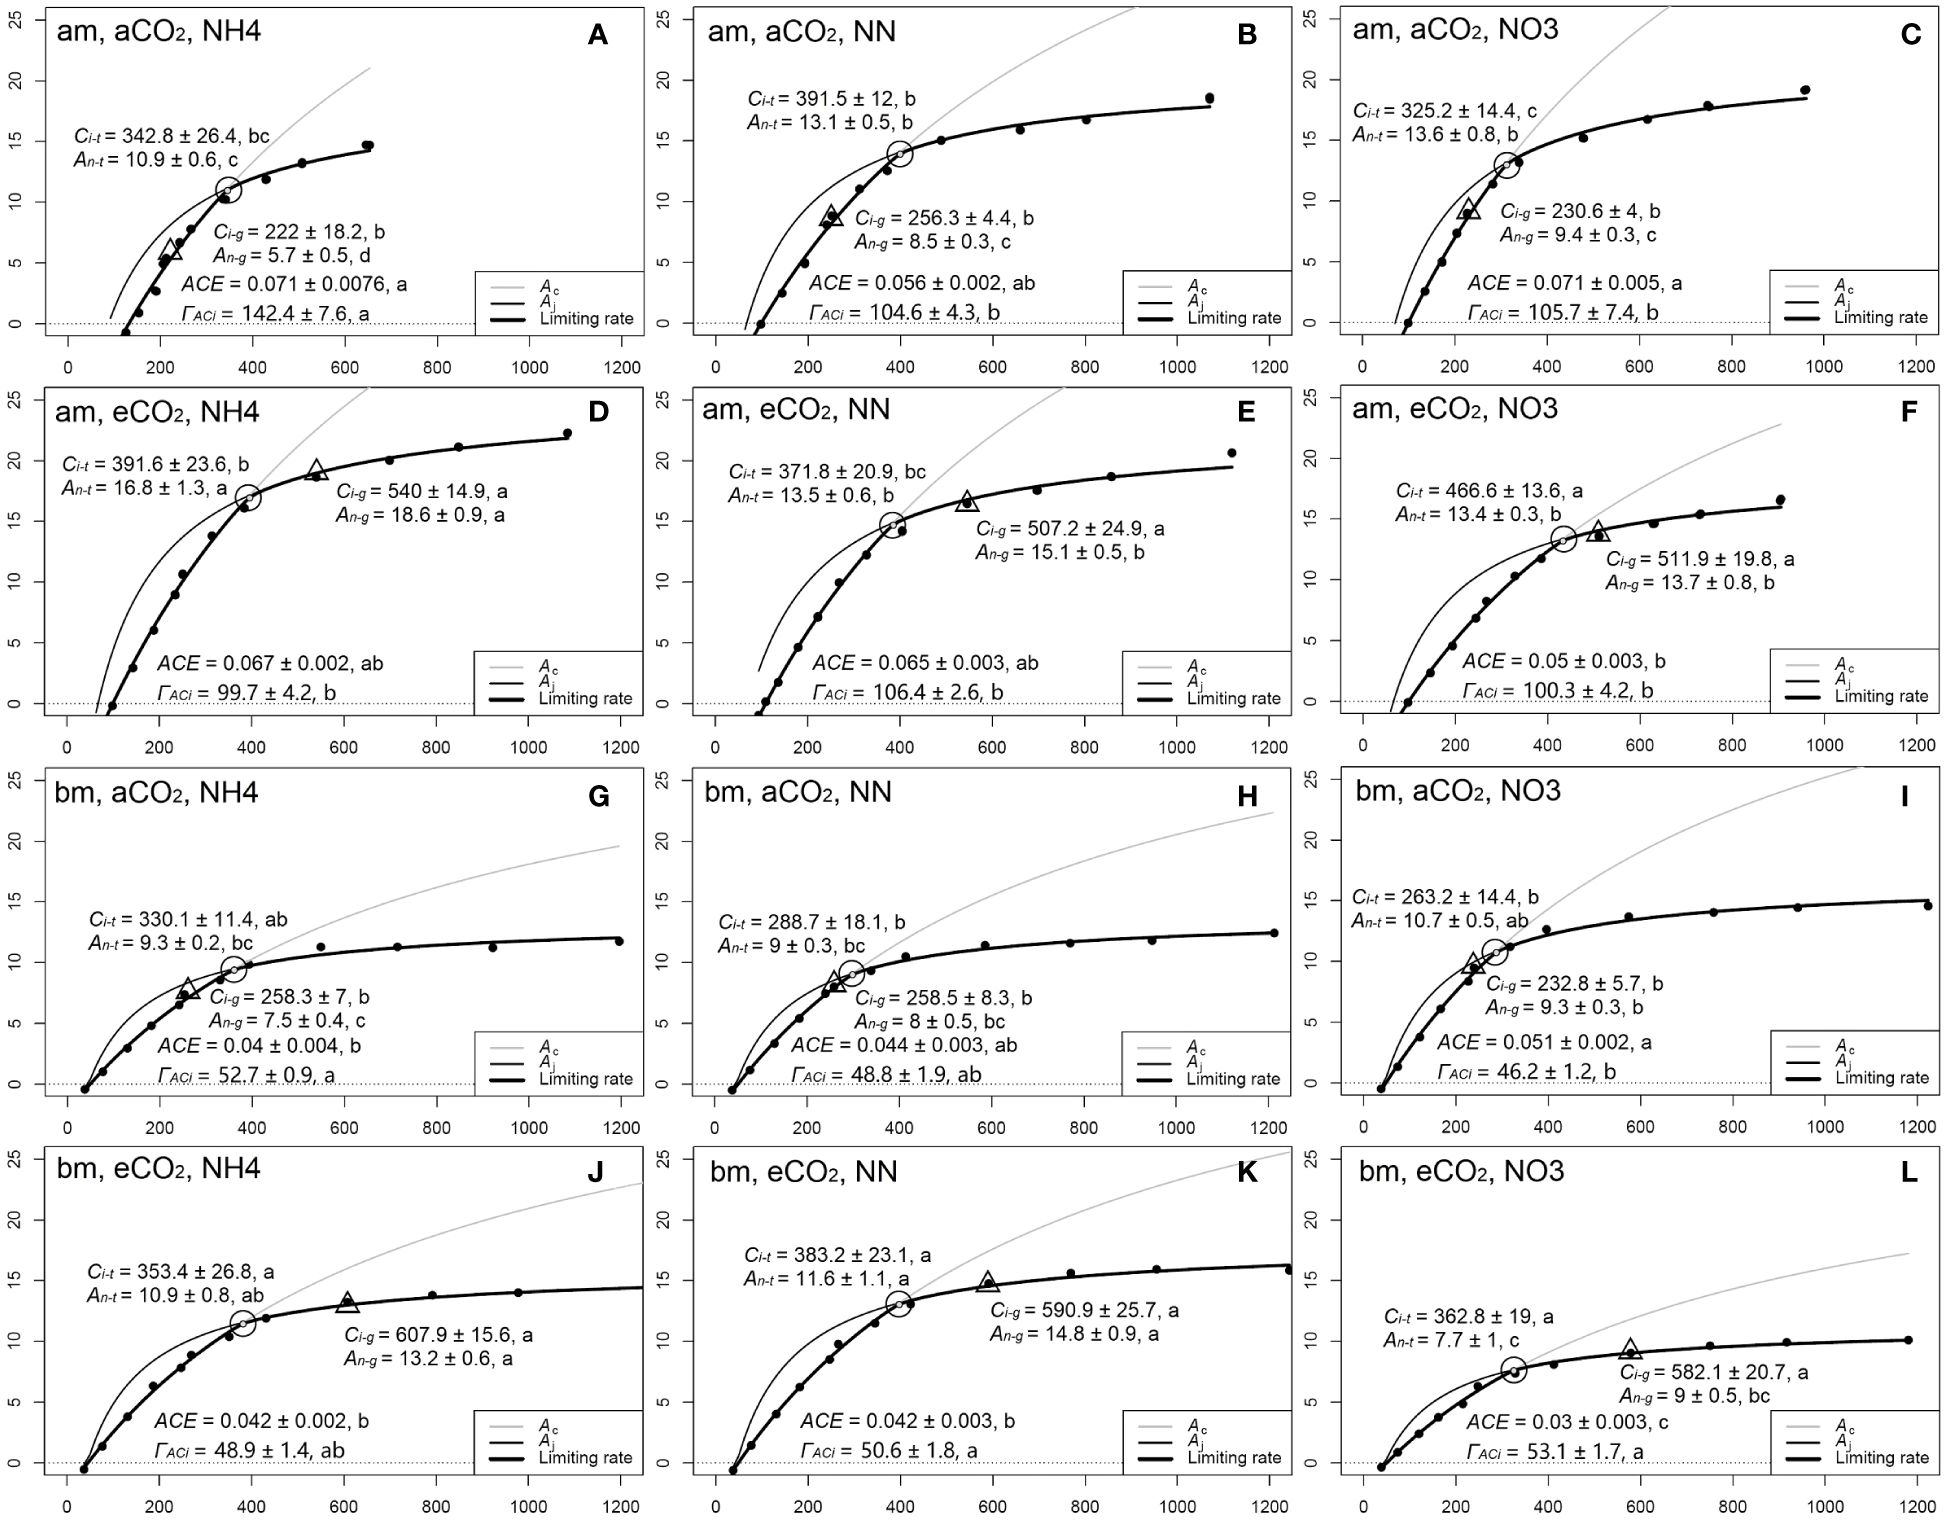
Figure 5 The A/Ci curves in response to different N forms in amur maple (am, A–F) and boxelder (bm, G–L) seedlings grown under ambient CO2 (aCO2, A-C in am and G-I in bm) and elevated CO2 (eCO2, D–F in am and J–L in bm). NH4: fertilized with 10 mM (NH4)2SO4 (left column); NN: fertilized with a combination of 5 mM (NH4)2SO4 and 5 mM NaNO3 (middle column); NO3: fertilized with 10 mM NaNO3 (right column). Each point denotes the means of six (Ci, An) values in A/Ci curve. The circles represent the transition point (Ci-t, An-t) from Rubisco carboxylation to RuBP regeneration of photosynthesis limitation. The triangles indicated the photosynthetic rate (Ci-g, An-g) under growth Ca (400 µmol mol−1 versus 800 µmol mol−1). ACE: apparent carboxylation efficiency estimated from the initial slope of A/Ci curve; ΓACi: CO2 compensation point estimated from A/Ci curve intersects point on X-axis. Different letters of the same parameter in the same species are significantly different between treatments (Tukey host hoc test, P<0.05, see Supplementary Table S2).
Relative photosynthetic limitation analysis showed that photosynthesis was primarily limited by gs in amur maple seedlings treated with aCO2 and ammonium but primarily limited by mesophyll conductance in all other treatment with the exception of seedlings treated with nitrate under eCO2 where it was limited almost equally by mesophyll conductance and biochemistry (Figure 6A). In contrast, the photosynthesis of boxelder maple was mainly limited by biochemical and gs (Figure 6B), particularly in the combination of nitrate and eCO2 (Figure 6B).
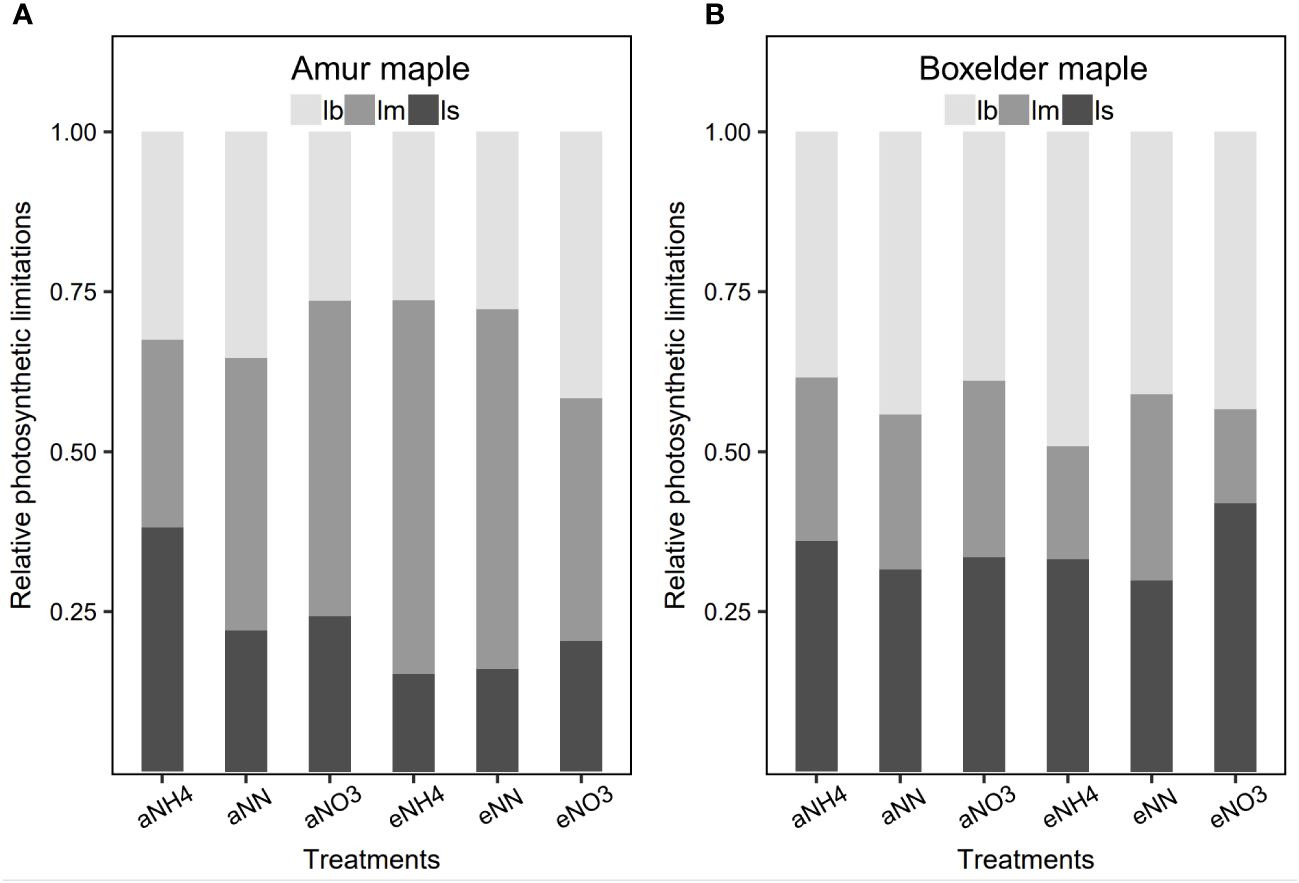
Figure 6 The relative photosynthesis limitations of biochemistry (lb), stomatal resistance (ls), and mesophyll resistance (lm) in response to CO2 and N form treatment in amur maple (A) and boxelder maple (B). Abbreviations are provided in Supplementary Table S1.
3.5 Adaptation to CO2 and N form
PCA showed an interesting result that the photosynthetic capacity parameters (Vcmax, Jmax) did not orient to the ellipse of aCO2 in the two species (Figures 7A, C). Seedlings grown under the eCO2 were grouped into the ellipses with growth parameters (biomass and leaf area) and An-g (Figures 7A, C). It is also interesting to note that Narea and Nleaf clustered in the eCO2 ellipse in amur maple (Figure 7A) while C/N clustered in the eCO2 ellipse in boxelder maple (Figure 7B). Different N forms had no obvious effect on the response to CO2 in amur maple since the three ellipses largely overlapped (Figure 7B). In boxelder maple, in contrast, nitrate clustered with Nmass and An-total/Ca, while the mixed N treatment was clustered with growth parameters (Figure 7D). It is worth noting that An-max/An-total from lrc was negatively correlated with the growth parameters in both tree species at about 180-degree angles (Figures 7A–D), and a similar effect was found in SLA in boxelder maple (Figures 7C, D).
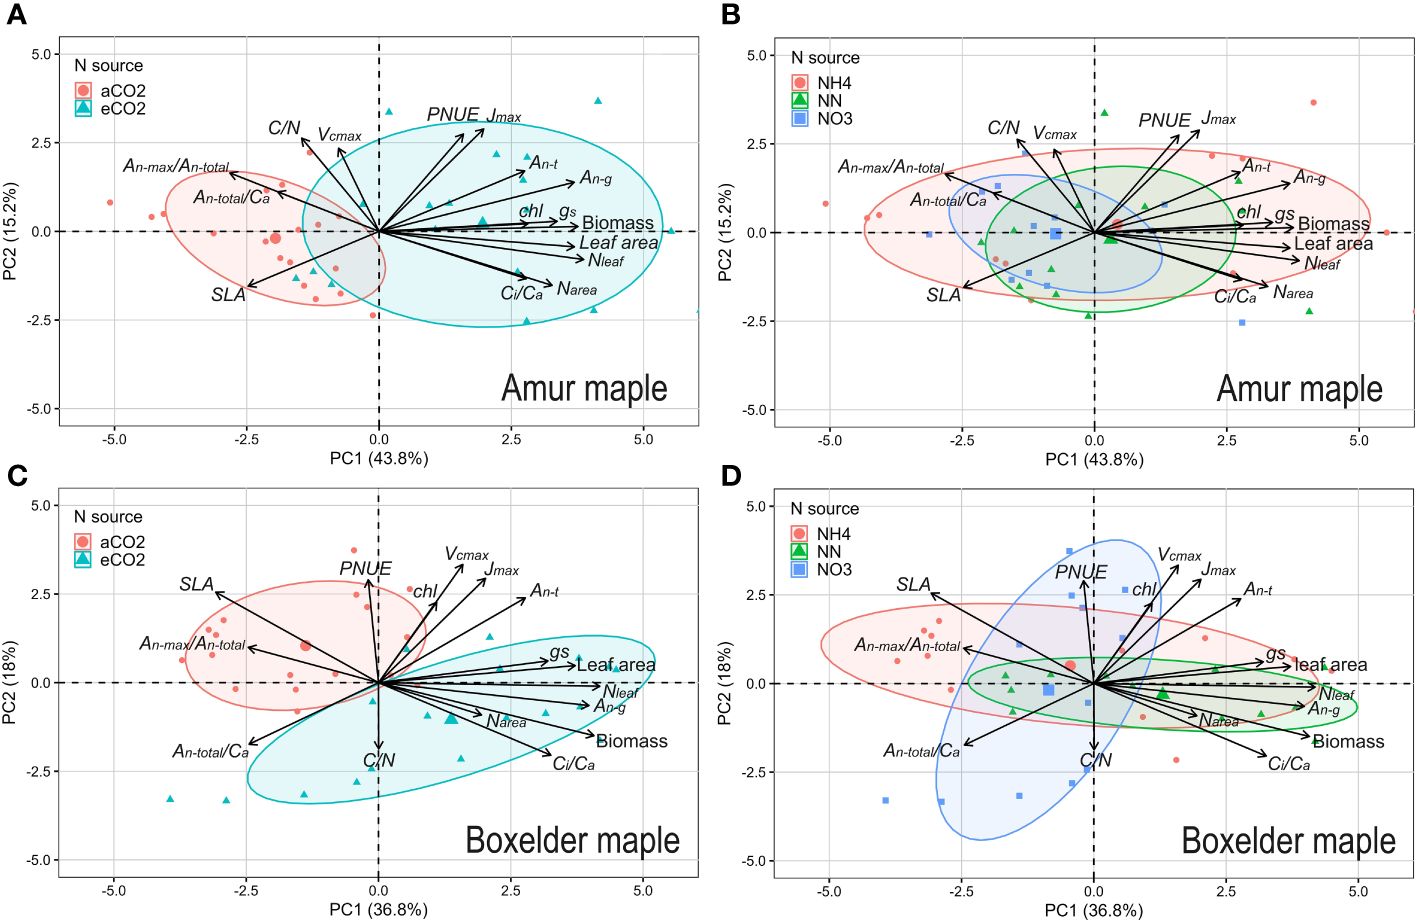
Figure 7 Principal Component Analysis (PCA) on growth and photosynthetic parameters in amur maple exposed to CO2 (A) and N resource (B) treatments and in boxelder maple (C, D). The arrows point to near overlap, vertical, and reverse, which represent positive, no, and negative correlations between these parameters respectively. aCO2: ambient CO2 (400 µmol mol−1); eCO2: elevated CO2 (800 µmol mol−1); NH4: fertilized 10 mM (NH4)2SO4; NN: fertilized 10 mM N from 5 mM (NH4)2SO4 and 5 mM NaNO3; NO3: fertilized 10 mM NaNO3. Jmax: maximum of photosynthetic electron transport rate; PNUE: photosynthesis nitrogen use efficiency; An-t: net photosynthesis rate at transition point (Ci-t, An-t) between Rubisco limitation and RuBP regeneration limitation based on A/Ci curve; An-g: net photosynthesis rate at a growth [CO2] which eCO2 at 800 µmol mol−1 and aCO2 at 400 µmol mol−1; gs: stomatal conductance; Nleaf: total N of the whole-plant leaf; Chl: leaf chlorophyll concentration; Ci/Ca: the ratio of Ci and Ca; Narea: leaf N per unit area; SLA: specific leaf area; An-max/An-total: the ratio of photosynthetic rate of saturation light at 400 µmol mol−1 (An-max) and the y-intercept of An vs. Ci fitting line (An-total) from light response curve database; An-total/Ca: the slope of An vs. Ci fitting line from light response curve database; C/N: leaf carbon and nitrogen ratio; Vcmax: maximum rate of ribulose-1,5-bisphosphate carboxylation; See Supplementary Table S1 for other explanations.
We constructed SEM (Structural Equation Model) to evaluate the direct/indirect effects on biomass and An-g by the two treatments (CO2 and N) as categorical variables using piecewiseSEM package in R (Figures 8A, B). The results showed that CO2 treatment had direct effects on the biomass of both tree species (Figures 8C, E), indirect effects on the biomass through Narea in amur maple (Figure 8C), and indirect effects on the biomass through An-g and SLA in boxelder maple (Figure 8E). N forms had a significant effect on the SLA in amur maple, but its impact on biomass did not reach a significant level (Figure 8C). However, N treatment had a significant indirect effect on biomass through An-g and SLA in boxelder maple (Figure 8E).
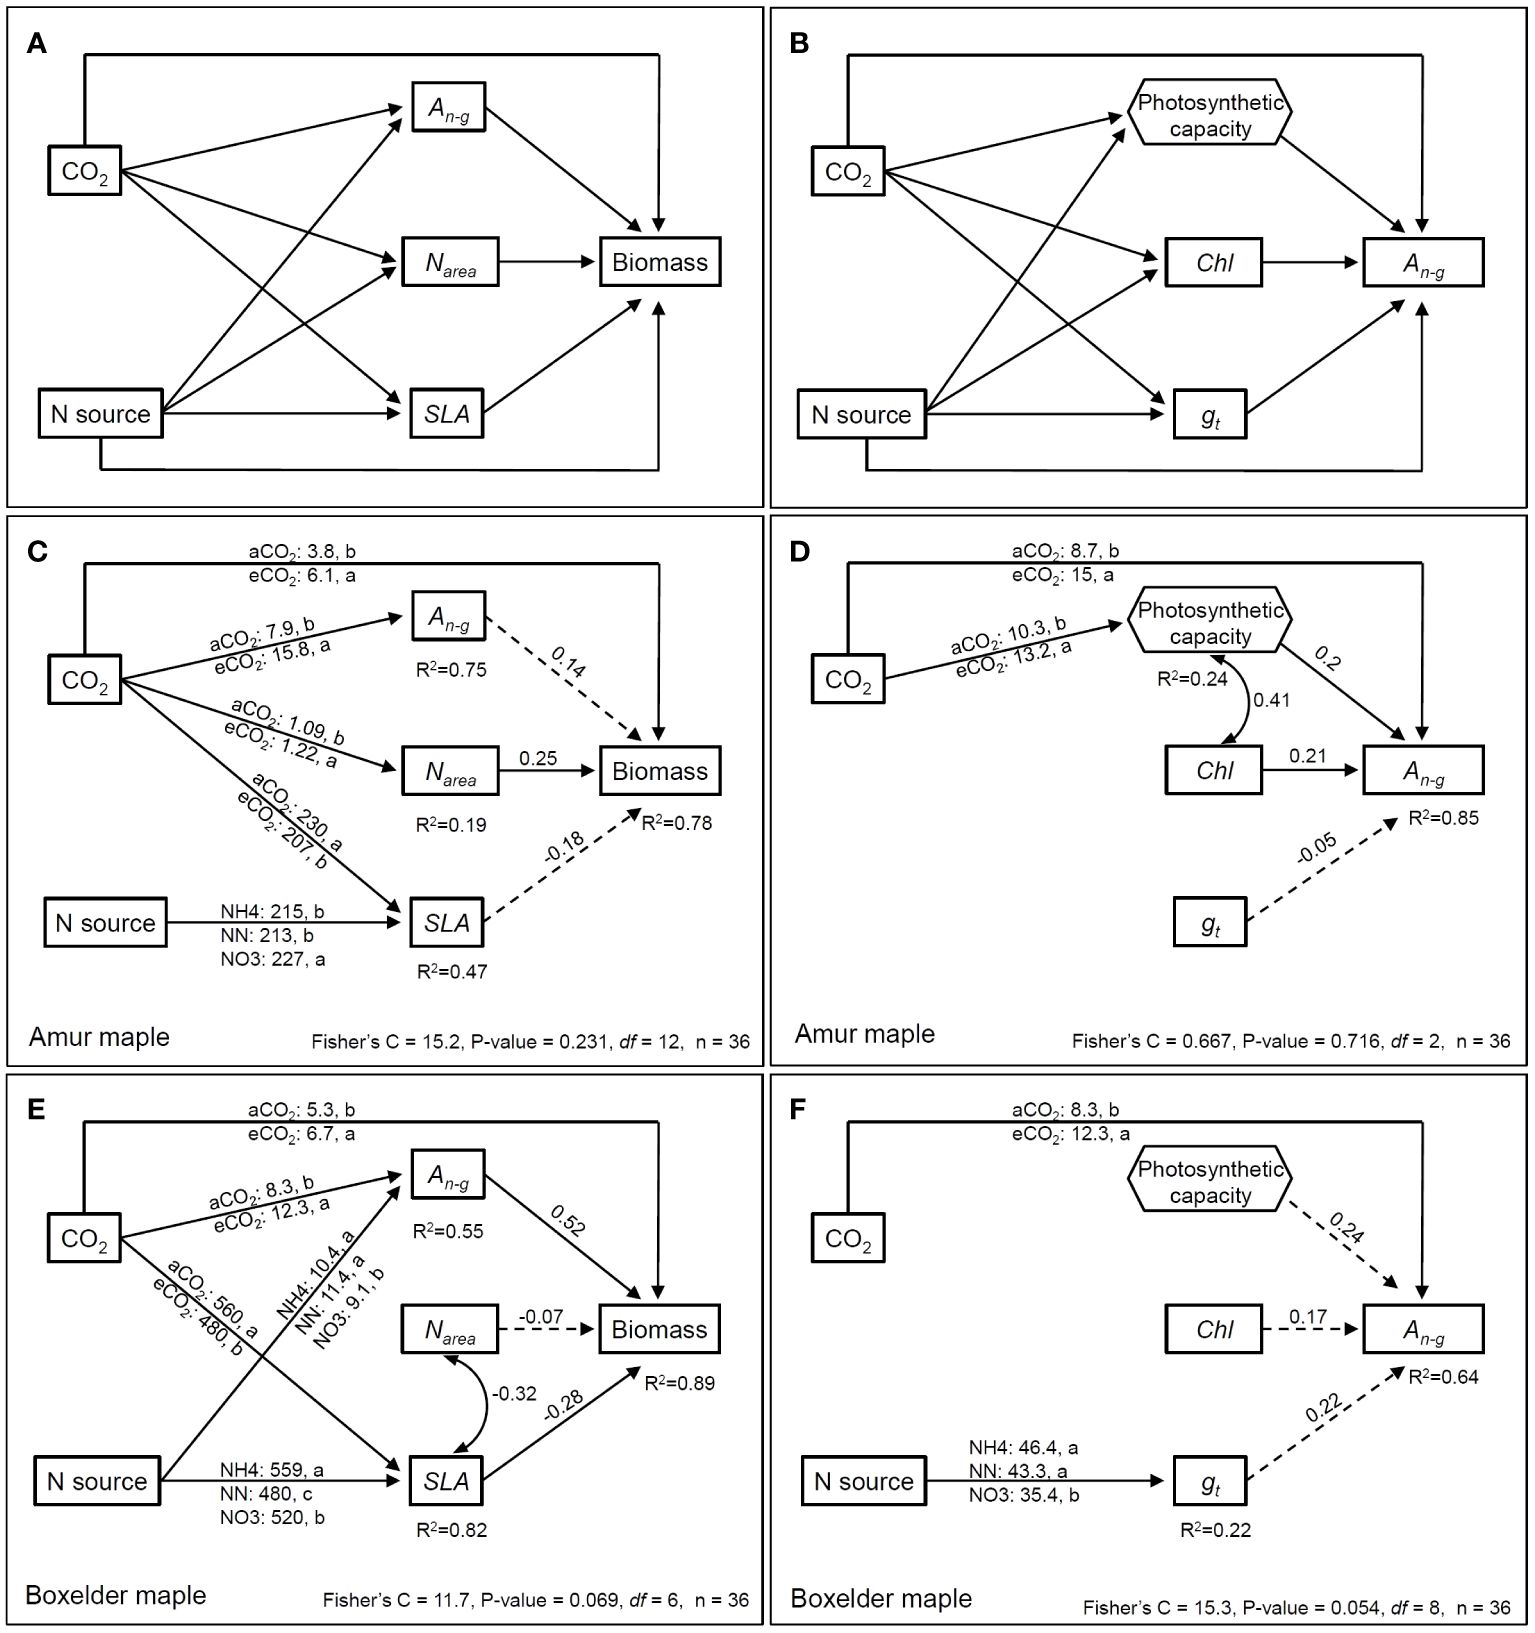
Figure 8 The priori (showing all tested paths) piecewise structural equation model (pSEM) relating to direct and indirect effects of CO2 and N form on biomass (A) and An-g(B). Two CO2 treatments (ambient CO2: 400 µmol mol−1 and elevated CO2: 800 µmol mol−1) and N source (10 mM N source by three forms: NH4+, NH4++NO3- in 1:1, NO3-) are treated as categorical variables. An-g: net photosynthesis rate at a growth [CO2] which eCO2 at 800 µmol mol−1 and aCO2 at 400 µmol mol−1; Narea: leaf N per unit area; SLA: specific leaf area; Chl: leaf chlorophyll concentration; gt: total conductance to CO2 between the leaf surface and carboxylation sites (1/gt = 1/gs + 1/gm). Multiple regression from Vcmax and Jmax to An-g was used to construct photosynthetic capacity as a component variable (hexagonal frame). The SEM (using psem function in piecewiseSEM package R) of biomass and An-g in amur maple are in (C, D), while that of boxelder maple are in (E, F). Arrows mean the directional influence between the variables and the solid lines represent significant relationships, and the dashed lines refer to nonsignificant relationships (P > 0.05). The numbers on top of the arrows represent the standardized path coefficients (for continuous variables), and the numbers under the box with R2 refer to the degree of variation of the variable interpreted by all paths. Curved double arrows represent a significant correlation between variables (with correlation coefficient). The values on the line from the categorical variable indicated the continuous variable estimated marginal means by the treatment levels.
CO2 had a significant direct effect on the An-g of both maple (Figures 8D, F), and a significant indirect effect on the biomass through photosynthesis in amur maple (Figure 8D). No significant effect of N form was observed on An-g and related parameters in amur maple (Figure 8D, not shown). In boxelder maple, N treatment affected total CO2 conductance, but had no significant effect on An-g (Figure 8F).
4 Discussion
4.1 Adaptation to elevated CO2
Elevated CO2 and associated climate change affect plant growth and distribution through via influencing physiological processes (Lauriks et al., 2022; Ma et al., 2023). Elevated CO2 usually causes photosynthetic adaptation, which is typically manifested by decreases in photosynthetic capacity (Vcmax, Jmax), Narea and gs (Hao et al., 2023), but promotes biomass production and photosynthetic rate (Dusenge et al., 2020; Tcherkez et al., 2020). However, there was no reduction in photosynthetic capacity or Narea observed in either species in this study. To the contrary, eCO2 increased Vcmax and Jmax in seedlings fertilized with ammonium. The photosynthetic downregulation induced by eCO2 is generally related to the dilution of leaf N and reduction in Rubisco as a result of increased carbohydrate production and growth (Dusenge et al., 2019).
Our PCA analysis shows that under aCO2 treatment, both amur maple and boxelder maple converged on the ellipse in the direction of An-max/An-total, (the ratio of An-max and An-total from lrc, see Figure 1B and Supplementary Table S1), and that An-max/An-total was always inversely proportional to Ci/Ca. From Figure 1B, An-total/Ca = An-max/(Ca - Ci), so An-max/An-total = (Ca - Ci)/Ca, which means that An-max/An-total + Ci/Ca = 1. This seems to demonstrate an intrinsic inverse relationship between An-max/An-total and Ci/Ca. Elevated CO2 reduced An-max/An-total, but increased Ci/Ca in both species (Supplementary Tables S3, S4). These results indicated that the photosynthetic adaptation processes in two maple species appeared diverse and highly plastic (Moejes et al., 2017).
The SEM revealed that eCO2 had positive effects on the biomass and An-g of both species, but only the effect on An-g in boxelder maple was statistically significant. CO2 is considered as a signal to control stomatal movement and growth metabolisms (Hao et al., 2023). Our results show that the biomass of both maple species was closely related to An-g and CO2 in the absence of other stresses.
4.2 Biochemical and CO2 diffusion limitations to photosynthesis
This study shows that an important effect of eCO2 is that it shifted the biochemical limitation of photosynthesis from Rubisco carboxylation to RuBP regeneration, i.e., from An-g < An-t under aCO2 to An-g > An-t under eCO2 (Wang et al., 2022). This result suggests that under the condition of the projected future climate, photosynthesis may be mainly limited by Jmax rather than Vcmax (Smith and Keenan, 2020). It should be noted that when photosynthesis is limited by Jmax, the sensitivity of An to Ci variation is reduced (Dusenge et al., 2019). The result that Ci/Ca ratio was higher under eCO2 than under aCO2 suggests that photosynthesis was less limited by CO2 diffusion in the two species grown under eCO2 (Lamba et al., 2018).
Photosynthetic capacity represents the CO2 fixation potential of leaves and does not represent the photosynthetic rate under actual growth conditions (Wang et al., 2022), since the net photosynthetic rate of C3 plants is also affected by substrate CO2 supply (Stefanski et al., 2020). For example, the photosynthetic capacity of amur maple treated with ammonium under aCO2 was maintained at a high level, while the actual An was the lowest, which was obviously limited by low CO2 supply and low stomatal conductance (Table 2, Figure 3A). Our results support the theory that higher photosynthetic capacity does not always translate into higher An (Xu et al., 2020).
The SEM showed that the resistance to CO2 diffusion was not a primary driver for differences in An between treatments (Figures 8D, F) and the relationship appeared to be opposite between the two maple species. The resistance to CO2 diffusion mainly includes gs and gm and has a significant effect on photosynthesis (Grassi and Magnani, 2005). However, using gt [gt = gs * gm/(gs + gm)] to express the overall conductivity of CO2 seems to blur the individual effect of gs or gm (Grassi and Magnani, 2005). Although gs and gm jointly describe the diffusion of CO2 from leaf surface to carboxylation sites, they are independent processes with different regulatory mechanisms and physiological significance. The gs may be closely related to water status (Stefanski et al., 2020), while gm integrates biochemical and physical factors of intercellular CO2 diffusion (Berghuijs et al., 2016).
4.3 N forms and partitioning effects
It is believed that eCO2 is beneficial to plants that prefer ammonium over nitrate (Andrews et al., 2019; Dusenge et al., 2019). Our results show that ammonium fertilization led to the highest while nitrate resulted in the lowest photosynthesis and growth among the three fertilization treatments under eCO2. This result may be related to the lower energy consumption and higher metabolic efficiency of ammonium compared with nitrate (Bloom, 2015; Rubio-Asensio and Bloom, 2017). However, the accumulation of more ammonium in cells may cause ammonium toxicity, resulting in the decrease of gs and An, chlorosis and growth inhibition (Vega-Mas et al., 2017). Our results that Chl and gs were lowest in seedlings fertilized with ammonium under aCO2 may indicate a toxic effect of ammonium to those trees. Ammonium toxicity is attributed to excessive ammonium ions that lead to cell ion disturbances, the depletion of organic acid, and acid stress caused by the proton’s mass formation (Hachiya et al., 2021). The eCO2 can promote the synthesis of organic acids by providing the carbon framework and alleviating ammonium toxicity (Vega-Mas et al., 2017; La Peña et al., 2022). Our results showed that ammonium might be beneficial to the growth of the two maple species in the future when CO2 is elevated. However, the mechanism of this synergistic effect of eCO2 and ammonium needs further study.
It is common in C3 plants that eCO2 inhibits the assimilation of nitrate (Rachmilevitch et al., 2004). The reason may be that eCO2 inhibits photorespiration, and nitrate assimilation depends on photorespiration-related reductants (Ainsworth and Long, 2021). Furthermore, eCO2 may also inhibit the activity of nitrate reductase (Wujeska-Klause et al., 2019). The mixed nitrate and ammonium treatment appeared more beneficial to the growth of boxelder maple than the application of only nitrate, this suggests that ammonium and nitrate may have some interactive effects on boxelder maple. Notably, N allocation may also play an important role in the regulation of photosynthesis (Wang et al., 2021). Amur maple treated by aNH4 and eNH4 had equivalent N allocation to photosynthesis (Figure 4A), but the photosynthetic rate and biomass in the latter treatment were more than twice that of the former. This was probably because the N in the eNH4 treatment was distributed more evenly to different components such as Net, Nlc and Nresp, than in the aNH4 treatment where there was a slight greater N allocation to Ncb.
4.4 Plasticity and leaf morphological traits
Invasive plants generally have higher plasticity because they exhibit favorable phenotypes and robust adaptability in response to changes in environmental conditions (Godoy et al., 2012; Liu et al., 2017). Plasticity is reflected in the trade-offs between leaf structure and physiological progress described in the leaf economic spectrum (Liu et al., 2022), and in the optimal combination of key leaf traits SLA, Narea and An (Onoda et al., 2017). Successful invasive tree species often show higher SLA (lower leaf structure cost) and higher Narea (higher nutrient resources), which is often associated with higher efficiency of resource acquisition, higher photosynthetic rates and faster investment returns (Xiong and Flexas, 2018). Our results show that both amur maple and boxelder maple exposed to eCO2 increased leaf construction cost (SLA lowered) and had higher Narea. The high phenotypic plasticity may further facilitate the spread of specific invasive species in the future when the atmospheric CO2 elevation continues (Liu et al., 2017).
4.5 Adaptation strategy of amur maple and boxelder maple
Despite displaying comparable reactions to elevated CO2 and different nitrogen sources in terms of biomass and leaf nitrogen allocation, Amur maple and boxelder maple seem to have adopted contrasting adaptation strategies for future climate change. Amur maple appears to prioritize maximizing photosynthetic capacity per unit area of leaves, whereas boxelder maple seems to excel in increasing biomass through adaptations in leaf morphology and nitrogen utilization efficiency (Supplementary Figures 3S, C). This trend is also evident in relative photosynthetic limitation (Figure 6) and structural equation models (Figures 8D, F).
Our results provide further support for the conclusions of previous studies that the great plasticity has facilitated the successful invasion of boxelder maple into Europe, Asia and South America (Porté et al., 2011; McEvoy et al., 2022). A study in Lithuania finds that boxelder maple facilitates invasion by increasing the rate of foliar decomposition and nutrient cycling (Manusadžianas et al., 2014). Our results showed that the C/N and Nleaf of boxelder maple were significantly higher than those of amur maple, suggesting that boxelder maple may speed soil nutrient cycling and the invasion of other species (Lee et al., 2017). A well-known paradox is that invasive plants reduce biodiversity but increase plant productivity (Rout and Callaway, 2009). A recent genomic comparison has found that boxelder maple has a smaller genome with recent gene family evolution which might be related to its robust adaptability (McEvoy et al., 2022). Even though the two maple trees have chosen different adaptation strategies for the future climate, they have both demonstrated a favorable reaction to the elevated CO2. It is important to note that the boxelder maple’s strategy of optimizing leaf morphology and nitrogen utilization efficiency not only showcases its impressive phenotypic plasticity, but also enhances its invasive potential by facilitating nutrient cycling between leaves and soil.
5 Conclusions
Invasive tree species generally have greater plasticity and more efficient utilization of carbon and nitrogen sources in the environment. We found that amur maple and boxelder maple both showed strong plasticity in response to eCO2 and variation in N sources. Furthermore, they seem to exhibit a coordinated response to the two treatment factors. Ammonium was not conducive to the growth and physiology of both species under current CO2 but significantly improved their performance under the elevated CO2. However, the effects of nitrate were the opposite. Boxelder maple seems to have stronger adaptability to future climate change than Amur maple. Because boxelder maple invests more N in its leaves and has a larger specific leaf area, indicating that boxelder maple could promote soil nutrient cycling and ecosystem function. We conclude that increases in soil ammonium will be beneficial to the plasticity and adaptation of amur maple and boxelder maple in the future as atmospheric CO2 continues to rise.
Data availability statement
The raw data supporting the conclusions of this article will be made available by the authors, without undue reservation.
Author contributions
LW: Data curation, Formal analysis, Investigation, Writing – original draft, Writing – review & editing. Q-LD: Conceptualization, Funding acquisition, Investigation, Methodology, Project administration, Resources, Software, Supervision, Validation, Writing – review & editing.
Funding
The author(s) declare financial support was received for the research, authorship, and/or publication of this article. The study was supported by an NSERC Discovery Development Grant to Q-LD (Project No. DDG-2020-00008) and by Zhejiang A&U University Jiyang College Talent Initiation Project to LW (RC2023B06).
Acknowledgments
We want to thank Ms. Keri Pidgen, the Greenhouse Manager, for her logistic support and other operational assistance during the experiments.
Conflict of interest
The authors declare that the research was conducted in the absence of any commercial or financial relationships that could be construed as a potential conflict of interest.
The author(s) declared that they were an editorial board member of Frontiers, at the time of submission. This had no impact on the peer review process and the final decision.
Publisher’s note
All claims expressed in this article are solely those of the authors and do not necessarily represent those of their affiliated organizations, or those of the publisher, the editors and the reviewers. Any product that may be evaluated in this article, or claim that may be made by its manufacturer, is not guaranteed or endorsed by the publisher.
Supplementary material
The Supplementary Material for this article can be found online at: https://www.frontiersin.org/articles/10.3389/fpls.2024.1367535/full#supplementary-material
Supplementary Table 1 | Definition of acronyms.
Supplementary Table 2 | ANOVA P-values of CO2 and N source effects on photosynthetic parameters shown in Figure 4. Note: CO2 treatment includes ambient CO2 (400 µmol mol−1) and elevated CO2 (800 µmol mol−1) and N treated with 10 mM N by three forms: NH4+, NH4++NO3- in 1:1, NO3-).
Supplementary Table 3 | Photosynthetic parameters (mean ± SEM) derived from photosynthetic light response curves (LRC) in amur maple seedlings grown under different CO2 and N forms. Note: each value represents mean ± SE (n=6). Two-way ANOVA was performed to analyze CO2 and nitrogen (N) as well as their interactive effects (CO2: N). Significant effects (P ≤ 0.05) are shown in bold and “:” indicated interaction. Different letters within the same column indicated statistically significant differences between treatments (Tukey post hoc test, P<0.05). aCO2: ambient CO2 (400 µmol mol−1); eCO2: elevated CO2 (800 µmol mol−1); NH4: fertilized 10 mM (NH4)2SO4; NN: fertilized 10 mM N with 5 mM (NH4)2SO4 and 5 mM NaNO3; NO3: fertilized 10 mM NaNO3. Abbreviations are provided in Supplementary Table S1.
Supplementary Table 4 | Photosynthetic parameters (mean ± SEM) derived from photosynthetic light response curves (LRC) in boxelder maple seedlings grown under different CO2 and N forms. Note: each value represents mean ± SE (n=6). Two-way ANOVA was performed to analyze CO2 and nitrogen (N) as well as their interactive effects (CO2: N). Significant effects (P ≤ 0.05) are shown in bold and “:” indicated interaction. Different letters within the same column indicated statistically significant differences between treatments (Tukey post hoc test, P<0.05). aCO2: ambient CO2 (400 µmol mol−1); eCO2: elevated CO2 (800 µmol mol−1); NH4: fertilized 10 mM (NH4)2SO4; NN: fertilized 10 mM N with 5 mM (NH4)2SO4 and 5 mM NaNO3; NO3: fertilized 10 mM NaNO3. Abbreviations are provided in Supplementary Table S1.
Supplementary Figure 1 | CO2 concentration (A) and air temperature in (B) for the four climate-controlled glasshouses. The conditions were recorded 24 h a day every day. CO2 setting was 800 µmol mol−1 for the elevated and 400 µmol mol−1 for the ambient treatment. Day 1 indicates the beginning of the experiment and Day 120 indicates the completion of the experiment.
Supplementary Figure 2 | Pictures of amur maple (A) and boxelder maple (B)) in different treatment combinations. “a-” means ambient CO2 (400 µmol mol−1) and “e-” means elevated CO2 (800 µmol mol−1) treatments. NH4: fertilized 10 mM (NH4)2SO4; NN: fertilized 10 mM N with 5 mM (NH4)2SO4 and 5 mM NaNO3; NO3: fertilized 10 mM NaNO3.
Supplementary Figure 3 | Principal Component Analysis (PCA) on growth and photosynthetic parameters of seedlings exposed to CO2 (A) and N resource (B) and in two species (C). The arrow direction of near overlap, vertical, and reverse, indicates positive correlation, no correlation, and negative correlation between these parameters, respectively. aCO2: ambient CO2 (400 µmol mol−1); eCO2: elevated CO2 (800 µmol mol−1); NH4: fertilized 10 mM (NH4)2SO4; NN: fertilized 10 mM N from 5 mM (NH4)2SO4 and 5 mM NaNO3; NO3: fertilized 10 mM NaNO3. Jmax: maximum of photosynthetic electron transport rate; PNUE: photosynthesis nitrogen use efficiency; An-t: net photosynthesis rate at transition point (Ci-t, An-t) between Rubisco limitation and RuBP regeneration limitation based on A/Ci curve; An-g: net photosynthesis rate at a growth [CO2] which eCO2 at 800 µmol mol−1 and aCO2 at 400 µmol mol−1; gs: stomatal conductance; Nleaf: total N of the whole-plant leaf; Chl: leaf chlorophyll concentration; Ci/Ca: the ratio of Ci and Ca; Narea: leaf N per unit area; Nmass: leaf N concentration; SLA: specific leaf area; ΓACi: CO2 compensation point from A/Ci curve; An-max/An-total: the ratio of photosynthetic rate of saturation light at 400 µmol mol−1 (An-max) and the y-intercept of An vs. Ci fitting line (An-total) from light response curve database; △An/△Ci-lrc: the slope of An vs. Ci fitting line from light response curve database; C/N: leaf carbon and nitrogen ratio; Vcmax: maximum rate of ribulose-1,5-bisphosphate carboxylation; ACE: apparent carboxylation efficiency. See Supplementary Table S1 for other explanations.
References
Ainsworth, E. A., Long, S. P. (2021). 30 years of free-air carbon dioxide enrichment (FACE): What have we learned about future crop productivity and its potential for adaptation? Glob. Chang. Biol. 27, 27–49. doi: 10.1111/gcb.15375
Andrews, M., Condron, L. M., Kemp, P. D., Topping, J. F., Lindsey, K., Hodge, S., et al. (2019). Elevated CO2 effects on nitrogen assimilation and growth of C3 vascular plants are similar regardless of N-form assimilated. J. Exp. Bot. 70, 683–690. doi: 10.1093/jxb/ery371
Barros, V., Melo, A., Santos, M., Nogueira, L., Frosi, G., Santos, M. G. (2020). Different resource-use strategies of invasive and native woody species from a seasonally dry tropical forest under drought stress and recovery. Plant Physiol. Biochem. 147, 181–190. doi: 10.1016/j.plaphy.2019.12.018
Bäurle, I., Laplaze, L., Martin, A. (2023). Preparing for an uncertain future: molecular responses of plants facing climate change. J. Exp. Bot. 74, 1297–1302. doi: 10.1093/jxb/erac493
Berghuijs, H. N. C., Yin, X., Ho, Q. T., Driever, S. M., Retta, M. A., Nicolaï, B. M., et al. (2016). Mesophyll conductance and reaction-diffusion models for CO2 transport in C3 leaves; needs, opportunities and challenges. Plant Sci. 252, 62–75. doi: 10.1016/j.plantsci.2016.05.016
Bernacchi, C. J., Singsaas, E. L., Pimentel, C., Portis, A. R., Jr., Long, S. P. (2001). Improved temperature response functions for models of Rubisco-limited photosynthesis. Plant Cell Environ. 24, 253–259. doi: 10.1111/j.1365-3040.2001.00668.x
Bi, W., He, C., Ma, Y., Shen, J., Zhang, L. H., Peng, Y., et al. (2016). Investigation of free amino acid, total phenolics, antioxidant activity and purine alkaloids to assess the health properties of non-Camellia tea. Acta Pharm. Sin. B. 6, 170–181. doi: 10.1016/j.apsb.2015.11.003
Bloom, A. J. (2015). The increasing importance of distinguishing among plant nitrogen sources. Curr. Opin. Plant Biol. 25, 10–16. doi: 10.1016/j.pbi.2015.03.002
Bowen, J. L., Kearns, P. J., Byrnes, J. E. K., Wigginton, S., Allen, W. J., Greenwood, M., et al. (2017). Lineage overwhelms environmental conditions in determining rhizosphere bacterial community structure in a cosmopolitan invasive plant. Nat. Commun. 8, 433. doi: 10.1038/s41467-017-00626-0
Cabon, A., Kannenberg, S. A., Arain, A., Babst, F., Baldocchi, D., Belmecheri, S., et al. (2022). Cross-biome synthesis of source versus sink limits to tree growth. Science 376, 758–761. doi: 10.1126/science.abm4875
Campoy, ,. J. G., Lema, M., Fenollosa, E., Munné-Bosch, S., Retuerto, R. (2021). Functional responses to climate change may increase invasive potential of Carpobrotus edulis. Am. J. Bot. 108, 1902–1916. doi: 10.1002/ajb2.1745
Chen, H., Huang, X., Shi, W., Kronzucker, H. J., Hou, L., Yang, H., et al. (2021). Coordination of nitrogen uptake and assimilation favors the growth and competitiveness of moso bamboo over native tree species in high-NH4+ environments. J. Plant Physiol. 266, 153508. doi: 10.1016/j.jplph.2021.153508
de Souza, A. P. (2023). Dynamic responses of carbon assimilation and stomatal conductance in the future climate. J. Exp. Bot. 74, 2790–2793. doi: 10.1093/jxb/erad049
Domiciano, D., Nery, F. C., de Carvalho, P. A., Prudente, D. O., de Souza, L. B., Chalfun-Júnior, A., et al. (2020). Nitrogen sources and CO2 concentration synergistically affect the growth and metabolism of tobacco plants. Photosynth. Res. 144, 327–339. doi: 10.1007/s11120-020-00743-w
Du, Q., Liu, T., Jiao, X., Song, X., Zhang, J., Li, J. (2019). Leaf anatomical adaptations have central roles in photosynthetic acclimation to humidity. J. Exp. Bot. 70, 4949–4962. doi: 10.1093/jxb/erz238
Dusenge, M. E., Duarte, A. G., Way, D. A. (2019). Plant carbon metabolism and climate change: elevated CO2 and temperature impacts on photosynthesis, photorespiration and respiration. New Phytol. 221, 32–49. doi: 10.1111/nph.15283
Dusenge, M. E., Madhavji, S., Way, D. A. (2020). Contrasting acclimation responses to elevated CO2 and warming between an evergreen and a deciduous boreal conifer. Glob. Chang. Biol. 26, 3639–3657. doi: 10.1111/gcb.15084
Duursma, R. A. (2015). Plantecophys—An R package for analyzing and modelling leaf gas exchange data. PloS One 10, e0143346. doi: 10.1371/journal.pone.0143346
Farquhar, G. D., von Caemmerer, S., Berry, J. A. (1980). A biochemical model of photosynthetic CO2 assimilation in leaves of C 3 species. Planta 149, 78–90. doi: 10.1007/BF00386231
Godoy, O., Valladares, F., Castro-Díez, P. (2012). The relative importance for plant invasiveness of trait means, and their plasticity and integration in a multivariate framework. New Phytol. 195, 912–922. doi: 10.1111/j.1469-8137.2012.04205.x
Grassi, G., Magnani, F. (2005). Stomatal, mesophyll conductance and biochemical limitations to photosynthesis as affected by drought and leaf ontogeny in ash and oak trees. Environ. Exp. Bot. 28, 834–849. doi: 10.1111/j.1365-3040.2005.01333.x
Green, J. K., Keenan, T. F. (2022). The limits of forest carbon sequestration. Science 376, 692–693. doi: 10.1126/science.abo6547
Hachiya, T., Inaba, J., Wakazaki, M., Sato, M., Toyooka, K., Miyagi, A., et al. (2021). Excessive ammonium assimilation by plastidic glutamine synthetase causes ammonium toxicity in Arabidopsis thaliana. Nat. Commun. 12, 4944. doi: 10.1038/s41467-021-25238-7
Hao, L., Chang, Z., Lu, Y., Tian, Y., Zhou, H., Wang, Y., et al. (2023). Drought dampens the positive acclimation responses of leaf photosynthesis to elevated [CO2] by altering stomatal traits, leaf anatomy, and Rubisco gene expression in Pyrus. Environ. Exp. Bot. 211, 105375. doi: 10.1016/j.envexpbot.2023.105375
Harley, P. C., Loreto, F., Di Marco, G., Sharkey, T. D. (1992). Theoretical considerations when estimating the mesophyll conductance to CO2 flux by analysis of the response of photosynthesis to CO2. Plant Physiol. 98, 1429–1436. doi: 10.1104/pp.98.4.1429
Lamba, S., Hall, M., Räntfors, M., Chaudhary, N., Linder, S., Way, D., et al. (2018). Physiological acclimation dampens initial effects of elevated temperature and atmospheric CO2 concentration in mature boreal Norway spruce. Plant Cell Environ. 41, 300–313. doi: 10.1111/pce.13079
La Peña, M., Marín-Peña, A. J., Urmeneta, L., Coleto, I., Castillo-González, J., van Liempd, S. M., et al. (2022). Ammonium nutrition interacts with iron homeostasis in Brachypodium distachyon. J. Exp. Bot. 73, 263–274. doi: 10.1093/jxb/erab427
Lauriks, F., Salomón, R. L., de Roo, L., Sobrino-Plata, J., Rodríguez-García, A., Steppe, K. (2022). Limited mitigating effects of elevated CO2 in young aspen trees to face drought stress. Environ. Exp. Bot. 201, 104942. doi: 10.1016/j.envexpbot.2022.104942
Lee, M. R., Bernhardt, E. S., van Bodegom, P. M., Cornelissen, J. H. C., Kattge, J., Laughlin, D. C., et al. (2017). Invasive species’ leaf traits and dissimilarity from natives shape their impact on nitrogen cycling: a meta-analysis. New Phytol. 213, 128–139. doi: 10.1111/nph.14115
Lefcheck, J. S. (2016). piecewiseSEM: Piecewise structural equation modelling in r for ecology, evolution, and systematics. Methods Ecol. Evol. 7, 573–579. doi: 10.1111/2041-210X.12512
Liu, Y., Oduor, A. M. O., Zhang, Z., Manea, A., Tooth, I. M., Leishman, M. R., et al. (2017). Do invasive alien plants benefit more from global environmental change than native plants? Glob. Chang. Biol. 23, 3363–3370. doi: 10.1111/gcb.13579
Liu, H., Ye, Q., Simpson, K. J., Cui, E., Xia, J. (2022). Can evolutionary history predict plant plastic responses to climate change? New Phytol. 235, 1260–1271. doi: 10.1111/nph.18194
Luo, J.-J., Gao, Y.-M., Feng, W.-W., Liu, M.-C., Qu, B., Zhang, C., et al. (2022). Stronger ability to absorb nitrate and associated transporters in the invasive plant Xanthium strumarium compared with its native congener. Environ. Exp. Bot. 198, 104851. doi: 10.1016/j.envexpbot.2022.104851
Ma, Y., Cao, B., Devi, M. J., Feng, X., Li, Y., Song, L., et al. (2023). Characterization of GALA (α-galactosidase) gene family and studying its response to elevated CO2 in Lycium barbarum. Environ. Exp. Bot. 208, 105270. doi: 10.1016/j.envexpbot.2023.105270
Manusadžianas, L., Darginavičienė, J., Gylytė, B., Jurkonienė, S., Krevš, A., Kučinskienė, A., et al. (2014). Ecotoxicity effects triggered in aquatic organisms by invasive Acer negundo and native Alnus glutinosa leaf leachates obtained in the process of aerobic decomposition. Sci. Total. Environ. 496, 35–44. doi: 10.1016/j.scitotenv.2014.07.005
McEvoy, S. L., Sezen, U. U., Trouern-Trend, A., McMahon, S. M., Schaberg, P. G., Yang, J., et al. (2022). Strategies of tolerance reflected in two North American maple genomes. Plant J. 109, 1591–1613. doi: 10.1111/tpj.15657
Moejes, F. W., Matuszynska, A., Adhikari, K., Bassi, R., Cariti, F., Cogne, G., et al. (2017). A systems-wide understanding of photosynthetic acclimation in algae and higher plants. J. Exp. Bot. 68, 2667–2681. doi: 10.1093/jxb/erx137
Onoda, Y., Wright, I. J., Evans, J. R., Hikosaka, K., Kitajima, K., Niinemets, Ü., et al. (2017). Physiological and structural tradeoffs underlying the leaf economics spectrum. New Phytol. 214, 1447–1463. doi: 10.1111/nph.14496
Petruzzellis, F., Tordoni, E., Tomasella, M., Savi, T., Tonet, V., Palandrani, C., et al. (2021). Functional differentiation of invasive and native plants along a leaf efficiency/safety trade-off. Environ. Exp. Bot. 188, 104518. doi: 10.1016/j.envexpbot.2021.104518
Porté, A. J., Lamarque, L. J., Lortie, C. J., Michalet, R., Delzon, S. (2011). Invasive Acer negundo outperforms native species in non-limiting resource environments due to its higher phenotypic plasticity. BMC Ecol. 11, 28. doi: 10.1186/1472-6785-11-28
Poucet, T., González-Moro, M. B., Cabasson, C., Beauvoit, B., Gibon, Y., Dieuaide-Noubhani, M., et al. (2021). Ammonium supply induces differential metabolic adaptive responses in tomato according to leaf phenological stage. J. Exp. Bot. 72, 3185–3199. doi: 10.1093/jxb/erab057
Rachmilevitch, S., Cousins, A. B., Bloom, A. J. (2004). Nitrate assimilation in plant shoots depends on photorespiration. Proc. Natl. Acad. Sci. U.S.A. 101, 11506–11510. doi: 10.1073/pnas.0404388101
Rathee, S., Ahmad, M., Sharma, P., Singh, H. P., Batish, D. R., Kaur, S., et al. (2021). Biomass allocation and phenotypic plasticity are key elements of successful invasion of Parthenium hysterophorus at high elevation. Environ. Exp. Bot. 184, 104392. doi: 10.1016/j.envexpbot.2021.104392
Rout, M. E., Callaway, R. M. (2009). An invasive plant paradox. Science 324, 734–735. doi: 10.1029/2003GL019334
Rubio-Asensio, J. S., Bloom, A. J. (2017). Inorganic nitrogen form: a major player in wheat and Arabidopsis responses to elevated CO2. J. Exp. Bot. 68, 2611–2625. doi: 10.1093/jxb/erw465
Saccone, P., Pagès, J.-P., Girel, J., Brun, J.-J., Michalet, R. (2010). Acer negundo invasion along a successional gradient: early direct facilitation by native pioneers and late indirect facilitation by conspecifics. New Phytol. 187, 831–842. doi: 10.1111/j.1469-8137.2010.03289.x
Sakoda, K., Yamori, W., Groszmann, M., Evans, J. R. (2021). Stomatal, mesophyll conductance, and biochemical limitations to photosynthesis during induction. Plant Physiol. 185, 146–160. doi: 10.1093/plphys/kiaa011
Salter, W. T., Merchant, A. M., Richards, R. A., Trethowan, R., Buckley, T. N. (2019). Rate of photosynthetic induction in fluctuating light varies widely among genotypes of wheat. J. Exp. Bot. 70, 2787–2796. doi: 10.1093/jxb/erz100
Skinner, C. B., Poulsen, C. J., Mankin, J. S. (2018). Amplification of heat extremes by plant CO2 physiological forcing. Nat. Commun. 9, 1094. doi: 10.1038/s41467-018-03472-w
Smith, N. G., Keenan, T. F. (2020). Mechanisms underlying leaf photosynthetic acclimation to warming and elevated CO2 as inferred from least-cost optimality theory. Glob. Chang. Biol. 26, 5202–5216. doi: 10.1111/gcb.15212
Sperry, J. S., Venturas, M. D., Todd, H. N., Trugman, A. T., Anderegg, W. R., Wang, Y., et al. (2019). The impact of rising CO2 and acclimation on the response of US forests to global warming. Proc. Natl. Acad. Sci. 116, 25734–25744. doi: 10.1073/pnas.1913072116
Stefanski, A., Bermudez, R., Sendall, K. M., Montgomery, R. A., Reich, P. B. (2020). Surprising lack of sensitivity of biochemical limitation of photosynthesis of nine tree species to open-air experimental warming and reduced rainfall in a southern boreal forest. Glob. Chang. Biol. 26, 746–759. doi: 10.1111/gcb.14805
Tcherkez, G., Ben Mariem, S., Larraya, L., García-Mina, J. M., Zamarreño, A. M., Paradela, A., et al. (2020). Elevated CO2 has concurrent effects on leaf and grain metabolism but minimal effects on yield in wheat. J. Exp. Bot. 71, 5990–6003. doi: 10.1093/jxb/eraa330
Trouwborst, G., Hogewoning, S. W., Harbinson, J., van Ieperen, W. (2011). Photosynthetic acclimation in relation to nitrogen allocation in cucumber leaves in response to changes in irradiance. Physiol. Plant 142, 157–169. doi: 10.1111/j.1399-3054.2011.01456.x
USDA. (2005). Available at: https://www.invasive.org/weedcd/pdfs/wow/armur-maple.pdf.
Vega-Mas, I., Pérez-Delgado, C. M., Marino, D., Fuertes-Mendizábal, T., González-Murua, C., Márquez, A. J., et al. (2017). Elevated CO2 induces root defensive mechanisms in tomato plants when dealing with ammonium toxicity. Plant Cell Physiol. 58, 2112–2125. doi: 10.1093/pcp/pcx146
Walker, B. J., Skabelund, D. C., Busch, F. A., Ort, D. R. (2016). An improved approach for measuring the impact of multiple CO2 conductances on the apparent photorespiratory CO2 compensation point through slope-intercept regression. Plant Cell Environ. 39, 1198–1203. doi: 10.1111/pce.12722
Wang, L., Dang, Q.-L. (2023). CO2 demand-supply coordination in photosynthesis reflecting the plant-environment interaction: extension and parameterization of demand function and supply function. AJPS 14, 220–245. doi: 10.4236/ajps.2023.142017
Wang, S., Guan, K., Wang, Z., Ainsworth, E. A., Zheng, T., Townsend, P. A., et al. (2021). Unique contributions of chlorophyll and nitrogen to predict crop photosynthetic capacity from leaf spectroscopy. J. Exp. Bot. 72, 341–354. doi: 10.1093/jxb/eraa432
Wang, L., Zheng, J., Wang, G., Dang, Q.-L. (2022). Combined effects of elevated CO2 and warmer temperature on limitations to photosynthesis and carbon sequestration in yellow birch. Tree Physiol 43, 379–389. doi: 10.1093/treephys/tpac128
Wang, W., Zhu, Q., Dai, S., Meng, L., He, M., Chen, S., et al. (2023). Effects of Solidago canadensis L. @ on mineralization-immobilization turnover enhance its nitrogen competitiveness and invasiveness. Sci. Total. Environ. 882, 163641. doi: 10.1016/j.scitotenv.2023.163641
Wellburn, A. R. (1994). The Spectral Determination of Chlorophylls a and b, as well as Total Carotenoids, Using Various Solvents with Spectrophotometers of Different Resolution. J. Plant Physiol. 144, 307–313. doi: 10.1016/S0176-1617(11)81192-2
Wujeska-Klause, A., Crous, K. Y., Ghannoum, O., Ellsworth, D. S. (2019). Lower photorespiration in elevated CO2 reduces leaf N concentrations in mature Eucalyptus trees in the field. Glob. Chang. Biol. 25, 1282–1295. doi: 10.1111/gcb.14555
Xiong, D., Flexas, J. (2018). Leaf economics spectrum in rice: leaf anatomical, biochemical, and physiological trait trade-offs. J. Exp. Bot. 69, 5599–5609. doi: 10.1093/jxb/ery322
Xu, Y., Shang, B., Feng, Z., Tarvainen, L. (2020). Effect of elevated ozone, nitrogen availability and mesophyll conductance on the temperature responses of leaf photosynthetic parameters in poplar. Tree Physiol. 40, 484–497. doi: 10.1093/treephys/tpaa007
Yin, X., Schapendonk, A. H. C. M., Struik, P. C. (2019). Exploring the optimum nitrogen partitioning to predict the acclimation of C3 leaf photosynthesis to varying growth conditions. J. Exp. Bot. 70, 2435–2447. doi: 10.1093/jxb/ery277
Keywords: global change, nitrogen form, amur maple, boxelder maple, photosynthetic adaptation
Citation: Wang L and Dang Q-L (2024) Elevated CO2 and ammonium nitrogen promoted the plasticity of two maple in great lakes region by adjusting photosynthetic adaptation. Front. Plant Sci. 15:1367535. doi: 10.3389/fpls.2024.1367535
Received: 08 January 2024; Accepted: 26 March 2024;
Published: 09 April 2024.
Edited by:
Giovanna Battipaglia, University of Campania Luigi Vanvitelli, ItalyReviewed by:
Hamada Ali, Sultan Qaboos University, OmanWei-Bin Wang, Shenyang Agricultural University, China
Copyright © 2024 Wang and Dang. This is an open-access article distributed under the terms of the Creative Commons Attribution License (CC BY). The use, distribution or reproduction in other forums is permitted, provided the original author(s) and the copyright owner(s) are credited and that the original publication in this journal is cited, in accordance with accepted academic practice. No use, distribution or reproduction is permitted which does not comply with these terms.
*Correspondence: Lei Wang, rockyking@163.com; Qing-Lai Dang, qdang@lakeheadu.ca