 Jianhui Ma1*
 Miaomiao Ye1
 Qianqian Liu1Meng Yuan1,2Daijing Zhang1
 Chunxi Li1
 Qingdong Zeng2
 Jianhui Wu2
 Dejun Han2*
 Lina Jiang1*
- 1College of Life Science, Henan Normal University, Xinxiang, China
- 2State Key Laboratory of Crop Stress Biology in Arid Areas, Northwest A&F University, Yangling, Shanxi, China
Introduction: Zinc (Zn) deficiency causes serious diseases in people who rely on cereals as their main food source. However, the grain zinc concentration (GZnC) in wheat is low. Biofortification is a sustainable strategy for reducing human Zn deficiency.
Methods: In this study, we constructed a population of 382 wheat accessions and determined their GZnC in three field environments. Phenotype data was used for a genome-wide association study (GWAS) using a 660K single nucleotide polymorphism (SNP) array, and haplotype analysis identified an important candidate gene for GZnC.
Results: We found that GZnC of the wheat accessions showed an increasing trend with their released years, indicating that the dominant allele of GZnC was not lost during the breeding process. Nine stable quantitative trait loci (QTLs) for GZnC were identified on chromosomes 3A, 4A, 5B, 6D, and 7A. And an important candidate gene for GZnC, namely, TraesCS6D01G234600, and GZnC between the haplotypes of this gene showed, significant difference (P ≤ 0.05) in three environments.
Discussion: A novel QTL was first identified on chromosome 6D, this finding enriches our understanding of the genetic basis of GZnC in wheat. This study provides new insights into valuable markers and candidate genes for wheat biofortification to improve GZnC.
1 Introduction
Zinc (Zn) is an essential microelement for human normal metabolism. Zn deficiency causes serious diseases, such as liver cirrhosis, dwarfism, coronary heart disease, visual disorders, reproductive organ development disorders, and even cancer (Hambidge, 2000). Furthermore, approximately 17% of the world population is affected by Zn deficiency, especially women and children in developing countries (Shah and Sachdev, 2006; Wessells and Brown, 2012; Black et al., 2013). Bread wheat (Triticum aestivum L.) is one of the most important cereal crops in the world; its products provide approximately 20% of the energy and protein in the human diet (Ludwig and Slamet-Loedin, 2019). However, the grain Zn concentration (GZnC) is below the minimum level (38 mg/kg) required to meet human needs and cannot satisfy the demand from the people consuming wheat as their main staple food (Bouis et al., 2011). Therefore, increasing wheat GZnC is an important goal in wheat breeding.
Owing to the important role of wheat in human nutrition, wheat biofortification can be used as a cost-effective strategy to alleviate Zn deficiency, especially in low-income countries, where most people rely on cereal foods for a basic diet (Velu et al., 2014; Andersson et al., 2017; Ma et al., 2022). However, owing to the ambiguity of the genetic architecture and molecular processes regulating Zn homeostasis in wheat, breeding outstanding varieties with high GZnC is a difficult challenge (Gupta et al., 2021). Identification of molecular markers that are closely linked to QTLs controlling complex quantitative traits, such as grain iron, zinc, or protein concentration, are a goal on their own to facilitate the development of biofortified wheat cultivars through marker-assisted breeding, whereby, improving our understanding of the genetic basis of GZnC in wheat demands identifying as many causal loci as possible. Currently, genome-wide association study (GWAS) is the most popular method for analysing the genetic basis of complex traits in wheat (Breseghello and Sorrells, 2006; Bradbury et al., 2007).
Recently, some studies have been conducted to identify QTLs for wheat GZnC by GWAS to further improvement. Specifically, to the best of our knowledge, nine GWAS studies have been conducted to identify QTLs and marker-trait associations (MTAs) for wheat GZnC. Thus, for example, Velu et al. identified 39 significant MTAs for wheat GZnC located on chromosomes 1A, 2A, 2B, 2D, 5A, 6B, 6D, 7B, and 7D, explaining 5% to 10.5% of the phenotypic variation (Velu et al., 2018). In turn, Alomari et al. detected 40 MTAs on chromosomes 2A, 3A, 3B, 4A, 4D, 5A, 5B, 5D, 6D, 7A, 7B, and 7D for wheat GZnC, which explained 2.5% to 5.2% of the phenotypic variation (Alomari et al., 2018). Similarly, Cu et al. identified 72 MTAs for wheat GZnC on chromosomes 1A, 2A, 3A, 4A, 5B, and 7A, explaining 3.7% to 5.2% of the phenotypic variation (Cu et al., 2020). Furthermore, Liu et al. detected 16 QTLs for wheat GZnC on chromosomes 1B, 3A, 3D, 4A, 4B, 5A, 5D, 6B, 6D, and 7D, explaining 2.7% to 6.6% of the phenotypic variation (Liu et al., 2021). In turn, Zhou et al. detected 29 QTLs on chromosomes 1A, 1B, 1D, 2B, 2D, 3A, 3B, 3D, 4A, 4B, 5A, 5B, 6A, 6B, 6D, and 7A, which explained 9.75% to 24.77% of the phenotypic variation (Zhou et al., 2020). Tong et al. identified 25 QTLs on chromosomes 1A, 2A, 3A, 3B, 5A, 5D, 6A, 6B, 6D, 7A, 7B, and 7D, which explained 7.73% to 13.57% of the phenotypic variation (Tong et al., 2022). Rathan et al. identified two MTAs on chromosomes 1A and 7B, explaining 6.35% to 7.60% of the phenotypic variation (Rathan et al., 2022). Juliana et al. identified 67 MTAs on chromosomes 1A, 1B, 2A, 2D, 3B, 4A, 5A, 5B, 5D, 6B, 6D, and 7B, among which the maximum phenotypic variation explained is 7.3% (Juliana et al., 2022). Krishnappa et al. found five MTAs on chromosomes 2B, 5B, 6A, and 7B, contributing to 5.7% to 10.9% of the phenotypic variation (Krishnappa et al., 2022). However, they are insufficient for further map-based cloning.
Using of different germplasm resources and high resolution genotyping techniques may contribute to identify important QTLs for wheat GZnC; therefore enriching the genetic information. In this study, 382 wheat accessions were used to determine wheat GZnC in three environments to analysis the changes of wheat GZnC. Additionally, a GWAS using a 660K single nucleotide polymorphism (SNP) array was conducted to identify significant QTLs and candidate genes for GZnC. Thus, this study aimed to provide useful information for further GZnC improvement for in wheat.
2 Materials and methods
2.1 Plant materials
Based on previous diversity assessments, the experimental material used herein comprised 382 representative wheat accessions, including 68 exotic cultivars, 43 landraces, and 271 domestic cultivars. These accessions were planted in the cropping season from 2017 to 2018 in Nanyang (33.03°N, 112.50°E), Suqian (34.02°N, 118.33°E), and Yangling (34.16°N, 108.40°E), where the soil Zn concentrations were 221.38, 384.86, and 233.25 mg/kg, respectively. The field was managed according to the local standard agronomic practices.
2.2 Determination of GZnC
Wheat grains were harvested manually in the field. Three biological replicates were sampled from each wheat accession in each environment. Wheat grains were washed with distilled water and dried to avoid potential contamination. Dried wheat grains were ground to whole wheat flour using a stainless steel grinder (MM400, Retsch, Haan, Germany), and whole wheat flour was subsequently oven-dried at 80 °C for 12 h. Subsequencely, 0.2 g of whole wheat flour was digested in 8 ml of a mixture of high-purity concentrated nitric acid and hydrogen peroxide (HNO3/H2O2, 75/25, v/v), and then diluted with ultrapure water. After filtration, the zinc concentration in the digestion solution was determined using an inductively coupled plasma system (iCAP 7000, Thermo Scientific) according to the method described by Ma et al. (2022). And a standard curve (0.07, 0.14, 0.21, 0.28, 0.35, 0.42 mg/L) was used for each round of determinations. Finally, the GZnC (mg/kg) was calculated on a dried weight basis.
2.3 Statistical analysis
Analysis of variance (ANOVA) and t-test were performed using SPSS 26.0. The following formula was used for estimating generalised heritability (H2):
Where represents the phenotypic variation due to the genotype, represents the phenotypic variation due to the environment × genotype interaction, represents error variance, n represents the number of environments, and r represents the number of replicates. The best linear unbiased predictions (BLUPs) of GZnC for each accession across the three environments were calculated using the mixed linear model in the “lem4” package, version 3.5.3 of R, and were used for further GWAS.
2.4 SNP genotyping and screening
The Affymetrix Wheat 660K SNP array was used to genotype the wheat panel. SNP genotype calls and allele clustering were analyzed using the Affmetrix Genotyping Console software. The parameters of allele frequency (MAF) less than 0.05 and missing data greater than 10% were used to filter the SNP marker to ensure the accuracy of genotyping, together with a Hardy-Weinberg equilibrium value greater than 0.01 (Wu et al., 2021), resulting in a total of 405,606 high-quality SNP markers for GWAS. The physical locations of all SNP markers were determined using the bread wheat reference genome of IWGSC RefSeq v1.0 (I.W.G.S.C, 2018).
2.5 Linkage disequilibrium analysis, population structure and GWAS
Genome-wide LD analysis was performed using PLINK. The squared correlation (r2) of allele frequencies was plotted in R Studio using genetic distance (Mb). The LD decay pattern was determined as the distance at which the LD value was reduced to half of its maximum value. STRUCTURE v2.3.4 (unlinked markers (r2 = 0)) was used to calculate population structure (Pritchard et al., 2000). Each K value with a burn-in length of 20,000 was calculated five times, and iterations were set to be 10,000. The delta K (ΔK) method was used to determine the most likely number of subpopulations based on the change rate between the K values (Earl and vonHoldt, 2012). The general linear model in the GEMMA software was used to conduct GWAS, and BLUPs of 382 wheat accessions were used as phenotypic data for GWAS. After calculating the suggestive P-value threshold based on Bonferroni’s correction (P = 1/Ne, where Ne represents the effective number of independent SNPs), we considered -log10 (P-value) ≥ 4.5 to be significant. The -log10 (P-value) values for all SNPs were plotted on a Manhattan plot.
2.6 Candidate gene identification
Non-synonymous mutations were obtained using significant SNPs in the selected QTLs, and phenotypic differences between haplotypes in the three environments were analyzed to identify the candidate genes. Root, stem, and leaf tissues at the jointing and heading stages, as well as wheat grains at 5, 10, 20, and 25 days post-anthesis (DPA), were collected from cv. Chinese Spring, which has been used for genome sequencing (I.W.G.S.C, 2018), for quantitative real-time PCR (qRT-PCR). Total RNA of each sample was extracted using TRIzol reagent (TaKaRa, Japan) following the manufacturer instructions, and first-strand cDNA was synthesised uisng the HiScript III First-stand cDNA synthesis kit (Vazyme, Nanjing, China). In turn, qPCR was conducted on an ABI 7500 real-time PCR system (Applied Biosystems, USA) using a SYBR Premix Ex Taq Kit (TaKaRa, Japan). TaTubulin was used as an internal control, and the related expression levels were calculated using the 2−△△Ct method. Primers for qRT-PCR are listed in Table S1.
3 Results
3.1 Phenotypic analysis of GZnC
The GZnC of 382 wheat accessions in three environments was determined (Table S2), and the corresponding maximum, minimum, median, variance, coefficient of variation, skewness, and kurtosis were calculated (Table 1). The highest GZnC values were recorded in Suqian, the environment with the highest soil Zn concentration, and ranged from 22.31 to 92.38 mg/kg (average 35.73 mg/kg). Those recorded in Nanyang followed, ranging from 13.55 to 60.59 mg/kg (average 22.64 mg/kg). In turn, the wheat accessions in Yangling showed lowest GZnC, ranging from 11.92 to 36.65 mg/kg (average 21.50 mg/kg). BLUPs of GZnC based on three environments were calculated in the range 24.78~39.21 mg/kg. ANOVA revealed that the genotype, environment, and interaction of genotype and environment had significant effects on GZnC (P<0.001). The H2 of GZnC was determined to be 0.32, confirming that both environment and genotype had significant effects on GZnC (Table S3). In addition, the GZnC showed an approximately normal distribution in the three environments and BLUPs indicated by skewness, kurtosis, and GZnC distribution (Table 1; Figure 1). These findings indicated that the wheat panel was suitable for GWAS.
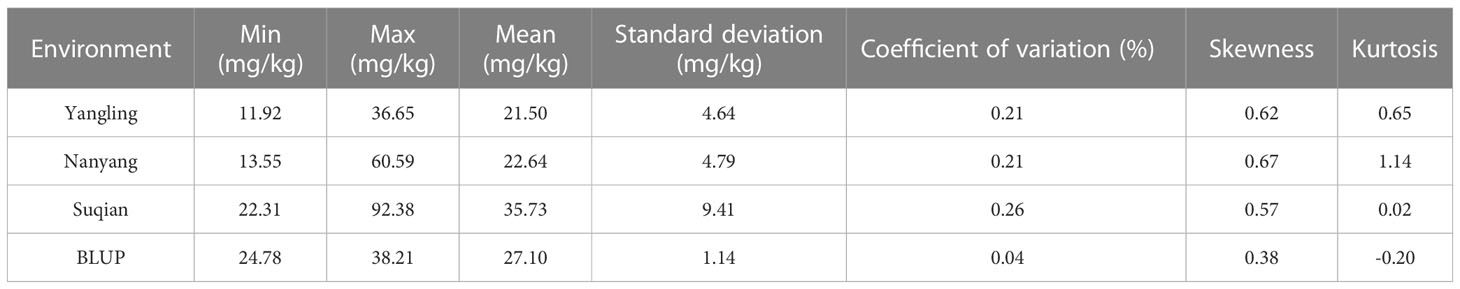
Table 1 Phenotypic data of GZnC in three environments and BLUP.
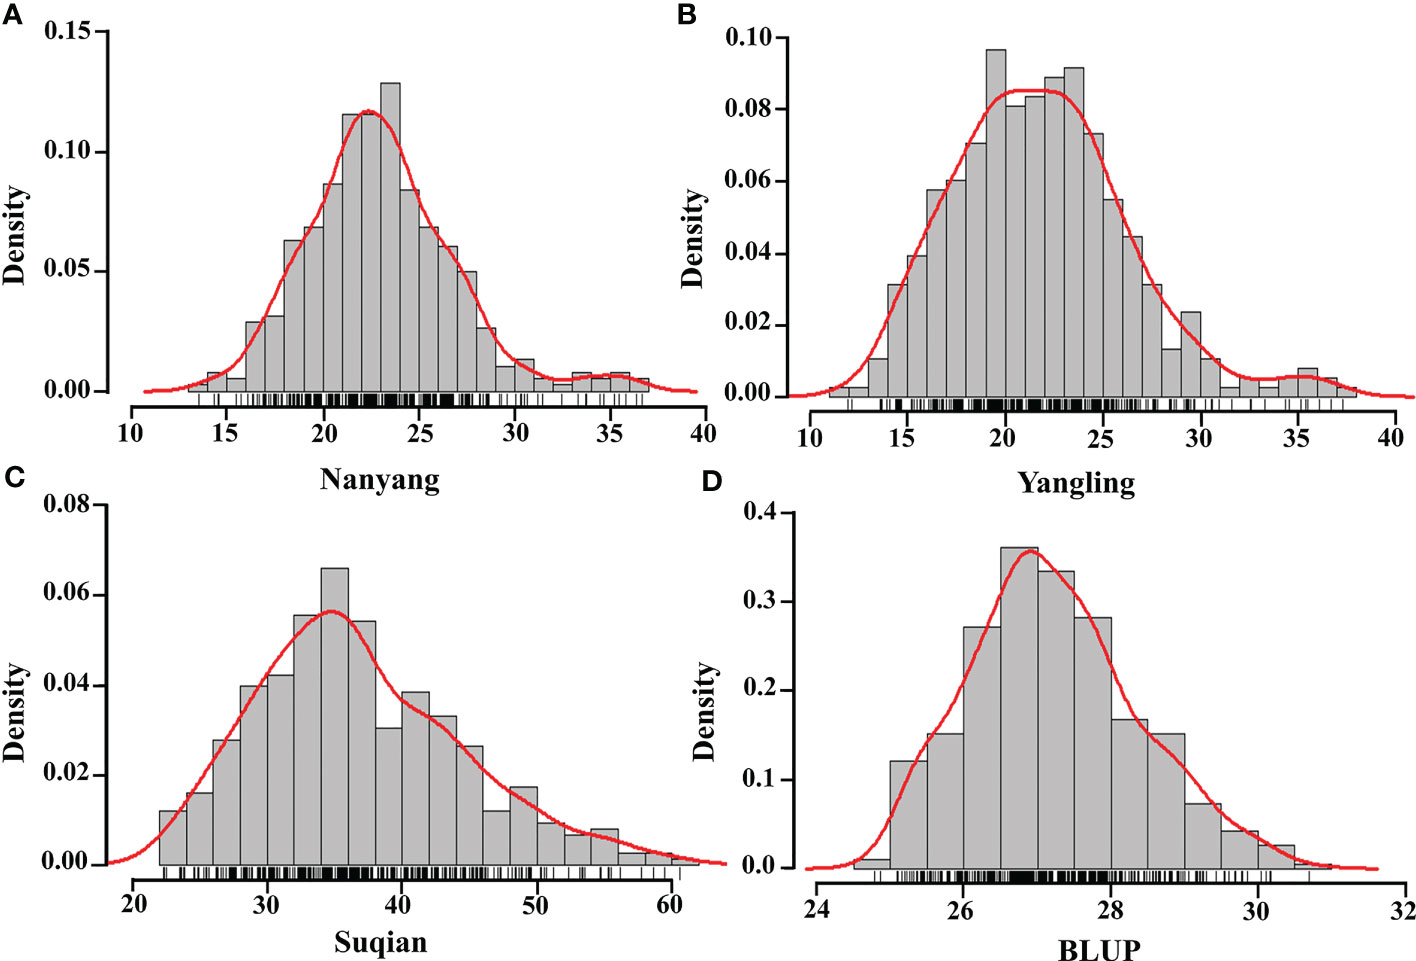
Figure 1 Histogram of wheat GZnC density in three environments and BLUP. Nanyang (A), Yangling (B), Suqian (C), BLUP (D), and the red curves and the black short horizontal lines represent the density curve and the rug plot of the distribution of GZnC.
3.2 GZnC variation with source and released years
Based on source, these wheat accessions were divided into three categories: 68 exotic cultivars, 43 landraces, and 271 domestic cultivars. Domestic cultivars showed the highest wheat GZnC, followed by landraces and exotic cultivars (Table 2). These wheat accessions were further divided into five stages according to the released years. In this respect, we found that GZnC increased from the pre-1950s to the post-1990s in Suqian and Yangling (Figures 2A, B), while it showed slightly fluctuation in Nanyang (Figure 2C). These findings indicate that the predominant allele may be selected during wheat breeding.
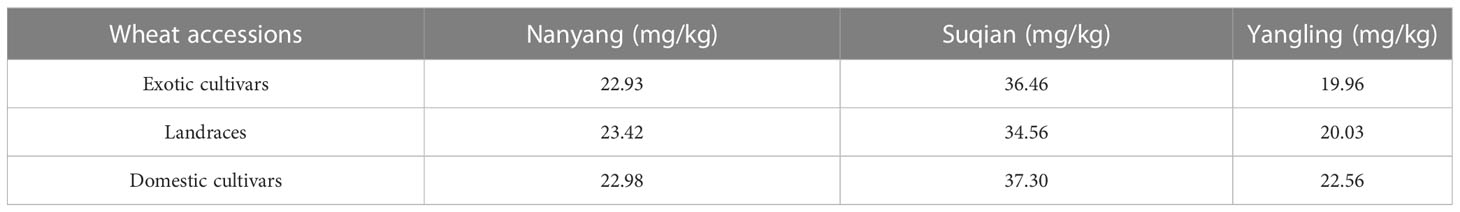
Table 2 GZnC of different source in three environments.
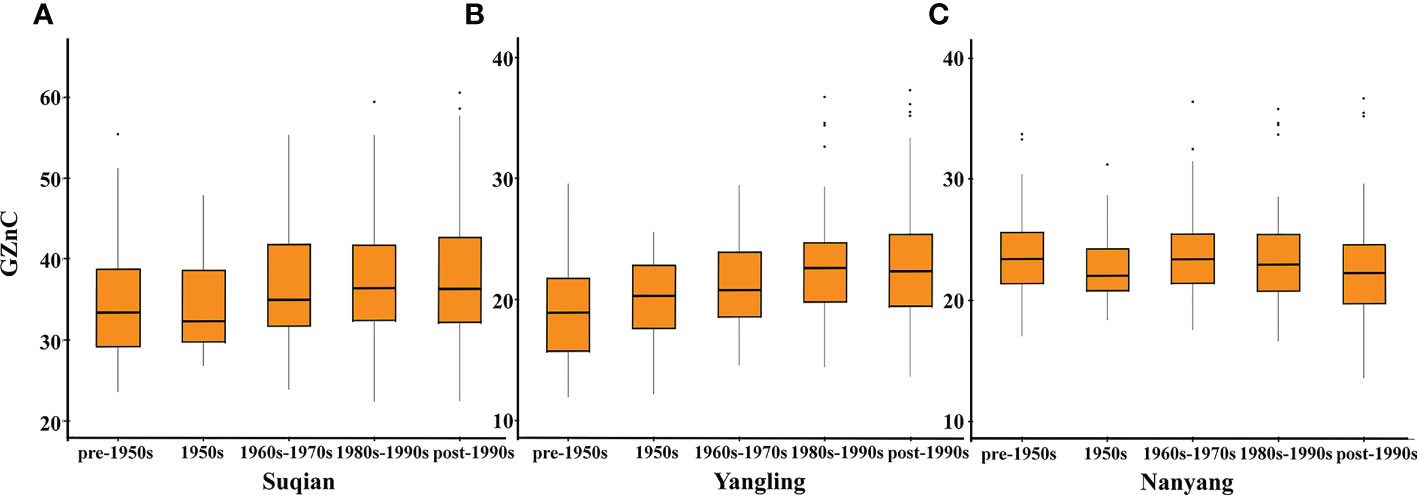
Figure 2 The changes of GZnC in Suqian (A), Yangling (B), and Nanyang (C) with released years.
3.3 Genotyping by SNP array and linkage disequilibrium analysis
The 660K SNP array was used for conducting a GWAS using the phenotypes of 382 wheat accessions. After removing low-quality SNPs (MAF< 0.05 and missing data > 0.1), 412,619 SNPs remained for subsequent analysis. A set of 405,606 SNPs was distributed on 21 chromosomes, of which the B subgenome (185,057) was the most labelled, followed by the A subgenome (162,316), and the D genome (58,233). Chromosomal distribution of SNP markers showed that chromosome 3B contained the largest number of SNP markers (45,867) and the least number was found on chromosome 4D (4,046). Further, marker density distribution was uneven across chromosomes, ranging from 5.67 markers per Mb (4D) to 66.53 markers per Mb (3B). In addition, the polymorphism information content of the three sub-genomes was 0.28, 0.29, and 0.27, respectively (Table 3).
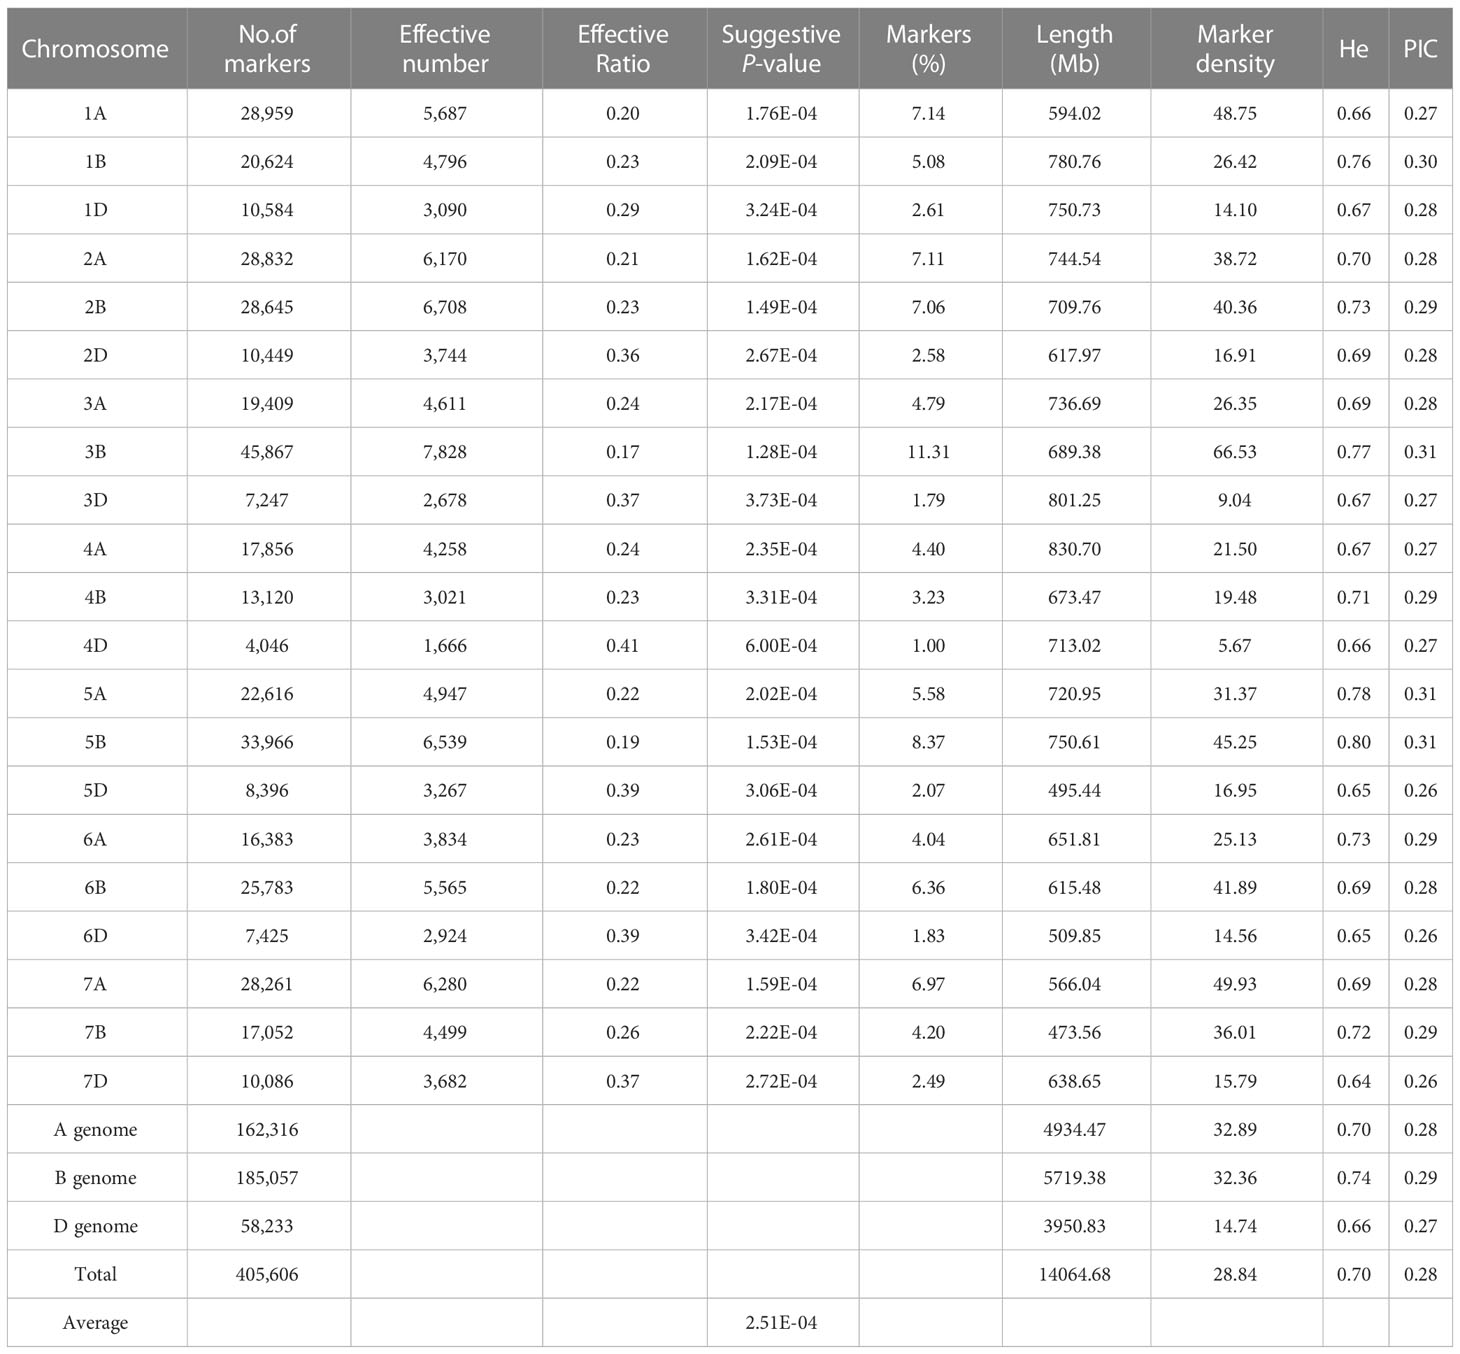
Table 3 Summary of the SNPs information in three sub-genomes and chromosomes of 382 wheat accessions.
Population structure analysis was performed for these 382 wheat accessions. According to the ΔK method of Bayesian clustering, the slope broke when K = 8. As a result, the 382 wheat accessions were divided into eight subpopulations, SP1-SP8 (Table S2; Figures 3A, B). SP1 contained eight exotic cultivars, two landraces, and 56 domestic cultivars, with an average GZnC of 27.36 mg/kg. SP2 contained four exotic cultivars, 35 landraces, and six domestic cultivars, with an average GZnC of 26.04 mg/kg. SP3 contained 59 domestic cultivars, with an average GZnC of 27.31 mg/kg. SP4 contained one exotic cultivars, two landraces, and 34 domestic cultivars, with an average GZnC of 27.29 mg/kg. SP5 contained two exotic cultivars and 38 domestic cultivars, with an average GZnC of 28.10 mg/kg. SP6 contained one exotic cultivar, one landraces, and 38 domestic cultivars, with an average GZnC of 27.90 mg/kg. SP7 contained 25 exotic cultivars, with an average GZnC of 26.46 mg/kg. SP8 contained 27 exotic cultivars, three landraces, and 40 domestic cultivars, with an average GZnC of 27.14 mg/kg (Table S4). We found that the GZnC fluctuated slightly among the eight subpopulations. LD was estimated using SNPs and squared allele frequency correlations (r2) for subgenomes A (162,316), B (185,057), and D (58,233). As expected, LD decayed with increasing physical distance, and it differed among subgenomes. Further, whole-genome-wide LD decayed with genetic distance, and it decayed to half of the genome at a genetic distance of 3.6 Mb. Subgenomes A, B, and D were 3.0 Mb, 5.7 Mb, and 1.6 Mb, respectively (Figure 3C).
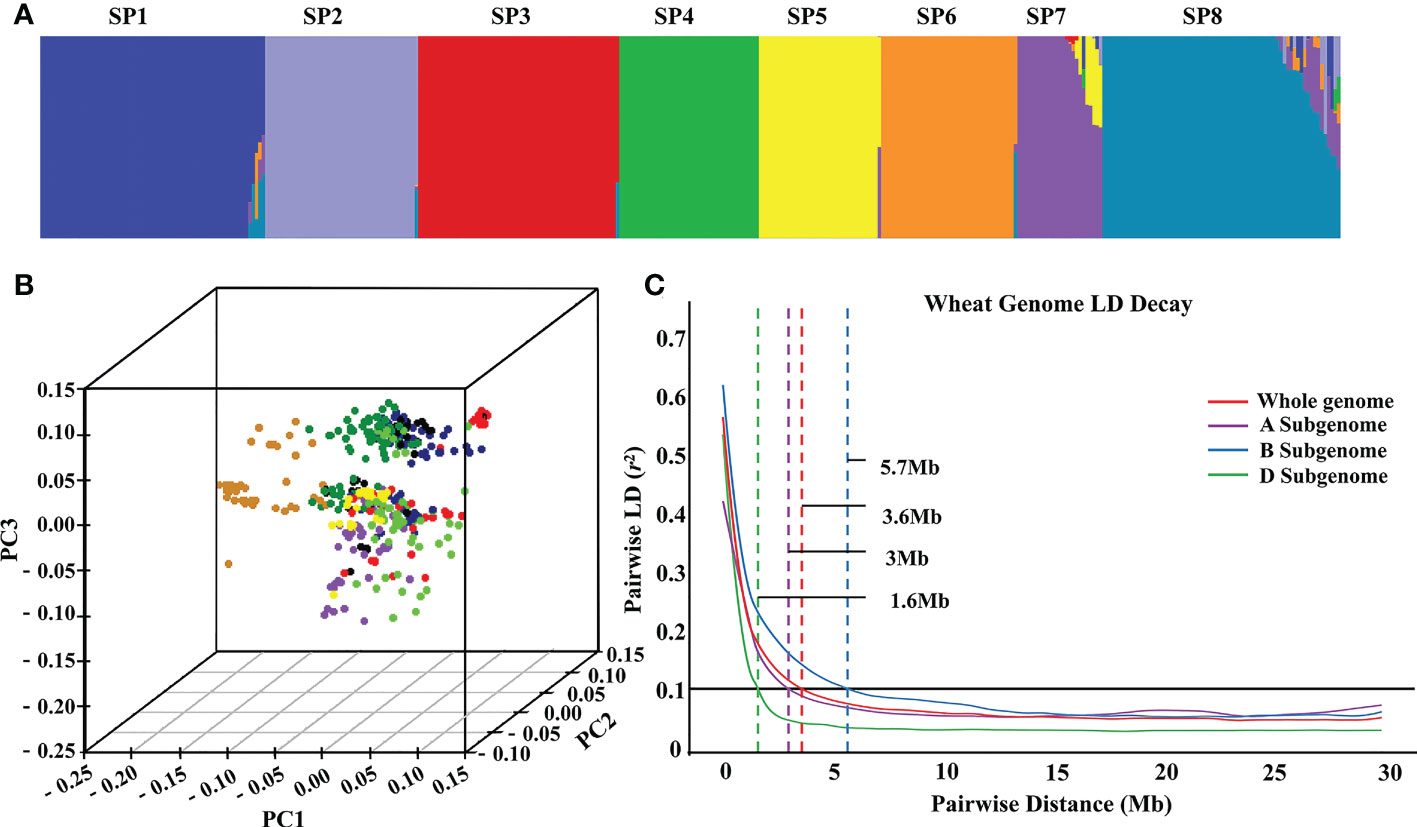
Figure 3 The population structure and linkage disequilibrium of 382 wheat accessions. Subpopulations inferred by K-mean structure analysis (A). Principal component analysis of all wheat accessions (B). LD decay (C) over different genetic distances (Mb) for A, B and D subgenomes and whole genome in the wheat panel (r2 = 0.1).
3.4 GWAS for GZnC
The BLUPs based on the GZnC across three environments were used for the GWAS using the Lm4 model. SNPs with –log10 (P-value) ≥ 4.5 were deemed significant (Figure 4). A total of nine significant QTLs were selected, locating on chromosomes 3A, 4A, 5B, 6D, and 7A. For convenience, the SNP markers with the highest threshold in each QTL were used to represent the corresponding QTL, and the effects of the nine QTLs ranged from 0.16 to 0.30 (Table 4).
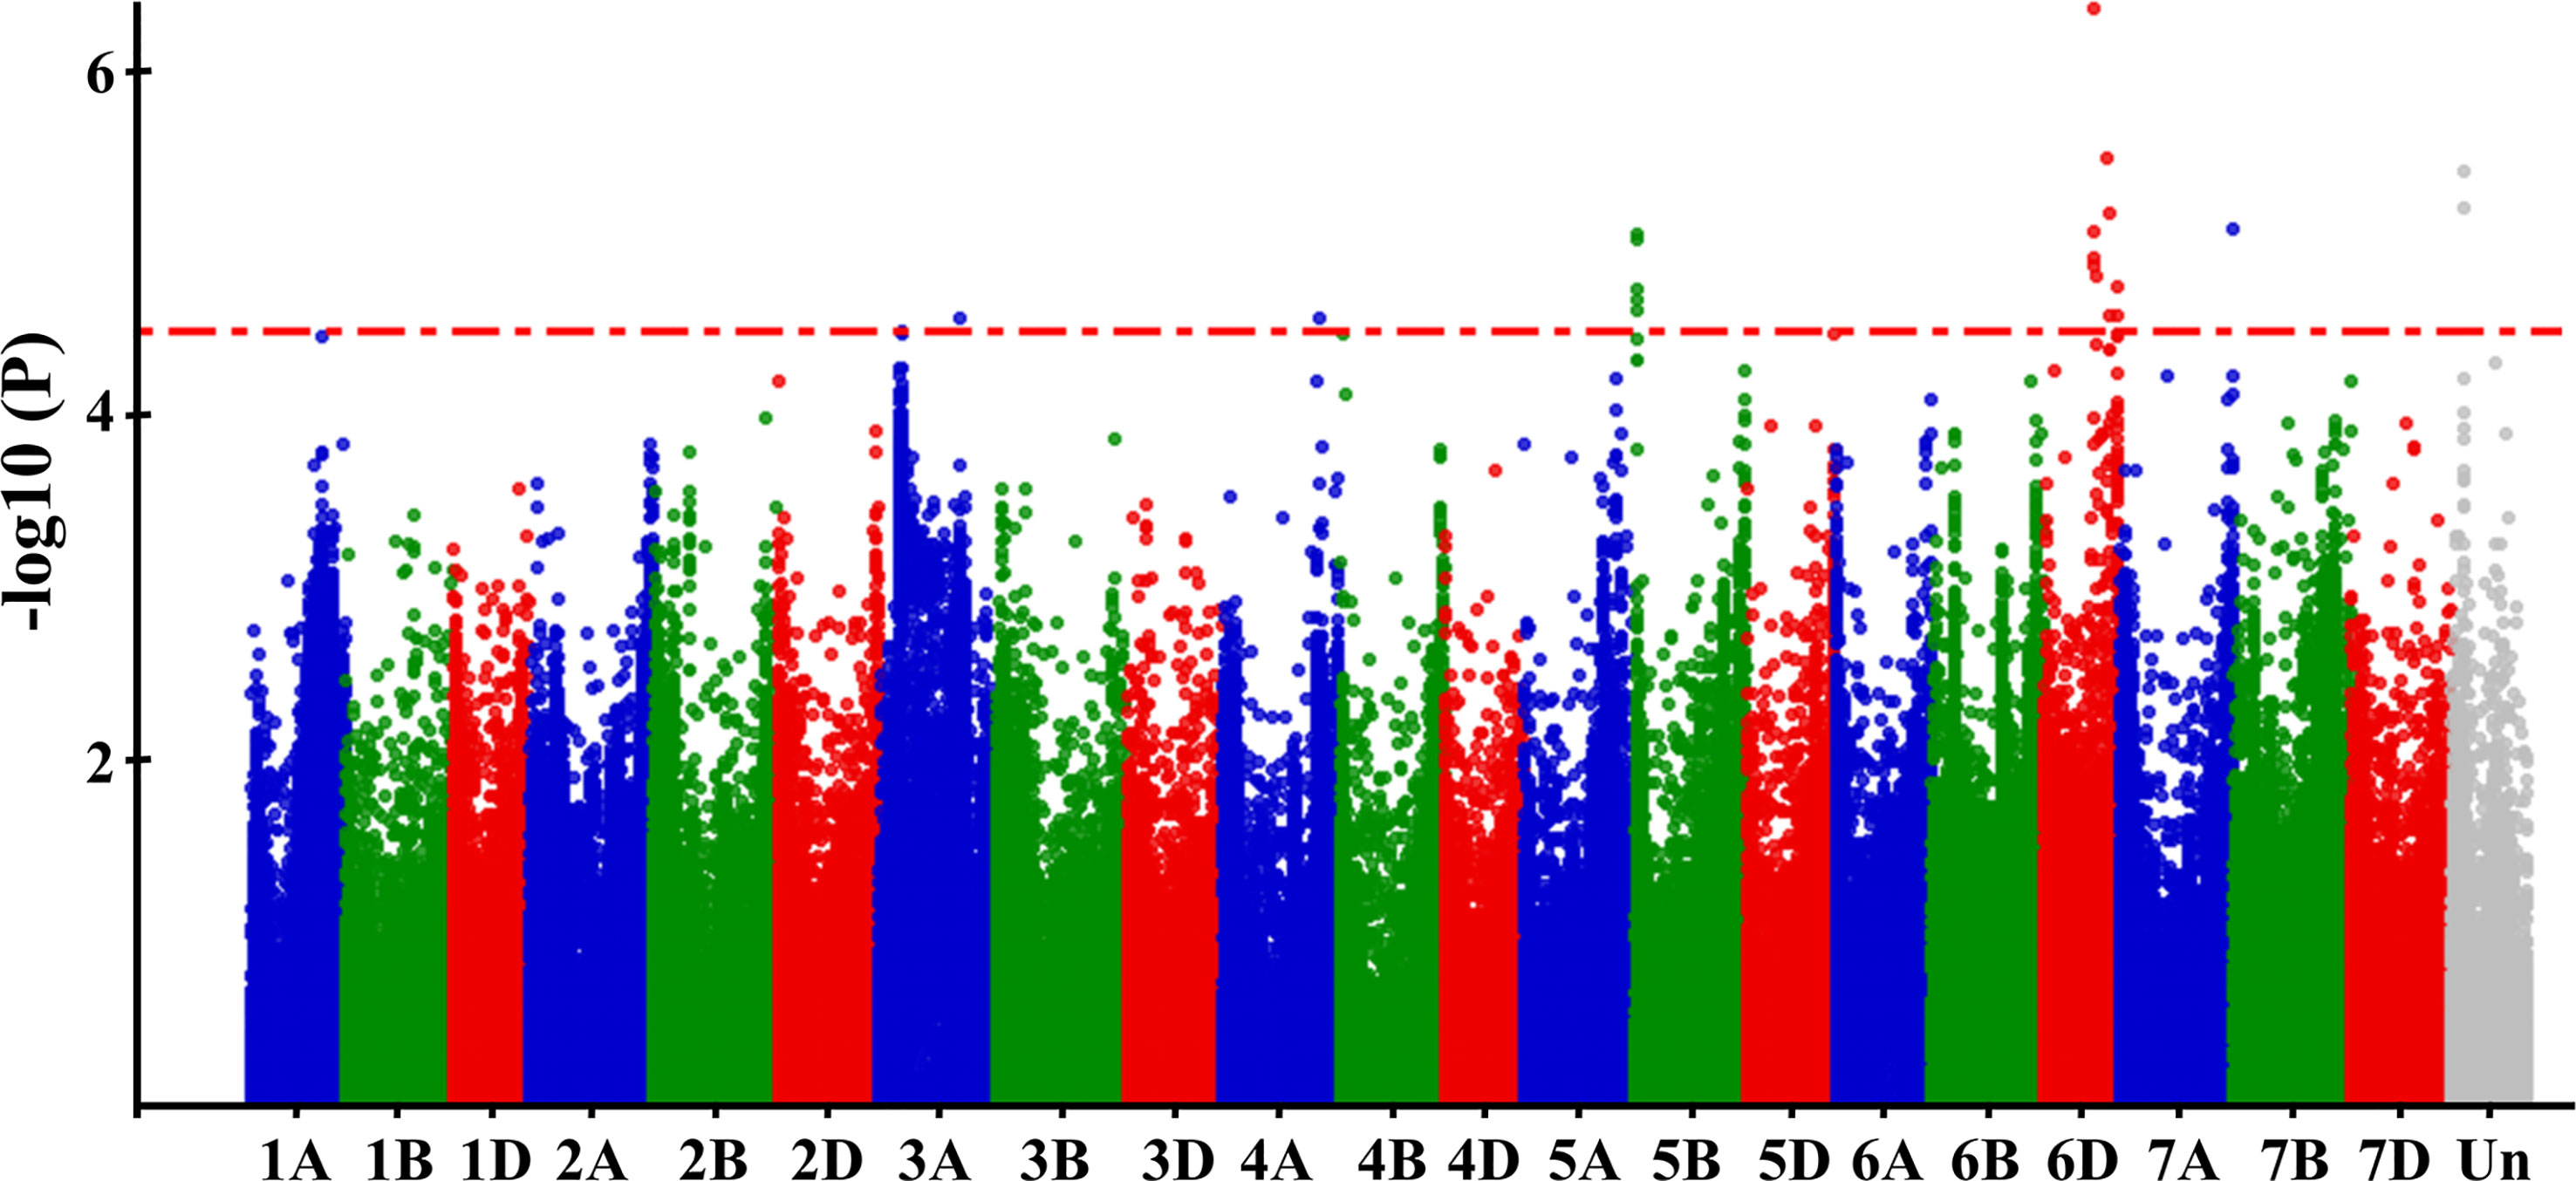
Figure 4 Manhattan plots of the GWAS results for GZnC. The resulting BLUPs of GZnC of 382 wheat accessions across three environments was used for GWAS. -log10 (P-value) of each SNP was shown in the Manhattan plot.
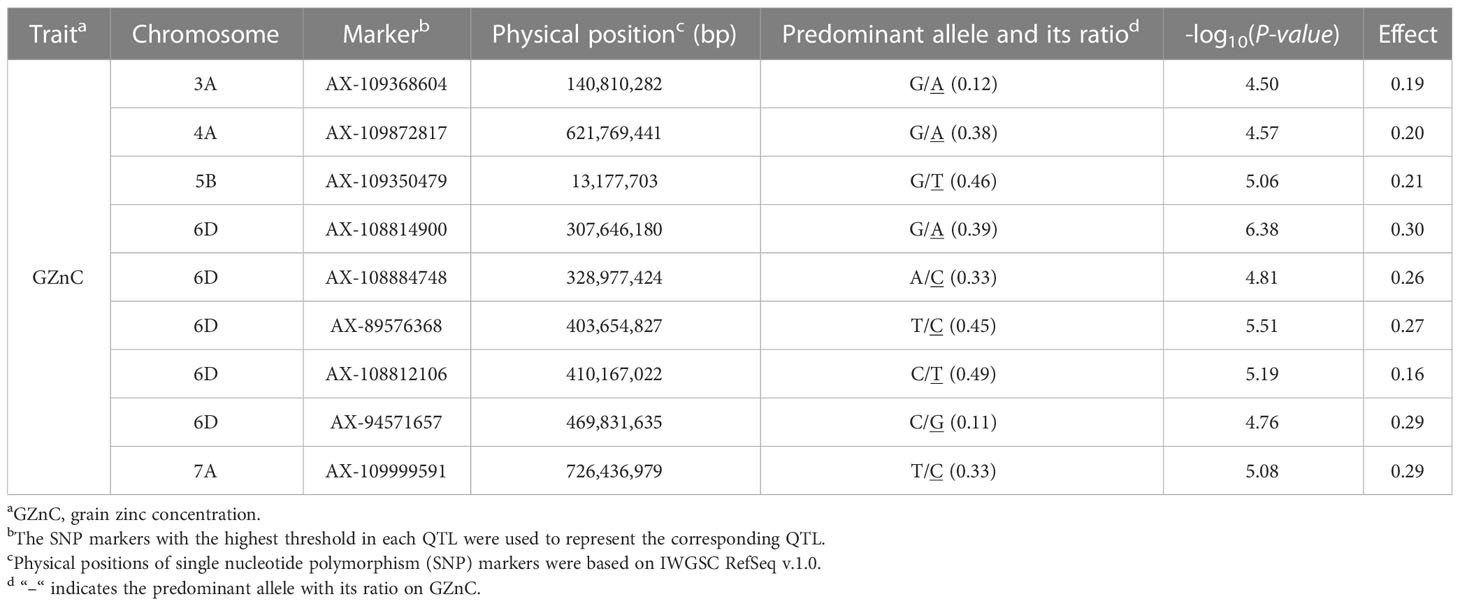
Table 4 Significant QTLs associated with GZnC.
3.5 Identification of candidate genes for wheat GZnC
A total of 494 genes were found in the nien QTLs. The functional annotations of these genes are provided in Table S5. We further analyzed significant SNPs in the nine QTLs that might cause missense mutations. Interestingly, we found that the phenotype between alleles, which was caused by the SNP AX-108884748, showed significant differences in the three environments, whereby it was further analyzed, as it may be closely related to GZnC.
The SNP, AX-108884748, is located at 328,977,424 bp on chromosome 6D (Figure 5A), and may cause an amino acid change from Arg (CC haplotype) to Ser (AA haplotype) at 1047 bp in the GDSL esterase-encoding gene, TraesCS6D01G234600 (Figure 5B). The 382 wheat accessions were divided into three categories according to genotype: among them, 250 wheat accessions with the CC haplotype, 123 with the AA haplotype, and 9 with heterozygosity or lack of genotype. After analysing the phenotypic data of the two haplotypes, the GZnC of the AA haplotype was found to be significantly higher (P ≤ 0.05) than that of the CC haplotype across three environments (Figure 5C). Further, qRT-PCR analysis showed that the gene was predominantly expressed in the root, stem, and grain tissues, suggesting a possible role in Zn transfer (Figure 5D). Altogether, these results indicate that TraesCS6D01G234600 is an important candidate gene for wheat GZnC.
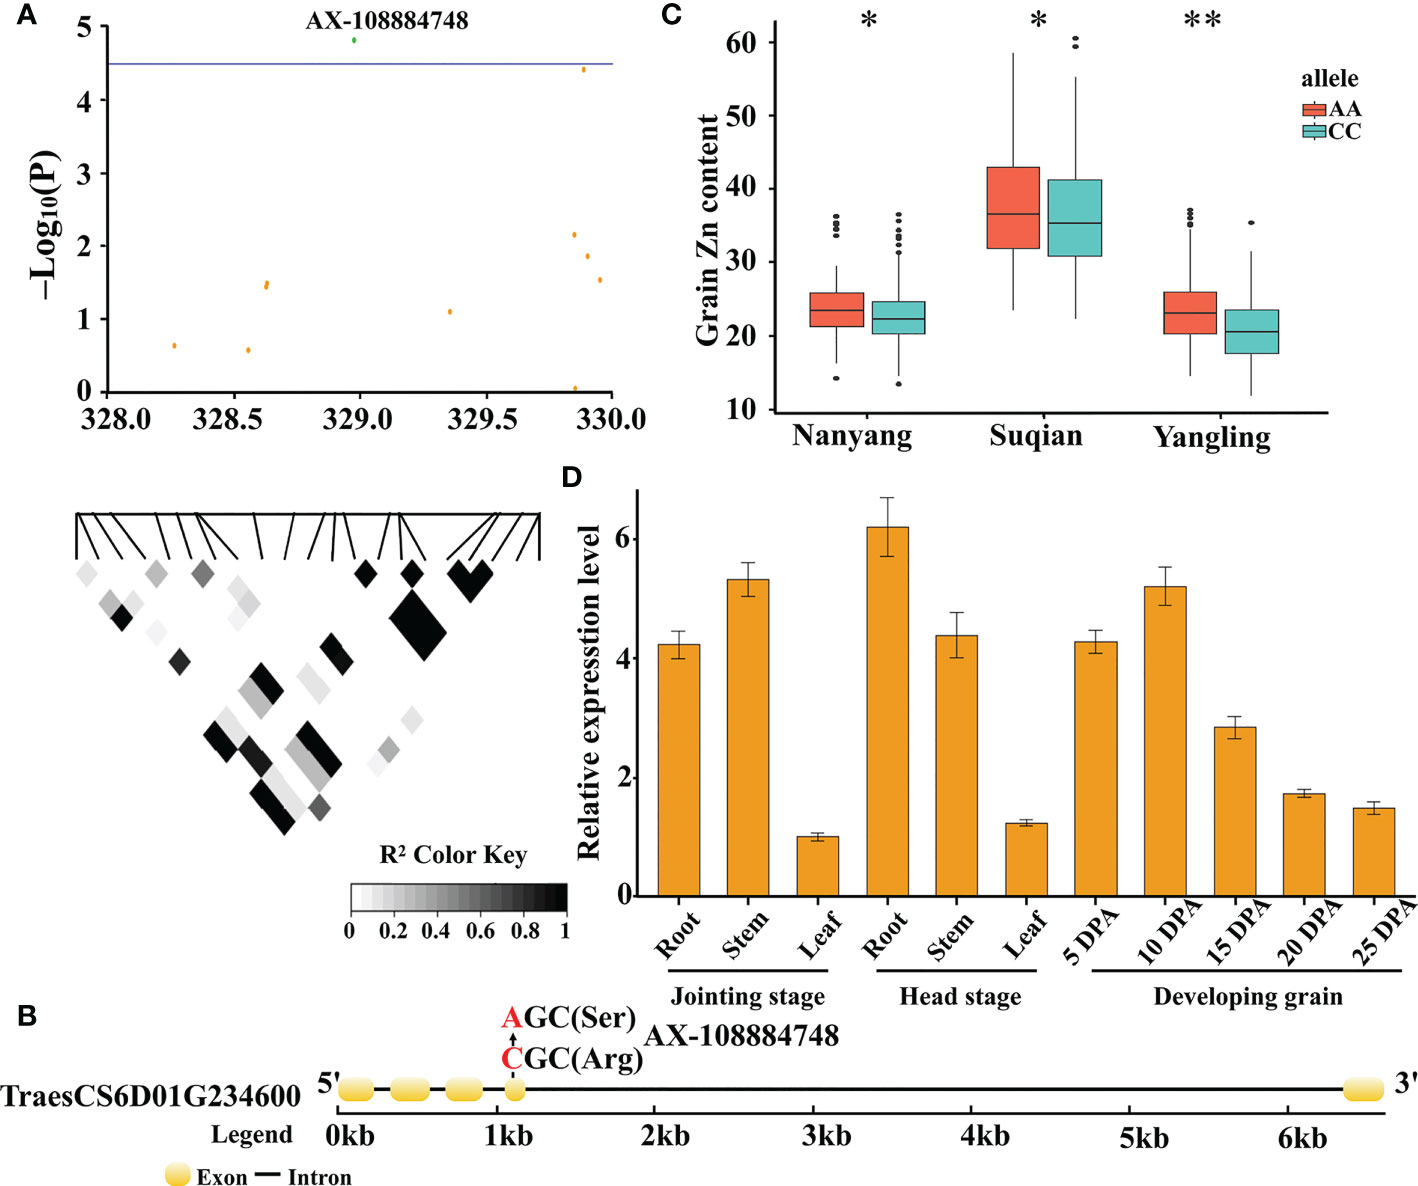
Figure 5 Candidate gene analysis based on the SNP AX-108884748 on chromosome 6D. Local Manhattan plot for the candidate region on chromosome 6D. The green dot represents the significant SNP AX-108884748. The corresponding LD block analysis of SNPs in this region is shown below. The degree of linkage is represented by the coefficient of r2 (A). Gene structure and location of the non-synonymous SNP for TraesCS6D01G234600. Yellow rectangles and black lines represent exons and introns, respectively (B). Boxplots for GZnC based on haplotype analysis (C). Upper and lower edges of the box represent the 75th and 25th quantiles, respectively, and the whiskers show the 90th and 10th quantiles; the horizontal solid lines represent the median. Statistical significance was analyzed by t-test, * P ≤ 0.05; ** P ≤ 0.01. Expression profile of TraesCS6D01G234600 in different tissues, as determined by qRT-PCR. The data was shown as the means ± Sd of n = 3 (D).
4 Discussion
4.1 Increasing wheat GZnC is needed to alleviate “hidden hunger”
Wheat grain yields have significantly increased over the past 75 years, from the early days of the “Green Revolution” in the 1960s to the recent optimisation of breeding and agronomic crop management (Evenson and Gollin, 2003; Pingali, 2012). However, nutrition-related traits are often neglected in the breeding process, resulting in the low concentration of microelements in wheat grains, giving rise to what has been called “hidden hunger” (Ul-Allah, 2018). Zn is an indispensable microelement for the human body. As an essential microelement, Zn cannot be synthesised by the human body, and plays a very important role in the human nervous, immune, and reproductive systems, as well as in the growth and development of children. Hao et al. analyzed wheat GZnC over the past 80 years in China, and found no decrease with released years (Hao et al., 2021). In turn, this study revealed that wheat GZnC has increased with the released years. Therefore, the dominant allele of wheat GZnC was never lost during selective breeding.
As one of the main food crops in the world, bread wheat is the staple food and major source of microelements for 30% to 40% of the world population (Poudel and Bhatta, 2017). Given the significant impact of Zn on human health (Shewry et al., 2012), it is unfortunate that, as many studies have shown, wheat GZnC is low worldwide. Thus, for example, Rehman et al. analyzed 28 wheat accessions in Pakistan and found that wheat GZnC ranged from 21.20 to 54.40 mg/kg (Rehman et al., 2018). Similarly, Khokhar et al. analyzed 245 wheat accessions from Woestkin and found that GZnC ranged from 24.0 to 49.0 mg/kg (Khokhar et al., 2020). In turn, Maryami et al. analyzed 158 Iranian wheat accessions and found that GZnC ranged from 27.9 to 65.0 mg/kg (Maryami et al., 2020). In particular, according to a summary and analysis of a large number of studies worldwide by Wang et al., the average global zinc concentration in wheat grains is only 28.48 mg/kg (Wang et al., 2020). Consistently, the results reported herein revealed that the GZnC ranged from 11.92 to 92.83 mg/kg. Although domestic wheat cultivars contained the highest GZnC, they were still far below human requirements, at approximately 40 to 60 mg/kg (Cakmak, 2008). Therefore, there is an urgent need to improve GZnC in wheat.
4.2 Genetic structure analysis was performed by comparing known loci
As a complementary strategy, GWAS is a powerful tool to for detecting QTLs for complex traits (Hamblin et al., 2011). With the development of wheat genome sequencing, different SNP arrays have been developed and gradually become the main tools for wheat GWAS (Rasheed et al., 2017). To reveal the QTLs for wheat GZnC, a 35K SNP array was used to identify two QTLs located on chromosomes 1A and 7B (Rathan et al., 2022). A wheat 660K SNP array was used to map seven QTLs on chromosomes 1B, 3B, 3D, 4A, 5A, 5B, and 7A (Zhou et al., 2020). Subsequently, the 90K and 660K SNP arrays were used to identify 17 QTLs on chromosomes 1A, 2A, 3A, 3B, 5A, 5D, 6A, 6B, 6D, 7A, 7B, and 7D, which were related to wheat GZnC (Tong et al., 2022). However, the molecular mechanism underlying Zn accumulation in wheat grains remains unclear, and no molecular marker conducive to GZnC has been used for wheat breeding. In this study, we identified nine QTLs on chromosomes 3A, 4A, 5B, 6D, and 7A. Specifically, the QTL (AX-108884748) was first identified on chromosome 6D, and is most likely a novel QTL located in the chromosomal region. This finding enriches our understanding of the genetic basis of GZnC in wheat.
4.3 Candidate genes for GZnC in wheat
A few genes have been functionally verified aiming to improve wheat GZnC. For example, the NAC transcription factor, NAM-B1, promotes the transfer of Zn from the leaves to the grains to increase GZnC (Uauy et al., 2006). However, wheat GZnC is a quantitative trait that is contributed by many genes. To date, many studies have been performed using GWAS to screen candidate genes for complex traits in wheat. Tong et al. used three methods: haplotype analysis, gene function comparison, and lineal homologues to screen a total of 28 promising candidate genes that might be involved in zinc/iron absorption, transport, storage, and regulation (Tong et al., 2022). In turn, Zhou et al. used superior allele estimation to identify seven candidate genes for GZnC, encoding NAC transcription factor and TPR-like superfamily proteins (Zhou et al., 2020). Meanwhile, using haplotype analysis, Krishnappa et al. identified two important candidate genes for GZnC, encoding a late embryogenic rich protein, LEA-18, and RNA recognition motif domains (Krishnappa et al., 2022). These findings indicate that GWAS is a highly useful tool for identifying candidate genes for complex traits. In addition, these studies showed haplotype analysis is reliable for screening candidate genes for complex traits, which laid a solid theoretical foundation for our subsequent research.
In this study, we identified the candidate gene TraesCS6D01G234600 on chromosome 6D through haplotype analysis, which was caused by the SNP AX-108884748 (CC/AA). This candidate gene encodes GDSL esterase, which shows hydrolytic enzyme activity for thioesters, aryl esters, phospholipids and amino acids, and others (Akoh et al., 2004). The AA allele had a significant positive effect on GZnC in all three environments (P ≤ 0.05), indicating the importance of TraesCS6D01G234600. In addition, this gene was mainly expressed in the root, stem, and grain tissues, suggesting that it may play an important role in Zn transfer. These results provide important information for further improvement of wheat GZnC, and indicate that the pyramid effect should be considered in the next step of selective breeding.
5 Conclusion
We constructed a diversity panel comprising 382 wheat accessions, and conducted field trials in three environments. The GZnC of 382 wheat accessions was determined, and the data showed that wheat GZnC increased with the release years, indicating that the predominant allele of wheat GZnC was not lost during selected breeding. Phenotypic data were further analyzed using GWAS, and nine QTLs for GZnC were identified, with effects ranging from 0.16 to 0.30. In addition, one candidate gene for GZnC was screened using haplotype analysis. Overall, our study provides novel insights that increase our understanding of the genetic information of GZnC and will facilitate the improvement of GZnC in wheat breeding programs.
Data availability statement
The original contributions presented in the study are included in the article/Supplementary Material. Further inquiries can be directed to the corresponding authors.
Author contributions
JM, DH, and LJ conceived and designed the research. JM, MYe, QL, MYuan, DZ, CL, QZ, and JW performed the experiments. JM, MYe, and MYuan prepared the figures and provided the materials. JM wrote the manuscript. All authors have read and approved the final manuscript.
Funding
This study was supported by the Open Project Program (CSBAA2020001) of State Key Laboratory of Crop Stress Biology for Arid Areas, NWAFU, Yangling, Shaanxi, 712100, China; the National Key Research and Development Program of China (2018YFD0300703-2 and 2017YFD0301101); Technological development for wheat production (H2022028).
Conflict of interest
The authors declare that the research was conducted in the absence of any commercial or financial relationships that could be construed as a potential conflict of interest.
Publisher’s note
All claims expressed in this article are solely those of the authors and do not necessarily represent those of their affiliated organizations, or those of the publisher, the editors and the reviewers. Any product that may be evaluated in this article, or claim that may be made by its manufacturer, is not guaranteed or endorsed by the publisher.
Supplementary material
The Supplementary Material for this article can be found online at: https://www.frontiersin.org/articles/10.3389/fpls.2023.1169858/full#supplementary-material
References
Akoh, C. C., Lee, G. C., Liaw, Y. C., Huang, T. H., Shaw, J. F. (2004). GDSL family of serine esterases/lipases. Prog. Lipid Res. 43, 534–552. doi: 10.1016/j.plipres.2004.09.002
Alomari, D. Z., Eggert, K., von Wirén, N., Alqudah, A. M., Polley, A., Plieske, J., et al. (2018). Identifying candidate genes for enhancing grain zn concentration in wheat. Front. Plant Sci. 9. doi: 10.3389/fpls.2018.01313
Andersson, M. S., Saltzman, A., Virk, P. S., Pfeiffer, W. (2017). Progress update: Crop development of biofortified staple food crops under HarvestPlus. Afr. J. Food Agric. Nutr. Dev. 17, 11905–11935. doi: 10.18697/ajfand.78.HarvestPlus05
Black, R. E., Victora, C. G., Walker, S. P., Bhutta, Z. A., Christian, P., de Onis, M., et al. (2013). Maternal and child undernutrition and overweight in low-income and middle-income countries. Lancet 382 (9890), 427–451. doi: 10.1016/S0140-6736(13)60937-X
Bouis, H. E., Hotz, C., McClafferty, B., Meenakshi, J. V., Pfeiffer, W. H. (2011). Biofortification: A new tool to reduce micronutrient malnutrition. Food Nutr. Bull. 32 (1 Suppl), S31–S40. doi: 10.1177/15648265110321S105
Bradbury, P. J., Zhang, Z., Kroon, D. E., Casstevens, T. M., Ramdoss, Y., Buckler, E. S. (2007). TASSEL: Software for association mapping of complex traits in diverse samples. Bioinformatics 23 (19), 2633–2635. doi: 10.1093/bioinformatics/btm308
Breseghello, F., Sorrells, M. E. (2006). Association analysis as a strategy for improvement of quantitative traits in plants. Crop Sci. 46, 1323–1330. doi: 10.2135/cropsci2005.09-0305
Cakmak, I. (2008). Enrichment of cereal grains with zinc: Agronomic or genetic biofortification? Plant Soil 302, 1–17. doi: 10.1007/s11104-007-9466-3
Cu, S. T., Guild, G., Nicolson, A., Velu, G., Singh, R., Stangoulis, J. (2020). Genetic dissection of zinc, iron, copper, manganese and phosphorus in wheat (Triticum aestivum l.) grain and rachis at two developmental stages. Plant Sci. 291, 110338. doi: 10.1016/j.plantsci.2019.110338
Earl, D. A., vonHoldt, B. M. (2012). STRUCTURE HARVESTER: A website and program for visualizing STRUCTURE output and implementing the evanno method. Conserv. Genet. Resour. 4 (2), 359–361. doi: 10.1007/s12686-011-9548-7
Evenson, R. E., Gollin, D. (2003). Assessing the impact of the green revolution 1960 to 2000. Science 300 (5620), 758–762. doi: 10.1126/science.1078710
Gupta, P. K., Balyan, H. S., Sharma, S., Kumar, R. (2021). Biofortification and bioavailability of zn, fe and Se in wheat: present status and future prospects. Theor. Appl. Genet. 134 (1), 1–35. doi: 10.1007/s00122-020-03709-7
Hambidge, M. (2000). Human zinc deficiency. J. Nutr. 130 (5S Suppl), 1344S–1349S. doi: 10.1093/jn/130.5.1344S
Hamblin, M. T., Buckler, E. S., Jannink, J. L. (2011). Population genetics of genomics-based crop improvement methods. Trends Genet. 27 (3), 98–106. doi: 10.1016/j.tig.2010.12.003
Hao, B., Ma, J., Chen, P., Jiang, L., Wang, X., Li, C., et al. (2021). Wheat breeding in China over the past 80 years has increased grain zinc but decreased grain iron concentration. Field Crops Res. 271, 108253. doi: 10.1016/j.fcr.2021.108253
I.W.G.S.C (2018). Shifting the limits in wheat research and breeding using a fully annotated reference genome. Science 361, eaar7191. doi: 10.1126/science.aar7191
Juliana, P., Govindan, V., Crespo-Herrera, L., Mondal, S., Huerta-Espino, J., Shrestha, S., et al. (2022). Genome-wide association mapping identifies key genomic regions for grain zinc and iron biofortification in bread wheat. Front. Plant Sci. 13. doi: 10.3389/fpls.2022.903819
Khokhar, J. S., King, J., King, I. P., Young, S. D., Foulkes, M. J., De Silva, J., et al. (2020). Novel sources of variation in grain zinc (Zn) concentration in bread wheat germplasm derived from Watkins landraces. PLoS One 15 (2), e0229107. doi: 10.1371/journal.pone.0229107
Krishnappa, G., Khan, H., Krishna, H., Kumar, S., Mishra, C. N., Parkash, O., et al. (2022). Genetic dissection of grain iron and zinc, and thousand kernel weight in wheat (Triticum aestivum l.) using genome-wide association study. Sci. Rep. 12 (1), 12444. doi: 10.1038/s41598-022-15992-z
Liu, Y., Chen, Y., Yang, Y., Zhang, Q., Fu, B., Cai, J., et al. (2021). A thorough screening based on QTLs controlling zinc and copper accumulation in the grain of different wheat genotypes. Environ. Sci. pollut. Res. 28 (12), 15043–15054. doi: 10.1007/s11356-020-11690-3
Ludwig, Y., Slamet-Loedin, I. H. (2019). Genetic biofortification to enrich rice and wheat grain iron: From genes to product. Front. Plant Sci. 10. doi: 10.3389/fpls.2019.00833
Ma, J., Qi, S., Yuan, M., Zhao, D., Zhang, D., Feng, J., et al. (2022). A genome-wide association study revealed the genetic variation and candidate genes for grain copper content in bread wheat (Triticum aestivum l.). Food Funct. 13 (9), 5177–5188. doi: 10.1039/d1fo04173h
Maryami, Z., Huertas-García, A. B., Azimi, M. R., Hernández-Espinosa, N., Payne, T., Cervantes, F., et al. (2020). Variability for glutenins, gluten quality, iron, zinc and phytic acid in a set of one hundred and fifty-eight common wheat landraces from Iran. Agronomy 10, 1797. doi: 10.3390/agronomy10111797
Pingali, P. L. (2012). Green revolution: impacts, limits, and the path ahead. Proc. Natl. Acad. Sci. U.S.A. 109 (31), 12302–12308. doi: 10.1073/pnas.0912953109
Poudel, R., Bhatta, M. (2017). Review of nutraceuticals and functional properties of whole wheat. J. Nutr. Food Sci. 7, 1–6. doi: 10.4172/2155-9600.1000571
Pritchard, J. K., Stephens, M., Donnelly, P. (2000). Inference of population structure using multilocus genotype data. Genetics 155 (2), 945–959. doi: 10.1093/genetics/155.2.945
Rasheed, A., Hao, Y., Xia, X., Khan, A., Xu, Y., Varshney, R. K., et al. (2017). Crop breeding chips and genotyping platforms: Progress, challenges, and perspectives. Mol. Plant 10 (8), 1047–1064. doi: 10.1016/j.molp.2017.06.008
Rathan, N. D., Krishna, H., Ellur, R. K., Sehgal, D., Govindan, V., Ahlawat, A. K., et al. (2022). Genome-wide association study identifies loci and candidate genes for grain micronutrients and quality traits in wheat (Triticum aestivum l.). Sci. Rep. 12 (1), 7037. doi: 10.1038/s41598-022-10618-w
Rehman, A., Farooq, M., Nawaz, A., Al-Sadi, A. M., Al-Hashmi, K. S., Nadeem, F., et al. (2018). Characterizing bread wheat genotypes of Pakistani origin for grain zinc biofortification potential. J. Sci. Food Agric. 98 (13), 4824–4836. doi: 10.1002/jsfa.9010
Shah, D., Sachdev, H. P. (2006). Zinc deficiency in pregnancy and fetal outcome. Nutr. Rev. 64 (1), 15–30. doi: 10.1111/j.1753-4887.2006.tb00169.x
Shewry, P. R., Lafiandra, D., Bedo, Z. (2012). Improving the nutritional quality and health benefits of wheat. Qual. Assur. Saf. Crop Foods 4, 136–136. doi: 10.1111/j.1757-837X.2012.00138.x
Tong, J., Zhao, C., Sun, M., Fu, L., Song, J., Liu, D., et al. (2022). High resolution genome wide association studies reveal rich genetic architectures of grain zinc and iron in common wheat (Triticum aestivum l.). Front. Plant Sci. 13. doi: 10.3389/fpls.2022.840614
Uauy, C., Distelfeld, A., Fahima, T., Blechl, A., Dubcovsky, J. (2006). A NAC gene regulating senescence improves grain protein, zinc, and iron content in wheat. Science 314 (5803), 1298–1301. doi: 10.1126/science.1133649
Ul-Allah, S. (2018). Combating hidden hunger in agriculture perspective. World Rev. Nutr. Diet. 118, 161–166. doi: 10.1159/000484511
Velu, G., Ortiz-Monasterio, I., Cakmak, I., Hao, Y., Singh, R. P. (2014). Biofortification strategies to increase grain zinc and iron concentrations in wheat. J. Cereal Sci. 59, 365–372. doi: 10.1016/j.jcs.2013.09.001
Velu, G., Singh, R. P., Crespo-Herrera, L., Juliana, P., Dreisigacker, S., Valluru, R., et al. (2018). Genetic dissection of grain zinc concentration in spring wheat for mainstreaming biofortification in CIMMYT wheat breeding. Sci. Rep. 8 (1), 13526. doi: 10.1038/s41598-018-31951-z
Wang, M., Kong, F., Liu, R., Fan, Q., Zhang, X. (2020). Zinc in wheat grain, processing, and food. Front. Nutr. 7. doi: 10.3389/fnut.2020.00124
Wessells, K. R., Brown, K. H. (2012). Estimating the global prevalence of zinc deficiency: results based on zinc availability in national food supplies and the prevalence of stunting. PLoS One 7 (11), e50568. doi: 10.1371/journal.pone.0050568
Wu, J., Yu, R., Wang, H., Zhou, C., Huang, S., Jiao, H., et al. (2021). A large-scale genomic association analysis identifies the candidate causal genes conferring stripe rust resistance under multiple field environments. Plant Biotechnol. J. 19 (1), 177–191. doi: 10.1111/pbi.13452
Keywords: Triticum aestivum L., grain Zn concentration, genome-wide association study, quantitative trait loci, candidate gene
Citation: Ma J, Ye M, Liu Q, Yuan M, Zhang D, Li C, Zeng Q, Wu J, Han D and Jiang L (2023) Genome-wide association study for grain zinc concentration in bread wheat (Triticum aestivum L.). Front. Plant Sci. 14:1169858. doi: 10.3389/fpls.2023.1169858
Received: 20 February 2023; Accepted: 22 March 2023;
Published: 03 April 2023.
Edited by:
Gaoneng Shao, Zhejiang University, ChinaReviewed by:
Fangjun Li, China Agricultural University, ChinaWeihuan Jin, Henan Agricultural University, China
Copyright © 2023 Ma, Ye, Liu, Yuan, Zhang, Li, Zeng, Wu, Han and Jiang. This is an open-access article distributed under the terms of the Creative Commons Attribution License (CC BY). The use, distribution or reproduction in other forums is permitted, provided the original author(s) and the copyright owner(s) are credited and that the original publication in this journal is cited, in accordance with accepted academic practice. No use, distribution or reproduction is permitted which does not comply with these terms.
*Correspondence: Lina Jiang, jiangln@htu.edu.cn; Jianhui Ma, cricaas@163.com; Dejun Han, handj@nwsuaf.edu.cn