 Praveen Khatri
 Owen Wally3
 Istvan Rajcan
 Sangeeta Dhaubhadel
- 1London Research and Development Centre, Agriculture and Agri-Food Canada, London, ON, Canada
- 2Department of Biology, University of Western Ontario, London, ON, Canada
- 3Harrow Research and Development Centre, Agriculture and Agri-Food Canada, London, ON, Canada
- 4Department of Plant Agriculture, University of Guelph, Guelph, ON, Canada
Cytochrome P450 monooxygenases (P450) participate in the catalytic conversion of biological compounds in a plethora of metabolic pathways, such as the biosynthesis of alkaloids, terpenoids, phenylpropanoids, and hormones in plants. Plants utilize these metabolites for growth and defense against biotic and abiotic stress. In this study, we identified 346 P450 (GmP450) enzymes encoded by 317 genes in soybean where 26 GmP450 genes produced splice variants. The genome-wide comparison of both A-type and non-A-type GmP450s for their motifs composition, gene structure, tissue-specific expression, and their chromosomal distribution were determined. Even though conserved P450 signature motifs were found in all GmP450 families, larger variation within a specific motif was observed in the non-A-type GmP450s as compared with the A-type. Here, we report that the length of variable region between two conserved motifs is exact in the members of the same family in majority of the A-type GmP450. Analyses of the transcriptomic datasets from soybean-Phytophthora sojae interaction studies, quantitative trait loci (QTL) associated with P. sojae resistance, and co-expression analysis identified some GmP450s that may be, in part, play an important role in partial resistance against P. sojae. The findings of our CYPome study provides novel insights into the functions of GmP450s and their involvements in metabolic pathways in soybean. Further experiments will elucidate their roles in general and legume-specific function.
Introduction
The cytochrome P450 monooxygenases (P450s) are the heme-thiolate superfamily of enzymes that function as oxidoreductases with the heme group as a catalytic center. P450s have been reported in all the levels of taxonomical hierarchy from virus (Lamb et al., 2019) to bacteria and multicellular plants and animals along with fungi, protists, and archaea (Xu et al., 2015; Yonekura-Sakakibara et al., 2019). After the first reported plant P450 in cotton (Frear et al., 1969), they have been identified in many plant species and their diverse roles in plant development and defense mechanisms have been elucidated (Xu et al., 2015; Pandian et al., 2020). Plant P450 superfamily is divided into two clades: A-type and non-A-type. Generally, the A-type P450s are involved in plant-specific pathways, such as specialized metabolism whereas the non-A-type P450s are more diverse, and their sequences are more similar to P450s belonging to other kingdoms than to plant (Durst and Nelson, 1995; Paquette et al., 2000). Each clade is further categorized into clans that contain several P450 families. In Arabidopsis, the A-type P450s contain a single clan: clan71 whereas the non-A-type contains 8 clans: clan51, clan72, clan710, clan711, clan74, clan85, clan86, and clan97 (Bak et al., 2011). Plants P450 are named according to their homology and phylogenetic groupings with other known P450s (Nelson et al., 1996). Recently, advancements in sequencing technology have led to an increasing number of annotated genomes of a large number of diverse plant species. These whole genome sequence data have laid the foundation for the identification of P450 family members and elucidation of their evolutionary biology, and their possible roles in plant development and stress response. The genome-wide identification of P450s in several plant species, such as Arabidopsis thaliana (Bak et al., 2011), Medicago truncatula (Li et al., 2007), Oryza sativa (Wei and Chen, 2018), Solanum lycopersicum (Vasav and Barvkar, 2019), Vitis vinifera (Jiu et al., 2020), Morus notabilis (Ma et al., 2014), Ricinus communis (Kumar et al., 2014), and Fagopyrum tataricum (Sun et al., 2020) have been reported.
Generally, P450s contain five conserved domains: an N-terminus proline rich region (usually PPGP), an oxygen binding and activation site [I-helix (A/G)GX(E/D)T(T/S)], a K-helix consensus (EXXR), a PERF conserved sequence, and a C-terminus heme binding site (FXXGXRXCXG). Majority of plant P450s are membrane-bound proteins that are found anchored to the cytosolic side of the endoplasmic reticulum, however, they have also been found in other subcellular compartments, such as plastids (Bak et al., 2011). Majority of plant metabolic pathways contain reactions catalyzed by P450s, such as the biosynthesis of sterol, hormone, fatty acid, pigments, signaling molecules, structural polymers, phenylpropanoids, and phytoalexins (Bennett and Wallsgrove, 1994). Phytoalexins are anti-microbial compounds of different metabolic classes that are produced by plants upon biotic and abiotic stresses (Jeandet, 2015).
Soybean (Glycine max [L.] Merr) is one of the most important grain legumes worldwide. It is as an excellent source of protein, oil, and many specialized metabolites, such as isoflavonoids and saponins. Furthermore, it is the fourth largest principal field crop in the terms of seeded area that generates farm cash value of 2.52 billion dollars and ranks the third largest among principal field crops in Canada1. Canadian soybean growers encounter several challenges during soybean production, such as crop yield loss due to diseases and pests. Many efforts have been made to enhance the crop resistance to pathogens, such as diverse breeding approaches that involve introgression of resistance (R) genes from landraces to elite varieties. Although incorporating R-genes develops resistance against a specific pathogen, their monogenic effect pose selection pressure on the pathogen, and the resistance breaks down easily. Additionally, due to the high genetic diversity found in many regional population of soybean pathogens, such as Phytophthora sojae, R-gene mediated resistance becomes increasingly ineffective toward all populations (Dorrance et al., 2016). The oomycete P. sojae is a soil-borne pathogen that infects soybean plant from planting to harvest leading to a significant yield loss. Soybean cultivars resistant to P. sojae contain Rps (resistant to P. sojae) genes that are specific to a corresponding Avirulence (Avr) gene within P. sojae. Over time with selection pressure, Avr genes mutate resulting in soybeans containing specific Rps genes no longer being resistant against that specific strain of P. sojae. The altered pathogenic profile of P. sojae avr gene is referred to as pathotype, and determines which Rps gene that specific isolate is able to overcome (Dorrance et al., 2008). An alternate to R-gene mediated resistance is through the improvement of quantitative resistance that confers field or partial tolerance to disease. This type of tolerance is more durable and is not specific to individual pathogen strains (Pilet-Nayel et al., 2017). Quantitative resistance is governed by multiple genes with minor effects and involves plant specialized metabolism that produces a wide variety of compounds, such as Phytoalexins that help to reduce pathogen invasion or inhibit their colonization within plant cells (Kiraly et al., 2007). To date, four P450s involved in the phytoalexin glyceollin biosynthesis have been identified in soybean (Schopfer et al., 1998; Steele et al., 1999; Jung et al., 2000).
Previously, a total of 332 full-length P450 genes and 378 pseudogenes were reported in soybean using Glyma1 assembly (Guttikonda et al., 2010). The new assembly (v4.0) has integrated a dense genetic map and corrected the major issues in pseudomolecule reconstruction that was observed in the previous assemblies. Therefore, we performed a genome-wide analysis of P450 genes in soybean (GmP450) using the new soybean genome assembly, and identified 317 GmP450 genes that encode for 346 proteins. Here, we present their phylogenetic analysis, chromosomal distribution, gene structure, and expression analysis. Furthermore, we analyzed the expression of GmP450s in soybean in response to P. sojae infection, and identified the GmP450s located within the quantitative trait loci (QTL) associated with partial resistance against P. sojae. This study lays a foundation for exploring the potential function of GmP450s and provides valuable information for breeding soybean varieties with an increased partial resistance to pathogen infection.
Materials and Methods
Identification and Analysis of P450s in Soybean
To identify all putative GmP450 proteins, soybean proteome (William 82 a4.v4.1) was downloaded from SoyBase2. A Basic Local Alignment Search Tool-Protein (BLASTP) search against the soybean proteome database using previously characterized plant P450s and known Arabidopsis thaliana P450s (AtP450s) obtained from the P450 database3 (Nelson, 2009) was performed with a threshold cutoff of e-value of 1e-10 and bit-score greater than 100. Furthermore, P450 sequences in different repositories, such as Pfam4, Phytozome 135, and SoyBase (see Text Footnote 2) were also retrieved using the keyword ‘P450’ as a query. The recurring candidates were removed from the dataset and all non-overlapping GmP450s were scrutinized further. After that, the GmP450 sequences with an amino acid stretch of more than 400 were selected for further analysis. The isoelectric point (pI) and molecular mass of candidate GmP450s were calculated using Expasy tool6. The subcellular localization of GmP450s was predicted using DeepLOC server (Almagro Armenteros et al., 2017).
Phylogenetic Analysis and Identification of Conserved Domains
Amino acid sequences of all the putative GmP450s were aligned using ClustalO (Sievers et al., 2011). Phylogenetic tree was constructed using maximum likelihood method in IQ-TREE server7 (Trifinopoulos et al., 2016), and the appropriate model was selected utilizing the ModelFinder method. The models JTT + F + I + G4 and LG + F + I + G4 were used, respectively, to generate the phylogenetic tree for the A-type and the non-A-type P450 groups. CYP102A1 was incorporated as an outgroup (Budde et al., 2006), and tree root was placed on it. The bootstrap value was set to 1,000 (Minh et al., 2013; Nguyen et al., 2015; Kalyaanamoorthy et al., 2017). The tree was visualized and annotated using Evolview v3 (Subramanian et al., 2019).
All the protein sequences of GmP450s were aligned with previously reported P450s from A. thaliana, M. truncatula, Cicer arietinum, Oryza sativa, H. tuberosus, Petunia hybrid, Sorghum bicolor, Papaver somniferum, and Solanum lycopersicum (Zondlo and Irish, 1999; Schoenbohm et al., 2000; Liu et al., 2003; Morikawa et al., 2006; Fang et al., 2012; Wu et al., 2013; Chang et al., 2018; Pan et al., 2018; Vasav and Barvkar, 2019) with the use of ClustalO with their individual family members separately. Aligned sequences were searched manually for the conserved P450 sequences reported earlier (Ayabe and Akashi, 2006). Amino acid spacing between the conserved domains were calculated manually.
Gene Structure, Chromosomal Mapping, and Quantitative Trait Loci
The structure annotation of gene models (in gff3 format) of the identified GmP450s encompassing their gene, messenger RNA (mRNA), coding sequence (CDS), and untranslated region (UTR) coordinates were retrieved from SoyBase and fed into gene structure display server 2.0 (GSDS) (Guo et al., 2007) to display exon-intron organizations. Subsequently, bi-parental QTL for partial resistance against P. sojae reported in different studies were also collected from SoyBase8, and mapped on chromosomes along with GmP450 genes using Mapchart v2.32. (Voorrips, 2002).
Expression Analysis of GmP450s: Tissue-Specific and Upon P. sojae Infection
Differential expression genes (DEGs) analysis of GmP450s was performed using 6 publicly available RNAseq datasets of P. sojae infected soybean seedlings. These datasets include multiple soybean cultivars that are either resistant or susceptible to P. sojae infection. The RNAseq analysis was performed using CLC Genomic Workbench (Release 22.09). Raw sequence reads of datasets were retrieved from the National Center for Biotechnology Information (NCBI) Sequence Read Archive (SRA) database, processed and mapped upon reference soybean genome William82 a4.v4.1. Mapping was performed using default settings by permitting two mismatches, 0.9 minimum length of fraction, and 0.8 minimum similarity fraction. Read counts were analyzed using a differential expression analysis tool within the CLC Genomic Workbench which utilizes a multi-factorial statistics based on a negative binomial Generalized Linear Model (GLM). The GLM allows to fit curves to expression values without assuming that the error on the values is normally distributed. The cutoff of fold change of 2 and 0.5 and p less than 0.05 was used to identify DEGs. The differential expression analysis strategy followed for different bioprojects are mentioned in Supplementary Table 1.
Tissue-specific expression patterns of all GmP450s were analyzed using expression data retrieved from Phytozome expression gene atlas10. The expression values in the form of fragments per kilobase of transcript per million mapped reads (FPKM) were collected for flower (open and unopen), root tip standard, root standard, lateral root standard, stem standard, shoot tip standard, and leaf standard tissues (Chen et al., 2020). The expression values were scaled with 2 base logarithms and normalized. Subsequently, all the transformed values were clustered hierarchically using an average linkage method and distance were calculated using the Euclidean method.
Plant Material and Soybean–P. sojae Interaction
The seeds of soybean (G. max [L.] Merr) cultivar Misty was received from Dr. Richard Belanger, Laval University, Canada. Soybean–P. sojae interactions were conducted using the methods developed by Lebreton et al. (2018) with minor modifications. P. sojae isolates Cha-015, 1376c-004 and W6B-004 representing pathotypes Rps1a, 1b, 1c, 1d, 1k, 3a, 6, and 7 among the three isolates were used. Seedlings were germinated in sterile vermiculite at 27°C for 6 days under dark before transferring to the hydroponic set (Lebreton et al., 2018). Plants were grown under 12 h day length at 27°C with 450 μmoles/m2/s light and 18°C dark, before being inoculated with an even mixture of the three P. sojae isolates at a rate of 104 zoospores/L of hydroponic solution or the mock inoculation of zoospore generation solution lacking the pathogen. Intact root samples were collected from the 3 biological replicates consisting of 3 root systems/replicate 24 h post-inoculation, flash frozen in liquid N2, and kept at −80°C. Test plants were grown for 14 days to ensure that the inoculated zoospores resulted in disease symptoms.
RNA Extraction, Quantitative Reverse Transcription PCR
Total RNA was extracted from the roots of soybean seedlings of both P. sojae and mock infected (control) using the RNeasy Plant Mini Kit (Qiagen). On the column treatment of total RNA with DNase1 was performed to remove genomic DNA contamination. Total RNA (1 μg) was used for cDNA synthesis using SuperScript IV Reverse Transcriptase (Invitrogen). Quantitative real-time polymerase chain reaction (qRT-PCR) was performed using gene-specific primers (Supplementary Table 2) in three technical replicates for each sample using the SsoFast EvaGreen supermix (Bio-Rad) and CFX96 real-time PCR system (Bio-Rad). Gene expression was normalized to soybean CONS4. The data analysis was conducted using CFX Maestro (Bio-Rad) (Supplementary Table 3).
Co-expression Analysis of GmP450s
The co-expression network of all soybean P450s was constructed using CoExpNetViz tool (Tzfadia et al., 2015). The normalized expression data for GmP450s from all the RNA-seq datasets were used to generate the network. The analysis was performed utilizing the Pearson correlation (r) method with lower percentile rank 5 and upper percentile rank 95 as a correlation threshold to find out the correlation between all putative GmP450 genes. The co-expression was visualized using Cytoscape V3.8.0 (Smoot et al., 2011).
Results
Soybean Genome Contains 317 P450 Encoding Genes
To identify all P450 encoding genes in soybean genome, we performed multiple database searches. A BLASTP search using 249 known AtP450s (Nelson et al., 2004) and 104 previously characterized P450s from different plant species as queries against the soybean proteome resulted into 504 hits. Additionally, the keyword searches using ‘P450’ as a query in Pfam, G. max Wm82.a4.v1 genome at Phytozome 13 and SoyBase resulted into 492, 451, and 341 hits, respectively. Eukaryotic P450s usually contain 480–560 amino acids (Danielson, 2002). The consolidation of candidate GmP450s from these searches and the subsequent removal of recurring sequences gave rise to 497 candidates which were further scrutinized for the presence of the conserved P450 domains and >400 amino acids stretch in the sequence. This process led to a total of 346 GmP450 proteins with conserved P450 domains (Figure 1).
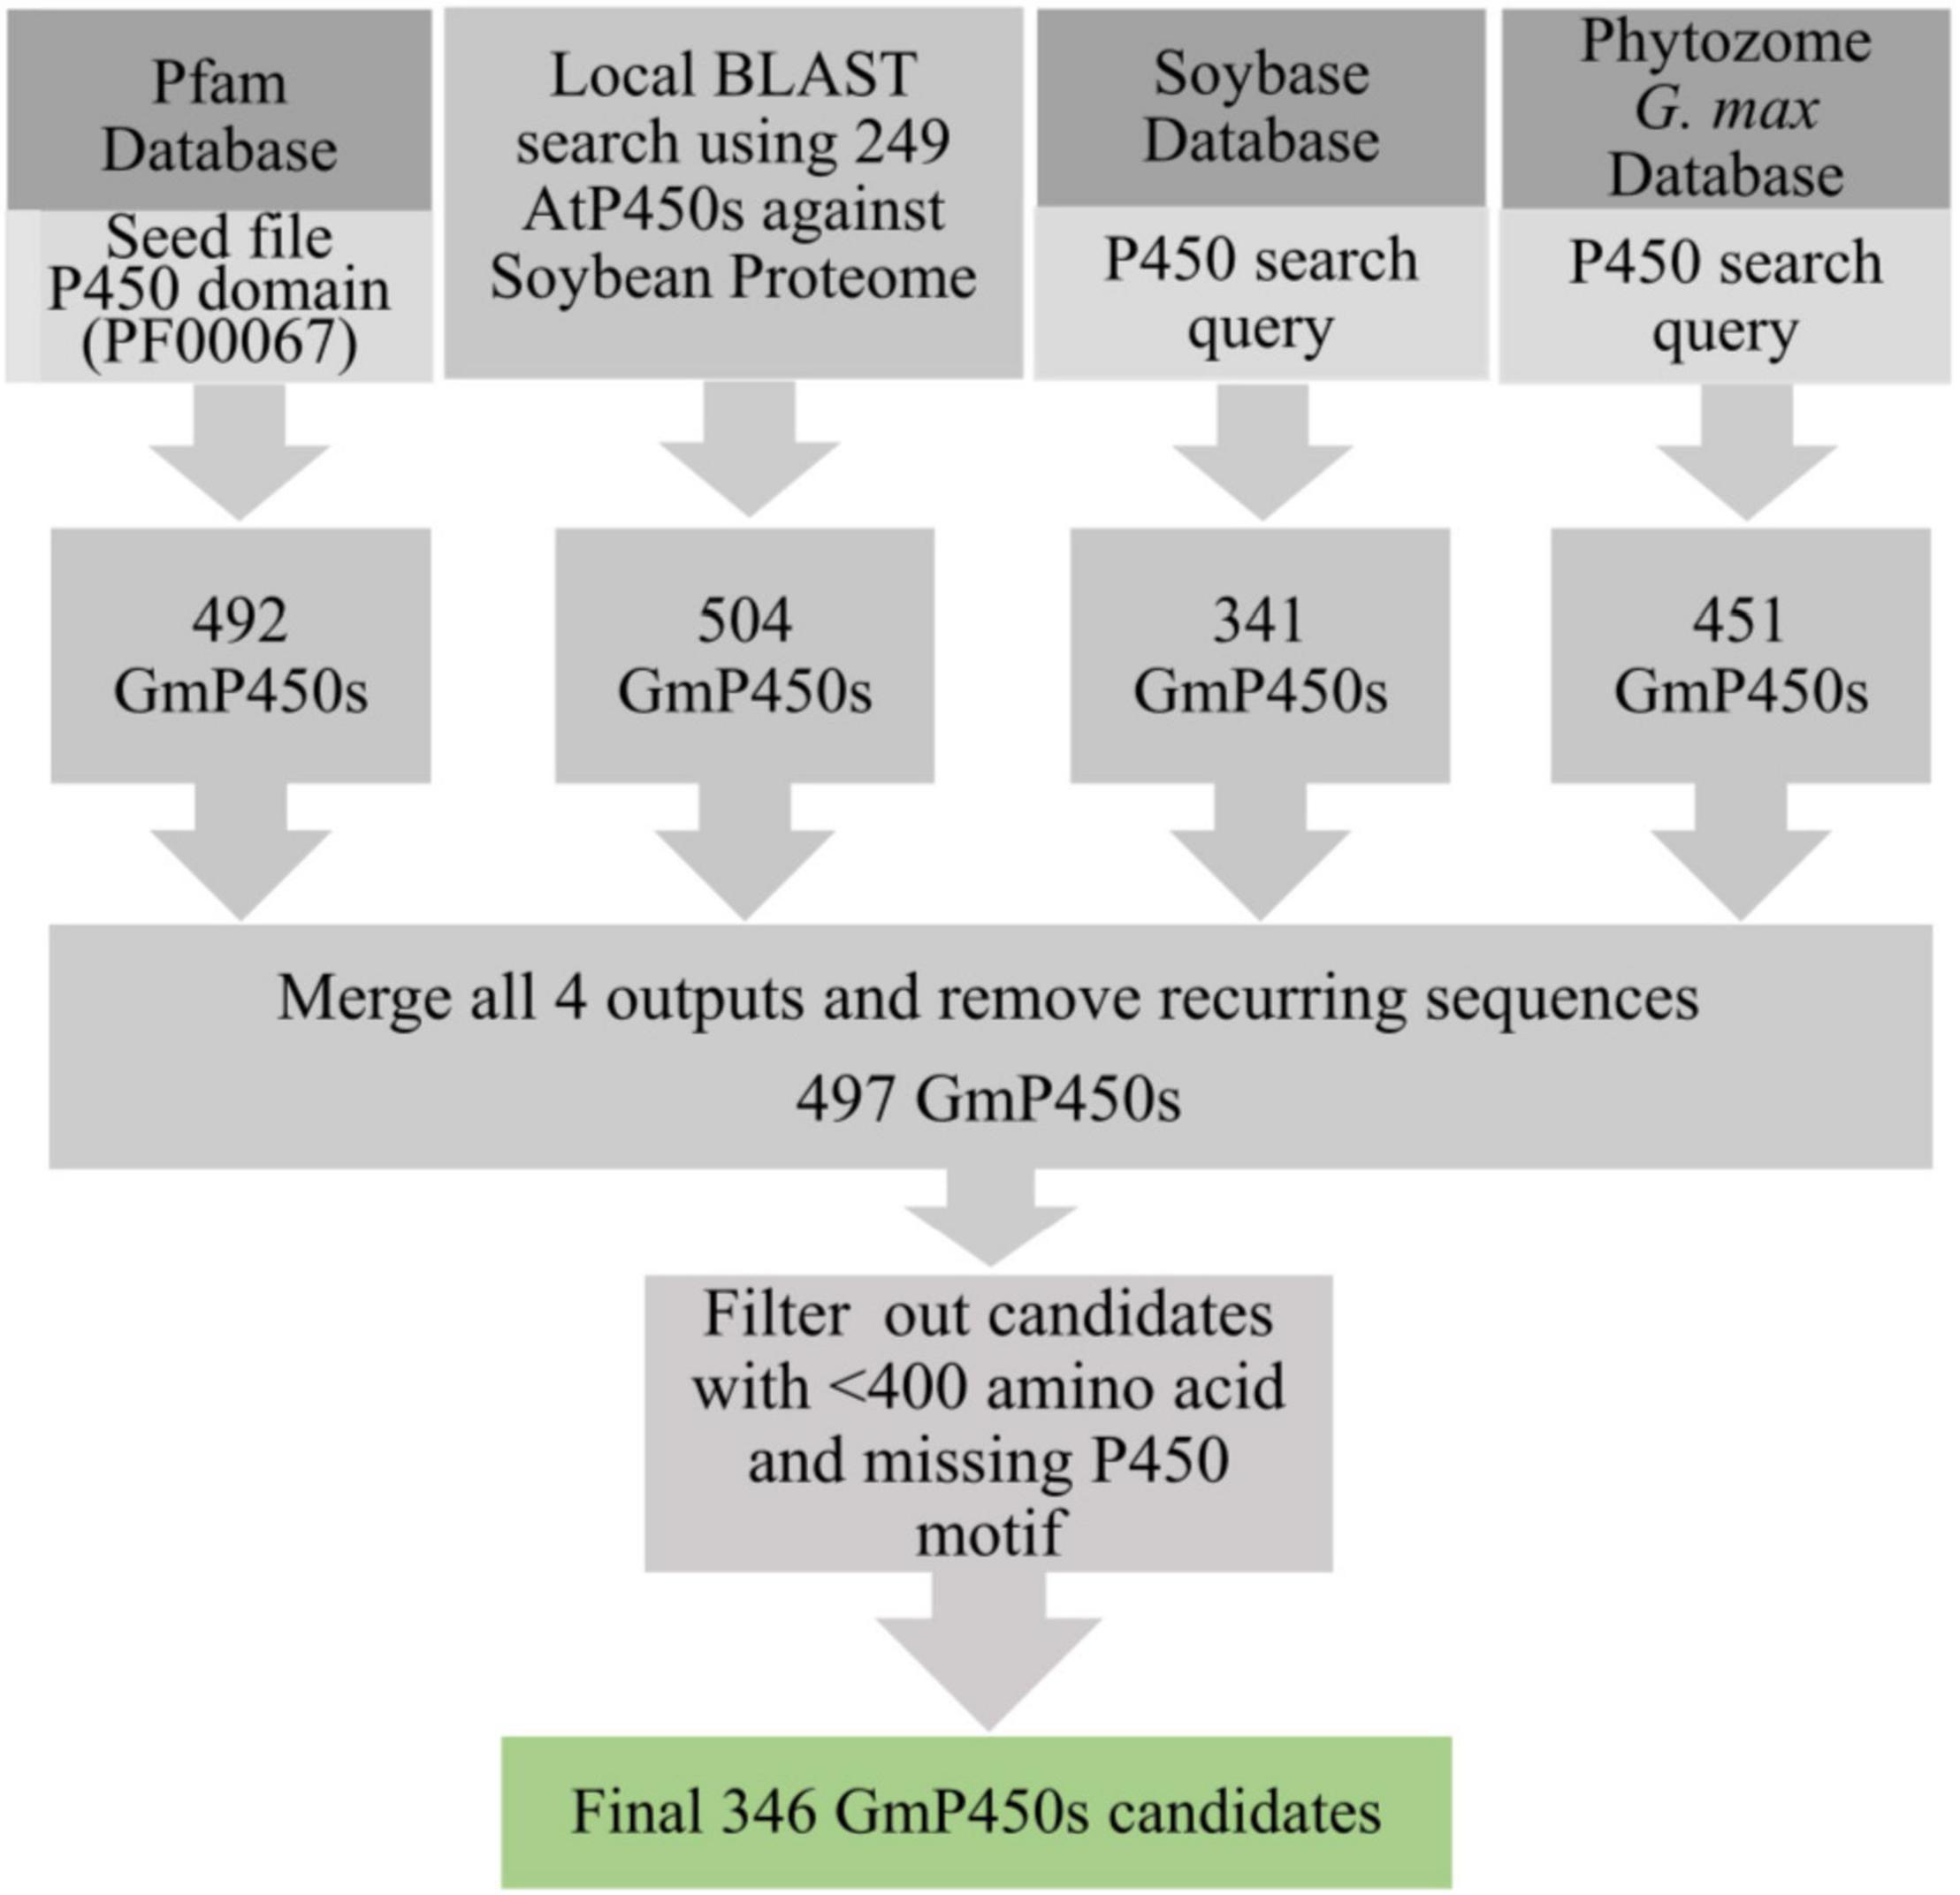
Figure 1. Strategy used for the identification of GmP450s. A flow diagram showing the number of hits obtained from each database search and filtering criteria that resulted into a final list of 346 putative GmP450s in soybean.
In total, 346 GmP450s are encoded by 317 genes where 26 of them produced multiple transcripts leading to more than one GmP450 proteins. Our search identified 10 new GmP450s compared with the previous study by Guttikonda et al. (2010). Due to the database update with reassembly and re-annotation, several discrepancies between our findings and previously reported GmP450s were observed. For example, 25 previously reported GmP450s (Guttikonda et al., 2010) are not included in our list as they either lack the P450 signature motifs or are truncated. A phylogenetic tree containing 346 candidate GmP450s along with previously reported 359 P450s from other plant species (Supplementary Table 4) grouped GmP450s into 2 groups and multiple clans (Supplementary Figure 1). A rooted phylogenetic tree was further constructed to investigate the evolutionary relationship between the GmP450 family members of the same group (Figure 2). Based on the phylogenetic analysis, GmP450s are grouped into two types: A-type with a single clan (clan71 containing 20 families) and non-A-type (9 clans and 28 families) with 197 and 149 GmP450s, respectively. Out of 48 P450 families, 3 families CYP703 (clan71), CYP718 (clan85), and CYP727 (clan727) contain only one GmP450 member. CYP71 is the largest family in soybean containing 53 members, followed by CYP82 family with 25 members (Figure 3A and Supplementary Table 4).
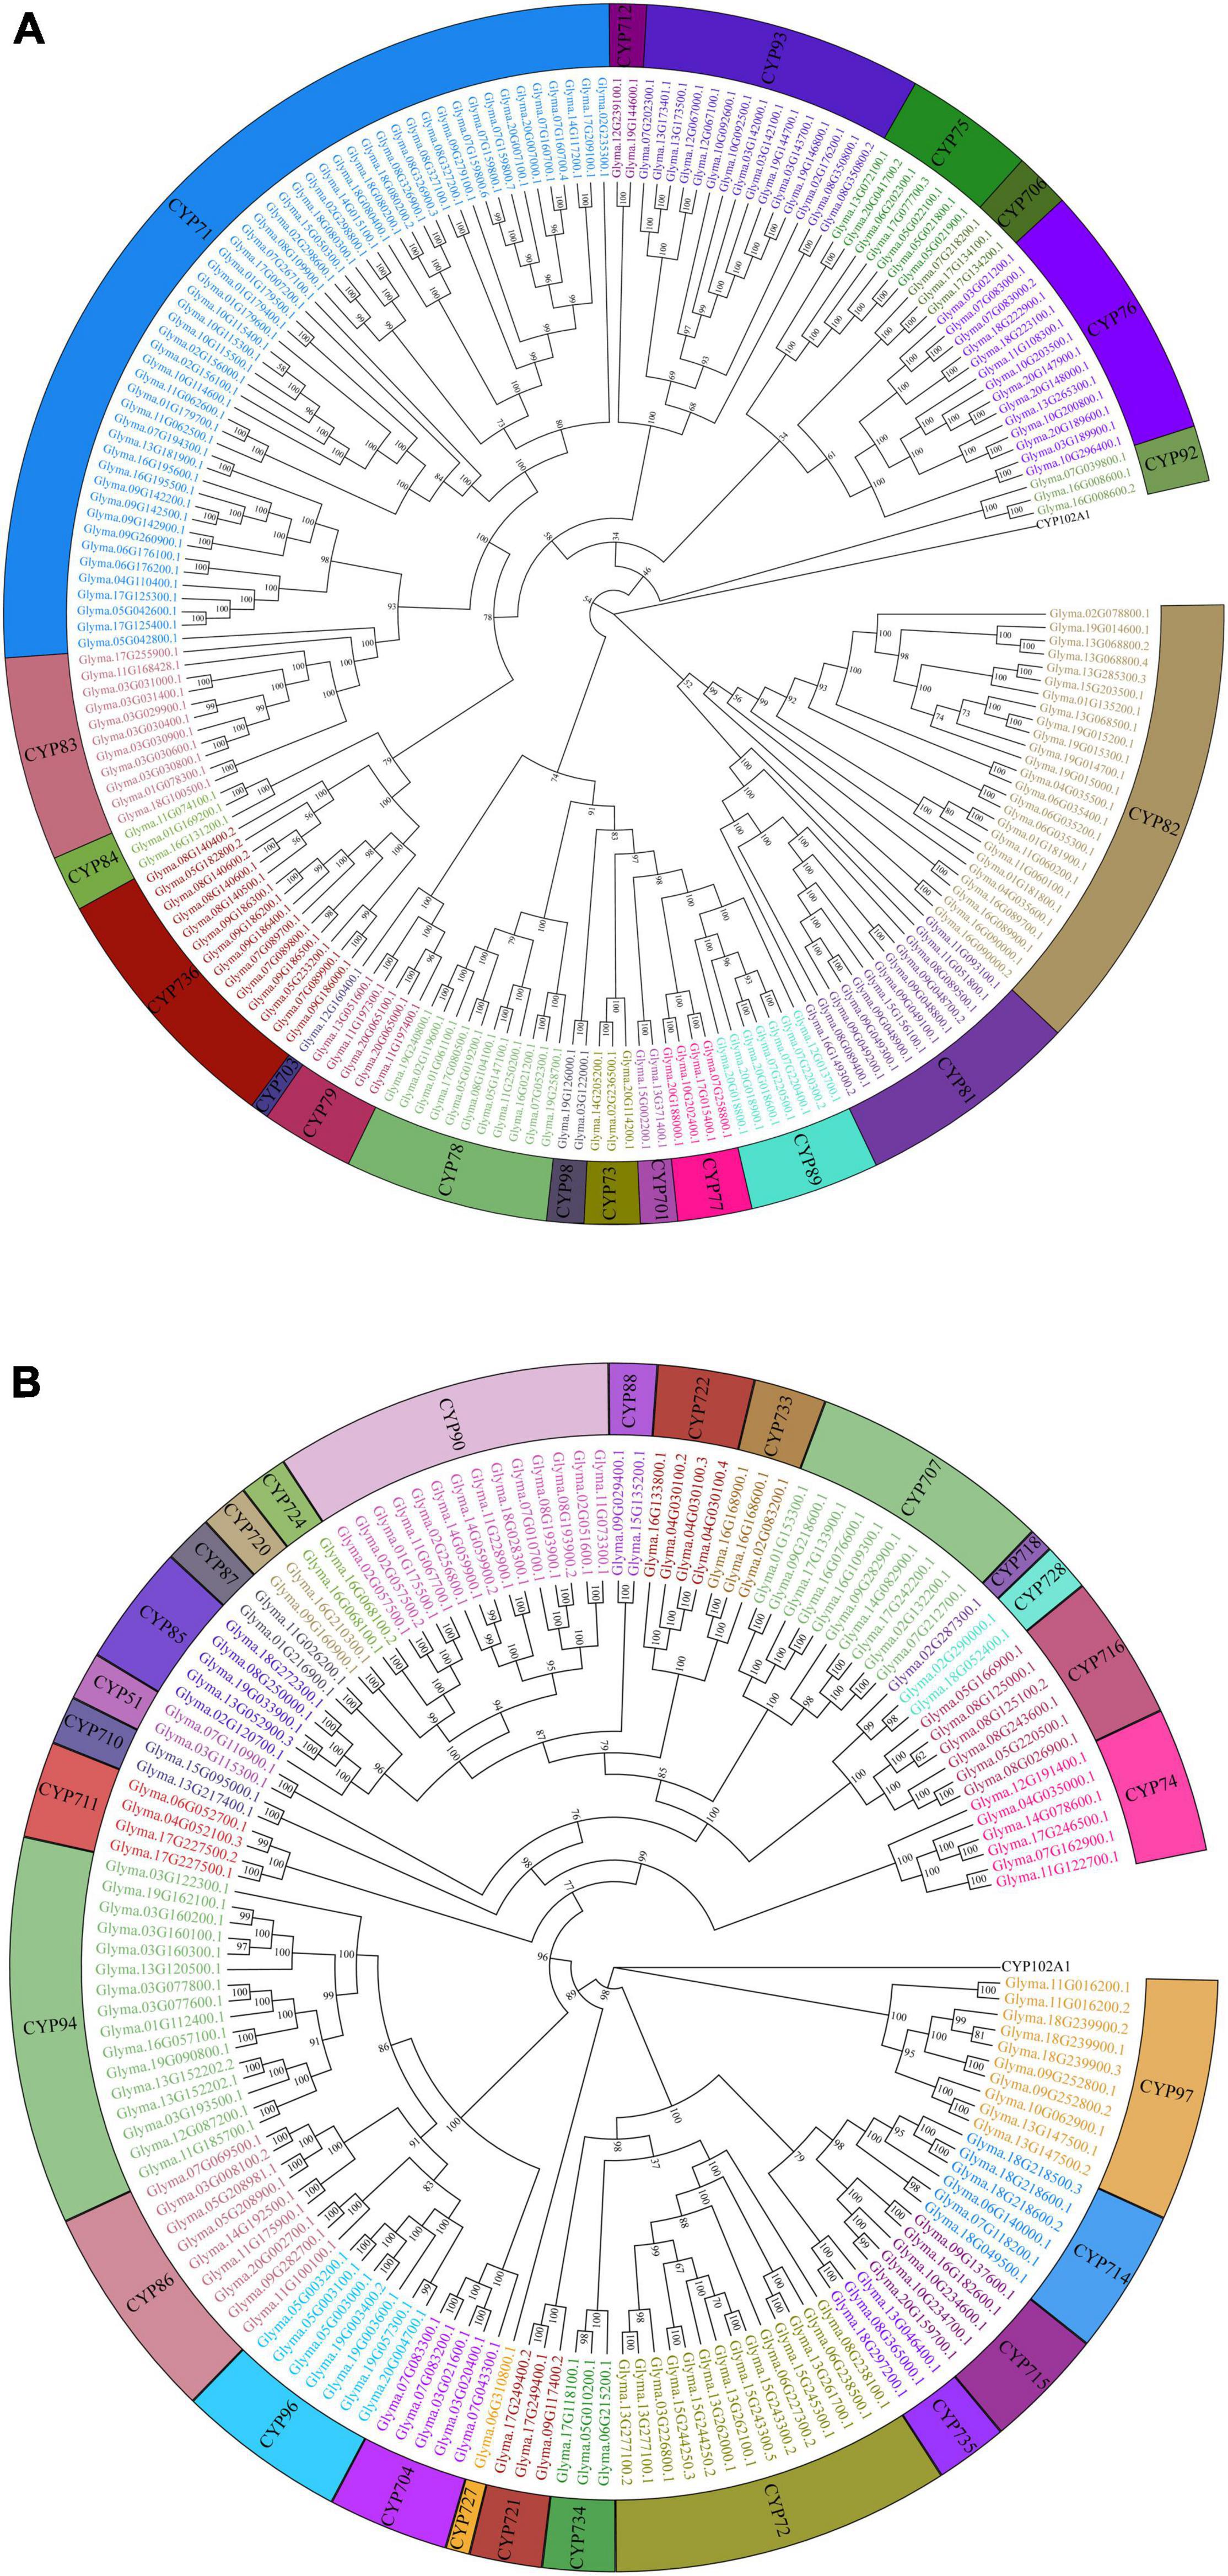
Figure 2. Phylogenetic analysis of GmP450s. Amino acid sequences of GmP450s were aligned in ClustalO and a phylogenetic tree was constructed using a maximum likelihood method in IQTREE2 with best fit model with a bootstrap value set to 1,000. CYP102A1 indicates an out-group used to root the tree. (A) A-type, and (B) non-A-type GmP450s.
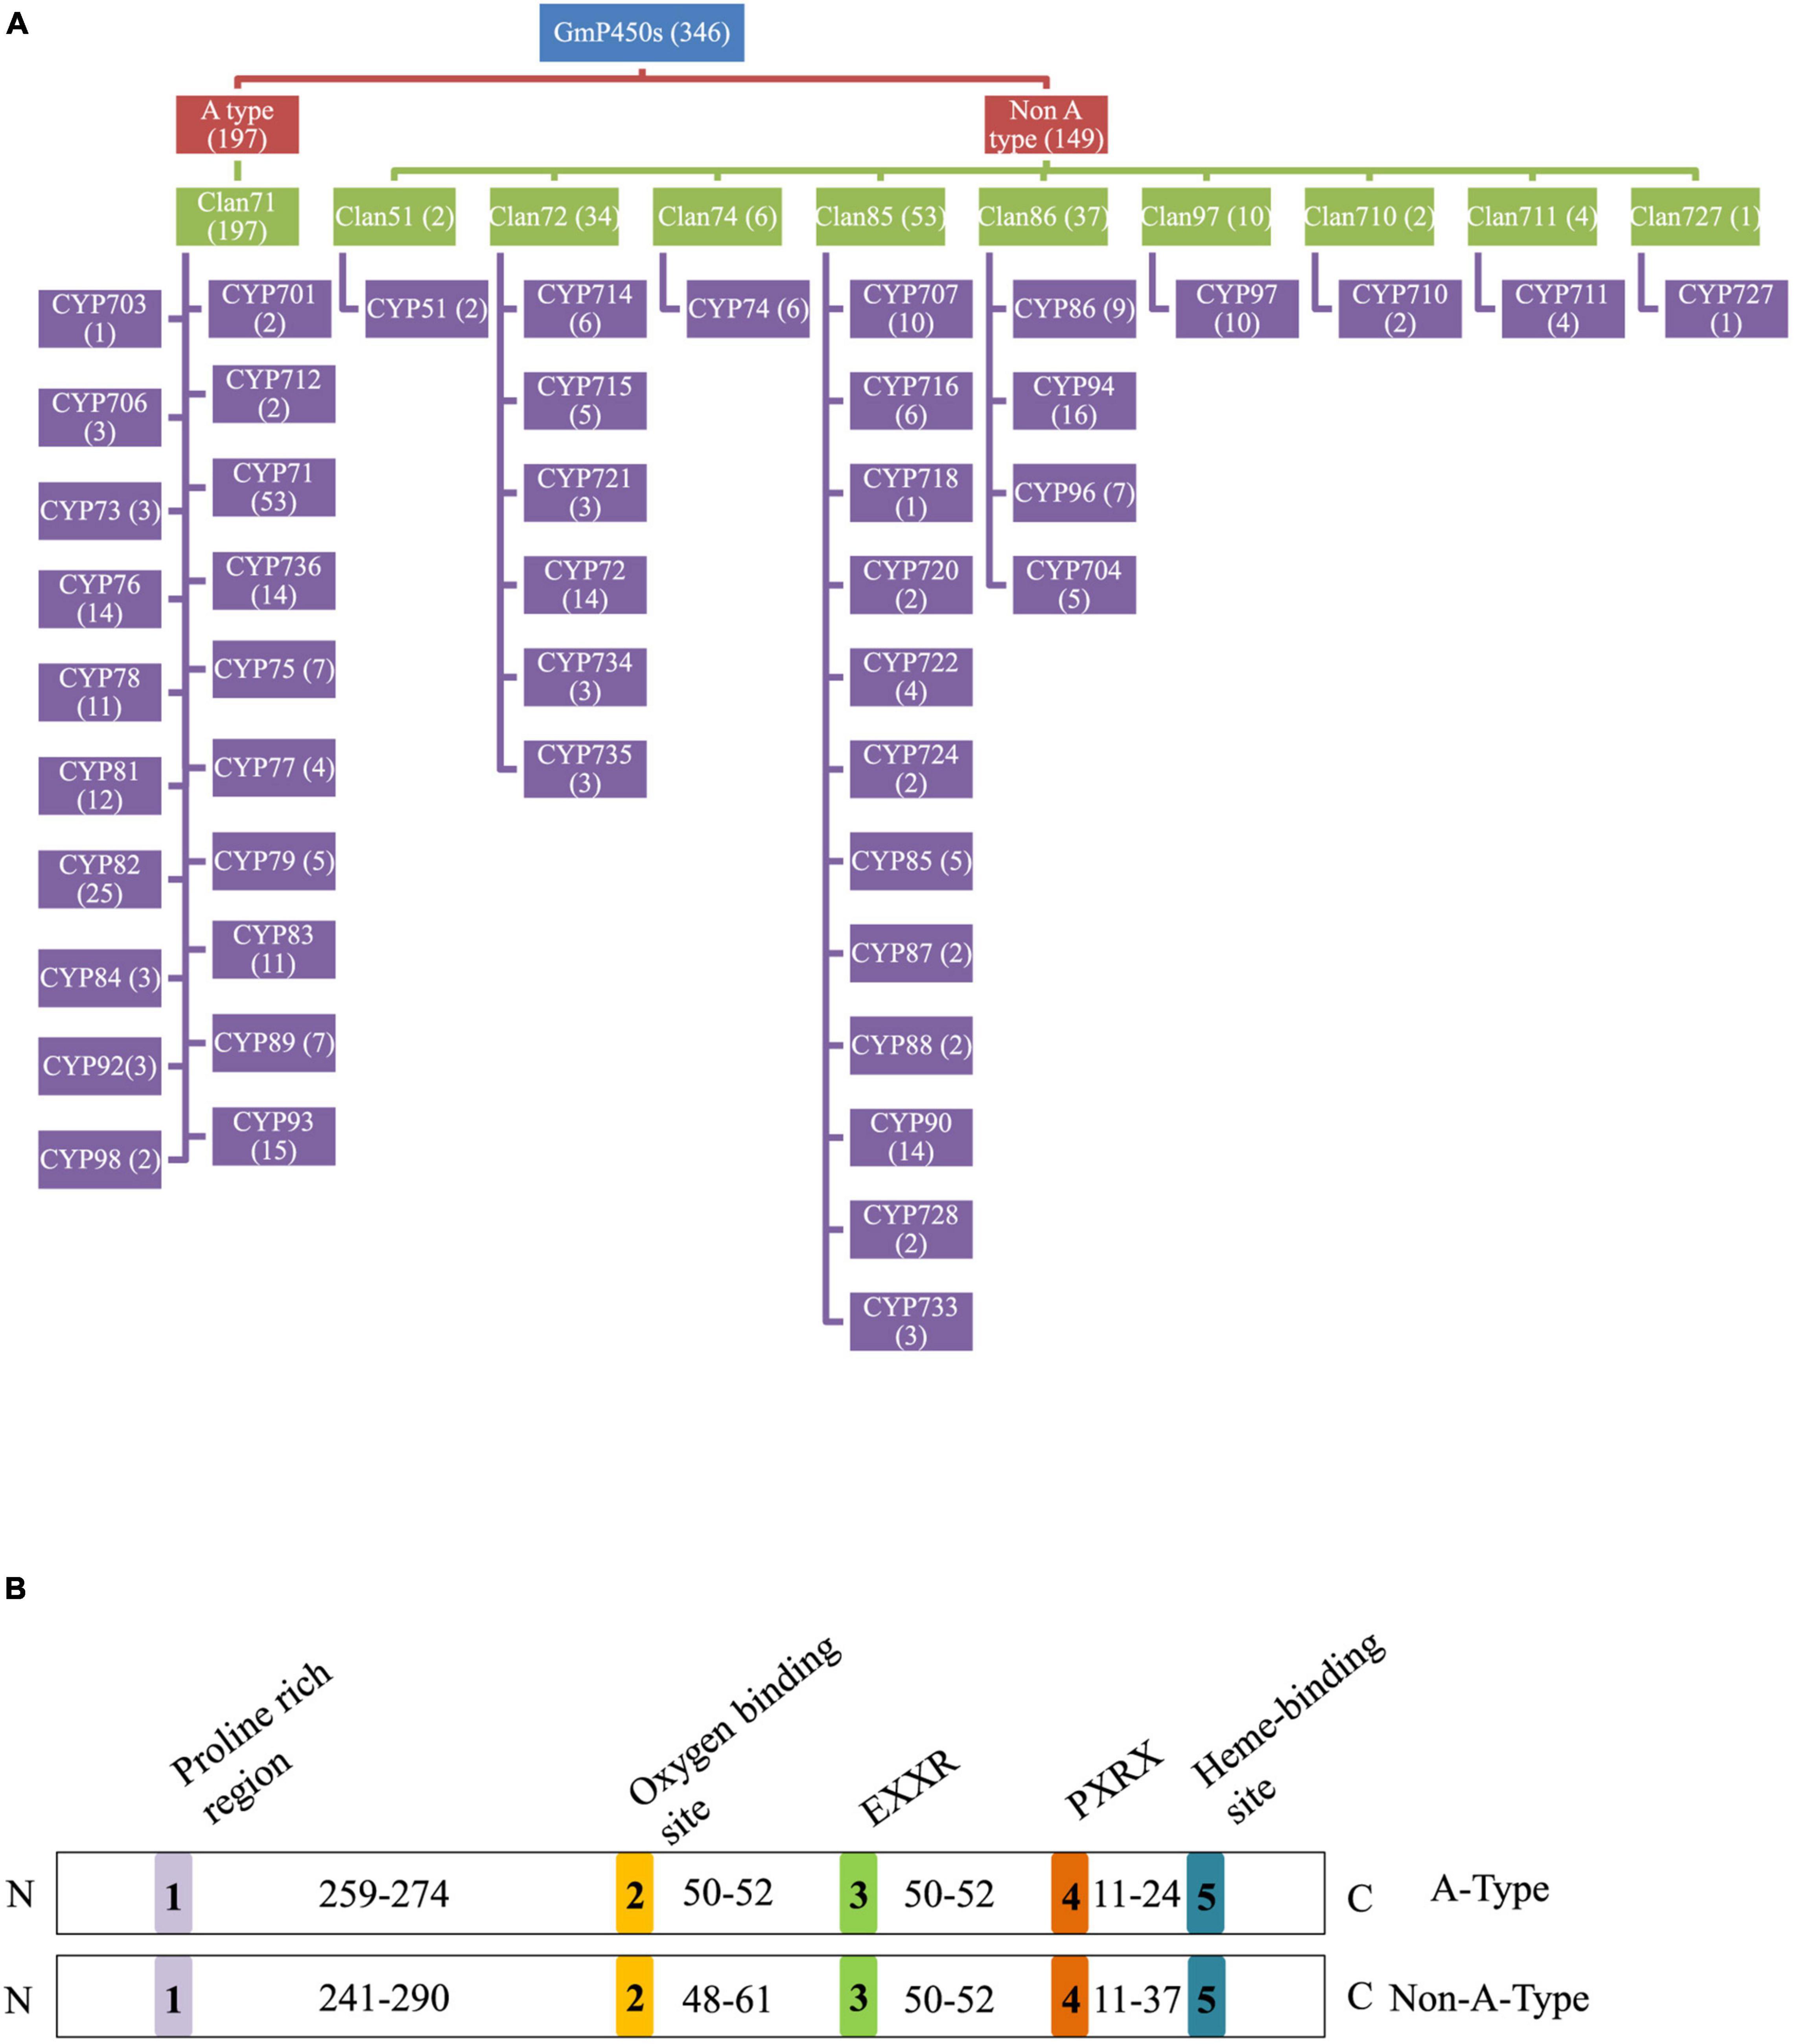
Figure 3. Soybean P450s. (A) A flowchart showing the distribution of GmP450s in clans and CYP families. GmP450 type, clans and families are color coded. The number of GmP50s under each category is indicated within the parenthesis. (B) Conserved motifs and number of amino acid residues in the variable regions in GmP450s. Five conserved P450 motifs are color coded and indicated by 1–5. The number of amino acid residues present in the variable region between conserved motifs is shown. N and C denotes the N-terminal and C-terminal of protein, respectively.
The calculated molecular mass of GmP450s ranged from 33.4 (CYP76; Glyma.20G147900.1) to 71.38 kDa (CYP97; Glyma.18G239900.1) with the average molecular weight of 57.7 kDa. The pI ranged from 4.69 (CYP97; Glyma.18G239900.2) to 9.82 (CYP728; Glyma.02G290000.1) with the average pI of 7.97. Majority of GmP450s were predicted to localize in the endoplasmic reticulum while some in other subcellular compartments, such as the plasma membrane, golgi complex, mitochondria, plastid, peroxisome, nucleus, and cytoplasm (Supplementary Table 4).
Analysis of Conserved Domains and Variable Regions in GmP450s
To investigate the conserved domains in the candidate GmP450s, their protein sequences were searched for the presence of five conserved domains reported in plant P450s, such as proline-rich hinge, oxygen-binding and activation site, EXXR, PXRX, and heme-binding motif (Bak et al., 2011). The results revealed a wide variation in the conserved sequences, however, there was a consistent pattern among the family members (Supplementary Table 5). Most importantly, the K-helix (EXXR) and the three amino acid residues CXG in the heme-binding site were found conserved in the majority of GmP450 families belonging to both A-type and non-A-type, signifying their importance in enzyme activity. Furthermore, the GmP450s belonging to A-type contained less variation in the conserved motifs than non-A-type (Tables 1, 2). As shown in Table 1, in A-type, PPGP (proline-rich region) was found conserved in all the GmP450 members except for a few members of the families CYP71, CYP93, CYP701, and CYP712, where glycine at the third position in the PPGP motif was not conserved. The GmP450s belonging to the family CYP82 contained variations in proline and glycine at second and third positions, whereas most CYP78 members contained variation in all the three positions except first proline. Even though the oxygen binding domain [(A/G)GX(D/E)T(T/S)] was conserved in A-type GmP450s, variations in some amino acid residues were found (Table 1). In CYP701 family GmP450s, the first and second glycine residues are replaced with glutamic acid and threonine, respectively, while CYP78 family members contained arginine instead of glycine at the first position and valine instead of threonine or serine as the last amino acid residue. Similarly, CYP79 family GmP450s contained variations in the fifth and sixth amino acids in oxygen binding motif, where threonine or serine were replaced by asparagine and proline, respectively. Moreover, few members of CYP79 family contained variation in the second position. CYP712 and CYP84 family members showed a single variation in the oxygen binding motif. The PXRX motif is conserved in the A-type GmP450s with the amino acid residues PERF except for few members of CYP71 contained histidine instead of phenylalanine at the fourth position. Few members of CYP706, CYP736, CYP76, CYP82, and CYP84 GmP450s contained variation in glutamic acid at second position. In CYP703 and CYP79 amino acid at the fourth position is histidine instead of phenylalanine. The heme-binding sites (5th motif) are conserved in the A-type GmP450s belonging to different CYP family except for few members of CYP71, CYP76, CYP77, CYP79, CYP83, and CYP89 where glycine at end replaced by alanine (Table 1 and Supplementary Table 5). In the case of non-A type GmP450s, proline-rich region was not conserved consistently across all the CYP families (Table 2 and Supplementary Table 5). The oxygen and heme-binding sites also contained large variations possibly indicating the diversification in their functionality and activity over the time of evolution. Only the K helix and CXG in the heme-binding domain (FXXGXRXCXG) were found conserved among the non-A-type GmP450s with few exceptions in CYP72 and CYP74 families.
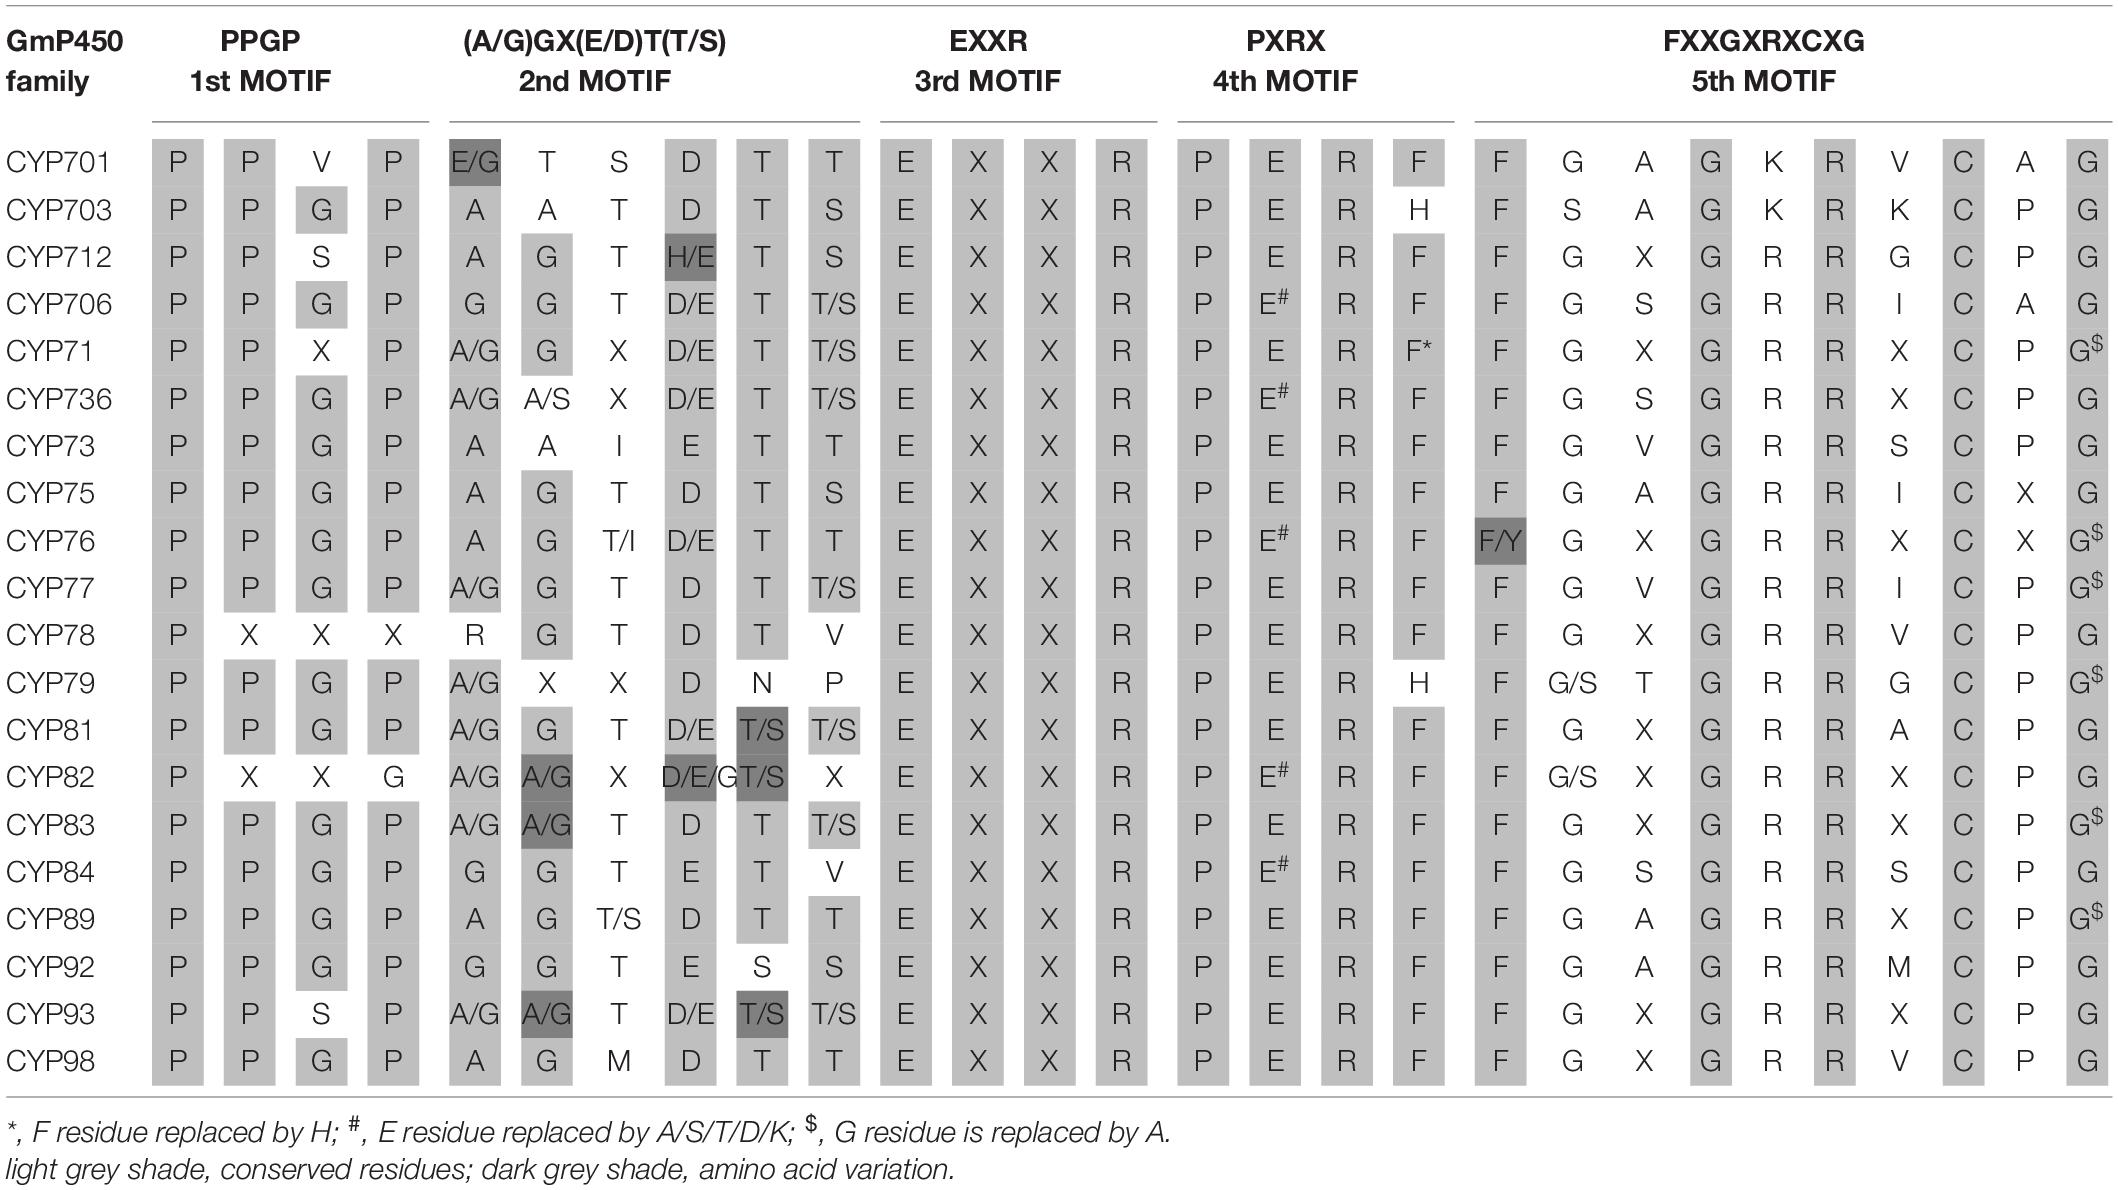
Table 1. Conserved motifs present in A-type GmP450 families.
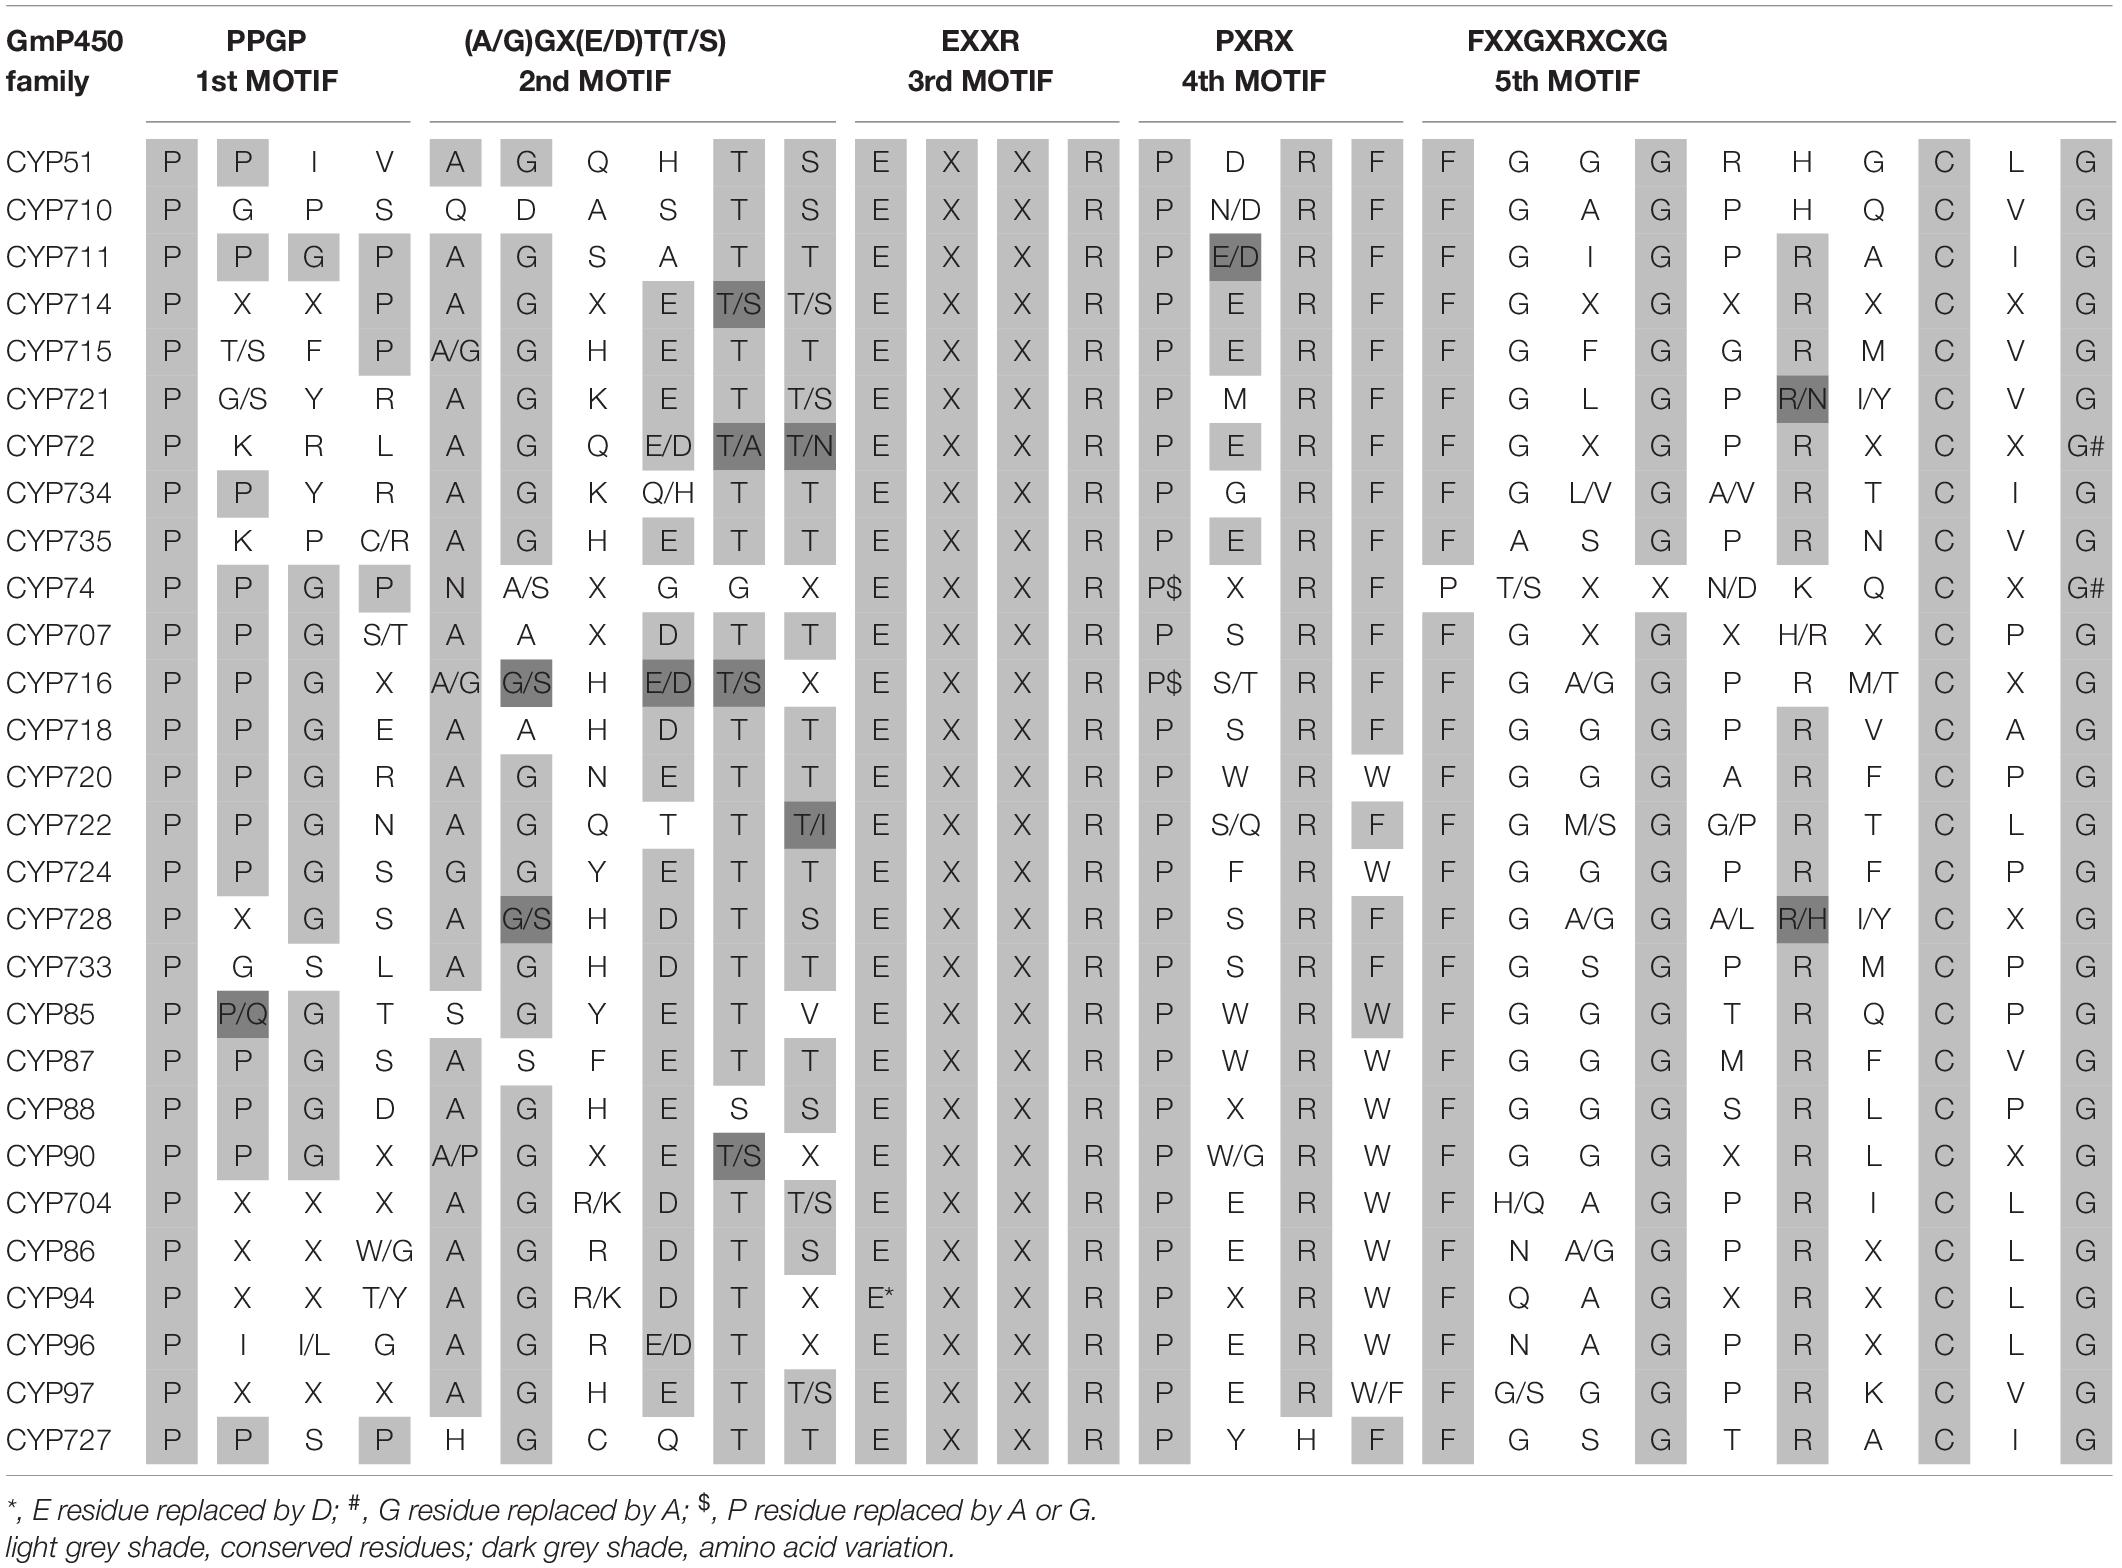
Table 2. Conserved motifs present in non-A-type GmP450 families.
The length of the variable region between two conserved domains defines protein structure and function. Therefore, we determined the size of the variable regions in each GmP450s by measuring the distance from the end of one domain to the beginning of the adjacent domain (e.g., end of PPGP and beginning of oxygen-binding motifs, end of oxygen-binding motif to the beginning of EXXR motif, end of EXXR motif to the beginning of PXRX motif, and end of PXRX motif the beginning of heme-binding motif) and evaluated the GmP450s belonging to each family (Figure 3B). The length of the variable regions in both A- and non-A-type GmP450s were found consistent within the members of the same family (Tables 3, 4). In the majority of A-type GmP450 proteins, the length of variable region between both the oxygen binding and EXXR domains, and EXXR and PXRX domains was 51 amino acids with some exceptions (Table 3 and Supplementary Table 5). The distance between the PXRX motif and the heme-binding motif ranged from 11–24 amino acid residues in A-type GmP450s. The non-A-type GmP450s showed more variation in the length of amino acid residues (48–61 amino acids with some exceptions) between oxygen binding and EXXR motifs while majority of the non-A-type family members contained 50–52 amino acids in between EXXR and PXRX. No consistent pattern was detected in the length of the variable regions between PPGP and oxygen-binding motifs in the GmP450s belonging to both A- and non-A-type clades. Few members of the families CYP71 (Glyma.18G080200.2), CYP83 (Glyma.11G168428.1), CYP733 (Glyma.16G168600.1), CYP704 (Glyma.07G043300.1), CYP736 (Glyma.09G186000.1), and CYP724 (Glyma.16G068100.2) contained irregular spacing between the conserved motifs suggesting the possibility that they are non-functional (Supplementary Table 5).
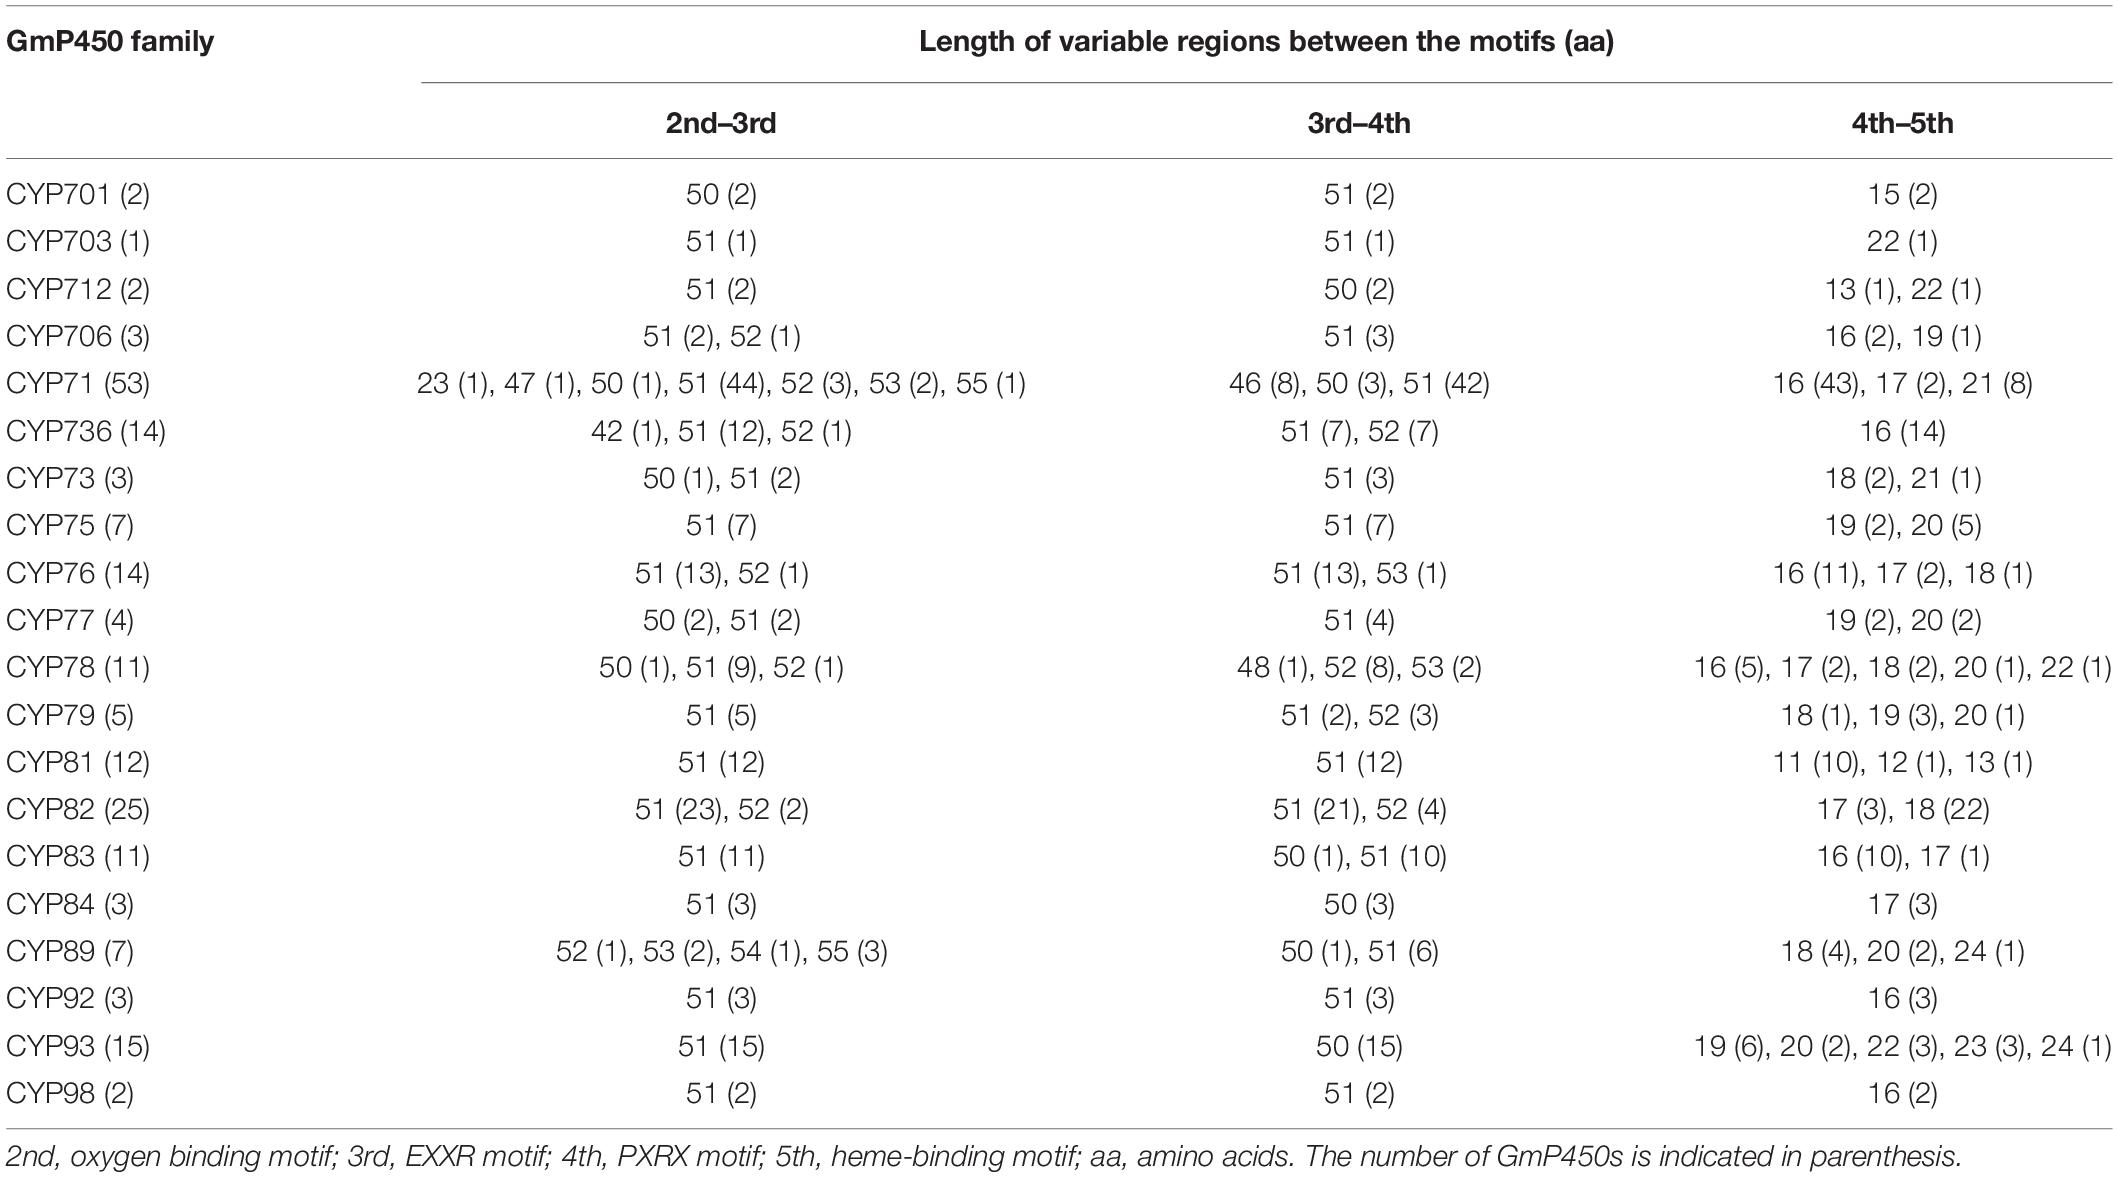
Table 3. Length of variable regions between the conserved motifs in A-type GmP450 families.
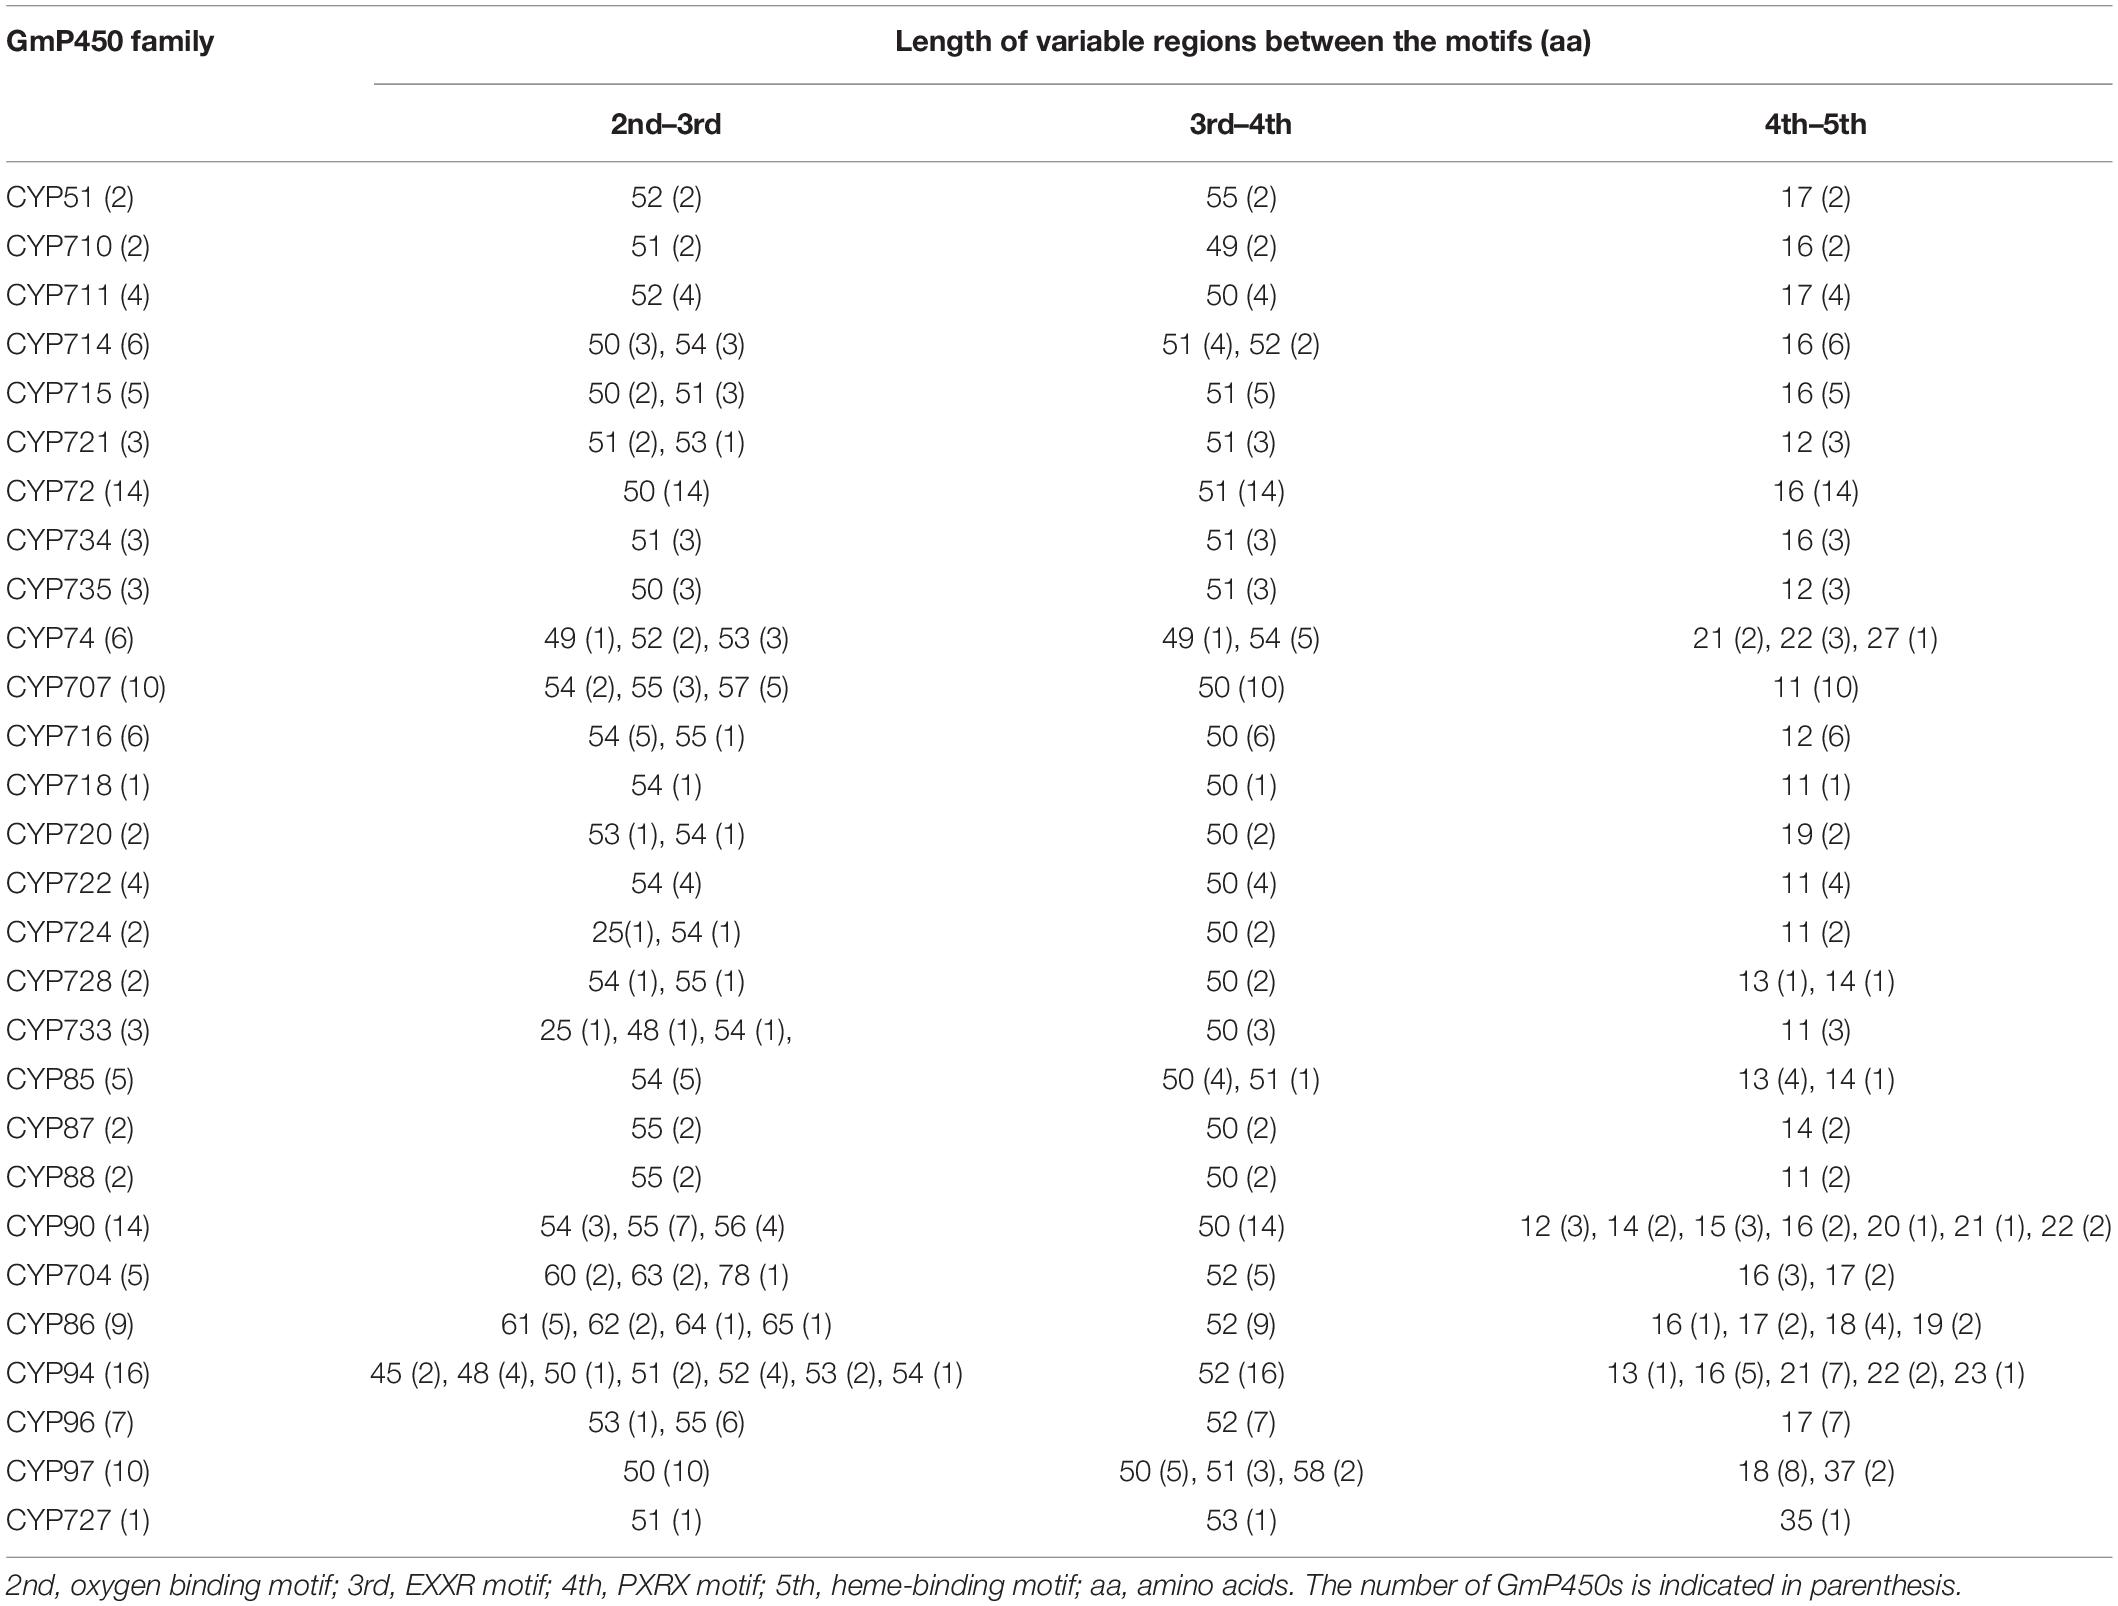
Table 4. Length of variable regions between the conserved motifs in non-A-type GmP450 families.
Gene Structure Analysis and Exon-Intron Organization of GmP450 Genes
The gene structure analysis of GmP450s revealed a wide variation in exon-intron organization. As shown in Figure 4A, a total of 11 intronless, 136 with single intron, and 39 GmP450s with multiple introns with their sizes ranging from 27 (Glyma.09G186000) to 16,950 (Glyma.11G168428) nucleotides were found within the A-type. Majority of A-type CYP families contained GmP450 genes with 1–2 introns except the two members of CYP73 (Glyma.02G236500 and Glyma.14G205200) with 3 and 1 member each of CYP82 (Glyma.16G090000) and CYP736 (Glyma.09G186000) with 5 introns. All 11 members of CYP78 contained only 1 intron. Only the members of CYP701 in clan71 contained 7 introns.
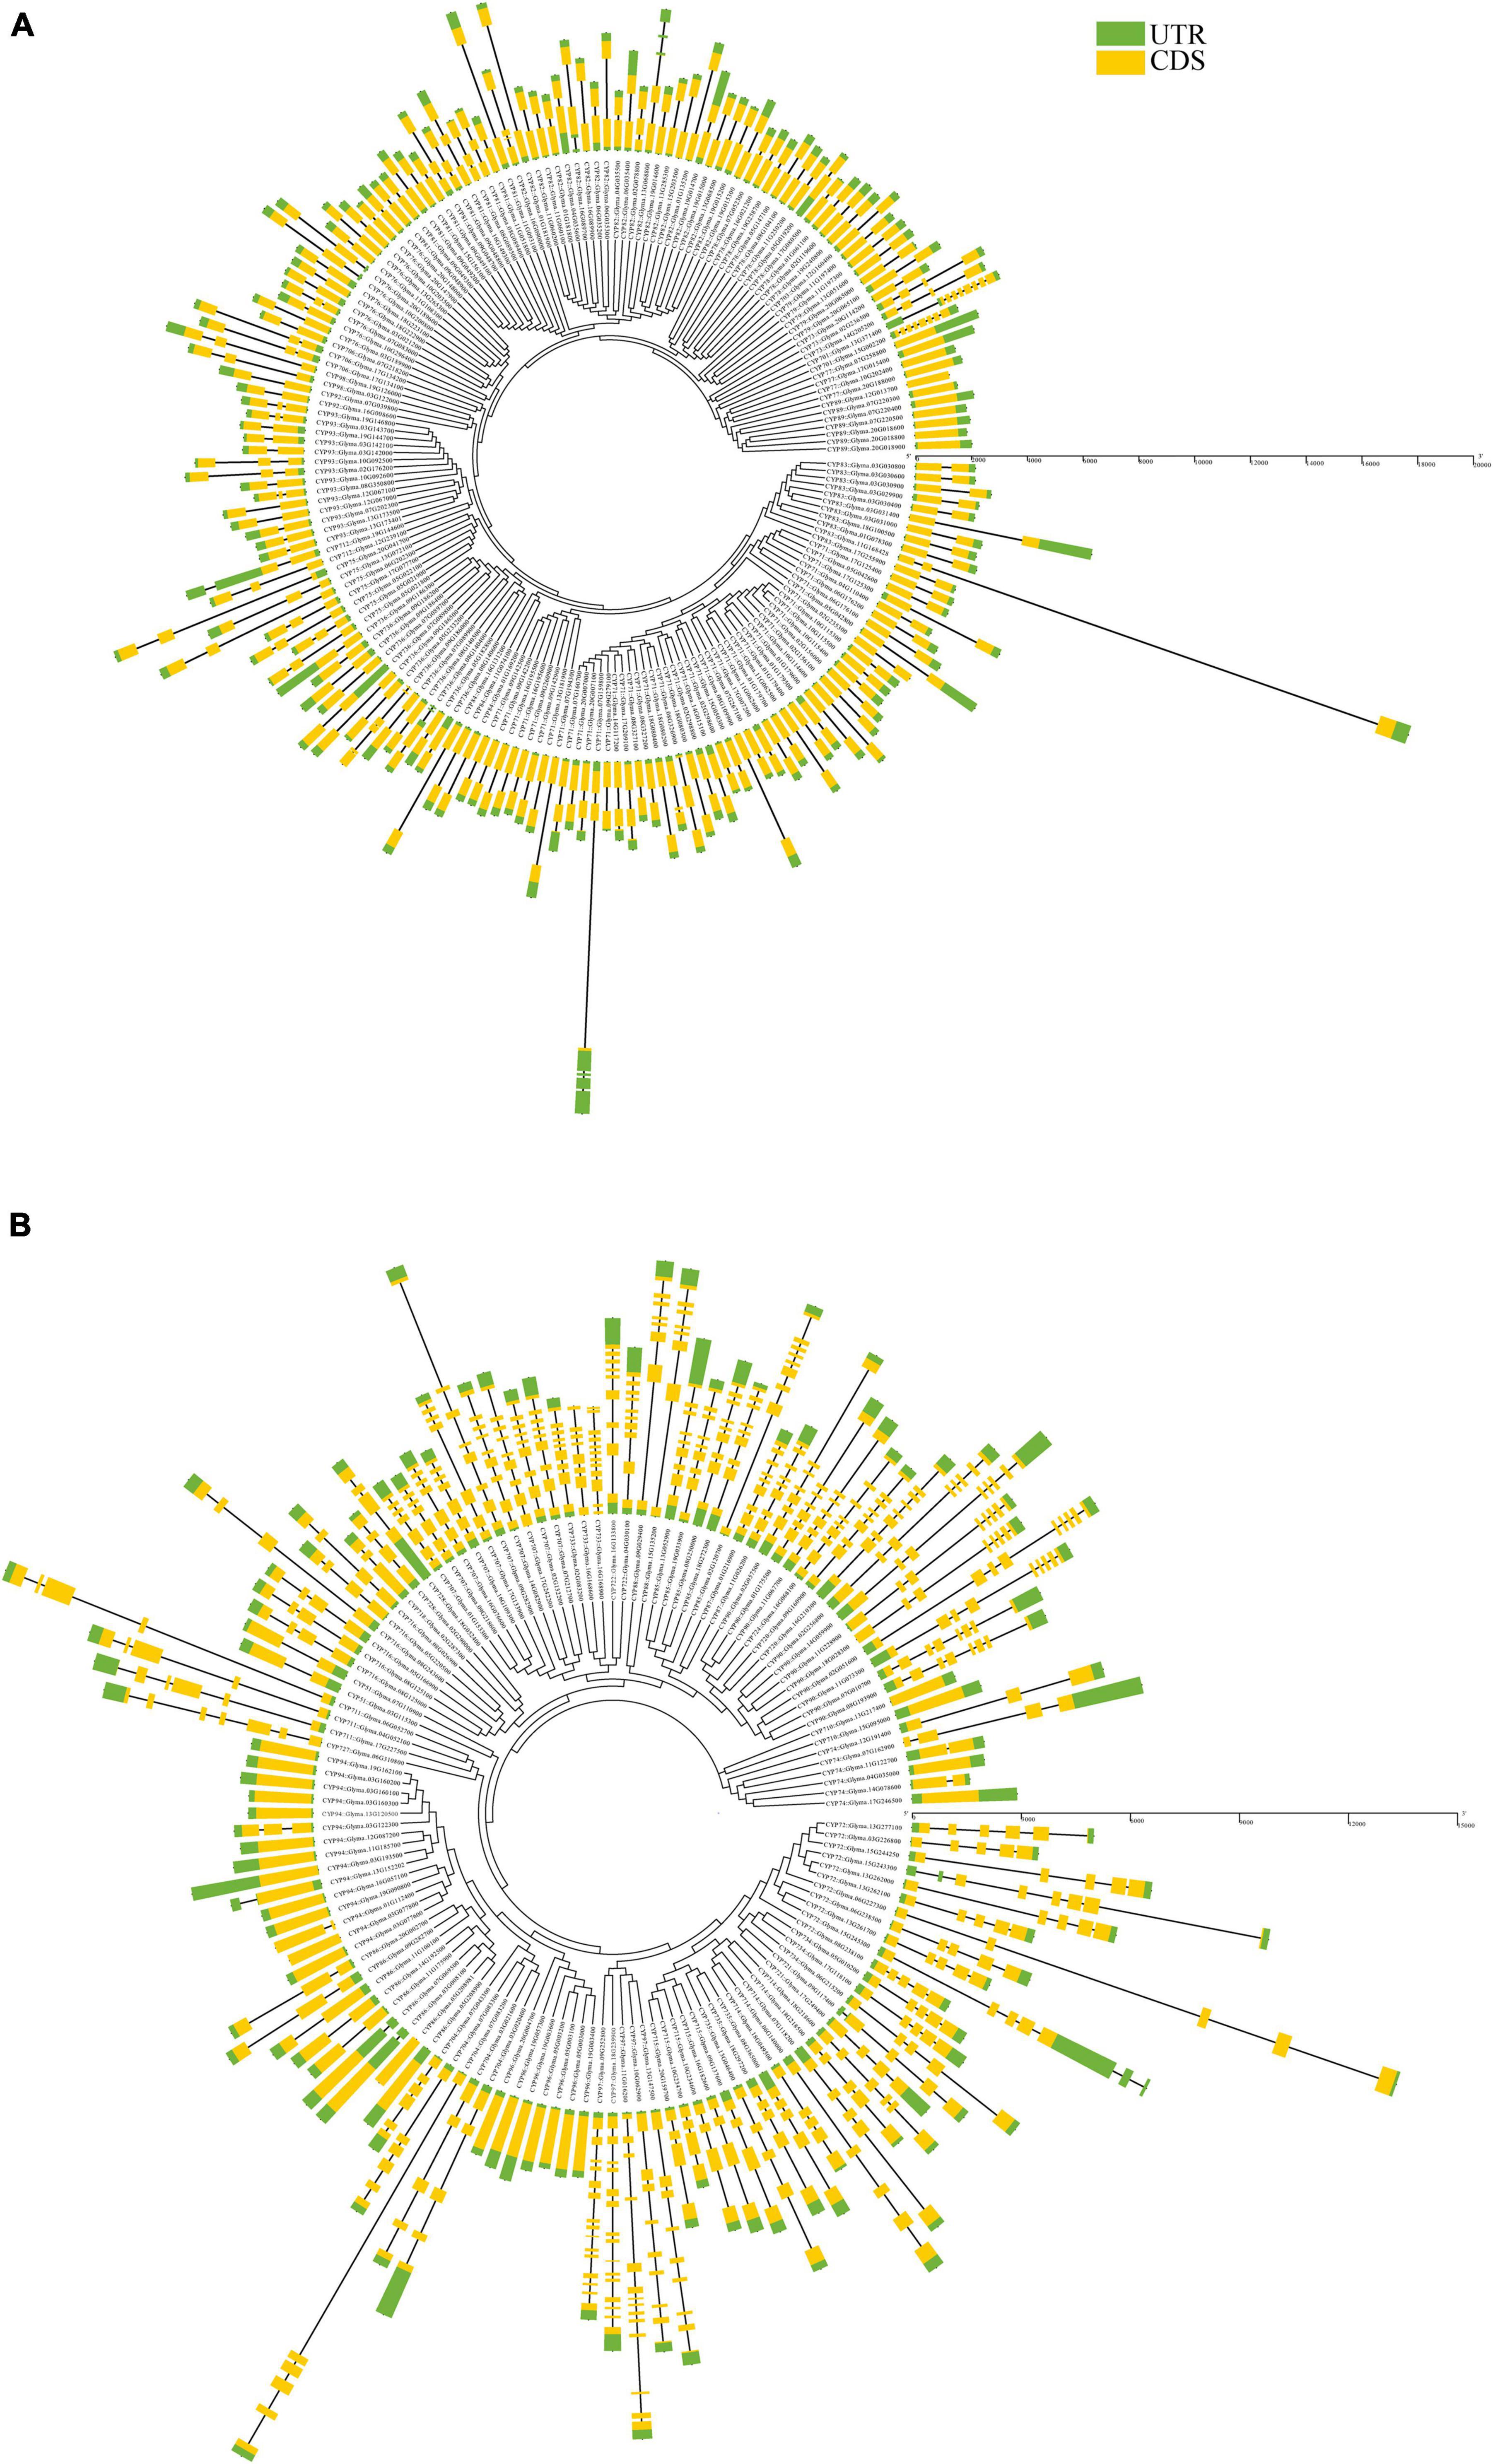
Figure 4. Gene structure of all putative soybean P450s showing a distinct pattern of structure among (A) A-type, and (B) non-A-type GmP450s. Yellow regions and black lines represent exons and introns, respectively. Green regions indicate 5′ or 3′ untranslated regions. Scale bars in base pairs are shown.
On the other hand, a number of introns in GmP450s belonging to the non-A-type are larger as compared with A-type (Figure 4B). In clan72, most of the members of CYP72, CYP714, CYP715, CYP721, CYP734, and CYP735 are found with 3–5 introns. Glyma.07G083200 (family CYP704) contained 5 introns where the first intron is the largest in size (909 bp) compared with other introns within the non-A-type GmP450s. A large variations in the intron lengths were found in the families belonging to clan 85. For example, GmP450s members of family CYP707, CYP722, CYP733, CYP88, CYP87, CYP90, CYP85, CYP720, and CYP724 were found with 6–8 introns except for Glyma.04G030100 (CYP722) and Glyma.16G168900 (CYP733) found with 9 and 11 introns, respectively. GmP450 members of the CYP716, CYP718, and CYP728 families within clan85 contained only 2–3 introns. In clan86, apart from family CYP704 (containing 4–5 introns) 24 GmP450s are intronless and 7 are with 1–2 introns. GmP450s belonging to CYP97 family contain the largest numbers of introns ranging from 8 to 14. Furthermore, members of clan51 are found with 1 intron, clan74 with 0–3 introns, clan711 with 4–5 introns, and clan 727 with 6 introns. Clan710 GmP450s are found intronless.
Tissue-Specific Transcript Abundance of GmP450 Genes
To evaluate the expression of GmP450 genes, we extracted the publicly available transcriptomic data from Phytozome 13 consisting of transcript levels in root tip, root, lateral root, stem, shoot tip, leaf, and flower (open and unopened). As shown in Figure 5, majority of both A- and non-A-type GmP450s showed tissue-specific expression pattern. A total of 65 A-type GmP450 transcripts accumulated at higher level in root tissue, such as root tip and lateral roots compared with other tissues. Among the root-specific GmP450, 16 members were from family CYP71, 8 from CYP93, 7 members from CYP81, and CYP82 each, 5 from CYP736, 4 members from CYP76, 2 members each from CYP78, CYP79, one from CYP75, CYP83, CYP89, CYP92, CYP701, and CYP712. Interestingly, all the members of CYP73 were found highly expressed in root tissue. An abundance of transcript accumulation were observed in root tip for Glyma.13G371400 belonging to the family CYP701, Glyma.09G048800 in family CYP81, Glyma.07G202300 and Glyma.08G350800 in family CYP93 suggesting their roles in defense against soil borne diseases. Similar results were found in other root born disease, such as Sclerotinia sclerotiorum in soybean (Ranjan et al., 2019). Apart from that, Glyma.07G218200 in family CYP706, Glyma.06G176100, Glyma.13G181900, Glyma.16G195500, Glyma.14G117200 in family CYP71, Glyma.12G239100 in family CYP712, Glyma.02G236500 in family CYP73, Glyma.09G186200 in CYP736, Glyma.06G202300 in CYP75, Glyma.10G200800 in CYP76, Glyma.16G089700 in CYP82, in CYP84, Glyma.07G220300 in CYP89 and Glyma.12G067000 in family CYP93 found in the higher transcript abundance in aerial tissues, such as shoot tip, shoot, and leaves. Interestingly, the transcript levels of all members of CYP77 and CYP98, 6 members of CYP78, and 2 members of CYP84 (Glyma.11G074100 and Glyma.16G131200) were found at much higher levels in shoot tips compared with other tissues under study. These results suggest the role of these P450s in tissue differentiation and cell wall components synthesis as some members of CYP78 were found to play a key role in regulating directional growth at the meristem and floral organogenesis (Zondlo and Irish, 1999; Eriksson et al., 2010). All members of CYP703, CYP706, and CYP83 found in higher levels in flower tissues. The FPKM counts for all GmP450s are shown in Supplementary Figure 2A.
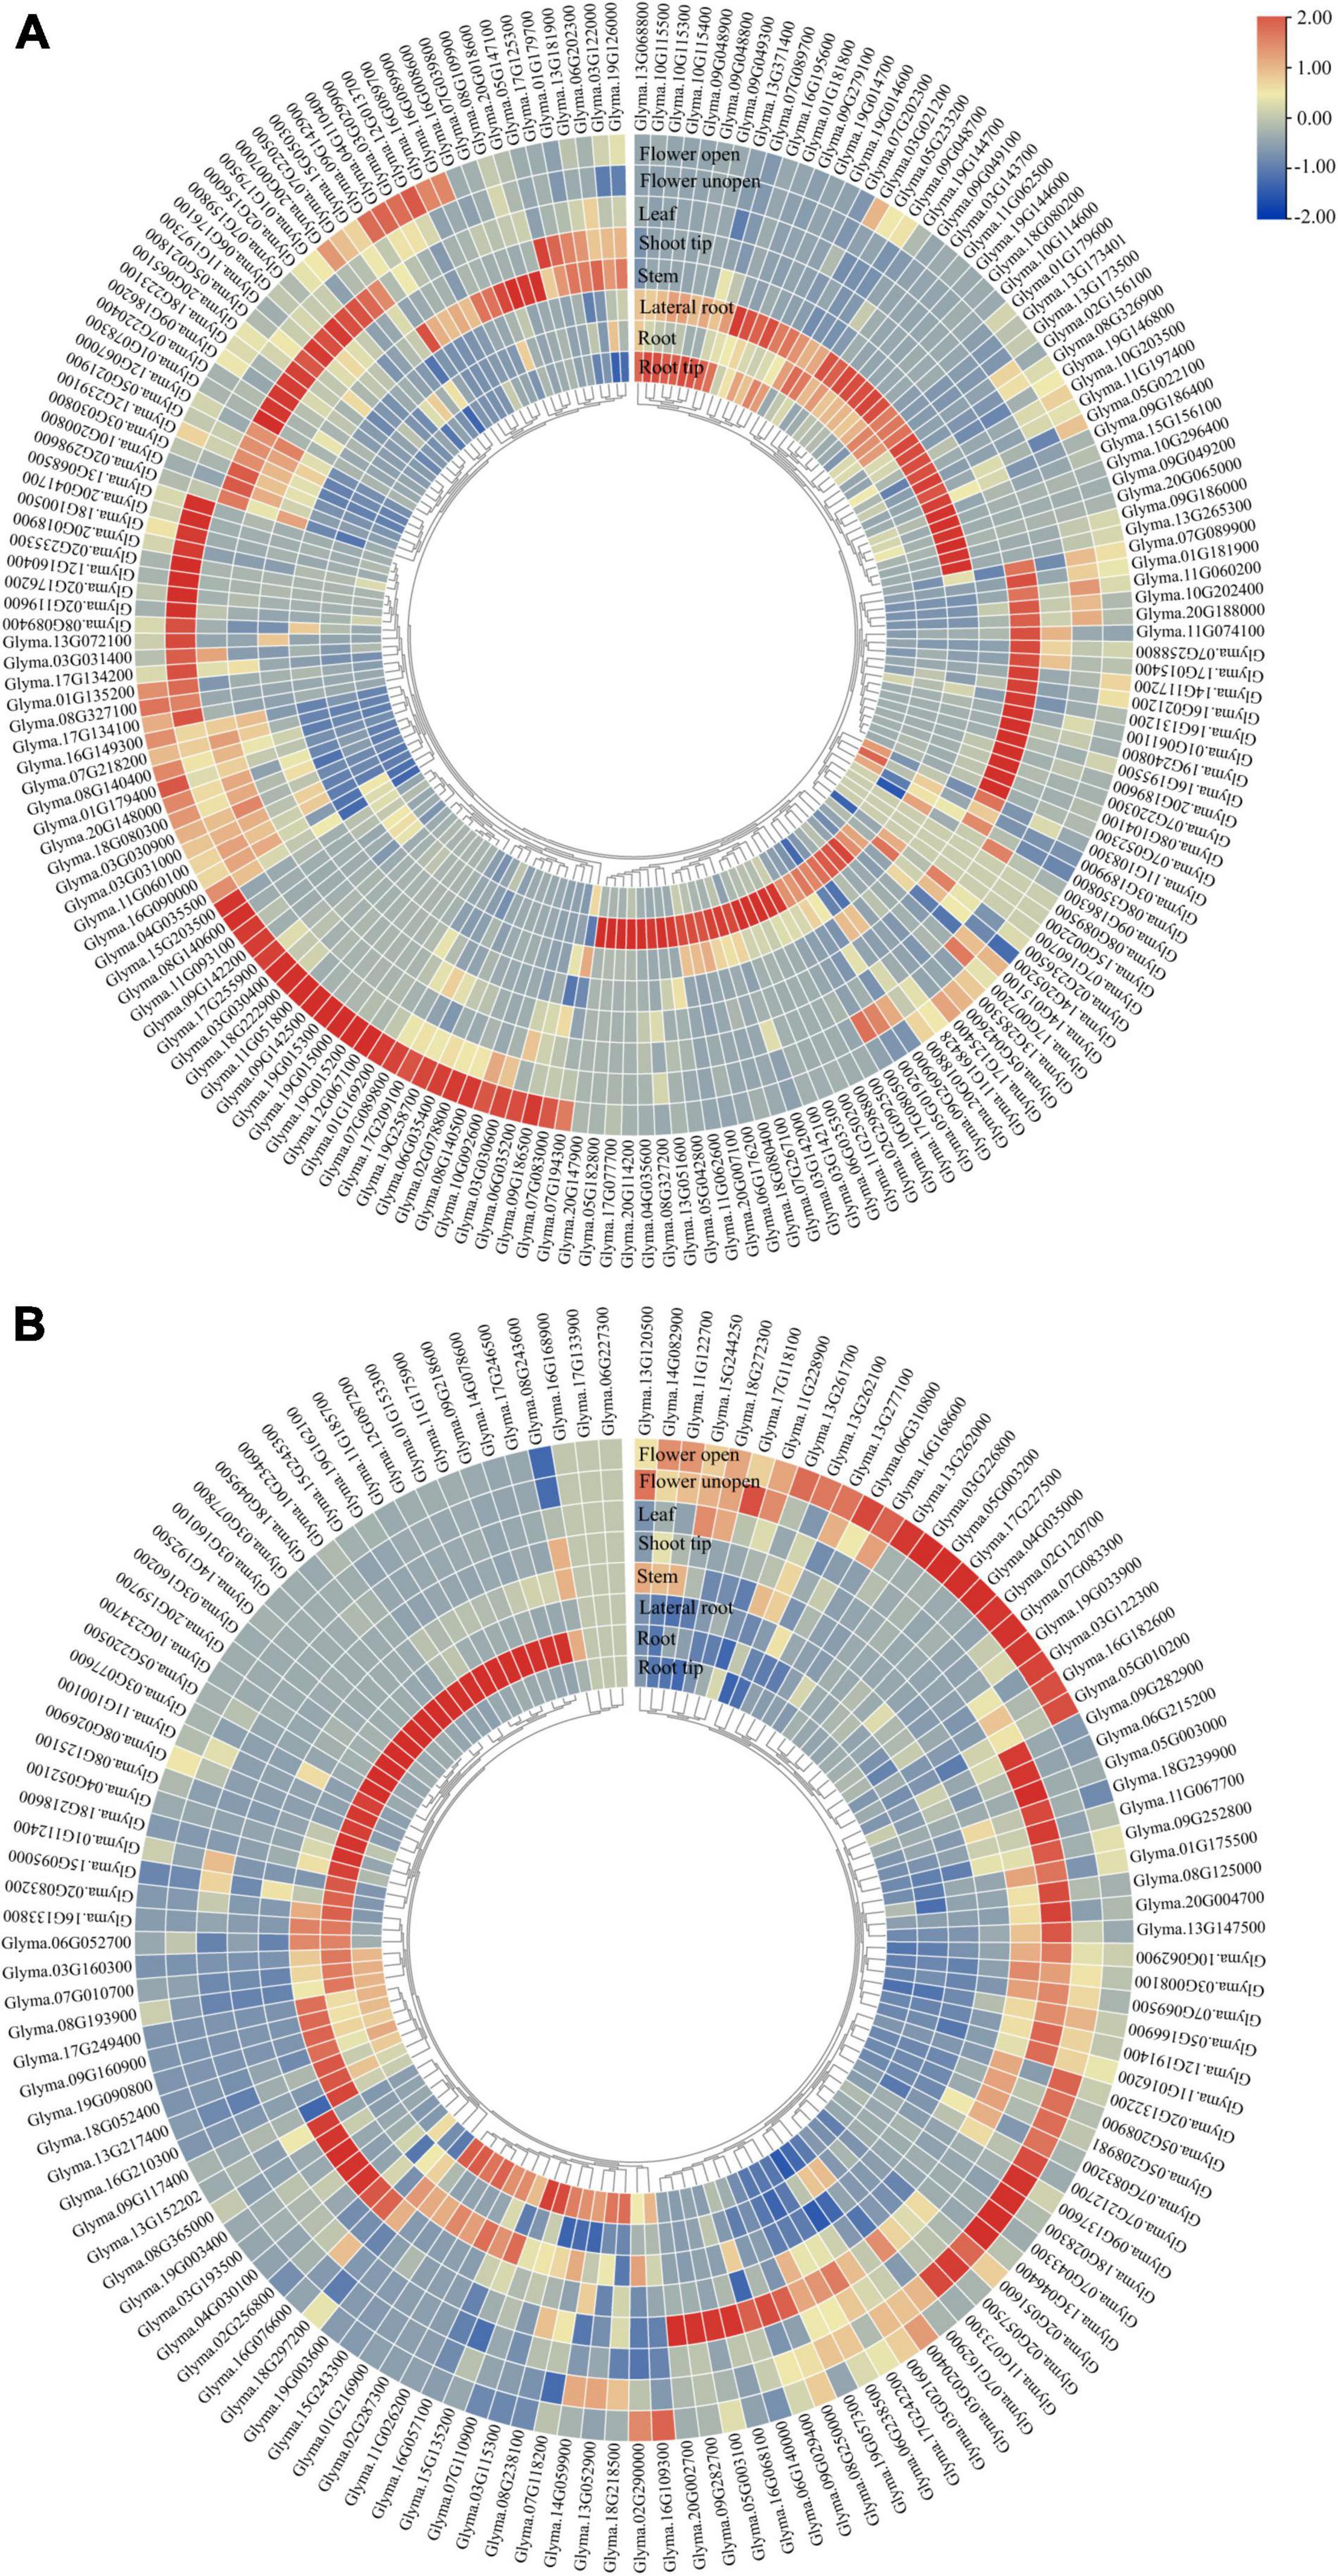
Figure 5. Tissue-specific expression of GmP450 gene family. Publicly available transcriptomic data for GmP450 genes in soybean tissues were retrieved from Phytozome13 database (https://phytozome-next.jgi.doe.gov/info/Gmax_Wm82_a4_v1) for heatmap generation. Color scale shows the range of normalized expression values in (A) A-type, and (B) non-A-type GmP450s.
The non-A-type GmP450 transcript abundance was relatively lower in all the tissues under study compared with the A-type. Within the non-A-type GmP450, the members of CYP51, CYP710, CYP711, CYP87, CYP94, CYP720, CYP728, CYP721, CYP715, and CYP716 were accumulated at higher level in the root tissue while other family members showed wide variation in expression pattern. Additionally, Glyma.19G003600 (CYP96), Glyma.01G153300 and Glyma.09G218600 (CYP707) showed relatively higher transcript accumulation in root tissue. All the members of CYP51 and CYP87, Glyma.08G238100 and Glyma.15G243300 (CYP72), and Glyma.19G003600 (CYP96) expressed at a relatively higher level in root tips. While all the members of CYP97 showed higher expression in leaves, the non-A-type GmP450s with higher expression in shoot tips belonged to the families CYP707 (Glyma.17G242200), CYP714 (Glyma.06G140000), CYP716 (Glyma.08G243600), CYP72 (Glyma.08G238100 and Glyma.06G238500), CYP74 (Glyma.12G191400 and Glyma.07G162900), CYP86 (Glyma.20G002700), CYP88 (Glyma.09G029400), and CYP96 (Glyma.05G003100). Only a single member of CYP727 and most members of CYP704, CYP85 showed higher expression in flower. The transcript levels of Glyma.02G132200 (CYP707), Glyma.03G226800, Glyma.13G261700, Glyma.13G262000, Glyma.13G277100 (CYP72), Glyma.12G191400, Glyma.07G162900, Glyma.11G122700 (CYP74), Glyma.19G033900 (CYP85), Glyma.18G028300, Glyma.02G051600 (CYP90), Glyma.03G122300 (CYP94), and Glyma.05G003200 (CYP96) also accumulated to a higher level in flower tissue. The FPKM counts for these GmP450s are shown in Supplementary Figure 2B.
Chromosomal Mapping of GmP450s and Quantitative Trait Loci Associated With Partial Resistance Against P. sojae
To determine the distribution of GmP450s on soybean chromosomes, a chromosomal map was constructed. All the 317 genes encoding 346 GmP450s are dispersed on 20 chromosomes (Supplementary Table 6). As shown in Figure 6, the GmP450 gene density per chromosome is uneven. Chromosomes 3 and 7 contained the largest number of GmP450 genes (25 each) followed by chromosome 9 that contained 24 GmP450s whereas only 6 GmP450s reside on chromosome 4. Most GmP450s were found localized toward the chromosomal ends except for some on chromosomes 7, 13, 14, and 20 that were found near the centromeres (Figure 6).
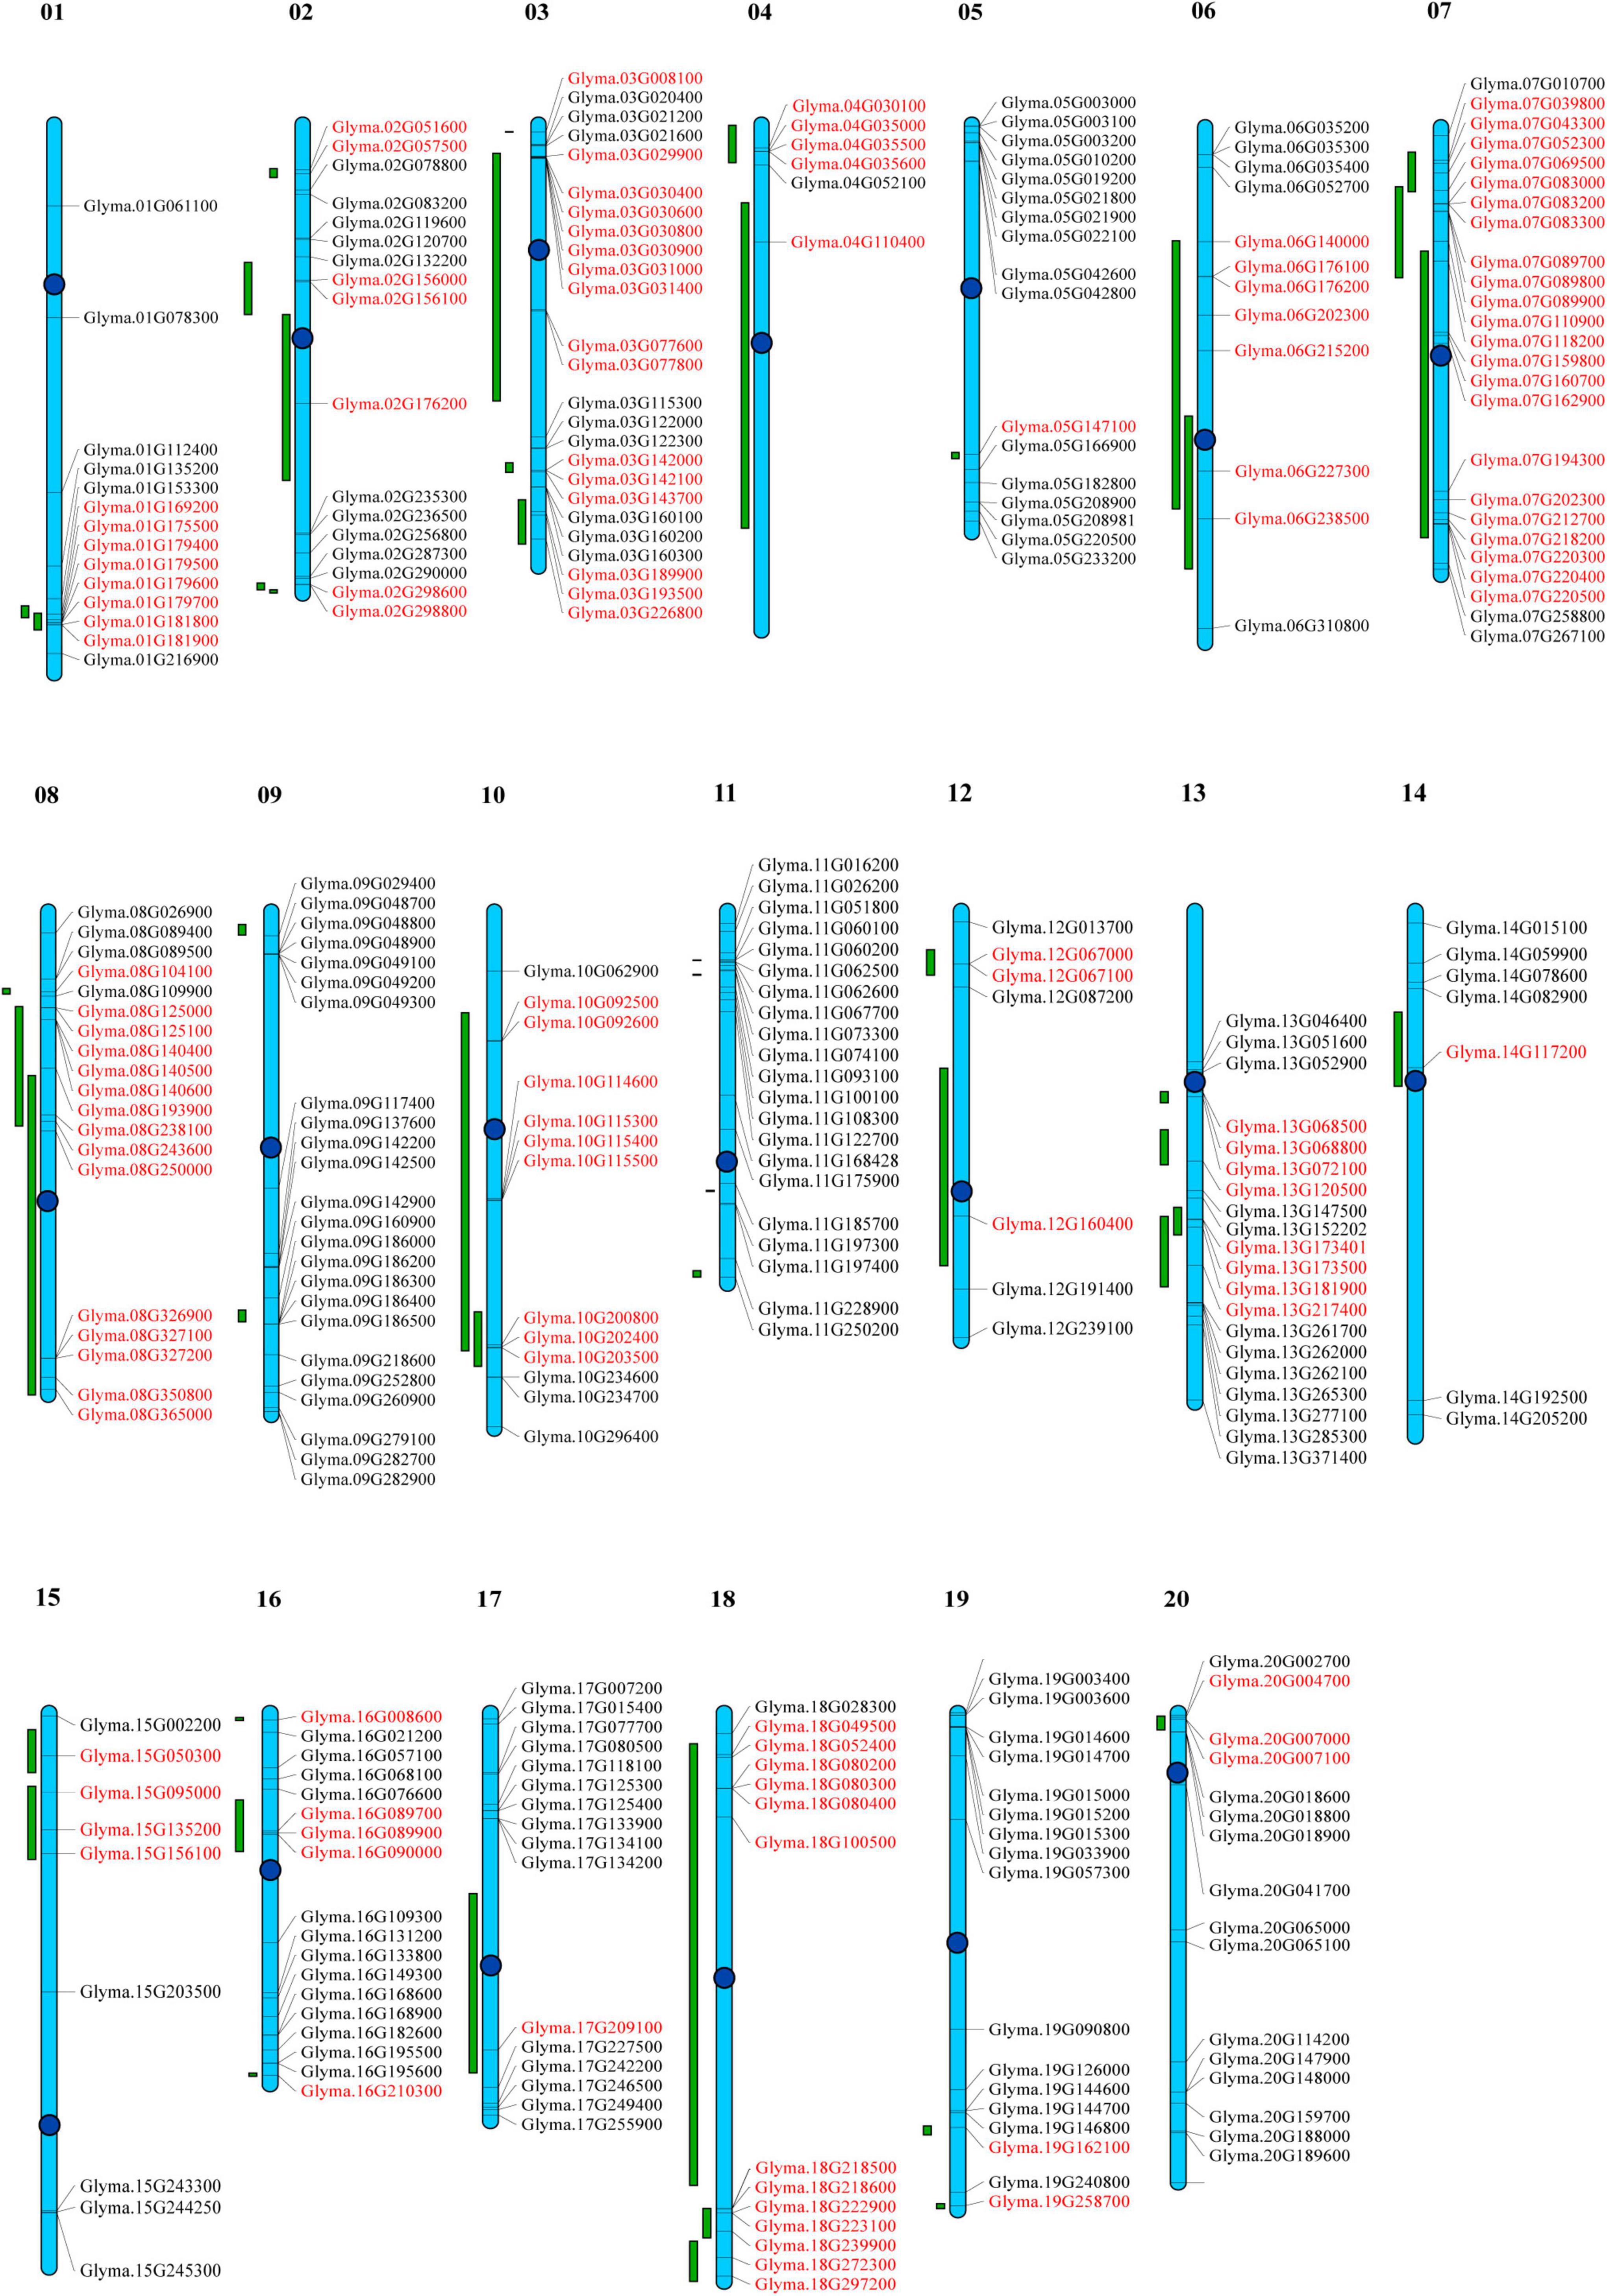
Figure 6. Distribution of all GmP450 genes in soybean chromosomes and quantitative trait loci (QTL) associated with resistance against Phytophthora sojae. Chromosomes are drawn to scale and chromosome numbers are indicated above each chromosomes. Centromeres are indicated by blue circles. Green bars indicate QTL regions associated with resistance against P. sojae. Candidate GmP450s within the QTL region are indicated in red.
Quantitative trait loci represent a region on a chromosome associated with a quantitative trait. Several biparental QTL have been reported for partial resistance to P. sojae. A search for QTL linked to P. sojae resistance identified 188 QTL reported by 20 independent studies. These QTL were mapped on the chromosomes and GmP450s located within the QTL was identified. Our results revealed that a total of 130 GmP450 genes map within the QTL regions identified for resistance against P. sojae (Supplementary Table 7). The QTL qHMPRR-5 on chromosome 7 contained the largest number of GmP450s with 11 genes. Even though chromosome 9 and 11 contained 24 and 21 GmP450s, respectively, none of them were found within the QTL regions. Genes within a QTL region with high phenotypic variance indicate their key role in major pathways. Our analysis revealed that QTL2-14 (Abeysekara et al., 2016), Phytoph1-2, Phytoph 2-2, Phytoph 3-2, Phytoph 4-2 (Burnham et al., 2003), Phytoph 6-2 and Phytoph 6-3 (Li et al., 2010) with a high phenotypic variance of 14.6, 15.9, 10.6, 15.9, 20.7, 21.98, and 27.98%, respectively, map on chromosome 2 that contain the genes Glyma.02G156000, Glyma.02G298600, Glyma.02G298800, and Glyma.02G156100 (CYP71), Glyma.02G176200 (CYP93) suggesting their possible role in resistance against P. sojae. Similarly, three major QTL Phytoph 2-1 (Burnham et al., 2003), Phytoph 12-1(Nguyen et al., 2012), and Phytoph14-2 (Lee et al., 2013) with 32.4, 35.8, and 16.1% phenotypic variance, respectively, mapped on chromosome 13 containing 7 GmP450s—Glyma.13G181900, Glyma.13G068500, and Glyma.13G068800 (CYP82), Glyma.13G072100 (CYP75), Glyma.13G173500, Glyma.13G173401 (CYP93), and Glyma.13G217400 (CYP710). Furthermore, three GmP450s (Glyma.15G095000, Glyma.15G135200, and Glyma.15G156100) on chromosome 15, Glyma.06G202300 on chromosome 6 and three GmP450s (Glyma.16G089700, Glyma.16G089900, and Glyma.16G090000) on chromosome 16, four GmP450s (Glyma.07G039800, Glyma.07G043300, Glyma.07G052300, and Glyma.07G069500) on chromosome 7 and one GmP450 (Glyma.19G258700) on chromosome 19 were mapped under major QTLs Phytoph 5-2 (Wu et al., 2011), Phytoph 6-7 (Li et al., 2010), Phytoph 8-1 (Tucker et al., 2010), QTL7-41 (Abeysekara et al., 2016), and qqQTL-19 (de Ronne et al., 2020), respectively (Supplementary Table 7 and Figure 6).
Expression Analysis of GmP450s Upon P. sojae Infection
To identify GmP450 genes that are induced upon P. sojae infection in soybean, we searched the publicly available high-throughput transcriptomic datasets for soybean–P. sojae interaction study. Our search identified 6 RNAseq bioprojects—PRJNA324419, PRJNA544432, PRJNA210431, PRJNA318321, PRJNA478334, and PRJNA574764 (Table 5). These datasets contained samples collected at different time points post-P. sojae infection from multiple soybean cultivars that are either resistant or susceptible to P. sojae. Two of the datasets, PRJNA478334 and PRJNA574764, were specific to the partial resistance. We included all 6 bioprojects in our analysis as the goal of the study was to identify GmP450s involved in resistance against P. sojae either Rps-mediated or quantitative. The fold change in transcript levels were calculated and genes up- or downregulated in response to P. sojae infection were identified. The analysis resulted in 101, 104, 93, 179, 78, and 253 differentially expressed GmP450s (≥2-fold change) in the datasets PRJNA324419, PRJNA544432, PRJNA210431, PRJNA318321, PRJNA478334, and PRJNA574764, respectively (Supplementary Table 1).
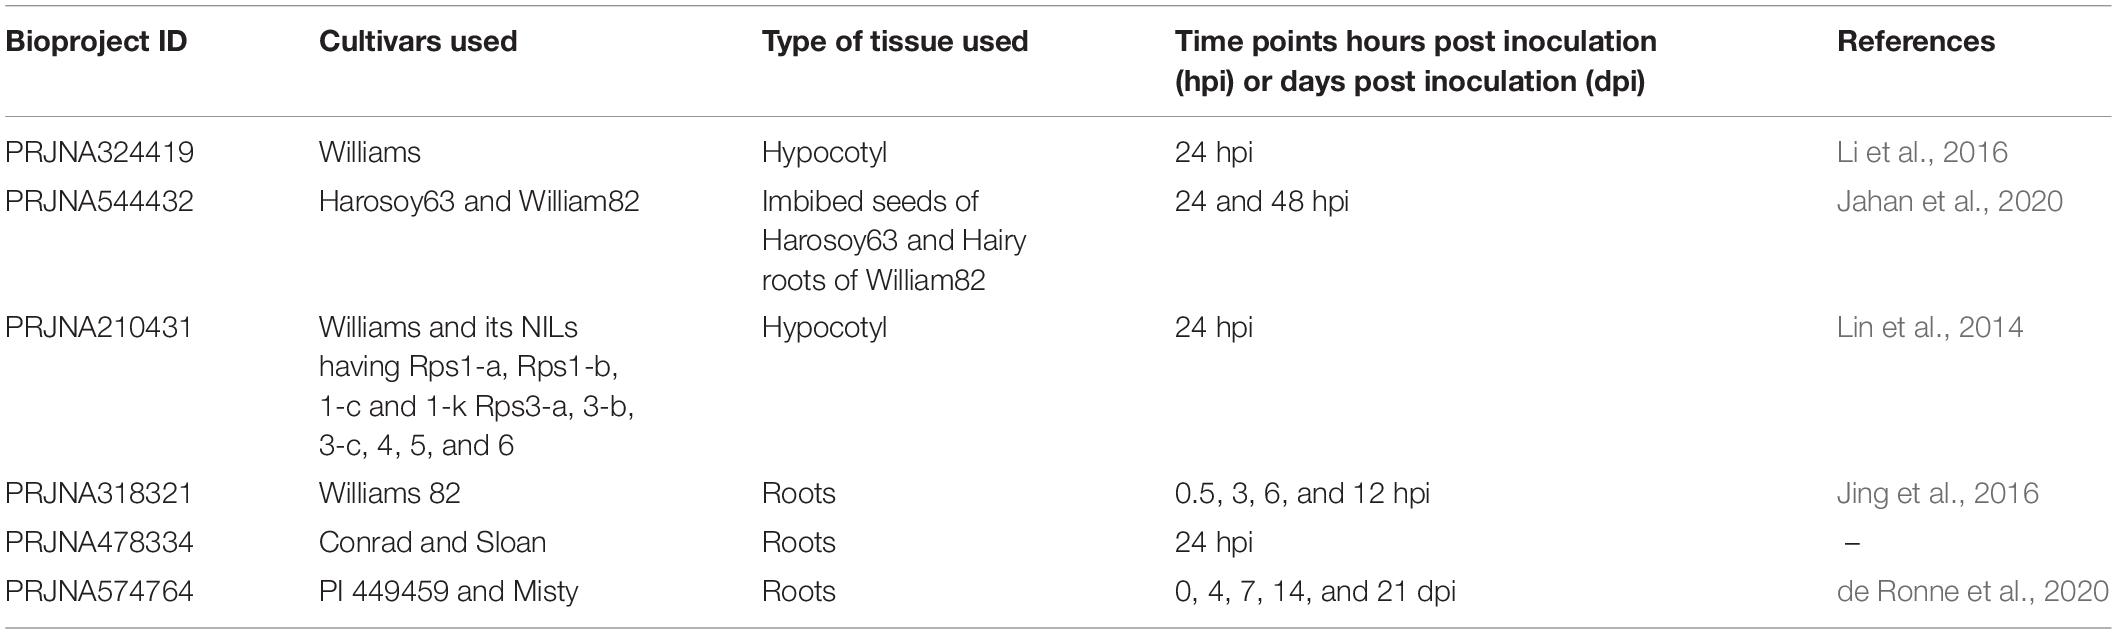
Table 5. List of high throughput transcriptome bioprojects used in the study.
As shown in Figure 7A, 21 GmP450s were differentially expressed in all six transcriptome datasets used in this study indicating a strong confidence in their role in resistance against P. sojae. Among all the DEGs, majority of them are predicted to function in the phenylpropanoid pathway. All the differentially expressed GmP450 genes were upregulated in response to P. sojae infection except for Glyma.01G061100 (study PRJNA318321, PRJNA324419, PRJNA574764, and PRJNA210431), Glyma.17G227500 (study PRJNA544432), Glyma.01G061100, Glyma.05G147100, and Glyma.17G227500 (study PRJNA478334), Glyma.03G142100 and Glyma.19G014600 (study PRJNA574764, Supplementary Table 1). Out of 21 GmP450 genes, CYP93, CYP81, and CYP82 families contained 4 each and CYP71 contained 3 GmP450s. Two members of CYP78 and one member each from the family CYP73, CYP76, CYP92, and CYP711 were found to be differentially expressed. Six of 21 differentially expressed GmP450s lie within the QTL associated with resistance to P. sojae where 2 genes (Glyma.13G173500 and Glyma.13G068800) have been functionally characterized (Supplementary Table 1). Glyma.13G173500 (CYP93) encodes for 2-hydroxyisoflavanone synthase (IFS2) involved in phytoalexin glyceollin biosynthesis (Steele et al., 1999) while Glyma.13G068800 (CYP82A3) is involved in jasmonic acid and ethylene signaling pathway (Yan et al., 2016). Our results uncovered the co-localization of differentially expressed GmP450s in response to P. sojae infection and the associated QTL suggesting their role in disease resistance. The differentially expressed GmP450 genes either unique in each dataset or common with other datasets used in this study are listed in Supplementary Table 1.
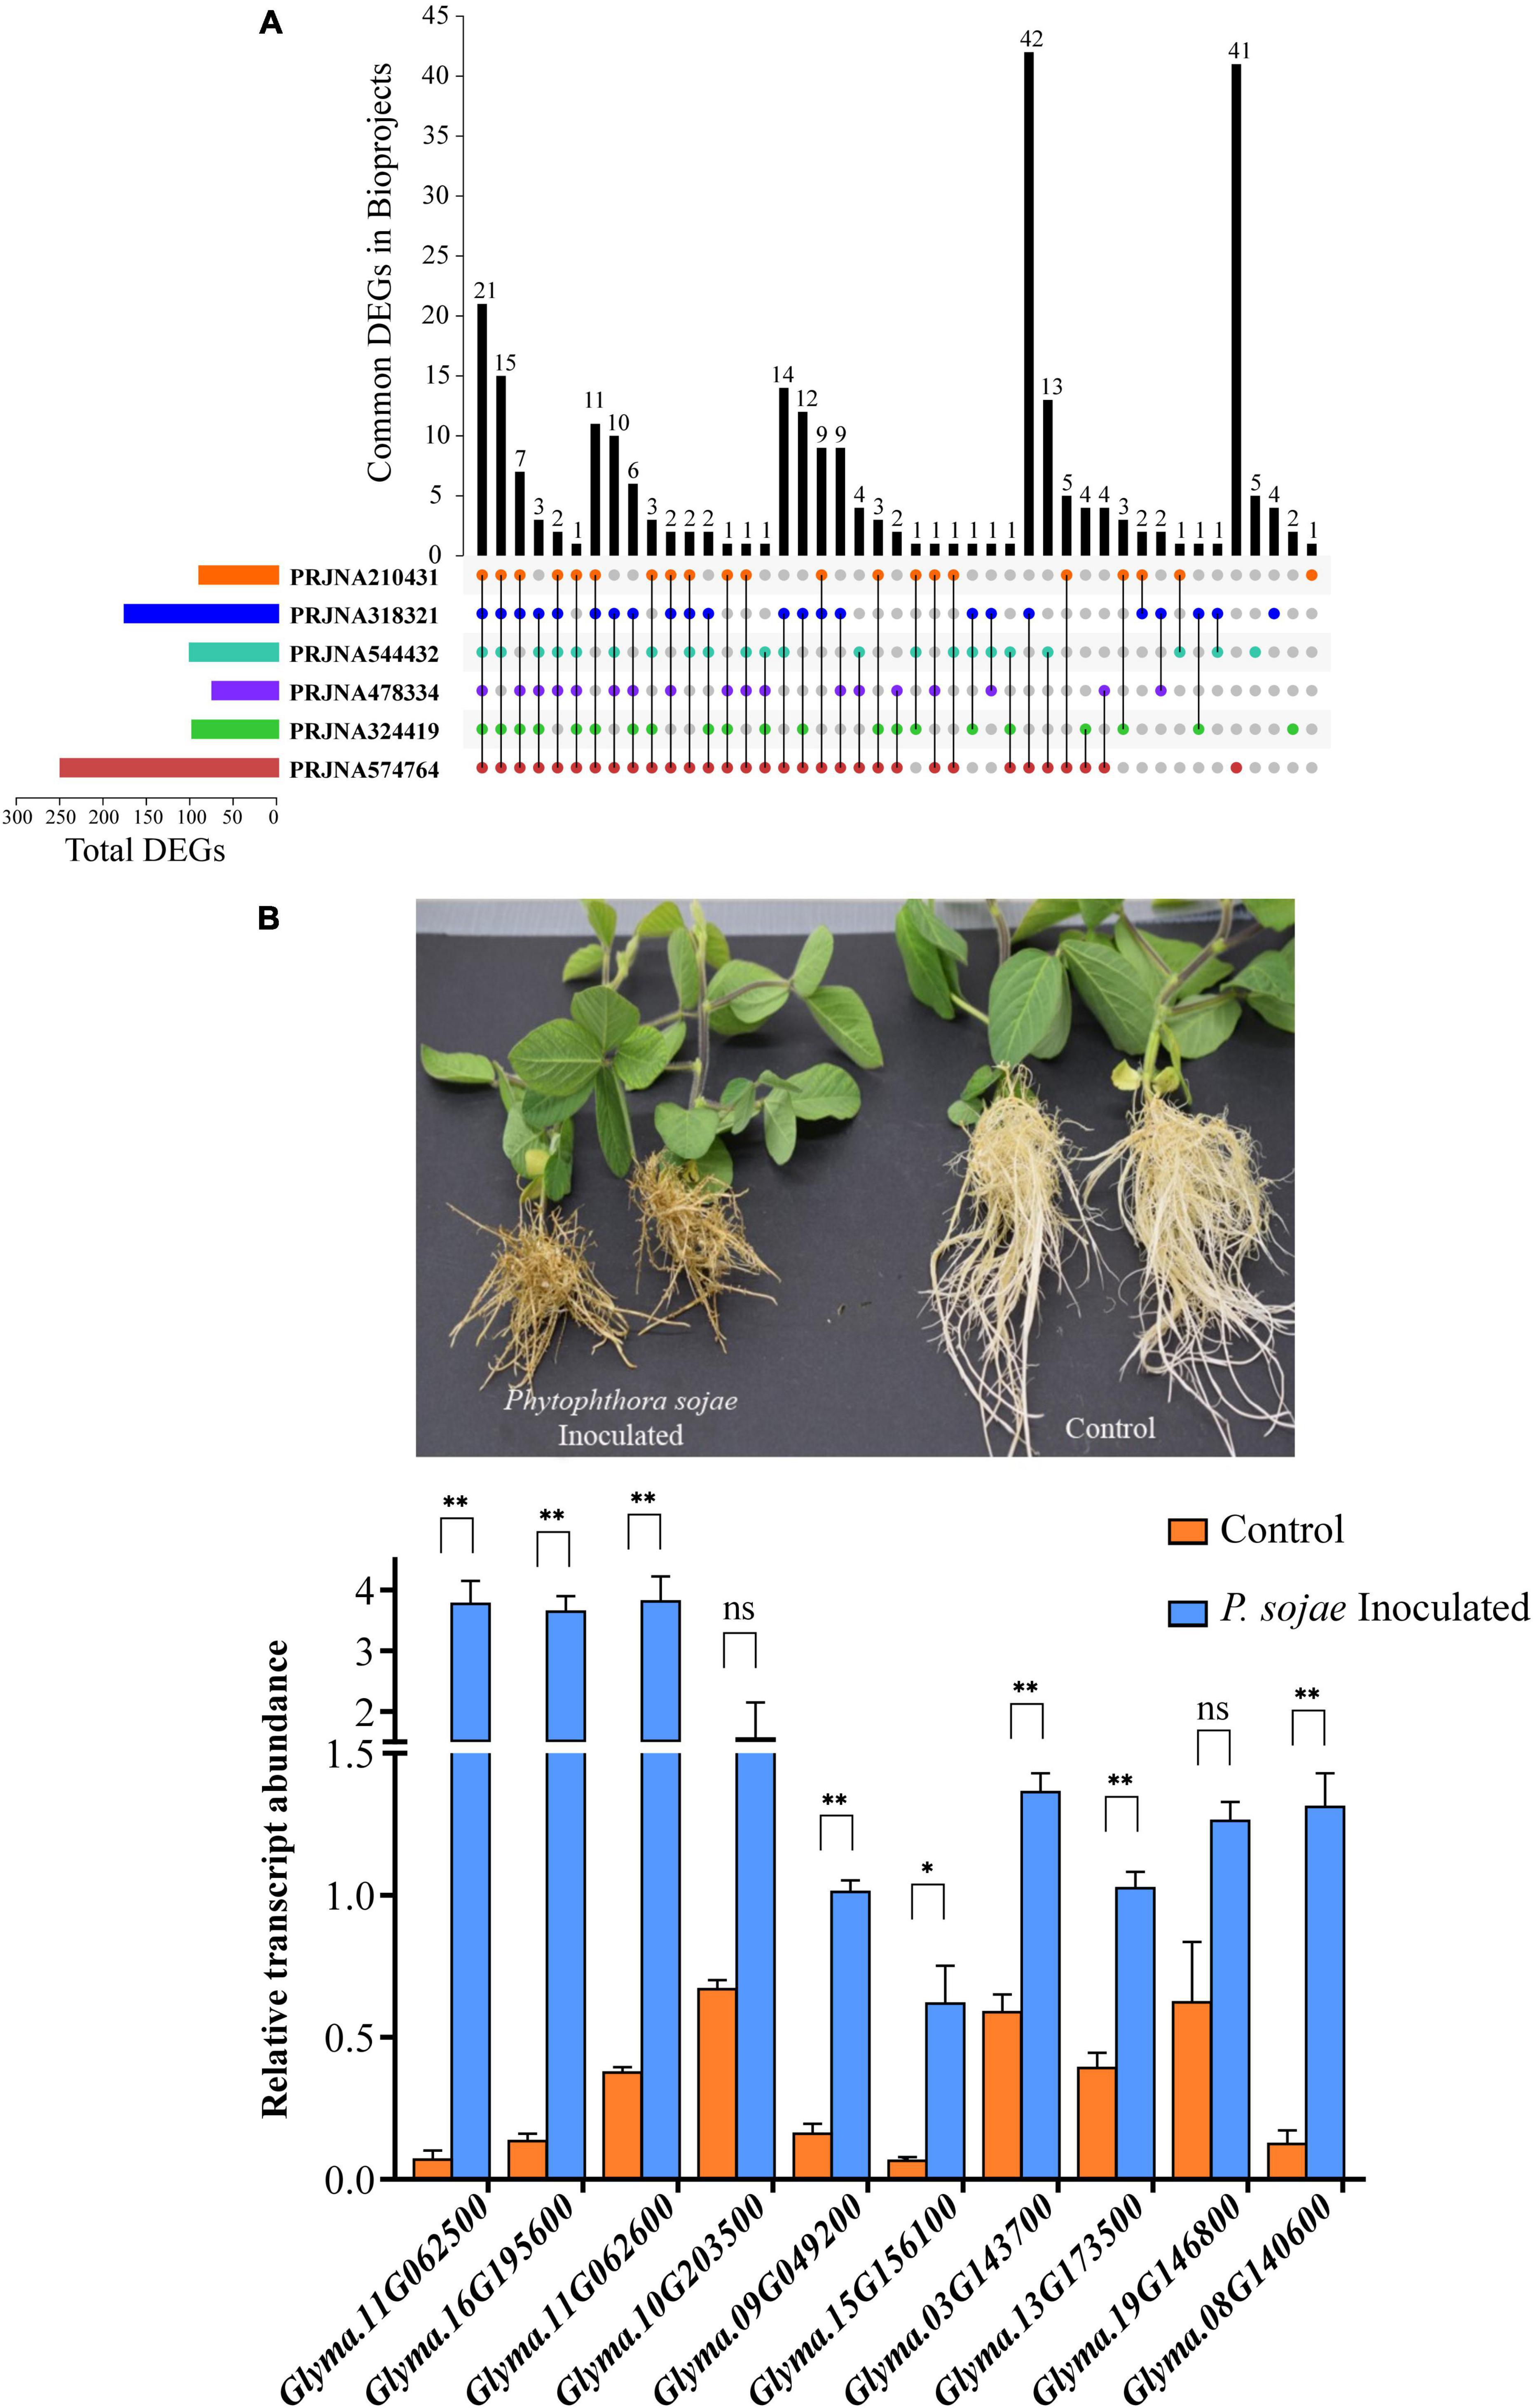
Figure 7. The expression analysis of GmP450 upon exposure to P. sojae. (A) An UpSet diagram depicting the expression of GmP450 genes that are common or unique in the bioprojects used in this study. RNAseq datasets on soybean–P. sojae interaction available in public domain (bioprojects: PRJNA324419, PRJNA544432, PRJNA210431, PRJNA318321, PRJNA478334, and PRJNA574764) were retrieved and differentially expressed GmP450s in each datasets were used in pair-wise overlap. A number of differentially expressed GmP450s upon P. sojae infection either unique to a dataset or common between the datasets are shown. (B) A photograph of soybean cv. Misty seedlings control (mock infected) or 21 days after P. sojae infection (top). The disease symptoms can be clearly seen on infected plant roots as brownish lesions. The bottom graph shows the expression analysis of ten GmP450 genes in soybean root tissues collected after 24 h of P. sojae infection. cDNA was synthesized from total RNA (1 μg) from P. sojae-infected and control soybean roots, and qPCR was performed using gene-specific primers. Expression values were normalized against the reference gene CONS4. The error bars represent the SEM of two biological replicates and three technical replicates for each biological replicate. Asterisks represent the significant differences with the control samples at p < 0.05 (*) or p < 0.01 (**). ns indicates not significant (p > 0.05).
From the list of 21 genes that were common in all the bioprojects, we selected 10 GmP450s (such as IFS2 and 3,9-dihydroxypterocarpan 6A-monooxygenase) for further validation using qRT-PCR. Soybean cultivar Misty was infected with a mix culture containing multiple races of P. sojae and samples were collected 24 h post-infection for gene expression analysis. The effect of P. sojae on soybean roots and overall plant growth is clearly visible in Figure 7B. Our qRT-PCR results were consistent with those found in the transcriptome studies and revealed a significant increase in gene expression upon P. sojae infection. Three candidates belonging to the CYP71 family (Glyma.11G062500, Glyma.11G062600, and Glyma.16G195600) showed greater than 10-fold change upon P. sojae infection whereas two CYP81 candidates showed a 9.35-fold (Glyma.15G156100) and a 6.3-fold (Glyma.09G049200) increase in their expression. Glyma.08G140600 (CYP736) expression was increased 10.5-fold in infected roots compared with control, whereas. A 2-fold increase in the expression of Glyma.10G203500 (CYP76) and Glyma.03G143700 and Glyma.13G17350 (CYP93) was observed upon P. sojae infection (Figure 7B and Supplementary Table 3). Even though a two times higher expression of Glyma.19G146800 (CYP93) and Glyma.10G203500 (CYP76) was observed in the infected roots compared with control, these differences were not statistically significant.
Co-expression Analysis of Differentially Expressed GmP450s in Response to P. sojae Infection
Genes involved in a similar function or common metabolic pathway showed similar expression profile and exhibited similar temporal and spatial expression. Therefore, to identify the GmP450s involved in the resistance against P. sojae, we developed a co-expression network using the normalized reads of differentially expressed GmP450 genes extracted from 6 publicly available transcriptomic datasets (Table 5). The co-expression network was developed using 85 GmP450s that showed differential expression in at least four transcriptomic datasets (Supplementary Table 8 and Figure 8). Out of 85 differentially expressed GmP450 genes, 38 were located in the QTL regions associated with P. sojae resistance. In addition, this list contained previously characterized genes with function in stress resistance, such as IFS2 (Glyma.13G173500) and 3,9-dihydroxypterocarpan 6A-monooxygenase (Glyma.03G143700). Subsequently, IFS2 and 3,9-dihydroxypterocarpan 6A-monooxygenase were selected as reference points to diffuse the genes directly connected to them. Both IFS2 and 3,9-dihydroxypterocarpan 6A-monooxygenase are involved in glyceollin biosynthesis, therefore, as expected, they are found positively correlated with each other in the co-expression network. A total of 12 and 13 genes were identified in the individual network of IFS2 and 3,9-dihydroxypterocarpan 6A-monooxygenase, respectively, that belonged to 6 different GmP450 families suggesting their role in phytoalexin synthesis in soybean (Figure 8). Furthermore, 3,9-dihydroxypterocarpan 6A-monooxygenase was found not only positively correlated with IFS2 but also with its 9 correlated partners and also with one member each of CYP93 (Glyma.19G146800) and CYP76 (Glyma.13G265300, Supplementary Table 8). Similarly, two members each of CYP71 (Glyma.11G062500 and Glyma.11G062600) and CYP82 (Glyma.13G285300 and Glyma.01G135200), three members each of CYP93 (Glyma.03G143700, Glyma.13G173401, and Glyma.07G202300), and CYP81 (Glyma.15G156100, Glyma.09G049200, and Glyma.09G048900) were found positively correlated while one member each of CYP76 (Glyma.10G200800) and CYP716 (Glyma.08G243600) was found negatively correlated with IFS2 in the co-expression analysis.
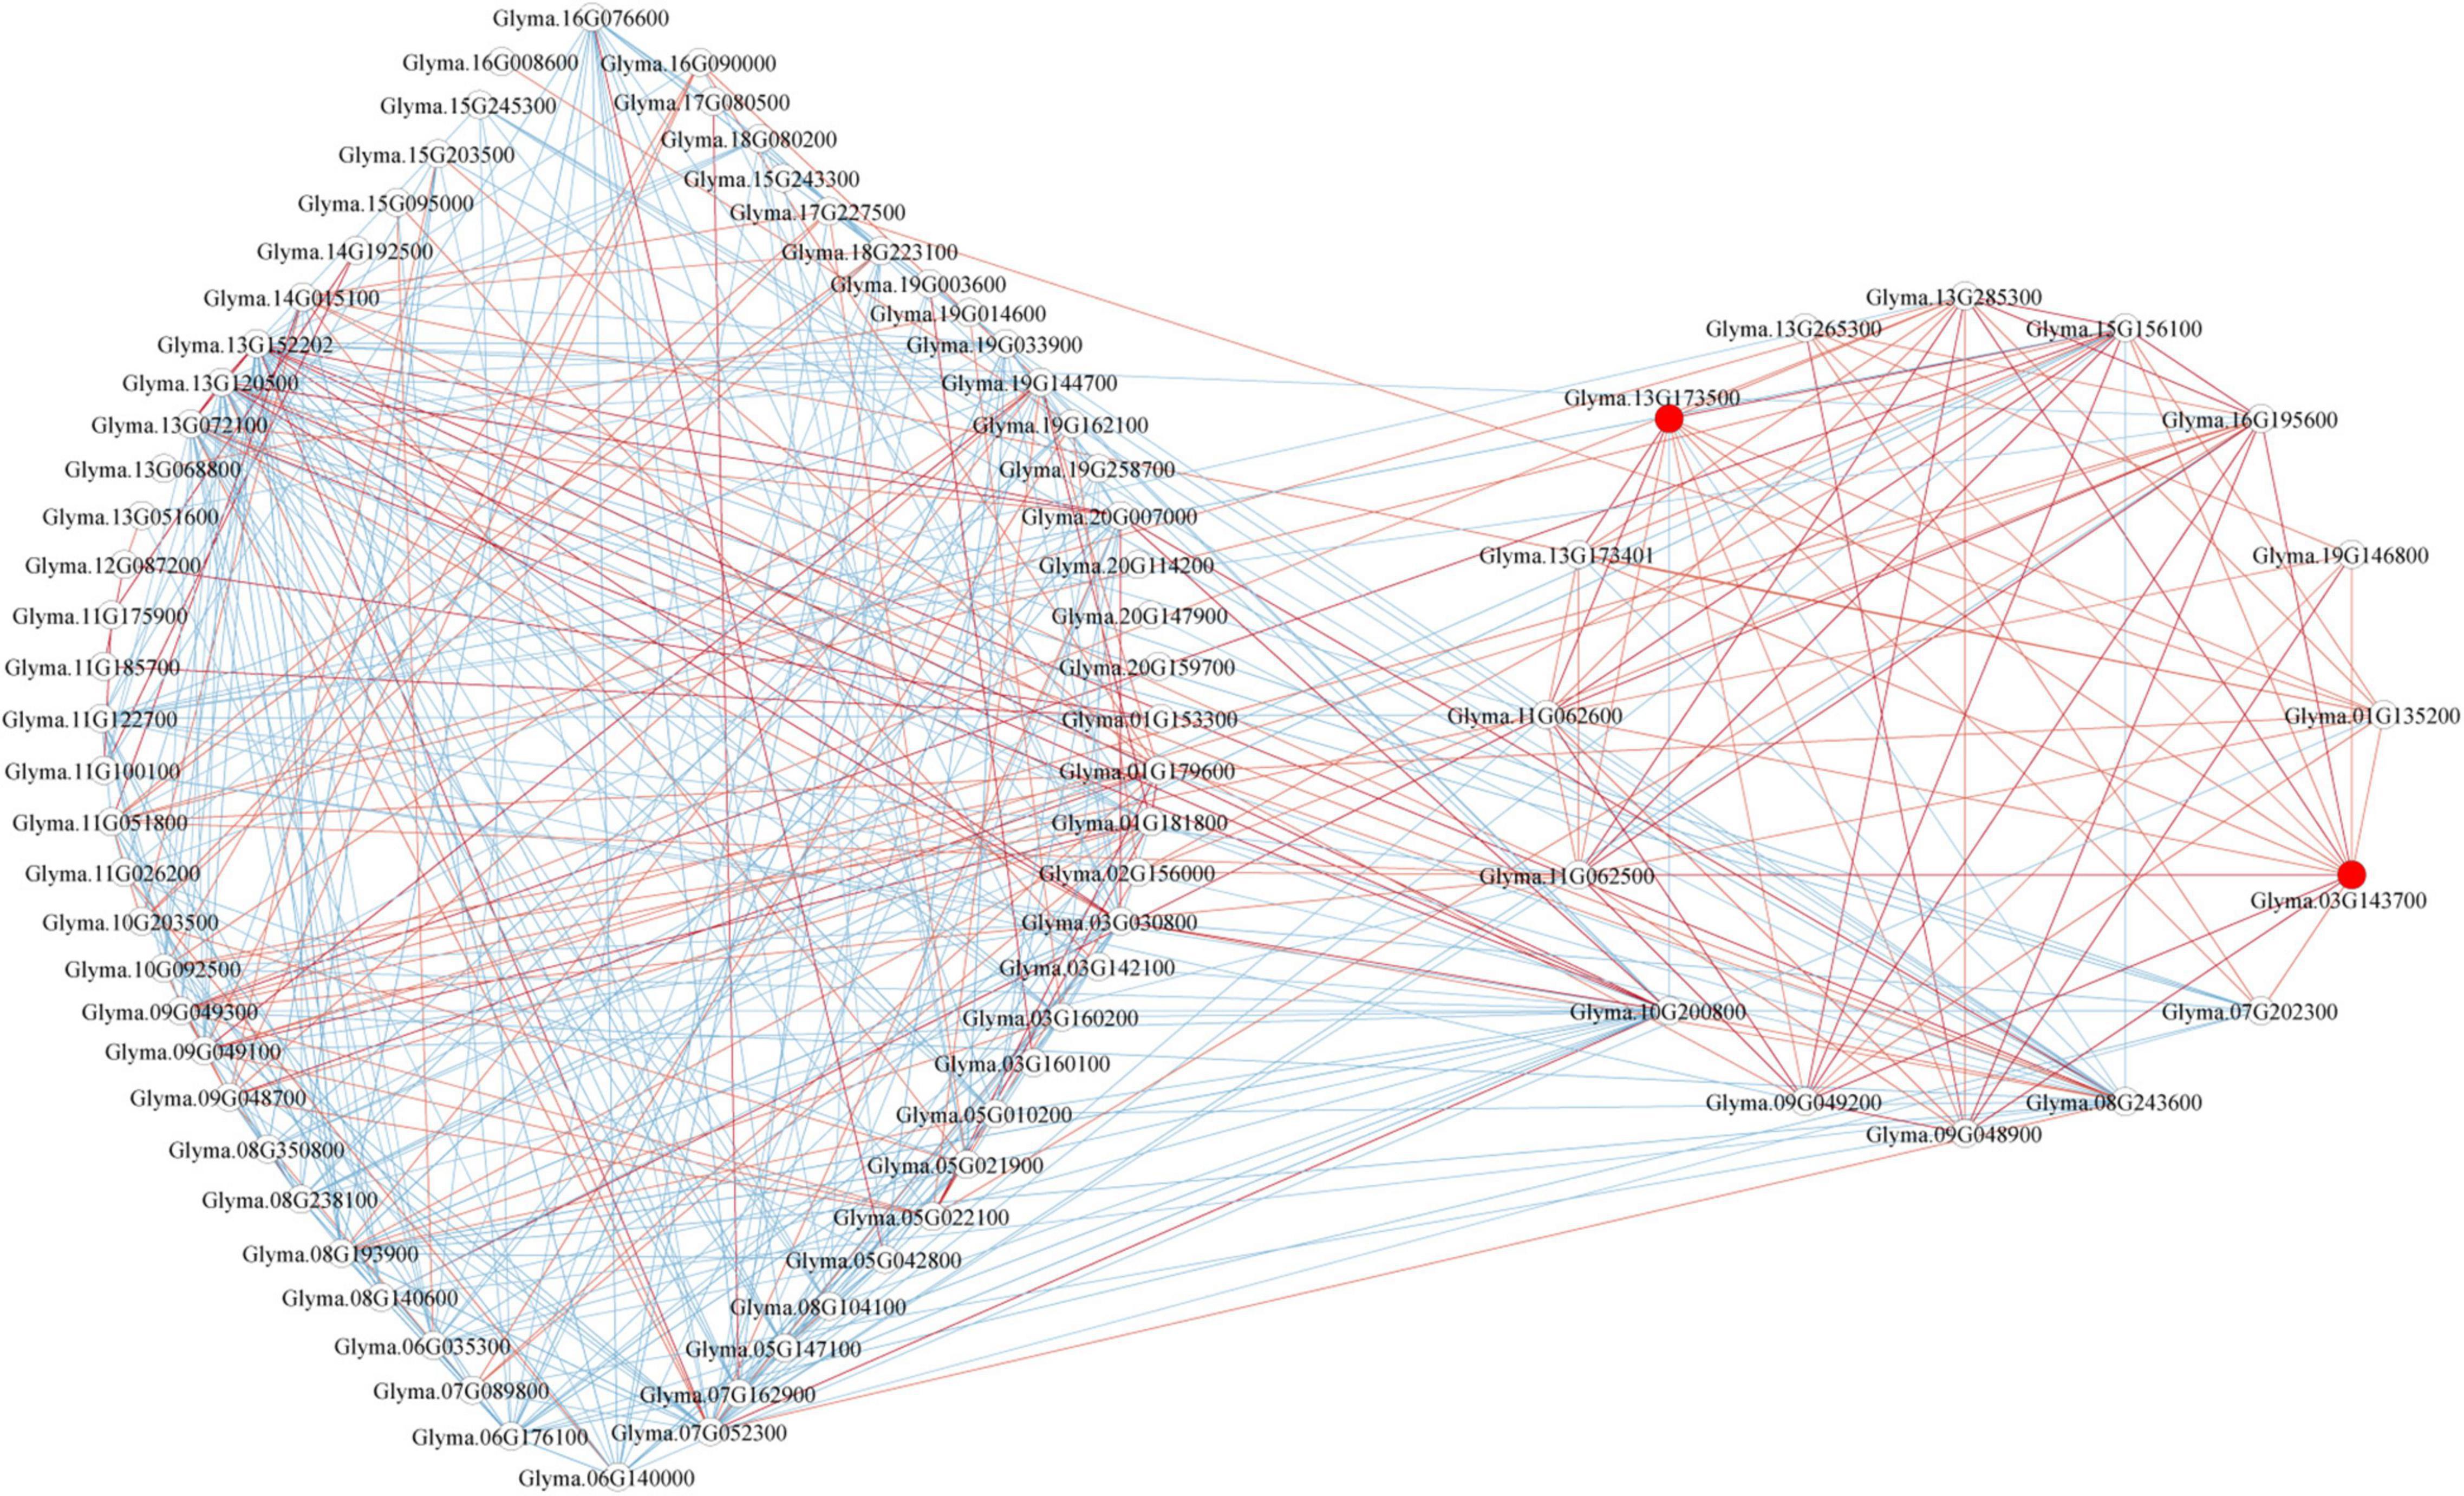
Figure 8. The co-expression network analysis of differentially expressed GmP450s in response to P. sojae infection. In total, 85 GmP450s differentially expressed in at least four transcriptomic studies were included in the analysis. Red and blue lines indicate positive and negative correlation, respectively. Red circles show IFS2 (Glyma.13G173500) and 3,9-dihydroxypterocarpan 6A-monooxygenase (Glyma.03G143700).
Next, we investigated the expression network of genes showing positive correlation with IFS2 and 3,9-dihydroxypterocarpan 6A-monooxygenase. The results revealed that the expression patterns of the 9 common genes within the IFS2 and 3,9-dihydroxypterocarpan 6A-monooxygenase network were positively correlated with each other. These findings strongly suggest that the genes in the IFS2 and 3,9-dihydroxypterocarpan 6A-monooxygenase co-expression network function in glyceollin biosynthesis in soybean.
Discussion
In this study, we carried out a comprehensive investigation of the P450 superfamily of proteins in soybean. The genes encoding GmP450 were analyzed for their exon-intron structures, chromosomal distribution, and tissue-specific and pathogen induced gene expressions. Here, we report that soybean genome contains 317 GmP450 genes that encode for 346 proteins of the P450 superfamily. The sequence variation observed within a conserved motif and distance between the two adjacent motifs in GmP450s are maintained within the members of a same family.
Soybean is a paleopolyploid with a genome size of 978 Mb. Although soybean has a smaller genome size compared with wheat and maize, and similar size as tomato (Supplementary Table 9), it contains larger number of P450 genes and CYP families. The discrepancy observed in the number of genes in some plant species listed in Supplementary Table 9 is due to the inclusion of P450s with less than 400 amino acid residues. A comparative analysis of genome size and the number of P450 genes in multiple plant species suggests no direct association between genome size and P450 gene number and that the number of P450s possibly depends on their functional diversity and physiological architecture. The number of P450 families and genes in each family also varies in different species. In Arabidopsis, 9 clans and 47 families are reported (Bak et al., 2011), while we found 10 clans and 48 families in soybean. Several earlier studies have reported the loss of some plant P450 families and gain of others (Nelson et al., 2004; Li and Wei, 2020). Similar changes are observed in soybean P450s. The loss, gain, or modification of a pre-existing molecular function leads to an adaptive evolution under a particular situation (Behe, 2010). For example: CYP92, CYP736, CYP728, CYP733, and CYP727 families are absent in Arabidopsis while present in soybean. On the other hand, CYP702, CYP705, CYP708, and CYP709 are absent in soybean and present in Arabidopsis (Supplementary Figure 1). P450s belonging to CYP92 and CYP736 families participate in homoterpene biosynthesis in maize (Richter et al., 2016) and phytoalexin biosynthesis in apple (Sircar et al., 2015), respectively. The presence of new families in soybean signifies their role in the synthesis of new compound(s) to sustain plant adaptive mechanism. CYP707 in tomato (Ji et al., 2014) and CYP88 in rice and Arabidopsis (Helliwell et al., 2001; Chhun et al., 2007) are reported in GA and ABA biosynthesis, respectively. In soybean, CYP722 and CYP733 clades are found closer to CYP707 and CYP88 suggesting their roles in hormone biosynthesis. However, genes belonging to the families CYP722 and CYP733 contain larger number of introns compared with the genes in CYP707 and CYP88 pointing toward the diversification of their roles possibly by duplication events.
Despite a substantial variation in GmP450 sequences, they contain a conserved P450 fold with 5 conserved motifs separated by variable regions. While the conserved motifs serve as signatures for protein function, the significance of variable regions have not been much explored. In aquaporins, a precise spacing between two NPA domains is critical for its function (Deshmukh et al., 2015). Interestingly, a specific spacing between oxygen binding and K-helix motifs, and K-helix and PXRX motifs was observed in GmP450 belonging to the same family (Tables 3, 4). The implication of the exact number of amino acids between the two motifs in GmP450 is not yet understood as this characteristic of P450 was never reported before, therefore, requires further experimental verifications. However, we speculate that it contributes to the protein folding and formation of catalytic cavities that facilitates protein–protein or protein–ligand interactions.
Plant P450s participate in the catalytic conversion of biological compounds in a plethora of metabolic pathways, such as the biosynthesis of terpenoid, alkaloid, phenylpropanoids, hormone, and xenobiotics (Nelson, 2009). These natural compounds and other defense-related proteins are produced by plants to protect them from the unfavorable conditions. Arabidopsis produces phytoalexin camalexin in response to the biotic and abiotic stress (Lemarie et al., 2015), while maize and cabbage synthesize zealexin (Mao et al., 2016) and cyclobrassinin (Klein and Sattely, 2015), respectively. The key P450 families participating in these phytoalexin biosynthesis belong to CYP71. Similarly, phytohormones, such as brassinosteroid, jasmonic acid, ABA, and GA also provide defense against biotic and abiotic stress (Bulgakov et al., 2019; Kohli et al., 2019; Yang et al., 2019; Wang et al., 2020) and involve P450 enzymes for their biosynthesis. The production of phytoalexin glyceollins upon exposure of soybean to environmental challenges has been long known. Silencing of IFS or chalcone reductase genes led to 90% reduction in the synthesis of glyceollin and its precursor daidzein, and suppressed hypersensitive reaction cell death leading to the loss of resistance to P. sojae (Graham et al., 2007). Incorporation of strong partial resistance in new elite cultivars together with the introgression of R genes has become a new strategy for soybean breeders to improve resistance against P. sojae. Partial resistance is a quantitative trait defined by a complex network that potentially include multiple mechanisms acting together or independently in a very tightly coordinated manner (Dorrance, 2018). Many QTL associated with partial resistance against P. sojae have been identified in soybean (Supplementary Table 7). These QTL either contain many loci across soybean genome that is associated with moderate to highly heritable resistance or with major QTL with one locus contributing to the phenotypic variance. Our effort here is to integrate multiple approaches toward identifying the sources of resistant GmP450 allele in soybean against P. sojae.
Host resistance for a wide range of pathogens could be achieved by gene pyramiding. The regulatory pathways involved in the induction of phytoalexins are complex. The biosynthesis of camalexin has been shown to be affected by jasmonic acid (Rowe et al., 2010) and salicylic acid (Nawrath and Métraux, 1999) signaling pathways. Since P450s catalyze the key steps in the de novo synthesis of phytohormones and glyceollins in soybean, the GmP450s that are induced upon P. sojae infection and are identified in the co-expression analysis that co-localize with a QTL associated P. sojae resistance could be the candidates for gene pyramiding to obtain durable resistance. Both IFS2 and 3,9-dihydroxypterocarpan 6A-monooxygenase are involved in the glyceollin biosynthesis and co-expressed with each other along with several other uncharacterized GmP450s. Furthermore, some of these GmP450 genes are located in the QTL regions reported for soybean resistance against P. sojae. Downstream of isoflavone aglycones synthesis reaction catalyzed by IFS, glyceollin biosynthesis involves at least additional 3 steps catalyzed by P450. The GmP450 genes identified in our co-expression analysis are the strong candidates for functional characterization.
Conclusion
Despite that the whole genome sequence of soybean was available since 2010 and the importance of P450s in plant metabolic pathways has been known for decades, only a handful of P450s have been functionally characterized in soybean thus far (Supplementary Table 10). Here, we identified 346 GmP450s in soybean and demonstrated for the first time that the exact length of variable region between two conserve motifs is preserved within the members of a P450 family, and speculate its possible association with protein function. The findings of the present CYPome study not only paves the way for the functional verification of GmP450s involved in soybean resistance to P. sojae, but also provides a well-annotated catalog of the P450s in soybean with novel insights into the functions of other GmP450s, their involvement in metabolic pathways that could be utilized for soybean breeding to improve economically important traits.
Data Availability Statement
The original contributions presented in the study are included in the article/Supplementary Material, further inquiries can be directed to the corresponding author.
Author Contributions
PK contributed to experimental design, collected and analyzed data, and prepared draft manuscript. OW performed soybean-P. sojae interaction experiment. IR contributed to manuscript preparation. SD conceived and designed the experiments, supervised all aspects of the project, and prepared the final draft manuscript. All authors contributed to the article and approved the submitted version.
Funding
This research was supported by the Agriculture and Agri-Food Canada’s Abase grant (J-002364) and the ASC-09 Soybean Cluster Activity #7A (J-002060) to SD.
Conflict of Interest
The authors declare that the research was conducted in the absence of any commercial or financial relationships that could be construed as a potential conflict of interest.
Publisher’s Note
All claims expressed in this article are solely those of the authors and do not necessarily represent those of their affiliated organizations, or those of the publisher, the editors and the reviewers. Any product that may be evaluated in this article, or claim that may be made by its manufacturer, is not guaranteed or endorsed by the publisher.
Acknowledgments
The authors thank Kuflom Kuflu (London Research and Development Centre, AAFC) for technical assistance.
Supplementary Material
The Supplementary Material for this article can be found online at: https://www.frontiersin.org/articles/10.3389/fpls.2022.862314/full#supplementary-material
Supplementary Figure 1 | Phylogenetic analysis of putative GmP450. Amino acid sequences of 346 GmP450s along with Arabidopsis P450s and other previously characterized P450s from other plant species were aligned in ClustalO and a phylogenetic tree was constructed using a maximum likelihood method in IQTREE2 with best fit model JTT + F + I + G4 with a bootstrap value set to 1,000. The categorization of GmP450s into specific CYP family and clan was based on their grouping with the known P450s. Inner circle indicates GmP450 families while outer circle denotes clans. GmP450 families are shown by different colors for better visualization. At, Arabidopsis thaliana; Aa, Anthurium amnicola; As, Apostasia shenzhenica; Bv, Beta vulgaris; Ca, Cicer arietinum; Cr, Catharanthus roseus; CXC, Crocosmia × crocosmiiflora (montbretia); Ec, Eucalyptus cladocalyx; Ee, Eustoma exaltatum; Ga, Gossypium arboretum; Ge, Glycyrrhiza echinata; Gm, Glycine max; Gu, Glycyrrhiza uralensis; Hc, Hibiscus cannabinus; Ht, Helianthus tuberosus; Lj, Lotus japonicas; Md, Malus domestica; Me, Manihot esculenta; Mt, Medicago truncatula; Na, Narcissus aff. pseudonarcissus; Nf, Nothapodytes foetida; Os, Oryza sativa; Pg, Panax ginseng; Ph, Petunia hybrid; Pm, Prunus mume; Ps, Papaver somniferum; Pt, Pinus taeda; Sa, Sorbus aucuparia; Sb, Sorghum bicolor; Sl, Solanum lycopersicum; Sm, Salvia miltiorrhiza; Sw, Swertia mussotii; Va, Vitex agnus-castus; Vs, Vicia sativa; Vv, Vitis vinifera; Zm, Zea mays.
Supplementary Figure 2 | (A) The tissue-specific expression of A-type GmP450 genes with their fragments per kilobase of million (FPKM) map reads. Reads were normalized and scaled within a scale of −3 to +3. Individual FPKM values are mentioned in each cell. (B) Tissue-specific expression of non A-type GmP450 genes with their FPKM map reads. Reads were normalized and scaled within a scale of −3 to +3. Individual FPKM values are mentioned in each cell.
Supplementary Table 1 | Differentially expressed GmP450 genes upon Phytophthora sojae infection.
Supplementary Table 2 | Oligonucleotide sequences used for quantitative real-time PCR (qRT-PCR) analysis of selected soybean GmP450s.
Supplementary Table 3 | RNA gel picture and qRT-PCR raw data.
Supplementary Table 4 | Identification of GmP450s. Basic local alignment search tool (BLAST) output and characteristics of putative GmP450s.
Supplementary Table 5 | The detailed analysis of conserved P450 motifs in GmP450s.
Supplementary Table 6 | Distribution of GmP450 genes in soybean chromosomes.
Supplementary Table 7 | A list of quantitative trait loci (QTL) identified in soybean–P. sojae interactions and GmP450s within the QTL.
Supplementary Table 8 | Co-expression analysis of differentially expressed GmP450 genes upon P. sojae infection.
Supplementary Table 9 | A list of genome-wide study of P450s in plant species.
Supplementary Table 10 | A list of characterized P450s in soybean.
Footnotes
- ^ https://soycanada.ca/statistics/at-a-glance/
- ^ https://soybase.org/
- ^ https://drnelson.uthsc.edu/arabidopsis/
- ^ http://pfam.xfam.org/family/PF00067
- ^ https://phytozome-next.jgi.doe.gov/
- ^ https://web.expasy.org/compute_pi
- ^ http://iqtree.cibiv.univie.ac.at/
- ^ https://www.soybase.org/search/qtllist_by_symbol.php
- ^ http://www.clcbio.com/products/clc-genomics-workbench/
- ^ https://phytozome-next.jgi.doe.gov/info/Gmax_Wm82_a4_v1
References
Abeysekara, N. S., Matthiesen, R. L., Cianzio, S. R., Bhattacharyya, M. K., and Robertson, A. E. (2016). Novel sources of partial resistance against Phytophthora sojae in soybean PI 399036. Crop Sci. 56, 2322–2335. doi: 10.2135/cropsci2015.09.0578
Almagro Armenteros, J. J., Sønderby, C. K., Sønderby, S. K., Nielsen, H., and Winther, O. (2017). DeepLoc: prediction of protein subcellular localization using deep learning. Bioinformatics 33, 4049–4049. doi: 10.1093/bioinformatics/btx548
Ayabe, S-i., and Akashi, T. (2006). Cytochrome P450s in flavonoid metabolism. Phytochem. Rev. 5, 271–282. doi: 10.1007/s11101-006-9007-3
Bak, S., Beisson, F., Bishop, G., Hamberger, B., Höfer, R., Paquette, S., et al. (2011). Cytochromes P450. Arabidopsis Book 9:e0144.
Behe, M. J. (2010). Experimental evolution, loss-of-function mutations, and “the first rule of adaptive evolution”. Q. Rev. Biol. 85, 419–445. doi: 10.1086/656902
Bennett, R. N., and Wallsgrove, R. M. (1994). Secondary metabolites in plant defence mechanisms. New Phytol. 127, 617–633. doi: 10.1111/j.1469-8137.1994.tb02968.x
Budde, M., Morr, M., Schmid, R. D., and Urlacher, V. B. (2006). Selective hydroxylation of highly branched fatty acids and their derivatives by CYP102A1 from Bacillus megaterium. ChemBioChem 7, 789–794. doi: 10.1002/cbic.200500444
Bulgakov, V. P., Wu, H.-C., and Jinn, T.-L. (2019). Coordination of ABA and chaperone signaling in plant stress responses. Trends Plant Sci. 24, 636–651. doi: 10.1016/j.tplants.2019.04.004
Burnham, K. D., Dorrance, A. E., VanToai, T. T., and St. Martin, S. K. (2003). Quantitative trait loci for partial resistance to Phytophthora sojae in soybean. Crop Sci. 43, 1610–1617.
Chang, Z., Wang, X., Wei, R., Liu, Z., Shan, H., Fan, G., et al. (2018). Functional expression and purification of CYP93C20, a plant membrane-associated cytochrome P450 from Medicago truncatula. Protein Expr. Purif. 150, 44–52. doi: 10.1016/j.pep.2018.04.017
Chen, C., Chen, H., Zhang, Y., Thomas, H. R., Frank, M. H., He, Y., et al. (2020). TBtools: an integrative toolkit developed for interactive analyses of big biological data. Mol. Plant 13, 1194–1202. doi: 10.1016/j.molp.2020.06.009
Chhun, T., Aya, K., Asano, K., Yamamoto, E., Morinaka, Y., Watanabe, M., et al. (2007). Gibberellin regulates pollen viability and pollen tube growth in rice. Plant Cell 19, 3876–3888. doi: 10.1105/tpc.107.054759
Danielson, P. B. (2002). The cytochrome P450 superfamily: biochemistry, evolution and drug metabolism in humans. Curr. Drug Metab. 3, 561–597. doi: 10.2174/1389200023337054
de Ronne, M., Labbe, C., Lebreton, A., Sonah, H., Deshmukh, R., Jean, M., et al. (2020). Integrated QTL mapping, gene expression and nucleotide variation analyses to investigate complex quantitative traits: a case study with the soybean-Phytophthora sojae interaction. Plant Biotechnol. J. 18, 1492–1494. doi: 10.1111/pbi.13301
Deshmukh, R. K., Vivancos, J., Ramakrishnan, G., Guérin, V., Carpentier, G., Sonah, H., et al. (2015). A precise spacing between the NPA domains of aquaporins is essential for silicon permeability in plants. Plant J. 83, 489–500. doi: 10.1111/tpj.12904
Dorrance, A. E. (2018). Management of Phytophthora sojae of soybean: a review and future perspectives. Can. J. Plant Pathol. 40, 210–219. doi: 10.1080/07060661.2018.1445127
Dorrance, A. E., Berry, S. A., Anderson, T. R., and Meharg, C. (2008). Isolation, storage, pathotype characterization, and evaluation of resistance for Phytophthora sojae in soybean. Plant Health Prog. 9:35. doi: 10.1094/PHP-2008-0118-01-DG
Dorrance, A. E., Kurle, J., Robertson, A. E., Bradley, C. A., Giesler, L., Wise, K., et al. (2016). Pathotype diversity of Phytophthora sojae in eleven states in the United States. Plant Dis. 100, 1429–1437. doi: 10.1094/pdis-08-15-0879-re
Durst, F., and Nelson, D. R. (1995). Diversity and evolution of plant P450 and P450-reductases. Drug Metab. Drug Interact. 12, 189–206. doi: 10.1515/dmdi.1995.12.3-4.189
Eriksson, S., Stransfeld, L., Adamski, N. M., Breuninger, H., and Lenhard, M. (2010). KLUH/CYP78A5-Dependent growth signaling coordinates floral organ growth in Arabidopsis. Curr. Biol. 20, 527–532. doi: 10.1016/j.cub.2010.01.039
Fang, W., Wang, Z., Cui, R., Li, J., and Li, Y. (2012). Maternal control of seed size by EOD3/CYP78A6 in Arabidopsis thaliana. Plant J. 70, 929–939. doi: 10.1111/j.1365-313X.2012.04907.x
Frear, D. S., Swanson, H. R., and Tanaka, F. S. (1969). N-demethylation of substituted 3-(phenyl)-1-methylureas: isolation and characterization of a microsomal mixed function oxidase from cotton. Phytochemistry 8, 2157–2169. doi: 10.1016/s0031-9422(00)88175-3
Graham, T. L., Graham, M. Y., Subramanian, S., and Yu, O. (2007). RNAi silencing of genes for elicitation or biosynthesis of 5-deoxyisoflavonoids suppresses race-specific resistance and hypersensitive cell death in Phytophthora sojae infected tissues. Plant Physiol. 144, 728–740. doi: 10.1104/pp.107.097865
Guo, A. Y., Zhu, Q. H., Chen, X., and Luo, J. C. (2007). [GSDS: a gene structure display server]. Yi Chuan 29, 1023–1026. doi: 10.1360/yc-007-1023
Guttikonda, S. K., Trupti, J., Bisht, N. C., Chen, H., An, Y. Q., Pandey, S., et al. (2010). Whole genome co-expression analysis of soybean cytochrome P450 genes identifies nodulation-specific P450 monooxygenases. BMC Plant Biol. 10:243. doi: 10.1186/1471-2229-10-243
Helliwell, C. A., Chandler, P. M., Poole, A., Dennis, E. S., and Peacock, W. J. (2001). The CYP88A cytochrome P450, ent-kaurenoic acid oxidase, catalyzes three steps of the gibberellin biosynthesis pathway. Proc. Natl. Acad. Sci. U.S.A. 98, 2065–2070. doi: 10.1073/pnas.98.4.2065
Jahan, M. A., Harris, B., Lowery, M., Infante, A. M., Percifield, R. J., and Kovinich, N. (2020). Glyceollin transcription factor GmMYB29A2 regulates soybean resistance to Phytophthora sojae. Plant Physiol. 183, 530–546. doi: 10.1104/pp.19.01293
Jeandet, P. (2015). Phytoalexins: current progress and future prospects. Molecules (Basel, Switzerland) 20, 2770–2774. doi: 10.3390/molecules20022770
Ji, K., Kai, W., Zhao, B., Sun, Y., Yuan, B., Dai, S., et al. (2014). SlNCED1 and SlCYP707A2: key genes involved in ABA metabolism during tomato fruit ripening. J. Exp. Bot. 65, 5243–5255. doi: 10.1093/jxb/eru288
Jing, M., Guo, B., Li, H., Yang, B., Wang, H., Kong, G., et al. (2016). A Phytophthora sojae effector suppresses endoplasmic reticulum stress-mediated immunity by stabilizing plant binding immunoglobulin proteins. Nat. Commun. 7:11685. doi: 10.1038/ncomms11685
Jiu, S., Xu, Y., Wang, J., Wang, L., Liu, X., Sun, W., et al. (2020). The cytochrome P450 monooxygenase inventory of grapevine (Vitis vinifera L.): genome-wide identification, evolutionary characterization and expression analysis. Front. Genet. 11:44. doi: 10.3389/fgene.2020.00044
Jung, W., Yu, O., Lau, S. M., O’Keefe, D. P., Odell, J., Fader, G., et al. (2000). Identification and expression of isoflavone synthase, the key enzyme for biosynthesis of isoflavones in legumes. Nat. Biotechnol. 18, 208–212. doi: 10.1038/72671
Kalyaanamoorthy, S., Minh, B. Q., Wong, T. K. F., von Haeseler, A., and Jermiin, L. S. (2017). ModelFinder: fast model selection for accurate phylogenetic estimates. Nat. Methods 14, 587–589. doi: 10.1038/nmeth.4285
Kiraly, L., Barna, B., and Király, Z. (2007). Plant resistance to pathogen infection: forms and mechanisms of innate and acquired resistance. J. Phytopathol. 155, 385–396. doi: 10.1111/j.1439-0434.2007.01264.x
Klein, A. P., and Sattely, E. S. (2015). Two cytochromes P450 catalyze S-heterocyclizations in cabbage phytoalexin biosynthesis. Nat. Chem. Biol. 11, 837–839. doi: 10.1038/nchembio.1914
Kohli, S. K., Bali, S., Khanna, K., Bakshi, P., Sharma, P., Sharma, A., et al. (2019). “A current scenario on role of brassinosteroids in plant defense triggered in response to biotic challenges,” in Brassinosteroids: Plant Growth and Development, eds S. Hayat, M. Yusuf, R. Bhardwaj, and A. Bajguz (Singapore: Springer), 367–388. doi: 10.1007/978-981-13-6058-9_13
Kumar, M. S., Babu, P. R., Rao, K. V., and Reddy, V. D. (2014). Organization and classification of cytochrome P450 genes in castor (Ricinus communis L.). Proc. Natl. Acad. Sci. India Section B Biol. Sci. 84, 131–143. doi: 10.1007/s40011-013-0192-8
Lamb, D. C., Follmer, A. H., Goldstone, J. V., Nelson, D. R., Warrilow, A. G., Price, C. L., et al. (2019). On the occurrence of cytochrome P450 in viruses. Proc. Natl. Acad. Sci. U.S.A. 116, 12343–12352. doi: 10.1073/pnas.1901080116
Lebreton, A., Labbe, C., De Ronne, M., Xue, A. G., Marchand, G., and Belanger, R. R. (2018). Development of a simple hydroponic assay to study vertical and horizontal resistance of soybean and pathotypes of Phytophthora sojae. Plant Dis. 102, 114–123. doi: 10.1094/PDIS-04-17-0586-RE
Lee, S., Mian, M. A., McHale, L. K., Wang, H., Wijeratne, A. J., Sneller, C. H., et al. (2013). Novel quantitative trait loci for partial resistance to Phytophthora sojae in soybean PI 398841. TAG Theor. Appl. Genet. 126, 1121–1132. doi: 10.1007/s00122-013-2040-x
Lemarie, S., Robert-Seilaniantz, A., Lariagon, C., Lemoine, J., Marnet, N., Levrel, A., et al. (2015). Camalexin contributes to the partial resistance of Arabidopsis thaliana to the biotrophic soilborne protist Plasmodiophora brassicae. Front. Plant Sci. 6:539. doi: 10.3389/fpls.2015.00539
Li, L., Cheng, H., Gai, J., and Yu, D. (2007). Genome-wide identification and characterization of putative cytochrome P450 genes in the model legume Medicago truncatula. Planta 226, 109–123. doi: 10.1007/s00425-006-0473-z
Li, L., Lin, F., Wang, W., Ping, J., Fitzgerald, J. C., Zhao, M., et al. (2016). Fine mapping and candidate gene analysis of two loci conferring resistance to Phytophthora sojae in soybean. Theor. Appl. Genet. 129, 2379–2386. doi: 10.1007/s00122-016-2777-0
Li, X., Han, Y., Teng, W., Zhang, S., Yu, K., Poysa, V., et al. (2010). Pyramided QTL underlying tolerance to Phytophthora root rot in mega-environments from soybean cultivars ‘Conrad’ and ‘Hefeng 25’. TAG Theor. Appl. Genet. 121, 651–658. doi: 10.1007/s00122-010-1337-2
Li, Y., and Wei, K. (2020). Comparative functional genomics analysis of cytochrome P450 gene superfamily in wheat and maize. BMC Plant Biol. 20:93. doi: 10.1186/s12870-020-2288-7
Lin, F., Zhao, M., Baumann, D. D., Ping, J., Sun, L., Liu, Y., et al. (2014). Molecular response to the pathogen Phytophthora sojae among ten soybean near isogenic lines revealed by comparative transcriptomics. BMC Genomics 15:18. doi: 10.1186/1471-2164-15-18
Liu, C. J., Huhman, D., Sumner, L. W., and Dixon, R. A. (2003). Regiospecific hydroxylation of isoflavones by cytochrome P450 81E enzymes from Medicago truncatula. Plant J. 36, 471–484. doi: 10.1046/j.1365-313x.2003.01893.x
Ma, B., Luo, Y., Jia, L., Qi, X., Zeng, Q., Xiang, Z., et al. (2014). Genome-wide identification and expression analyses of cytochrome P450 genes in mulberry (Morus notabilis). J. Integr. Plant Biol. 56, 887–901. doi: 10.1111/jipb.12141
Mao, H., Liu, J., Ren, F., Peters, R. J., and Wang, Q. (2016). Characterization of CYP71Z18 indicates a role in maize zealexin biosynthesis. Phytochemistry 121, 4–10. doi: 10.1016/j.phytochem.2015.10.003
Minh, B. Q., Nguyen, M. A. T., and von Haeseler, A. (2013). Ultrafast approximation for phylogenetic bootstrap. Mol. Biol. Evol. 30, 1188–1195. doi: 10.1093/molbev/mst024
Morikawa, T., Mizutani, M., Aoki, N., Watanabe, B., Saga, H., Saito, S., et al. (2006). Cytochrome P450 CYP710A encodes the sterol C-22 desaturase in Arabidopsis and tomato. Plant Cell 18, 1008–1022. doi: 10.1105/tpc.105.036012
Nawrath, C., and Métraux, J. P. (1999). Salicylic acid induction-deficient mutants of Arabidopsis express PR-2 and PR-5 and accumulate high levels of camalexin after pathogen inoculation. Plant Cell 11, 1393–1404. doi: 10.1105/tpc.11.8.1393
Nelson, D. R. (2009). The cytochrome P450 homepage. Hum. Genomics 4, 59–65. doi: 10.1186/1479-7364-4-1-59
Nelson, D. R., Koymans, L., Kamataki, T., Stegeman, J. J., Feyereisen, R., Waxman, D. J., et al. (1996). P450 superfamily: update on new sequences, gene mapping, accession numbers and nomenclature. Pharmacogenetics 6, 1–42. doi: 10.1097/00008571-199602000-00002
Nelson, D. R., Schuler, M. A., Paquette, S. M., Werck-Reichhart, D., and Bak, S. (2004). Comparative genomics of rice and Arabidopsis. Analysis of 727 cytochrome P450 genes and pseudogenes from a monocot and a dicot. Plant Physiol. 135, 756–772. doi: 10.1104/pp.104.039826
Nguyen, L.-T., Schmidt, H. A., von Haeseler, A., and Minh, B. Q. (2015). IQ-TREE: a fast and effective stochastic algorithm for estimating maximum-likelihood phylogenies. Mol. Biol. Evol. 32, 268–274. doi: 10.1093/molbev/msu300
Nguyen, V., Vuong, T., VanToai, T., Lee, J., Wu, X., Mian, M. R., et al. (2012). Mapping of quantitative trait loci associated with resistance to Phytophthora sojae and flooding tolerance in soybean. Crop Sci. 52, 2481–2493. doi: 10.2135/cropsci2011.09.0466
Pan, Z., Baerson, S. R., Wang, M., Bajsa-Hirschel, J., Rimando, A. M., Wang, X., et al. (2018). A cytochrome P450 CYP71 enzyme expressed in Sorghum bicolor root hair cells participates in the biosynthesis of the benzoquinone allelochemical sorgoleone. New Phytol. 218, 616–629. doi: 10.1111/nph.15037
Pandian, B. A., Sathishraj, R., Djanaguiraman, M., Prasad, P. V. V., and Jugulam, M. (2020). Role of cytochrome P450 enzymes in plant stress response. Antioxidants (Basel) 9:454. doi: 10.3390/antiox9050454
Paquette, S. M., Bak, S., and Feyereisen, R. (2000). Intron-exon organization and phylogeny in a large superfamily, the paralogous cytochrome P450 genes of Arabidopsis thaliana. DNA Cell Biol. 19, 307–317. doi: 10.1089/10445490050021221
Pilet-Nayel, M. L., Moury, B., Caffier, V., Montarry, J., Kerlan, M. C., Fournet, S., et al. (2017). Quantitative resistance to plant pathogens in pyramiding strategies for durable crop protection. Front. Plant Sci. 8:1838. doi: 10.3389/fpls.2017.01838
Ranjan, A., Westrick, N. M., Jain, S., Piotrowski, J. S., Ranjan, M., Kessens, R., et al. (2019). Resistance against Sclerotinia sclerotiorum in soybean involves a reprogramming of the phenylpropanoid pathway and up-regulation of antifungal activity targeting ergosterol biosynthesis. Plant Biotechnol. J. 17, 1567–1581. doi: 10.1111/pbi.13082
Richter, A., Schaff, C., Zhang, Z., Lipka, A. E., Tian, F., Köllner, T. G., et al. (2016). Characterization of biosynthetic pathways for the production of the volatile homoterpenes DMNT and TMTT in Zea mays. Plant Cell 28, 2651–2665. doi: 10.1105/tpc.15.00919
Rowe, H. C., Walley, J. W., Corwin, J., Chan, E. K. F., Dehesh, K., and Kliebenstein, D. J. (2010). Deficiencies in jasmonate-mediated plant defense reveal quantitative variation in Botrytis cinerea pathogenesis. PLoS Pathog. 6:e1000861. doi: 10.1371/journal.ppat.1000861
Schoenbohm, C., Martens, S., Eder, C., Forkmann, G., and Weisshaar, B. (2000). Identification of the Arabidopsis thaliana flavonoid 3′-hydroxylase gene and functional expression of the encoded P450 enzyme. Biol. Chem. 381, 749–753. doi: 10.1515/BC.2000.095
Schopfer, C. R., Kochs, G., Lottspeich, F., and Ebel, J. (1998). Molecular characterization and functional expression of dihydroxypterocarpan 6a-hydroxylase, an enzyme specific for pterocarpanoid phytoalexin biosynthesis in soybean (Glycine max L.). FEBS Lett. 432, 182–186. doi: 10.1016/s0014-5793(98)00866-7
Sievers, F., Wilm, A., Dineen, D., Gibson, T. J., Karplus, K., Li, W., et al. (2011). Fast, scalable generation of high-quality protein multiple sequence alignments using Clustal Omega. Mol. Syst. Biol. 7:539. doi: 10.1038/msb.2011.75
Sircar, D., Gaid, M. M., Chizzali, C., Reckwell, D., Kaufholdt, D., Beuerle, T., et al. (2015). Biphenyl 4-Hydroxylases involved in aucuparin biosynthesis in rowan and apple are Cytochrome P450 736A proteins. Plant Physiol. 168, 428–442. doi: 10.1104/pp.15.00074
Smoot, M. E., Ono, K., Ruscheinski, J., Wang, P. L., and Ideker, T. (2011). Cytoscape 2.8: new features for data integration and network visualization. Bioinformatics 27, 431–432. doi: 10.1093/bioinformatics/btq675
Steele, C. L., Gijzen, M., Qutob, D., and Dixon, R. A. (1999). Molecular characterization of the enzyme catalyzing the aryl migration reaction of isoflavonoid biosynthesis in soybean. Arch. Biochem. Biophys. 367, 146–150. doi: 10.1006/abbi.1999.1238
Subramanian, B., Gao, S., Lercher, M. J., Hu, S., and Chen, W.-H. (2019). Evolview v3: a webserver for visualization, annotation, and management of phylogenetic trees. Nucleic Acids Res. 47, W270–W275. doi: 10.1093/nar/gkz357
Sun, W., Ma, Z., and Liu, M. (2020). Cytochrome P450 family: genome-wide identification provides insights into the rutin synthesis pathway in Tartary buckwheat and the improvement of agricultural product quality. Int. J. Biol. Macromol. 164, 4032–4045. doi: 10.1016/j.ijbiomac.2020.09.008
Trifinopoulos, J., Nguyen, L.-T., von Haeseler, A., and Minh, B. Q. (2016). W-IQ-TREE: a fast online phylogenetic tool for maximum likelihood analysis. Nucleic Acids Res. 44, W232–W235. doi: 10.1093/nar/gkw256
Tucker, D., Saghai Maroof, M., Mideros, S., Skoneczka, J., Nabati, D., Buss, G., et al. (2010). Mapping quantitative trait loci for partial resistance to Phytophthora sojae in a soybean interspecific cross. Crop Sci. 50, 628–635. doi: 10.2135/cropsci2009.03.0161
Tzfadia, O., Diels, T., De Meyer, S., Vandepoele, K., Aharoni, A., and Van de Peer, Y. (2015). CoExpNetViz: comparative co-expression networks construction and visualization tool. Front. Plant Sci. 6:1194. doi: 10.3389/fpls.2015.01194
Vasav, A. P., and Barvkar, V. T. (2019). Phylogenomic analysis of cytochrome P450 multigene family and their differential expression analysis in Solanum lycopersicum L. suggested tissue specific promoters. BMC Genomics 20:116. doi: 10.1186/s12864-019-5483-x
Voorrips, R. E. (2002). MapChart: software for the graphical presentation of linkage maps and QTLs. J. Hered. 93, 77–78. doi: 10.1093/jhered/93.1.77
Wang, X., Zhao, Z., Guo, N., Wang, H., Zhao, J., and Xing, H. (2020). Comparative proteomics analysis reveals that lignin biosynthesis contributes to brassinosteroid-mediated response to Phytophthora sojae in soybeans. J. Agric. Food Chem. 68, 5496–5506. doi: 10.1021/acs.jafc.0c00848
Wei, K., and Chen, H. (2018). Global identification, structural analysis and expression characterization of cytochrome P450 monooxygenase superfamily in rice. BMC Genomics 19:35. doi: 10.1186/s12864-017-4425-8
Wu, X., Zhou, B., Zhao, J., Guo, N., Zhang, B., Yang, F., et al. (2011). Identification of quantitative trait loci for partial resistance to Phytophthora sojae in soybean. Plant Breeding 130, 144–149. doi: 10.1111/j.1439-0523.2010.01799.x
Wu, Y., Wang, Q., Hillwig, M. L., and Peters, R. J. (2013). Picking sides: distinct roles for CYP76M6 and CYP76M8 in rice oryzalexin biosynthesis. Biochem. J. 454, 209–216. doi: 10.1042/BJ20130574
Xu, J., Wang, X.-y., and Guo, W.-z. (2015). The cytochrome P450 superfamily: key players in plant development and defense. J. Integr. Agric. 14, 1673–1686. doi: 10.1016/s2095-3119(14)60980-1
Yan, Q., Cui, X., Lin, S., Gan, S., Xing, H., and Dou, D. (2016). GmCYP82A3, a soybean Cytochrome P450 family gene involved in the jasmonic acid and ethylene signaling pathway, enhances plant resistance to biotic and abiotic stresses. PLoS One 11:e0162253. doi: 10.1371/journal.pone.0162253
Yang, J., Duan, G., Li, C., Liu, L., Han, G., Zhang, Y., et al. (2019). The crosstalks between jasmonic acid and other plant hormone signaling highlight the involvement of jasmonic acid as a core component in plant response to biotic and abiotic stresses. Front. Plant Sci. 10:1349. doi: 10.3389/fpls.2019.01349
Yonekura-Sakakibara, K., Higashi, Y., and Nakabayashi, R. (2019). The origin and evolution of plant flavonoid metabolism. Front. Plant Sci. 10:943. doi: 10.3389/fpls.2019.00943
Keywords: soybean, cytochrome P450 monooxygenases, QTL, Phytophthora sojae, phytoalexins
Citation: Khatri P, Wally O, Rajcan I and Dhaubhadel S (2022) Comprehensive Analysis of Cytochrome P450 Monooxygenases Reveals Insight Into Their Role in Partial Resistance Against Phytophthora sojae in Soybean. Front. Plant Sci. 13:862314. doi: 10.3389/fpls.2022.862314
Received: 25 January 2022; Accepted: 10 March 2022;
Published: 14 April 2022.
Edited by:
Deyu Xie, North Carolina State University, United StatesReviewed by:
Fabrício Almeida-Silva, Ghent University, BelgiumTahmina Islam, University of Dhaka, Bangladesh
Copyright © 2022 Istvan Rajcan, and Her Majesty the Queen in Right of Canada, as represented by the Minister of Agriculture and Agri-Food Canada for the contribution of Praveen Khatri, Owen Wally, and Sangeeta Dhaubhadel. This is an open-access article distributed under the terms of the Creative Commons Attribution License (CC BY). The use, distribution or reproduction in other forums is permitted, provided the original author(s) and the copyright owner(s) are credited and that the original publication in this journal is cited, in accordance with accepted academic practice. No use, distribution or reproduction is permitted which does not comply with these terms.
*Correspondence: Sangeeta Dhaubhadel, sangeeta.dhaubhadel@agr.gc.ca