Corrigendum: Comparison of 14 reference evapotranspiration with lysimeter measurements at a site in the humid alpine meadow, northeastern Qinghai-Tibetan Plateau
 Licong Dai
 Ruiyu Fu2
 Yangong Du
- 1College of Ecology and Environment, Hainan University, Haikou, China
- 2Hainan Academy of Forestry, Haikou, China
- 3Qinghai Provincial Key Laboratory of Restoration Ecology for Cold Region, Northwest Institute of Plateau Biology, Chinese Academy of Sciences, Xining, China
Evapotranspiration is a key component in the terrestrial water cycle, and accurate evapotranspiration estimates are critical for water irrigation management. Although many applicable evapotranspiration models have been developed, they are largely focused on low-altitude regions, with less attention given to alpine ecosystems. In this study, we evaluated the performance of fourteen reference evapotranspiration (ET0) models by comparison with large weight lysimeter measurements. Specifically, we used the Bowen ratio energy balance method (BREB), three combination models, seven radiation-based models, and three temperature-based models based on data from June 2017 to December 2018 in a humid alpine meadow in the northeastern Qinghai–Tibetan Plateau. The daily actual evapotranspiration (ETa) data were obtained using large weighing lysimeters located in an alpine Kobresia meadow. We found that the performance of the fourteen ET0 models, ranked on the basis of their root mean square error (RMSE), decreased in the following order: BREB > Priestley-Taylor (PT) > DeBruin-Keijman (DK) > 1963 Penman > FAO-24 Penman > FAO-56 Penman–Monteith > IRMAK1 > Makkink (1957) > Makkink (1967) > Makkink > IRMAK2 > Hargreaves (HAR) > Hargreaves1 (HAR1) > Hargreaves2 (HAR2). For the combination models, the FAO-24 Penman model yielded the highest correlation (0.77), followed by 1963 Penman (0.75) and FAO-56 PM (0.76). For radiation-based models, PT and DK obtained the highest correlation (0.80), followed by Makkink (1967) (0.69), Makkink (1957) (0.69), IRMAK1 (0.66), and IRMAK2 (0.62). For temperature-based models, the HAR model yielded the highest correlation (0.62), HAR1, and HAR2 obtained the same correlation (0.59). Overall, the BREB performed best, with RMSEs of 0.98, followed by combination models (ranging from 1.19 to 1.27 mm day−1 and averaging 1.22 mm day−1), radiation-based models (ranging from 1.02 to 1.42 mm day−1 and averaging 1.27 mm day−1), and temperature-based models (ranging from 1.47 to 1.48 mm day−1 and averaging 1.47 mm day−1). Furthermore, all models tended to underestimate the measured ETa during periods of high evaporative demand (i.e., growing season) and overestimated measured ETa during low evaporative demand (i.e., nongrowing season). Our results provide new insights into the accurate assessment of evapotranspiration in humid alpine meadows in the northeastern Qinghai–Tibetan Plateau.
Introduction
Evapotranspiration is a key parameter in the simultaneous processes of heat and water transfer to the atmosphere via transpiration and evaporation in the soil–plant–atmosphere system (Sentelhas et al., 2010), thereby playing an important role in water balance calculations, water allocation, and water irrigation management. Thus, accurate estimates of evapotranspiration could improve water management strategies and promote efficient water resource use, especially in regions with water shortages (Sun et al., 2011).
To date, direct evapotranspiration measurements have been achieved by a variety of methods, such as the Bowen ratio energy balance (BREB) system (Irmak et al., 2003, 2005; Si et al., 2005; Irmak and Irmak, 2008), lysimeters (Jia et al., 2006; Valipour, 2015), and the eddy covariance technique (Novick et al., 2009; Zhang et al., 2018). Alternatively, evapotranspiration can be indirectly assessed by applying various reference evapotranspiration (ET0) equations. Several ET0 models have been widely used for evapotranspiration calculation and can be classified into three types, namely, radiation-based models (Hargreaves and Samani, 1985), temperature-based models (Trajkovic et al., 2019), and combination models (Penman, 1963). While the development of these models has undoubtedly benefited the calculation of evapotranspiration, it remains difficult to choose the optimal one because of the availability of observed data, and most models have not been evaluated against lysimeter measurements across a range of regions and climates (Liu et al., 2017; Kiefer et al., 2019). To select the best-performing models, many studies have been conducted to assess model performance under various climates. For instance, the Food and Agriculture Organization of the United Nations (FAO) recommends the Penman–Monteith FAO-56 (PM-56) as the standard equation for estimating models ET0 (Allen et al., 1998), and this has been widely used worldwide when compared with other equations (Cai et al., 2007). The advantage of the PM equation is that it does not require any local calibration because it incorporates both physiological and aerodynamic parameters, and it has been well tested based on lysimeter data (Trajkovic, 2009).
Although many models have been widely used to estimate ET, most previous models have only been evaluated with respect to PM-56 (Cao et al., 2015; Liu et al., 2017), with few being tested against lysimeter measurements. Furthermore, the application of the PM-56 equation requires many meteorological inputs, such as wind speed, temperature, humidity, and solar radiation, which are often not available in regions with harsh environments (Tabari et al., 2012; Martel et al., 2018). Thus, it is essential to develop a relatively accurate ET0 model that requires fewer meteorological parameters to allow more simplified estimates of evapotranspiration than those of PM-56, applicable across a range of climatic conditions (Tabari and Talaee, 2011). For example, Tabari (2010) assessed four ET0 models in an arid climate and found that the Turc model performed the best. Meanwhile, the Hargreaves equation performed best in semiarid regions (Sabziparvar and Tabari, 2010). Liu et al. (2017) compared sixteen models for ET0 against weighing lysimeter measurements and found that the combination models performed best for estimating evapotranspiration in semiarid regions. Overall, most previous studies have been conducted in low-humidity conditions at low altitudes (i.e., arid and semiarid regions) (Sentelhas et al., 2010; Liu et al., 2017), with few studies in humid climates, particularly in alpine ecosystems. Compared with arid and semiarid regions in low altitudes, the interaction soil-plant-atmosphere condition change in the humid alpine meadow was more affected by net radiance (Dai et al., 2021), thus, the ET0 models in arid and semiarid regions might not be suitable for humid alpine meadow. It was urgent to improve the accuracy of evapotranspiration observations in alpine regions by comparing reference evapotranspiration models with lysimeter measurements in the humid alpine meadow.
The Qinghai–Tibetan Plateau (QTP), with an average altitude of 4,000 m, is the world's highest alpine ecosystem and is also known as the “Asian tower,” playing an important role in ensuring the safety of water resources in China and southeast Asia (Zou et al., 2017; Dai et al., 2019b). Furthermore, the permafrost and seasonally frozen ground account for 50–56% of the total Qinghai-Tibet Plateau area, and the alpine ecosystem was more sensitive to global warming compared with other ecosystems owing to its high altitude (Zou et al., 2017). Therefore, an accurate estimation of evapotranspiration in an alpine ecosystem could not only provide new insights into the water cycle but also benefit the formulation of water resource management strategies. Furthermore, given the uncertainty and confusion in the selection of evapotranspiration equations across different regions and climates, it is critical to thoroughly understand the performance of various models in the humid alpine meadow (Zhang et al., 2018). In this study, we compared fourteen ET0 models against lysimeter measurements on the northern Tibetan Plateau, with the aim of selecting the best fit model over a humid alpine meadow on the northeastern QTP to estimate evapotranspiration.
Materials and Methods
Study Area
This study was conducted at the Haibei National Field Research Station, Qinghai, China (37°37′ N, 101°19′E), which is located on the Northeastern QTP at an elevation of 3,200 m MASL (Figure 1). This area is characterized by a plateau continental monsoon climate, with well-developed seasonally frozen ground. The average annual air temperature is −1.7°C, with the maximum monthly temperature in July (10.1°C) and the minimum monthly temperature in January (−15°C). The annual precipitation is ~580 mm, of which 80% falls in the growing season (i.e., from May to September), leading to high water content (close to field capacity) in the soil during the growing season, thus, the evapotranspiration during the growing season was not limited by soil water content (Dai et al., 2021). The average annual pan evaporation is ~1,191.4 mm (Zhang et al., 2018). The soil type around the lysimeter system is classified as Mat-Gryic Cambisol, which belongs to clay loam, and has a thickness of ~60–80 cm (Dai et al., 2019a), and the basic soil property is shown in Table 1. The grass crop is dominated by perennial sedge and graminoid species, including Kobresia humilis, Stipa aliena, and Elymus nutans, with ~8–15 cm in height, which together constitutes 60–80% of plant cover around the lysimeter system (Dai et al., 2021).
FIGURE 1
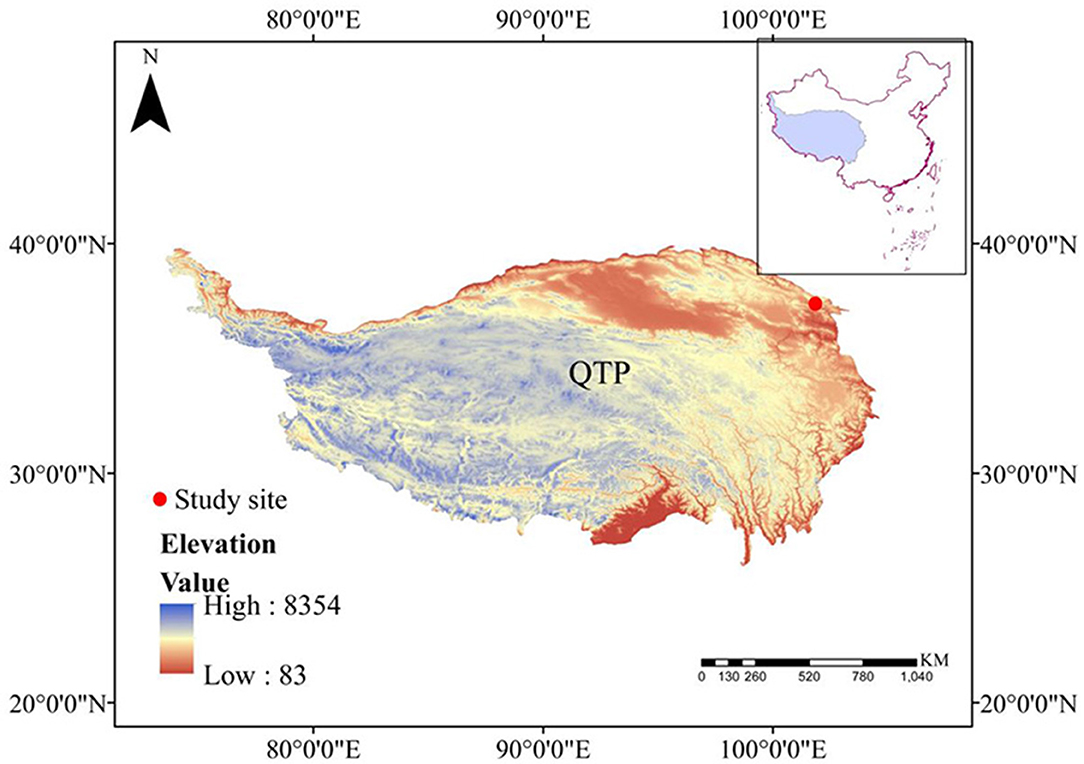
Figure 1. The location of the study area.
TABLE 1
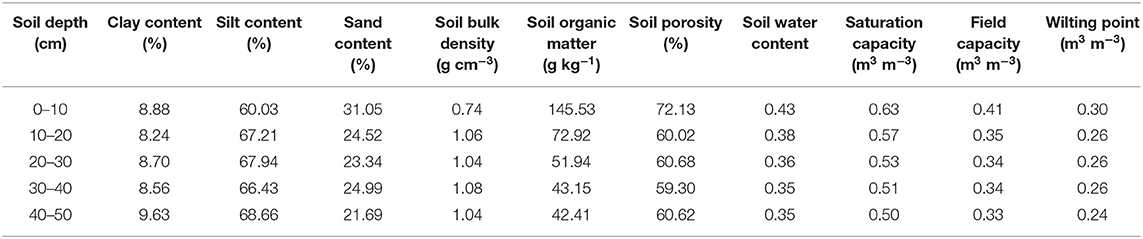
Table 1. The basic soil properties around the lysimeter system.
Actual Evapotranspiration Measurement and Data Quality Control
The actual evapotranspiration (ETa) was measured using large-scale weighing lysimeters (height 2 m, diameter 1 m, and resolution 10 g) installed in the central alpine Kobresia meadow of the Haibei National Field Research Station. Lysimeters are vessels containing both monolites and repacked soils and are embedded completely in the soil at their top level with the soil surface. The topsoil, including the root, was composed of monolites, while deep soil, not including roots, comprised repacked soils. The soil was cut off from the parent soil at the base of the lysimeters, and the lower lysimeter boundary was exposed to atmospheric pressure. Measurements of ETa were based on changes in weight, with measurements at 30-min intervals recorded by a data logger (CR1000, Campbell, USA) and converted to daily values. To ensure data quality, all negative or abnormal ETa values caused by falling soil particles were discarded; outliers that differed more than three times from average ETa, which yielded 393 days of data spanning June 2017–December 2018. According to in situ phenological observations of the dominant plant foliage, we defined the growing season as the period from May 1 to September 30, while the period from October 1 to April 30 of the following year was defined as the nongrowing season (Zhang et al., 2018).
Given that the soil moisture of the root region was more than the field capacity (Table 1), thus, the ETa in this study was mainly not limited by surface moisture. Furthermore, the plant height was 8–12 cm, actively growing, and completely shading the ground, which satisfies the definition of reference evapotranspiration (defined as 8–15 cm high, uniform, actively growing, green grass that completely shades the soil and not limited by soil water availability), and we, thus, could assume that the ETa in this study could be considered as reference crop evapotranspiration or potential evaporation. To verify the assumption that ETa in this study was not limited by soil water availability, our previous studies showed that the annual Priestley–Taylor coefficient values (ratio of ETa to ETeq) ranged from 1.08 to 1.14 (ETeq represents the minimum possible evapotranspiration from a moist surface and depends only on air temperature and available energy), and the annual decoupling coefficient Ω ranged from 0.43 to 0.48 (Zhang et al., 2018), which provided direct evidence that ETa in this study occurred under strongly energy-limited conditions rather than soil water availability constraints.
Meteorological and Soil Water Content Data Collection
All meteorological variables needed to calculate ET0 using various models were obtained or estimated from the weather station at Haibei Station, including precipitation (PPT), relative humidity (RH), wind speed (WS), net radiation (Rn), total radiation (Rs), soil heat flux (G), maximum air temperature (Tmax), vapor pressure deficit (VPD), minimum air temperature (Tmin), and mean air temperature (Ta). PPT was collected using a PPT gauge (52203, RM Young, USA) at 0.5 m height. Radiation was measured by four radiometers (CNR4, Kipp & Zonen, Netherlands) at 1.5 m height; RH, WS, and T were measured at 1.5 m height (HMP45C, Vaisala, Finland), and WS was converted to 2 m height () for calculating ET0. The G was measured using three heat flux plates (HFT-3, Campbell, USA), which were buried 5 cm beneath the surface. Half-hourly means of meteorological data were stored using a data logger (9210 XLITE, Sutron, USA). The BREB method parameter was determined using an eddy covariance system installed near a lysimeter system, which included a three-dimensional ultrasonic anemometer (CSAT3, Campbell, USA) and an open-path infrared CO2/H2O gas analyzer (LI-7500A, LI-Cor, USA), and 30-min fluxes were calculated and logged with a SMARTFLUX system (LI-COR, USA) (Zhang et al., 2018). The soil water content was measured using the oven-drying method at depths of 0–10, 10–20, 20–30, 30–40, and 40–50 cm through a soil auger in July because the evapotranspiration reaches its maximum in July with its maximum water demand.
Reference Evapotranspiration Models
The reference evapotranspiration was defined as 8–15 cm high, uniform, actively growing, green grass that completely shades the soil and not limited by soil water availability (Doorenbos and Pruitt, 1977). A total of fourteen often-used ET0 models were selected for comparison, including BREB, three combination models (1963 Penman, FAO-24 Penman, and FAO-56 PM), seven radiation models [Priestley–Taylor, DeBruin–Keijman, Makkink, Makkink (1957), Makkink (1967), IRMAK1, and IRMAK2], and three temperature-based models (Hargreaves, Hargreaves1, and Hargreaves2), to compare their performance using the lysimeter measurement. The specific equations and parameters of the models are listed in Table 2.
TABLE 2
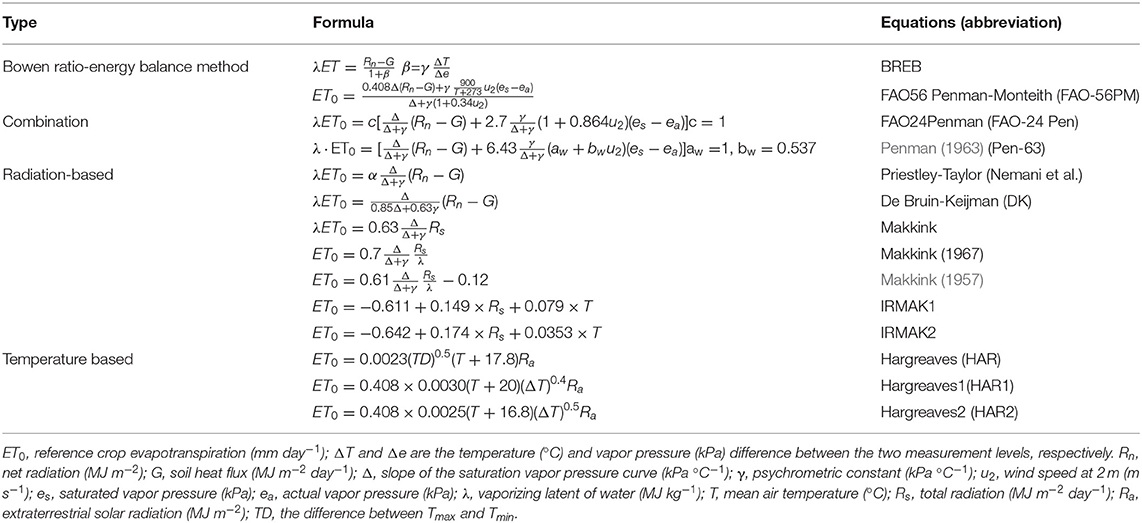
Table 2. Details of selected models for evaluation and input parameters in each model.
Evaluation Criteria
In this study, the ETa measured by the large-scale weighing lysimeters and the performances of the ET0 models were compared with these lysimeter system estimates on a daily basis. Pairwise comparisons were conducted using a general linear regression. For further comparison, the root means squared error (RMSE), percentage error of estimate (PE), mean absolute error (MAE), and coefficient of determination (R2) were used to evaluate the ET0 models. The RMSE, PE, MAE, and R2 are defined as follows:
where Pi is the predicted value; Oi is the observed value; and are the averages of Pi and Oi, respectively; and n is the total number of data points.
Statistical Analysis
To achieve the best comparison between the models and measurements, we need to select the dominant meteorological factors affecting the measured ETa. Given that it may not be appropriate to explore results based solely on the coefficient of independent variables in multiple regression analysis, owing to the strong collinearity and nonlinearities among meteorological factors, we adopted a boosted regression tree (BRT) model to quantitatively evaluate the relative influences of meteorological variables on measured ETa. BRT is a machine-learning method based on the classification regression tree algorithm (CART). This method generates multiple regression trees through random selection and self-learning methods, which can improve model stability and prediction accuracy. During operation, some data are randomly selected many times to analyze the influence of independent variables on dependent variables and to quantitatively evaluate the relative effect of independent variables on dependent variables, while the remaining data are used to test the fitting results (Elith et al., 2008). Most importantly, the BRT can evaluate the relative influence of an independent variable on a dependent variable, without transformations, and can cope well with nonlinear relationships. Furthermore, the BRT exhibits good performance in dealing with stronger collinearity and nonlinearities. Thus, the BRT was adopted to evaluate the individual influences of the controlling factors on the measured evapotranspiration. All statistical analyses were performed using R software version 3.03 (R Development Core Team, 2006), and all figures were plotted using Origin 9.0.
Results
Seasonal Variation in ETa and Environmental Variables
The measured ETa showed a clear seasonal pattern, and the growing season ETa was significantly higher than that in the nongrowing season (P < 0.05) (Figure 2a). The average measured daily ETa during the study period was 2.33 mm day−1, with an average daily measured ETa of 4.14 and 0.65 mm day−1 during the growing season and nongrowing season, respectively (Figure 2a). Environmental variables showed a similar seasonal pattern, with maximum and minimum values in the growing and nongrowing seasons (Figure 2). The average daily Rn, Rs, Ta, VPD, and RH during the growing season were 9.53 MJ m−2, 18.50 MJ m−2, 10.15°C, 0.33 kPa, and 74.88%, respectively (Figure 2). The average daily Rn, Rs, Ta, VPD, and RH during the nongrowing season were 3.28 MJ m−2, 12.65 MJ m−2, −3.67°C, 0.23 kPa, and 57.16%, respectively.
FIGURE 2
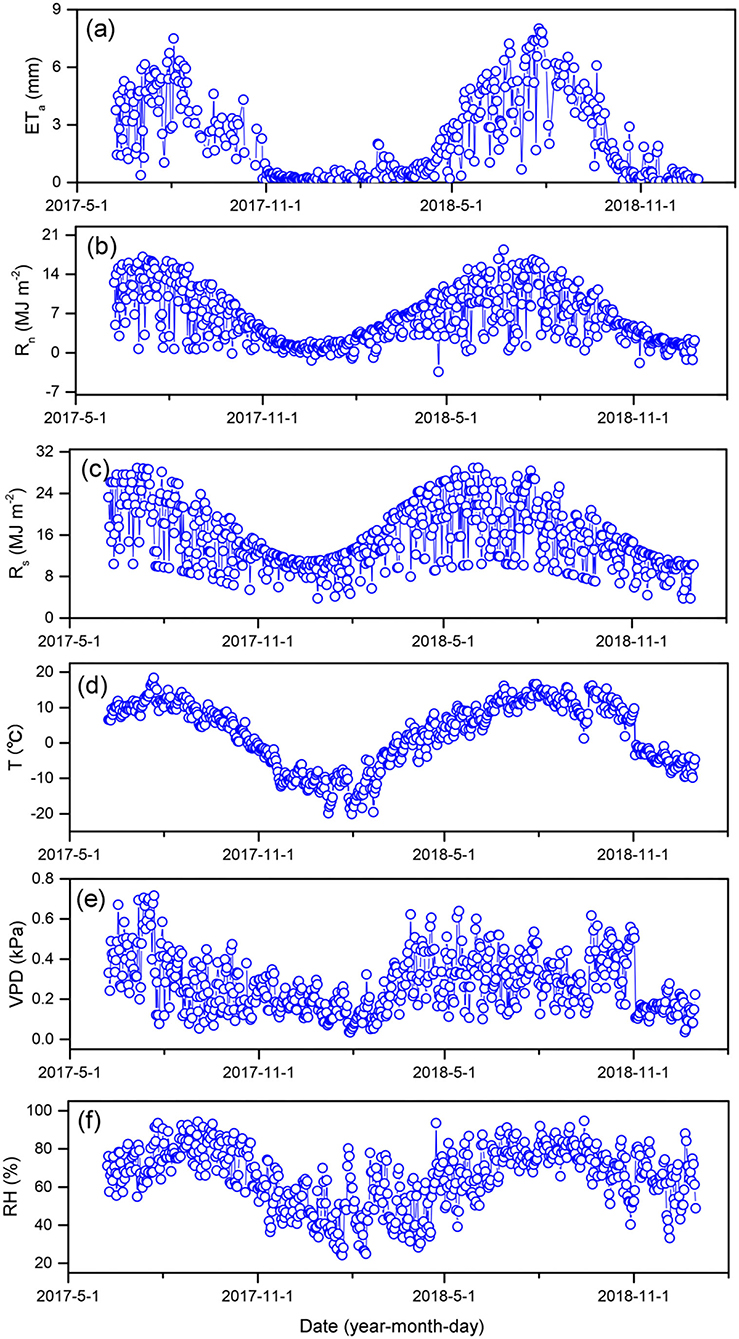
Figure 2. Seasonal variation of actual evapotranspiration (ETa) (a), net radiation (Rn) (b), total radiation (Rs) (c), mean air temperature (T) (d), vapor pressure deficit (VPD) (e), and relatively humid (RH) (f).
Comparison of Daily Evapotranspiration Between Reference Evapotranspiration Models and Lysimeter Measurements Throughout the Study Period
A comparison of fourteen evapotranspiration equations against the lysimeter measurements is presented in Figure 3, Table 3, showing that the relationship between daily ET0 calculated by the ET0 models and lysimeter measurements ETa was all significant (P < 0.01), with high coefficients of determination (R2) ranging from 0.59 to 0.86. For the combination models, FAO-24 Penman (FAO-24 Pen) yielded the highest correlation (0.77), followed by PM-56 (0.76) and Penman 63 (Pen-63) (0.75). For radiation-based models, PT obtained the highest correlation (0.80), followed by DK (0.79), Makkink (1967) (0.69), Makkink (1957) (0.69), IRMAK1 (0.66), Makkink (0.65), and IRMAK2 (0.62). For temperature-based models, HAR obtained the highest correlation (0.62), and HAR1(0.59) and HAR2 (0.59) obtained the same correlation. The daily estimates of combination models generally underestimated the ETa values measured by lysimeter, with MAEs of −0.26 to −0.01 mm day−1. However, the radiation-based models (except PT and IRMAK1) and temperature-based models generally overestimated the ETa values, with MAEs ranging from −0.14 to 0.50 mm day−1 for radiation-based models and 0.40–0.59 mm day−1 for temperature-based models.
FIGURE 3
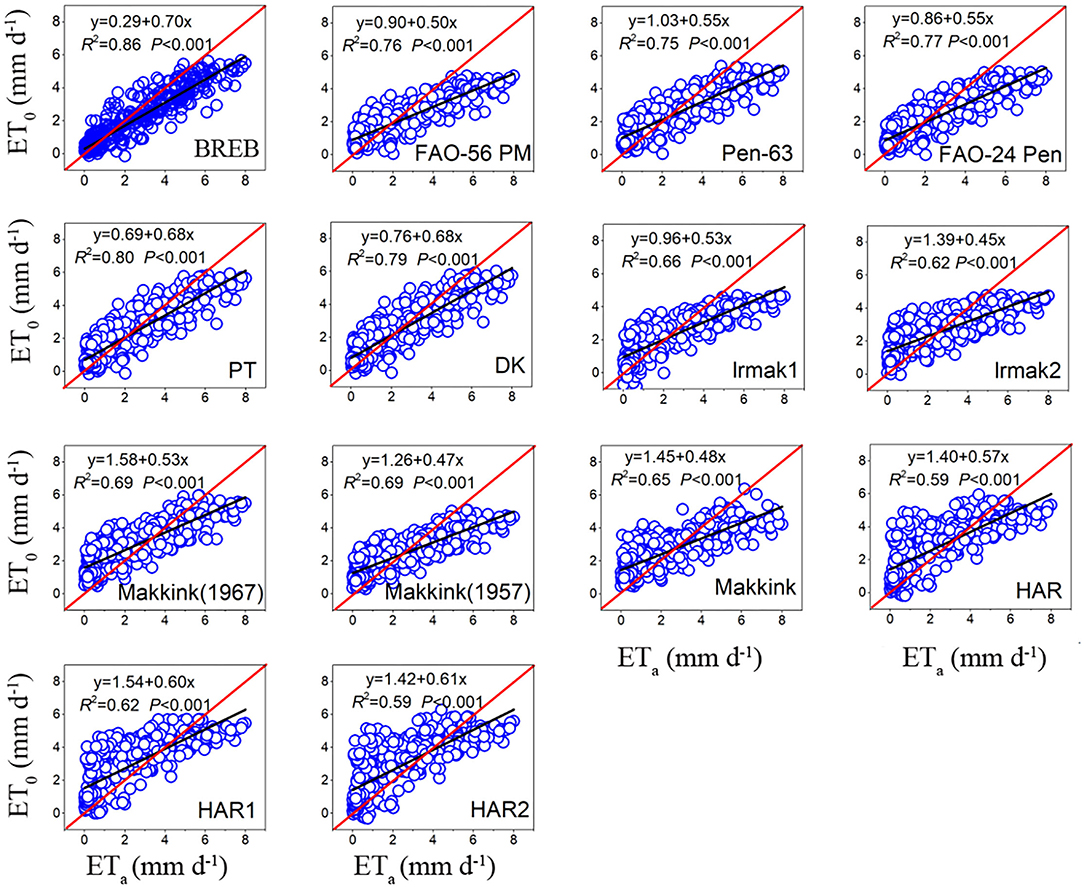
Figure 3. The relationship between daily ET0 of model estimates and ETa of lysimeter measurements during the whole study period (data points = 393).
TABLE 3
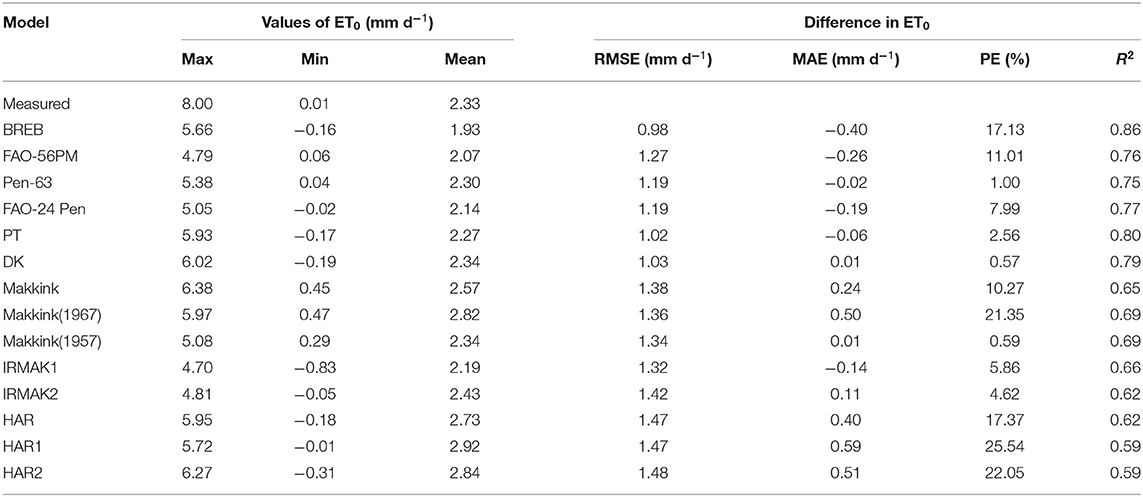
Table 3. Summary of statistics for daily ET0 between lysimeter measurements and model estimates during the whole study period (data points = 393).
Throughout the study period, the RMSE of the BREB method was 0.98, and the RMSE of combination models ranged from 1.19 to 1.27 mm day−1 and averaged 1.22 mm day−1. Furthermore, the RMSE of FAO-56 PM increased from 1.22 to 1.29 mm day−1 as aerodynamic resistance (rs) changed from 20 to 60 s m−1 (Figure 4). The RMSE for radiation-based models ranged from 1.02 to 1.42 mm day−1 and averaged 1.27 mm day−1, and the RMSE for temperature-based models ranged from 1.47 to 1.48 mm day−1 and averaged 1.47 mm day−1. Based on the RMSE, the performance of the fourteen evapotranspiration models decreased in the following order: BREB (0.98) > PT (1.02) > DK (1.03) > Pen-63 (1.19) > FAO-24 Pen (1.19) > PM-56 (1.27) > IRMAK1 (1.32) > Makkink (1957) (1.34) > Makkink (1967) (1.36) > Makkink (1.38) > IRMAK2 (1.42) > HAR (1.47) > HAR1 (1.47) > HAR2 (1.48). The best model was 34% and 30% more accurate than the poorest (HAR2) and the commonly used FAO-56 PM equation, respectively. Furthermore, Pen-63 and FAO-24 Pen demonstrated better performance than the commonly used PM-56 equation. Overall, for the entire study period, the BREB yielded the best performance, followed by the combination, radiation-based, and temperature-based models.
FIGURE 4
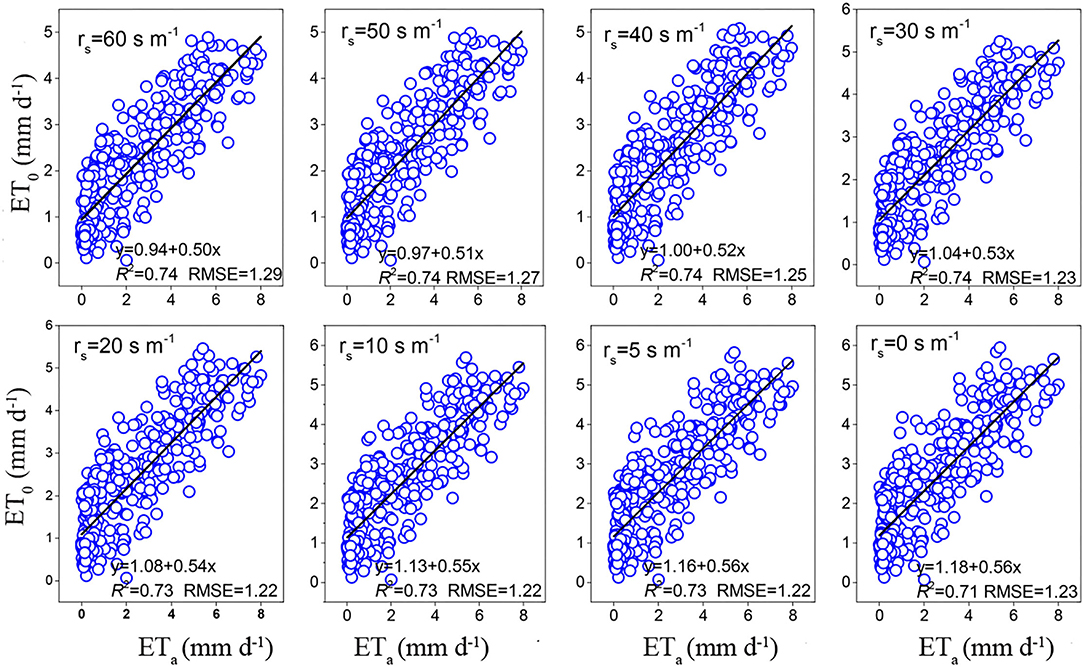
Figure 4. Effect of different surface resistances on daily estimates of the FAO56 Penman–Monteith.
Comparison of Daily Evapotranspiration Between Reference Evapotranspiration Models and Lysimeter Measurements During the Growing Season
During the growing season, the daily ET0 calculated by fourteen evapotranspiration models was significantly correlated with the lysimeter measurements ETa (P < 0.01), with R2 ranging from 0.32 to 0.64 (Figure 5, Table 4). Of the combination models, PM-56 had the highest R2 (0.60), followed by FAO-24 Pen (0.59) and Pen-63 (0.58). Of the radiation-based models, PT and DK obtained the highest R2 (0.59), followed by IRMAK1 (0.50), Makkink (1967) (0.47), Makkink (1957) (0.47), IRMAK2 (0.43), and Makkink (0.40). Notably, Makkink (1967) and Makkink (1957) had the same R2 (0.47). Of the temperature-based models, HAR, HAR1, and HAR2 obtained the same R2 values (0.32). Interestingly, all models (except HAR1 and HAR2) generally underestimated ETa during the growing season, values of MAE ranged from −1.10 to −0.15 mm day−1, with PM-56 having the largest underestimation (26.59%) and HAR the minimum underestimation (3.56%) (Table 4).
FIGURE 5
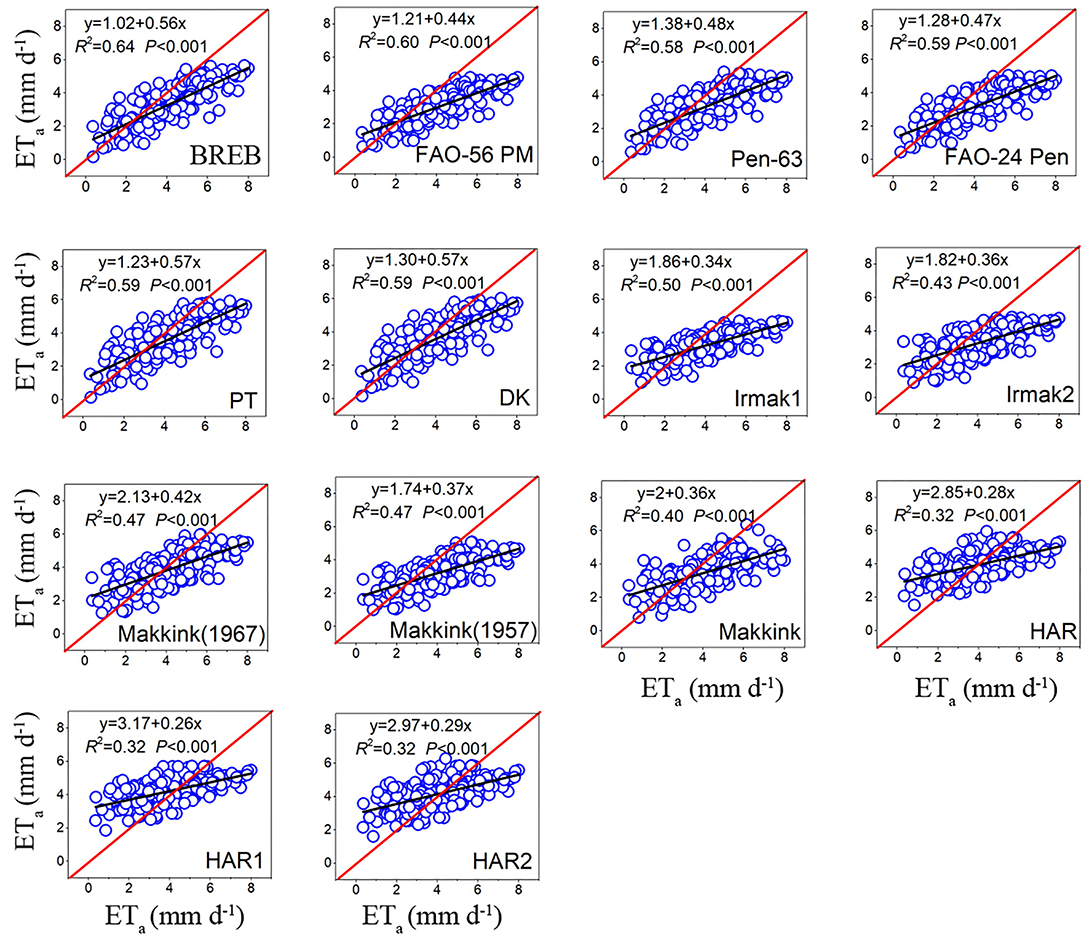
Figure 5. The relationship between daily ET0 of model estimates and ETa of lysimeter measurements during the growing season (data points = 181).
TABLE 4
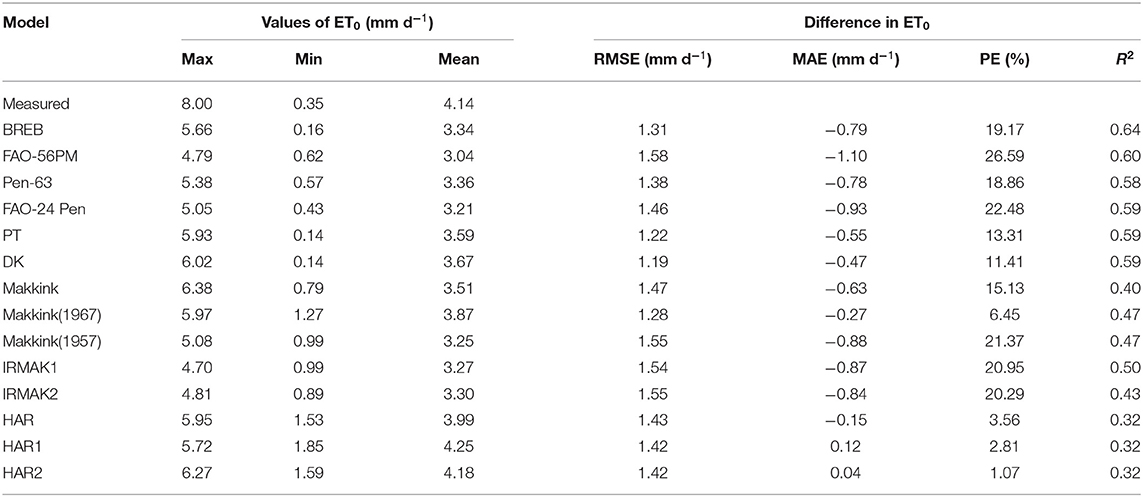
Table 4. Summary of statistics for daily ET0 between lysimeter measurements and model estimates during the growing season (data points = 189).
The RMSE of BREB was 1.31, the RMSE for combination models ranged from 1.38 to 1.58 mm day−1 and averaged 1.47 mm day−1, the RMSE for radiation-based models ranged from 1.19 to 1.55 mm day−1 and averaged 1.40 mm day−1, and the RMSE for temperature-based models ranged from 1.42 to 1.43 mm day−1 and averaged 1.42 mm day−1 (Table 4). Based on the RMSE values, the performance of the fourteen evapotranspiration models followed the order: DK (1.19) > PT (1.22)> Makkink (1967) (1.28) > BREB (1.31) > Pen-63 (1.38) > HAR1 (1.42) > HAR2 (1.42)> HAR (1.43) > FAO-24 Pen (1.46) > Makkink (1.47) > IRMAK1 (1.54) > Makkink (1957) (1.55) > IRMAK2 (1.55) > PM-56 (1.58). Evidently, the best DK was 25% more accurate than the poorest (FAO-56). Overall, for the growing season period, the BREB yielded the best performance, followed by the radiation-based, temperature-based, and combination models.
Comparison of Daily Evapotranspiration Between Reference Evapotranspiration Models and Lysimeter Measurements During the Nongrowing Season
During the nongrowing season, the daily ET0 calculated by the fourteen evapotranspiration equations was also significantly correlated with the lysimeter measurements ETa (P < 0.01), but with lower coefficients of determination (R2) ranging from 0.17 to 0.64 (Figure 6, Table 5). Of the combination models, FAO-24 Pen obtained the highest R2 (0.28), followed by Pen-63 (0.25) and PM-56 (0.21). Of the radiation-based models, PT and DK obtained the highest R2 (0.34), followed by Makkink (1967) (0.27), Makkink (1957) (0.27), Makkink (0.26), IRMAK1 (0.26), and IRMAK2 (0.23). Among the temperature-based models, HAR had the highest R2-value (0.19). Interestingly, all models (except BREB) generally overestimated the ETa values measured by lysimeter during the nongrowing season, with MBEs ranging from 0.40 to 1.20 mm day−1 and averaging 0.78 mm day−1; Makkink (1967) yielded the largest underestimate (by 185.83%) and PT the minimum underestimate (by 61.06%) (Table 5).
FIGURE 6
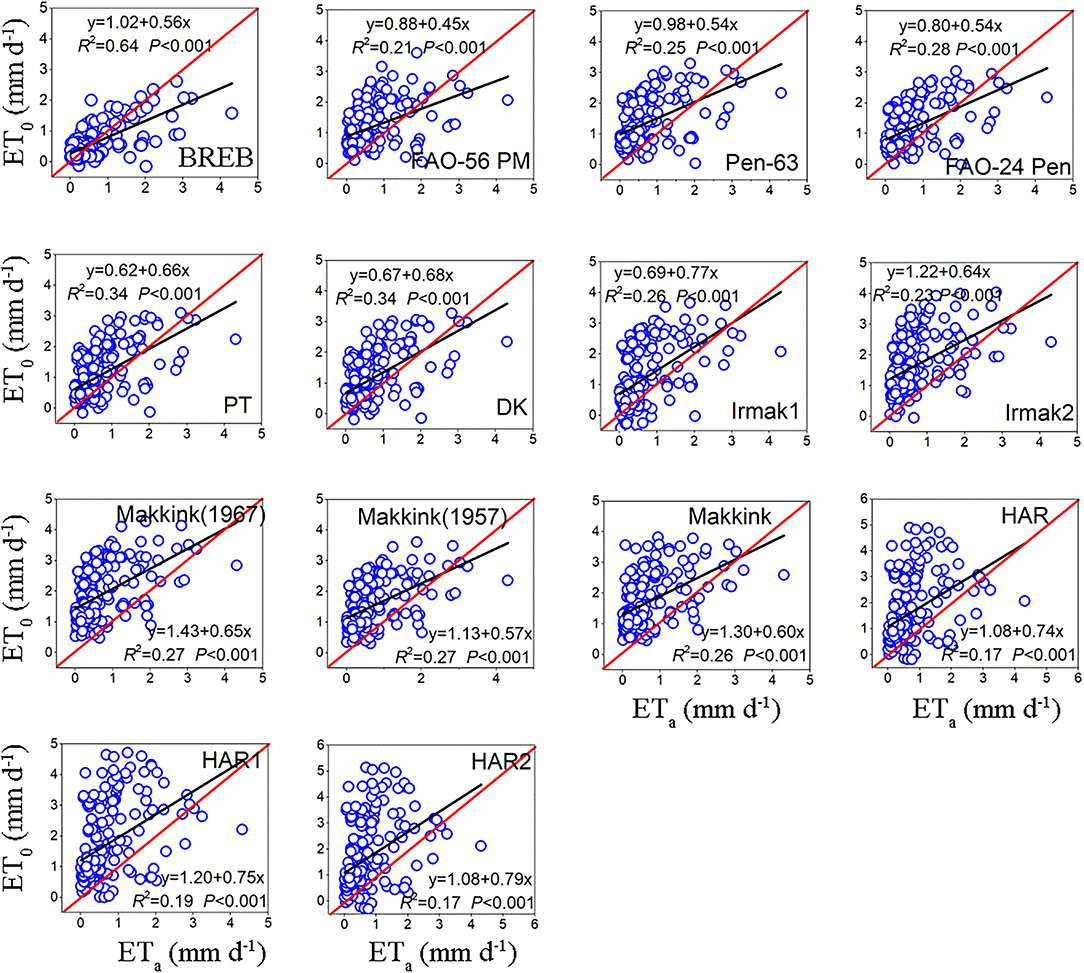
Figure 6. The relationship between daily ET0 of model estimates and ETa of lysimeter measurements during the nongrowing season (data points = 143).
TABLE 5
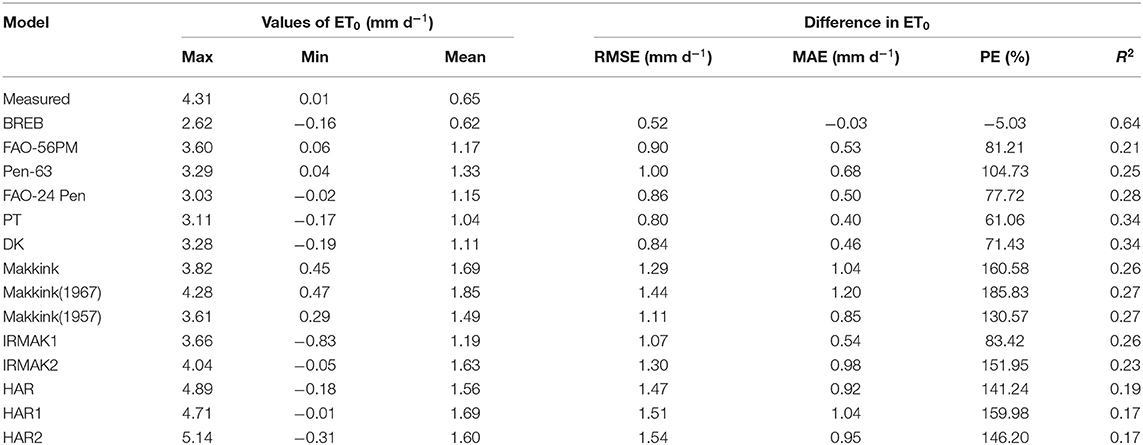
Table 5. Summary of statistics for daily ET0 between lysimeter measurements and model estimates during the nongrowing season (data points = 204).
The RMSE of BREB was 0.52, the RMSE for combination models ranged from 0.86 to 1.00 mm day−1 and averaged 0.92 mm day−1, the RMSE for radiation-based models ranged from 0.80 to 1.44 mm day−1 and averaged 1.12 mm day−1, and the RMSE for temperature-based models ranged from 1.47 to 1.54 mm day−1 and averaged 1.50 mm day−1. Based on the RMSE, the ET0 model performance decreased in the following order: BREB (0.52) > PT (0.80) > DK (0.84) > FAO-24 Pen (0.86) > PM-56 (0.90) > Pen-63 (1.00) > IRMAK1 (1.07) > Makkink (1957) (1.11) > Makkink (1.29) > IRMAK2 (1.30)> Makkink (1967) (1.44) > HAR (1.47)>HAR1 (1.51) > HAR2 (1.54). Evidently, the best model was 66.24% more accurate than the poorest model (HAR2). Overall, for the nongrowing season period, the BREB yielded the best performance, followed by the combination, radiation-based, and temperature-based models.
Comparison of Monthly Averaged Daily Evapotranspiration Between Reference Evapotranspiration Models and Lysimeter Measurements
The fourteen evapotranspiration model estimations were consistent with the pattern observed in the lysimeter measurements (Figure 7), with a peak in July. As already noted, the combination models and BREB underestimated the measurements from May to September and overestimated those in the other months (Figures 7A,B). The radiation-based models underestimated the measurements from June to September and overestimated those in the other months (Figure 7C). However, the temperature-based models generally overestimated the measured evapotranspiration during most months (except for July and August) (Figure 7D). Overall, all models tended to underestimate the measured ETa during the growing season (with larger evaporative demand) and overestimated ETa during the nongrowing season (with reduced evaporative demand).
FIGURE 7
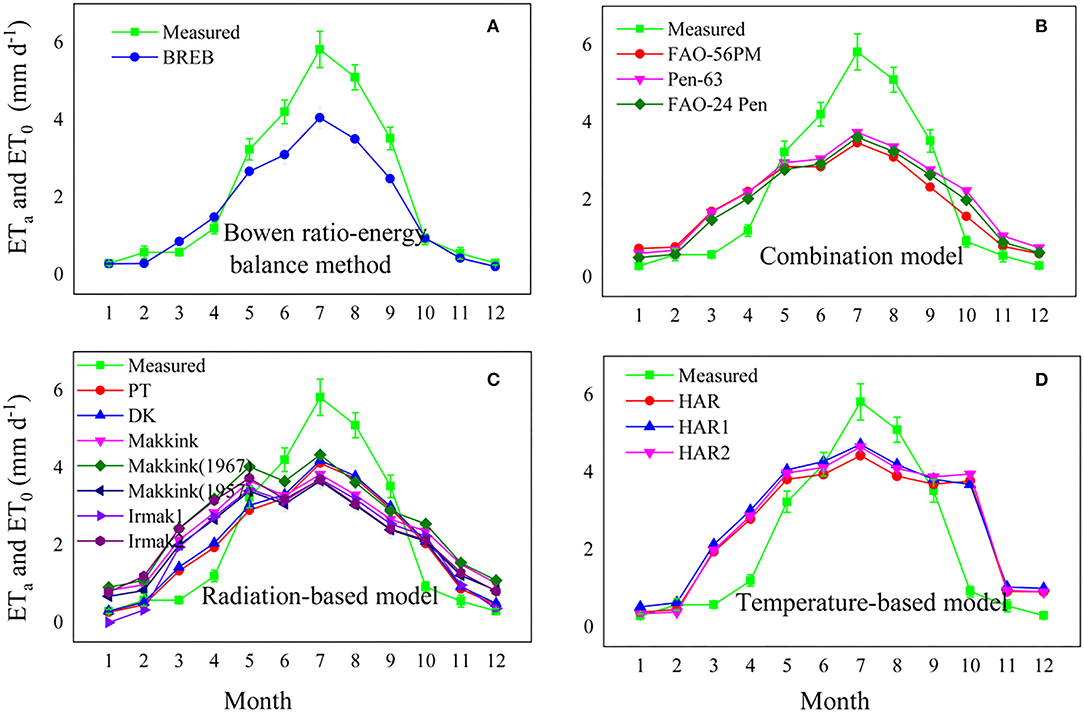
Figure 7. Comparison of monthly mean daily evapotranspiration between lysimeter measurements and model estimates, (A) Bowen ratio energy balance method, (B) combination model, radiation based model (C), and temperature-based model (D).
Dominant Factors Affecting the Seasonal Variation in Lysimeter ETa Measurements
The BRT model indicated that Rn was the dominant factor controlling the seasonal variation in measured ETa throughout the study period, accounting for 69.02% of the total variability, followed by VPD (7.13%), T (6.75%), RH (5.73%), Ra (5.15%), Rs (4.33%), and WS (1.85%) (Figure 8a). During the growing season, Rn remained the main control of seasonal variation in measured ETa (Figure 8b), accounting for 44.30% of the total variability, followed by T (14.12%), Rs (12.56%), Ra (8.34%), RH (7.80%), VPD (6.87%), and WS (6.02%). However, the seasonal variation in the measured ETa in the nongrowing season was dominated by RH (Figure 8c), accounting for 27.99% of the total variability, followed by Rn (20.99%), Ra (12.96%), VPD (12.56%), T (10.18%), Rs (9.39), and WS (5.94%) (Figure 8).
FIGURE 8
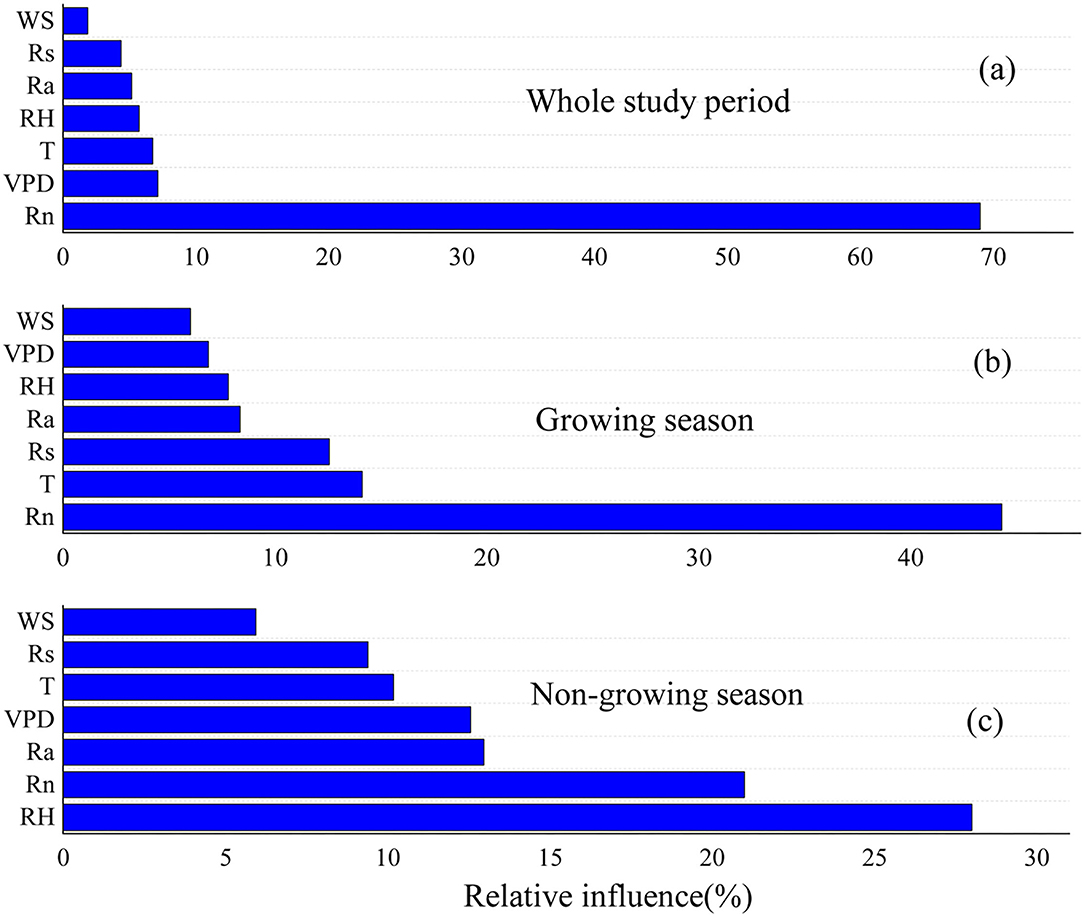
Figure 8. The relative influence of meteorological factors on ETa during whole study period (a), growing season (b), and non-growing season (c). WS, wind speed; TD, the difference value between maximum air temperature and the minimum air temperature; G, soil heat flux; Ra, extraterrestrial solar radiation; Rs, total radiation; VPD, vapor pressure deficit; RH, relatively humid; T, mean air temperature; Rn, net radiation.
Discussion
Performance Comparison of Combination Models Against Lysimeter Measurements
Given that the evapotranspiration in our study was not limited by soil water conditions and the plant height was 8–12 cm, actively growing, and completely shading the ground, which is close to the definition of ET0, we thus assumed that ETa was comparable to ET0 during the growing season, with the aim of selecting the best fit model over a humid alpine meadow on the northeastern QTP to estimate ET0. Previous studies have shown that the Penman family models are generally the most accurate when evaluating ET0 across various climate scenarios and regions (Liu et al., 2017). Of the Penman models for ET0, the PM-56 has been considered the standard equation for estimating evapotranspiration (Allen et al., 1998). For instance, Yoder et al. (2005) found that PM-56 displayed the best performance in the humid southeast United States. López-Urrea et al. (2006) tested seven evapotranspiration equations using lysimeter observations in a semiarid climate and found that the PM-56 equation was the most precise method compared with other evapotranspiration equations. Unlike previous studies, the PM-56 model was not the best in our study; we found that Pen-63 and FAO-24 Pen were more accurate (Pen-63 and FAO-24 Pen had smaller RMSE than PM-56 throughout the study period). Similar results have been reported in other studies (Berengena and Gavilán, 2005; Martel et al., 2018). A more recent study also reported the poor performance of PM-56 when compared with data from 20 FLUXNET towers (Ershadi et al., 2014). These results suggest that PM-56 might not be the only standard model for evaluating ET0 because it did not yield better accuracy than the other Penman models. Given the better performance of Pen-63 and FAO-24 than PM-56 in this study, we may apply old Penman family models to our study region, especially considering that the PM-56 requires many meteorological inputs, which limits its use in areas with sparse data, especially in harsh environments (Tabari et al., 2012). Overall, the poor performance of PM-56 may be attributed to the higher aerodynamic resistance (rs), and there is increasing evidence indicating that PM-56 underestimation is related to the fixed rs = 70 s m−1 in the equation, which may be too large (Liu et al., 2017). This result was also confirmed by our results that the values of RMSE increased from 1.22 to 1.29 mm day−1 as rs changed from 20 to 60 s m−1, and the RMSE was nearly unchanged (from 1.12 to 1.13 mm day−1) when rs varied between 0 and 20 s m−1 (Figure 4). Therefore, reducing the value of rs from 70 to 0–20 s m−1 can improve daily PM-56 estimates. Other studies also found that rs should be a variable rather than a fixed value (Allen et al., 2006; Liu et al., 2017). For instance, rs should be smaller when the result is underestimated and should be larger when it is overestimated (Ventura et al., 1999).
Performance Comparison of Radiation and Temperature Models Against Lysimeter Measurements
For the performance comparison of radiation models against lysimeter measurements, we found that the PT models yielded the best performance of the radiation-based models, which was consistent with a previous study conducted in humid areas where the PT method yielded a good accuracy estimate for ET0 (Ershadi et al., 2014). There is increasing evidence indicating that the input parameters are the dominant factors affecting their performance (Lang et al., 2017), and we conclude that the better performance of the PT models might be associated with the most important meteorological factors affecting ET, such as Rn, which is supported by our results (Figure 8). Compared with the PT method, other radiation models that use Rs as the main driving variable may overestimate ET0 due to the reduction in Rs through atmospheric reflection in this region (Zhang et al., 2018). Furthermore, each model was developed based on its specific underlying surface and climatic conditions. For instance, the PT model was established in a humid climate condition, which is suitable for a humid alpine meadow in the northeastern QTP. Most importantly, the PT models require fewer meteorological inputs than the combination models. However, given that the ETa was mainly limited by available radiation (i.e., Rn-G), the structures of the PT and DK models both included available radiation items. Combining these factors, we recommend the PT and DK models for use in humid alpine meadows in the northeastern QTP, especially when considering the difficulty in obtaining evapotranspiration in this harsh climate.
For the performance comparison of temperature models against lysimeter measurements, a previous study reported that the Hargreaves equation is one of the simplest empirical methods used for ET0 estimation because of its lower meteorological data input, including some meteorological data required in the standard PM-56 model (Jensen et al., 1990). To further select the best Hargreaves version equation, we compared the performance of the original (HAR) and two modified versions (HAR1 and HAR2) and found that the original HAR model had the lowest error (RMSE = 1.47 mm day−1, MAE = 0.40 mm day−1, and PE = 17.37%), which was consistent with previous studies conducted in humid regions (Tabari, 2010) but contrasted to studies conducted in arid regions in which the modified Hargreaves equation displayed a more accurate estimation of evapotranspiration (Ravazzani et al., 2012). Overall, the temperature models displayed poor performance compared with radiation models because the Hargreaves method was established in semiarid areas (Tabari, 2010). Furthermore, the structure of temperature models missing the most important parameter (i.e., Rn) results in poor performance compared with radiation models. Therefore, a local calibration is required to improve the Hargreaves method accuracy in nonarid regions.
Performance Comparison of All Models
By comparing the four model types, we found that the BREB yielded the best performance, followed by the combination, radiation-based, and temperature-based models (Table 3). Overall, most radiation-based models underestimated the measured ETa throughout the study period, whereas the temperature-based models tended to overestimate ETa. This was consistent with previous studies in which the Makkink and PT models generally underestimated ETa (Priestley and Taylor, 1972; Xu and Singh, 2002), while the Hargreaves equations often overestimated ETa in cold-humid conditions and required local calibration (Berti et al., 2014). Given that our study region was a humid alpine meadow, ETa tended to be overestimated. An alternative explanation for the poor Hargreaves model performance in humid regions may be that the Hargreaves method was established in semiarid areas (Tabari, 2010), and the Ra parameter used in the Hargreaves model structure was based on the maximum possible radiation value and does not consider the atmospheric transmissivity. However, the atmospheric transmissivity in humid regions is affected by many factors, such as atmospheric moisture; thus, the solar radiation reaching the surface is significantly reduced because of the high atmospheric moisture content (Temesgen et al., 1999), resulting in the overestimation of solar radiation, ultimately leading to an overestimation of evapotranspiration using the Hargreaves method.
Furthermore, there were common features in all four groups of models. All the models tended to underestimate the measured ETa during the growing season (with larger evaporative demand) and overestimated ETa during the nongrowing season (with reduced evaporative demand), which was consistent with a previous study conducted in a semiarid region (Liu et al., 2017). The underestimated measured ETa during the growing season may be related to the ETa in alpine meadows under strongly energy-limited conditions rather than soil water content during the growing season; thus, higher solar radiation could lead to a higher ETa during the growing season (Zhang et al., 2018). Therefore, both the Hargreaves equations and other models require further local or regional calibration before being applied to a given region (Xu and Singh, 2002). It should also be noted that the data used in this study were obtained from 1 year and a single weather station, which may be insufficient to represent the whole humid climate or the alpine ecosystem but represent only a humid alpine meadow in the northeastern QTP. Thus, a longer period and more lysimeter systems should be used in the alpine ecosystem in the future to obtain more accurate estimates of evapotranspiration over humid alpine meadows in the northeastern QTP.
Conclusion
This study is the first to document information on the comparison of fourteen evapotranspiration models against lysimeter measurements in a humid alpine meadow, northeastern Qinghai-Tibetan Plateau, and we found that the BREB method performed the best, followed by combination models, radiation-based models, and temperature-based models. Furthermore, all models tended to underestimate ETa during the growing season and overestimate ETa during the nongrowing season, suggesting that these models should be calibrated or modified by local lysimeter data when extrapolated to other regions. Besides, the 1963 Penman and FAO-24 Penman models demonstrated better performances than recommended FAO-56 PM, suggesting that older Penman equations may superior to the standard FAO-56 PM model. Given the outstanding performance of Priestley–Taylor model owing to its most important factors affecting ETa (Rn), which require few meteorological inputs, we thus recommend that these two models can be used in the humid alpine meadow on the northeastern Qinghai-Tibetan Plateau. Our result could provide new insights for the accurate assessment of evapotranspiration in the alpine ecosystem.
Data Availability Statement
The original contributions presented in the study are included in the article/supplementary material, further inquiries can be directed to the corresponding authors.
Author Contributions
LD and XG performed the research, analyzed data, and wrote the manuscript. RF, ZZ, ZH, and YD analyzed data. GC conceived the study. All authors contributed to the article and approved the submitted version.
Funding
This study was supported by the National Natural Science Foundation of China (41730752) and the Natural Science Foundation of Qinghai (2021-HZ-811). Start-up funding from Hainan University (KYQD(ZR)-22085). Start-up funding from Hainan University (KYQD(ZR)-22085).
Conflict of Interest
The authors declare that the research was conducted in the absence of any commercial or financial relationships that could be construed as a potential conflict of interest.
Publisher's Note
All claims expressed in this article are solely those of the authors and do not necessarily represent those of their affiliated organizations, or those of the publisher, the editors and the reviewers. Any product that may be evaluated in this article, or claim that may be made by its manufacturer, is not guaranteed or endorsed by the publisher.
References
Allen, R. G., Pereira, L. S., Raes, D., and Smith, M. (1998). Crop Evapotranspiration-Guidelines for Computing Crop Water Requirements-FAO Irrigation and Drainage Paper 56. Rome: FAO.
Allen, R. G., Pruitt, W. O., Wright, J. L., Howell, T. A., Ventura, F., Snyder, R., et al. (2006). A recommendation on standardized surface resistance for hourly calculation of reference ETo by the FAO56 Penman-Monteith method. Agric. Water Manage. 81, 1–22. doi: 10.1016/j.agwat.2005.03.007
Berengena, J., and Gavilán, P. (2005). Reference evapotranspiration estimation in a highly advective semiarid environment. J. Irrigat. Drainage Eng. 131, 147–163. doi: 10.1061/(ASCE)0733-9437(2005)131:2(147)
Berti, A., Tardivo, G., Chiaudani, A., Rech, F., and Borin, M. (2014). Assessing reference evapotranspiration by the Hargreaves method in north-eastern Italy. Agric. Water Manage. 140, 20–25. doi: 10.1016/j.agwat.2014.03.015
Cai, J., Liu, Y., Lei, T., and Pereira, L. S. (2007). Estimating reference evapotranspiration with the FAO Penman–Monteith equation using daily weather forecast messages. Agric. Forest Meteorol. 145, 22–35. doi: 10.1016/j.agrformet.2007.04.012
Cao, J., Li, Y., Liu, X., Zhong, X., and Zhao, Y. (2015). Comparison of four combination methods for reference crop evapotranspiration. Chinese J. Agrometeorol. 36, 428–436. doi: 10.1016/j.agwat.2017.01.017
Dai, L., Fu, R., Guo, X., Ke, X., Du, Y., Zhang, F., et al. (2021). Evaluation of actual evapotranspiration measured by large-scale weighing lysimeters in a humid alpine meadow, northeastern Qinghai-Tibetan Plateau. Hydrol. Processes 35, e14051. doi: 10.1002/hyp.14051
Dai, L., Guo, X., Du, Y., Zhang, F., Ke, X., Cao, Y., et al. (2019a). The response of shallow groundwater levels to soil freeze–thaw process on the qinghai-tibet plateau. Groundwater 57, 602–611. doi: 10.1111/gwat.12832
Dai, L., Guo, X., Zhang, F., Du, Y., Ke, X., Li, Y., et al. (2019b). Seasonal dynamics and controls of deep soil water infiltration in the seasonally-frozen region of the Qinghai-Tibet plateau. J. Hydrol. 571, 740–748. doi: 10.1016/j.jhydrol.2019.02.021
Doorenbos, J., and Pruitt, W. O. (1977). Crop Water Requirements. FAO Irrigation and Drainage, paper no. 24 (rev.). Rome: FAO.
Elith, J., Leathwick, J. R., and Hastie, T. (2008). A working guide to boosted regression trees. J. Anim. Ecol. 77, 802–813. doi: 10.1111/j.1365-2656.2008.01390.x
Ershadi, A., McCabe, M., Evans, J. P., Chaney, N. W., and Wood, E. F. (2014). Multi-site evaluation of terrestrial evaporation models using FLUXNET data. Agric. Forest Meteorol. 187, 46–61. doi: 10.1016/j.agrformet.2013.11.008
Hargreaves, G. H., and Samani, Z. A. (1985). Reference crop evapotranspiration from temperature. Appl. Eng. Agric. 1, 96–99. doi: 10.13031/2013.26773
Irmak, A., and Irmak, S. (2008). Reference and crop evapotranspiration in South Central Nebraska. II: Measurement and estimation of actual evapotranspiration for corn. J. Irrigat. Drainage Eng. 134, 700–715. doi: 10.1061/(ASCE)0733-9437(2008)134:6(700)
Irmak, S., Allen, R., and Whitty, E. (2003). Daily grass and alfalfa-reference evapotranspiration estimates and alfalfa-to-grass evapotranspiration ratios in Florida. J. Irrigat. Drainage Eng. 129, 360–370. doi: 10.1061/(ASCE)0733-9437(2003)129:5(360)
Irmak, S., Howell, T., Allen, R., Payero, J., and Martin, D. (2005). Standardized ASCE Penman-Monteith: impact of sum-of-hourly vs. 24-hour timestep computations at reference weather station sites. Trans. ASAE 48, 1063–1077. doi: 10.13031/2013.18517
Jensen, M. E., Burman, R. D., and Allen, R. G. (1990). Evapotranspiration and Irrigation Water Requirements. New York, NY: ASCE.
Jia, X., Dukes, M. D., Jacobs, J. M., and Irmak, S. (2006). Weighing lysimeters for evapotranspiration research in a humid environment. Trans. ASABE 49, 401–412. doi: 10.13031/2013.20414
Kiefer, M. T., Andresen, J. A., Doubler, D., and Pollyea, A. (2019). Development of a gridded reference evapotranspiration dataset for the Great Lakes region. J. Hydrol. 24, 100606. doi: 10.1016/j.ejrh.2019.100606
Lang, D., Zheng, J., Shi, J., Liao, F., Ma, X., Wang, W., et al. (2017). A comparative study of potential evapotranspiration estimation by eight methods with FAO penman–monteith method in Southwestern China. Water 9, 734. doi: 10.3390/w9100734
Liu, X., Xu, C., Zhong, X., Li, Y., Yuan, X., and Cao, J. (2017). Comparison of 16 models for reference crop evapotranspiration against weighing lysimeter measurement. Agric. Water Manage. 184, 145–155. doi: 10.1016/j.gwat.2017.01.017
López-Urrea, R., Martín de Santa Olalla, F., Fabeiro, C., and Moratalla, C. A. (2006). Testing evapotranspiration equations using lysimeter observations in a semiarid climate. Agric. Water Manage. 85, 15–26. doi: 10.1016/j.agwat.2006.03.014
Makkink, G. F. (1957). Testing the Penman formula by means of lysimeters. J. Instit. Water Eng. 11, 277–288.
Martel, M., Glenn, A., Wilson, H., and Kröbel, R. (2018). Simulation of actual evapotranspiration from agricultural landscapes in the Canadian Prairies. J. Hydrol. 15, 105–118. doi: 10.1016/j.ejrh.2017.11.010
Novick, K., Oren, R., Stoy, P., Juang, J. Y., Siqueira, M., and Katul, G. (2009). The relationship between reference canopy conductance and simplified hydraulic architecture. Adv. Water Resour. 32, 809–819. doi: 10.1016/j.advwatres.2009.02.004
Penman, H. (1963). Vegetation and Hydrology Tech. Comm. No 53. Commonwealth Bureau of Soils. Harpenden, 125.
Priestley, C. H. B., and Taylor, R. (1972). On the assessment of surface heat flux and evaporation using large-scale parameters. Monthly Weather Rev. 100, 81–92. doi: 10.1175/1520-0493(1972)100<0081:OTAOSH>2.3.CO;2
R Development Core Team. (2006). R: A Language and Environment for Statistical Computing. Vienna: R foundation for statistical computing.
Ravazzani, G., Corbari, C., Morella, S., Gianoli, P., and Mancini, M. (2012). Modified Hargreaves-Samani equation for the assessment of reference evapotranspiration in Alpine river basins. J. Irrigat. Drainage Eng. 138, 592–599. doi: 10.1061/(ASCE)IR.1943-4774.0000453
Sabziparvar, A.-A., and Tabari, H. (2010). Regional estimation of reference evapotranspiration in arid and semiarid regions. J. Irrigat. Drainage Eng. 136, 724–731. doi: 10.1061/(ASCE)IR.1943-4774.0000242
Sentelhas, P. C., Gillespie, T. J., and Santos, E. A. (2010). Evaluation of FAO Penman–Monteith and alternative methods for estimating reference evapotranspiration with missing data in Southern Ontario, Canada. Agric. Water Manage. 97, 635–644. doi: 10.1016/j.agwat.2009.12.001
Si, J., Feng, Q., Zhang, X. Y., Liu, W., Su, Y. H., and Zhang, Y. W. (2005). Growing season evapotranspiration from Tamarix ramosissima stands under extreme arid conditions in northwest China. Environ. Geol. 48, 861–870. doi: 10.1007/s00254-005-0025-z
Sun, G., Alstad, K., Chen, J., Chen, S., Ford, C. R., Lin, G., et al. (2011). A general predictive model for estimating monthly ecosystem evapotranspiration. Ecohydrology 4, 245–255. doi: 10.1002/eco.194
Tabari, H. (2010). Evaluation of reference crop evapotranspiration equations in various climates. Water Resour. Manage. 24, 2311–2337. doi: 10.1007/s11269-009-9553-8
Tabari, H., Kisi, O., Ezani, A., and Talaee, P. H. (2012). SVM, ANFIS, regression and climate based models for reference evapotranspiration modeling using limited climatic data in a semi-arid highland environment. J. Hydrol. 444, 78–89. doi: 10.1016/j.jhydrol.2012.04.007
Tabari, H., and Talaee, P. H. (2011). Local calibration of the hargreaves and priestley-taylor equations for estimating reference evapotranspiration in arid and cold climates of iran based on the penman-monteith model. J. Hydrol. Eng. 16, 837–845. doi: 10.1061/(ASCE)HE.1943-5584.0000366
Temesgen, B., Allen, R., and Jensen, D. (1999). Adjusting temperature parameters to reflect well-watered conditions. J. Irrigat. Drainage Eng. 125, 26–33. doi: 10.1061/(ASCE)0733-9437(1999)125:1(26)
Trajkovic, S. (2009). Comparison of radial basis function networks and empirical equations for converting from pan evaporation to reference evapotranspiration. Hydrol. Processes 23, 874–880. doi: 10.1002/hyp.7221
Trajkovic, S., Gocic, M., Pongracz, R., and Bartholy, J. (2019). Adjustment of Thornthwaite equation for estimating evapotranspiration in Vojvodina. Theor. Appl. Climatol. 138, 1231–1240. doi: 10.1007/s00704-019-02873-1
Valipour, M. (2015). Retracted: comparative evaluation of radiation-based methods for estimation of potential evapotranspiration. J. Hydrol. Eng. 20, 04014068. doi: 10.1061/(ASCE)HE.1943-5584.0001066
Ventura, F., Spano, D., Duce, P., and Snyder, R. L. (1999). An evaluation of common evapotranspiration equations. Irrigat. Sci. 18, 163–170. doi: 10.1007/s002710050058
Xu, C.-Y., and Singh, V. (2002). Cross comparison of empirical equations for calculating potential evapotranspiration with data from Switzerland. Water Resour. Manage. 16, 197–219. doi: 10.1023/A:1020282515975
Yoder, R., Odhiambo, L. O., and Wright, W. C. (2005). Evaluation of methods for estimating daily reference crop evapotranspiration at a site in the humid southeast United States. Appl. Eng. Agric. 21, 197–202. doi: 10.13031/2013.18153
Zhang, F., Li, H., Wang, W., Li, Y., Lin, L., Guo, X., et al. (2018). Net radiation rather than surface moisture limits evapotranspiration over a humid alpine meadow on the northeastern Qinghai-Tibetan Plateau. Ecohydrology 11, e1925. doi: 10.1002/eco.1925
Keywords: reference evapotranspiration, alpine meadow, lysimeter measurement, combination models, radiation-based models, temperature-based models
Citation: Dai L, Fu R, Zhao Z, Guo X, Du Y, Hu Z and Cao G (2022) Comparison of Fourteen Reference Evapotranspiration Models With Lysimeter Measurements at a Site in the Humid Alpine Meadow, Northeastern Qinghai-Tibetan Plateau. Front. Plant Sci. 13:854196. doi: 10.3389/fpls.2022.854196
Received: 13 January 2022; Accepted: 25 March 2022;
Published: 27 April 2022.
Edited by:
Gao-Lin Wu, Northwest A&F University, ChinaReviewed by:
Mauricio Andres Zuñiga, Center for Research and Transfer in Irrigation and Agroclimatology (CITRA), ChileLi Zongxing, Northwest Institute of Eco-Environment and Resources, Chinese Academy of Sciences (CAS), China
Copyright © 2022 Dai, Fu, Zhao, Guo, Du, Hu and Cao. This is an open-access article distributed under the terms of the Creative Commons Attribution License (CC BY). The use, distribution or reproduction in other forums is permitted, provided the original author(s) and the copyright owner(s) are credited and that the original publication in this journal is cited, in accordance with accepted academic practice. No use, distribution or reproduction is permitted which does not comply with these terms.
*Correspondence: Licong Dai, icongdai1993@163.com; Xiaowei Guo, xwguo1206@163.com