 Xiangru Qu1†Jiajun Liu1†Xinlin Xie1Qiang Xu1Huaping Tang1Yang Mu1
 Zhien Pu2Yang Li2
 Jun Ma3
 Yutian Gao3
 Qiantao Jiang1
 Yaxi Liu1Guoyue Chen1
 Jirui Wang1
 Pengfei Qi1
 Ahsan Habib4
 Yuming Wei1
 Youliang Zheng1
 Xiujin Lan1*
 Jian Ma1*
- 1State Key Laboratory of Crop Gene Exploration and Utilization in Southwest China, Triticeae Research Institute, Sichuan Agricultural University, Chengdu, China
- 2College of Agronomy, Sichuan Agricultural University, Chengdu, China
- 3College of Agronomy and Biotechnology, China Agricultural University, Beijing, China
- 4Biotechnology and Genetic Engineering Discipline, Khulna University, Khulna, Bangladesh
Kernel size (KS) and kernel weight play a key role in wheat yield. Phenotypic data from six environments and a Wheat55K single-nucleotide polymorphism array–based constructed genetic linkage map from a recombinant inbred line population derived from the cross between the wheat line 20828 and the line SY95-71 were used to identify quantitative trait locus (QTL) for kernel length (KL), kernel width (KW), kernel thickness (KT), thousand-kernel weight (TKW), kernel length–width ratio (LWR), KS, and factor form density (FFD). The results showed that 65 QTLs associated with kernel traits were detected, of which the major QTLs QKL.sicau-2SY-1B, QKW.sicau-2SY-6D, QKT.sicau-2SY-2D, and QTKW.sicau-2SY-2D, QLWR.sicau-2SY-6D, QKS.sicau-2SY-1B/2D/6D, and QFFD.sicau-2SY-2D controlling KL, KW, KT, TKW, LWR, KS, and FFD, and identified in multiple environments, respectively. They were located on chromosomes 1BL, 2DL, and 6DS and formed three QTL clusters. Comparison of genetic and physical interval suggested that only QKL.sicau-2SY-1B located on chromosome 1BL was likely a novel QTL. A Kompetitive Allele Specific Polymerase chain reaction (KASP) marker, KASP-AX-109379070, closely linked to this novel QTL was developed and used to successfully confirm its effect in two different genetic populations and three variety panels consisting of 272 Chinese wheat landraces, 300 Chinese wheat cultivars most from the Yellow and Huai River Valley wheat region, and 165 Sichuan wheat cultivars. The relationships between kernel traits and other agronomic traits were detected and discussed. A few predicted genes involved in regulation of kernel growth and development were identified in the intervals of these identified major QTL. Taken together, these stable and major QTLs provide valuable information for understanding the genetic composition of kernel yield and provide the basis for molecular marker–assisted breeding.
Introduction
Common wheat (Triticum aestivum L. 2n = 6x = 42, AABBDD) is a widely grown cereal crop that provides energy and nutrition for human life. According to the statistics of the Food and Agriculture Organization, the annual yield of wheat must increase 1.6% to ensure the food demand of 9.1 billion people in the world by 2050 (Patil et al., 2013). With the increase of world population and the decrease of the planting area, increasing food production is of great strategic significance for solving future food supply and security issues.
The kernel-related traits can be divided into a number of components including thousand-kernel weight (TKW), kernel length (KL), kernel width (KW), kernel thickness (KT), kernel length–width ratio (LWR), kernel size (KS), and factor form density (FFD). Larger kernels have a positive influence on the vigor of wheat seedlings and yield increasing (Börner et al., 2002) and also give a beneficial effect on agronomic values and flour yield (Chastian et al., 1995). TKW was accompanied by a high heritability (Alexander et al., 1984), and KS usually influences TKW to promote yield. Therefore, improving KS and TKW is a prior breeding goal to enhance wheat yield and quality.
In recent years, kernel-related traits have received widespread attention in molecular genetics. Quantitative trait locus (QTL) mapping based on molecular markers has been widely used in the study of kernel traits of rice (Agrama et al., 2007; Huang et al., 2012), wheat (Sun et al., 2009; Ramya et al., 2010), maize (Yang et al., 2016; Lan et al., 2018), and other major crops. Genes controlling kernel traits were identified in diploid plant species such as Arabidopsis thaliana and rice (Hu et al., 2018; Xia et al., 2018; Ying et al., 2018). With the fast development of molecular biotechnology and comparative genomics, a large number of genes have been identified to adjust rice kernel shape in previous studies. For example, qGL7 (Bai et al., 2010), Gn1a (Ashikari et al., 2005), GS3 (Fan et al., 2006), qSS7 (Qiu et al., 2012), and GW2 (Song et al., 2007) regulate kernel development, positively or negatively. Several rice orthologs regulating KS and kernel weight in wheat were isolated and identified through homologous cloning technology. For example, TaCwi-1A was involved in the development of kernel size, which was a critical enzyme for sink tissue development and carbon allocation (Ma et al., 2012). TaCKX6-D1 played a major role by controlling cytokinin levels, and its haplotype variants were determined to be significantly associated with TKW (Zhang et al., 2012). GW8 (Yan et al., 2019) was a SQUAMOSA Promoter-Binding Protein-Like (SPL) family transcription factor whose function was similar to GW2 and GW5 genes and played a regulatory role of kernel traits and TKW in wheat (Song et al., 2007; Cheng et al., 2020).
Because of the complexity of wheat genome, genetic research of wheat yield–related traits and their components were mainly focused on QTL mapping and molecular marker development. Recently, numerous QTLs/genes for yield-related traits in wheat have been identified on almost 21 wheat chromosomes (Cui et al., 2014, 2016; Huang et al., 2015; Wu et al., 2015; Brinton et al., 2017; Cao et al., 2019; Sakuma et al., 2019; Chen et al., 2020; Cheng et al., 2020; Ren et al., 2021). However, the effects of QTL in hexaploid wheat were usually subtle than those identified in rice, and few environmental-stable QTLs have been identified and validated (Cristobal, 2017). Therefore, identification of major QTLs and development of effective markers will help accelerate molecular-assisted breeding and thus improve wheat breeding process.
In this study, we identified QTLs for seven kernel-related traits that were stably expressed in six environments. A new Kompetitive Allele Specific Polymerase chain reaction (KASP) marker was developed to further validate a novel QTL for KL (QKL.sicau-2SY-1B). Candidate genes were predicted for the major QTLs of four kernel-related traits. Additionally, we evaluated the correlation between kernel-related traits and other agronomic traits.
Materials and Methods
Plant Materials
A recombinant inbred line (RIL) mapping population developed from the cross between 20828 and SY95-71 (abbreviated as 2SY) containing 126 F7 lines plus parents was used for mapping QTL for kernel-related traits (Liu et al., 2020). The line 20828 (G214-5/3/Chuanyu19//Lang 9247/50788) shows longer kernels than SY95-71 (Figure 1) and has other excellent agronomic traits including multiple spikelets (Ma et al., 2019a) and high resistance to stripe rust (Ma et al., 2019b). SY95-71 (Eronga 83/Fan 6//Fan 6) is a stable line with well-developed root system (Zheng et al., 2019), more tillers (Liu et al., 2020), and better plant type (Tu et al., 2021). These excellent agronomic traits have enabled 20828 and SY95-71 to be widely used as a breeding parent in the past few years. Another two populations used for validating the identified QTL were developed with SY95-71 as a common parent, and they were derived from crosses S849-8/SY95-71 (SSY, 214 F5 lines) (Liu et al., 2020) and MTL4-5-3/SY95-71 (MTL4SY, F3 200 lines) (Tu et al., 2021). Seeds of 20828 (ZM030677) and SY95-71 (ZM030678) were submitted to the Chinese Crop Germplasm Resources Information System hosted by National Germplasm Bank, China (NGBC). S849-8 and MTL4-5-3 were advanced wheat lines that have been used in wheat breeding. In addition, three variety panels were further used to evaluate the effect of the major QTLs, and they were (1) 272 Chinese wheat landraces (CWLs) genotyped by Wheat660K single-nucleotide polymorphism (SNP) array (Zhou et al., 2018); (2) 300 Chinese wheat cultivars (CWCs) collected from different wheat production regions of China, but most from the Yellow and Huai River Valley wheat region genotyped by Wheat55K SNP array (Jin et al., 2020); (3) 165 Sichuan wheat cultivars (SWCs) genotyped by Wheat55K SNP array (Ye et al., 2019). The information of these variety panels is listed in Supplementary Table 1.
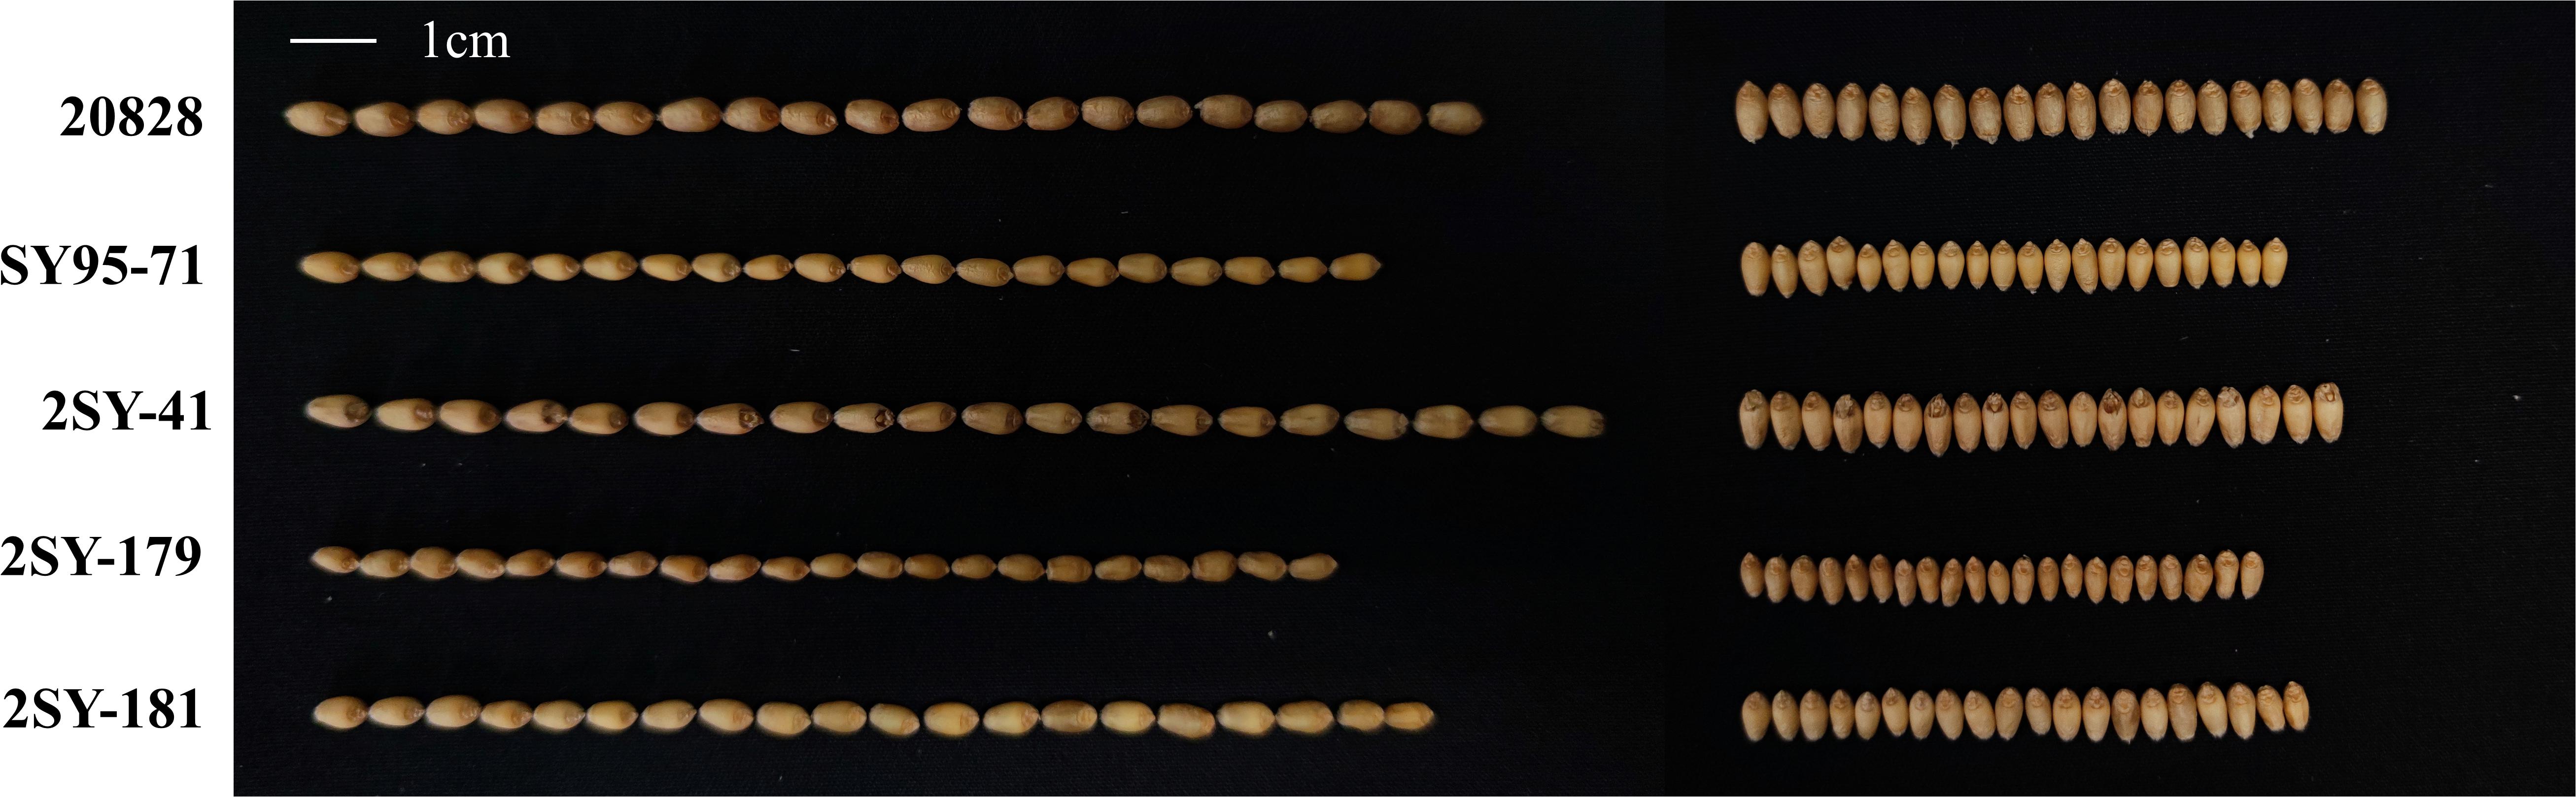
Figure 1. Kernel phenotypes of the parent “20828,” “SY95-71,” and partial RILs. The white line represents the scale = 1 cm.
Phenotypic Evaluation
The RILs and parents were planted in six different environments including Chongzhou (103°38′E, 30°32′N) in 2017, 2018, and 2019 (2017CZ, 2018CZ and 2019CZ); Ya’an (103°0′E, 29°58′N) in 2017 and 2018 (2017YA and 2018YA); and Wenjiang (103°51’ E, 30°43′ N) in 2019 (2019WJ).
The RILs and parents in all the environments were designed by random blocks. Each line was planted in a single 1.5-m-length row with 0.3 m between rows. The sowing density was 15 seeds per row with 0.1 m between plants within a row. Field management followed conventional practices in wheat production. Five representative and well-pollinated spikes per line were selected and harvested for phenotypic measurement at the maturity stage. The seeds were fully cleaned and dried, and broken grains were removed before trait evaluations. Uniform and full seeds were selected for the measurement of kernel traits. Thirty kernels of each line were scanned by Epson Expression 10,000XL for measuring KL, KW, and KT and further calculated by WinSEEDLE (Regent Instruments Canada Inc.). TKW was calculated as 10-folds of the weight of 100 seeds with electronic balance, and three replicates for each line were set. The LWR was calculated by KL/KW, and the KS was expressed by the product of the KL, width, and thickness (Zhou et al., 2020); the FFD was calculated by TKW/[KL × KW], which describes the differences in kernel density (Prashant et al., 2012). Spikelet number per spike (SNS) was measured by counting the number of spikelets per the main spike; plant height (PH) was measured from the base of the plant to the top of the main spike (awns were not included); productive tiller number (PTN) was calculated as the number of branches that can produce a wheat spike; flag leaf length (FLL) and width (FLW) refer to the longest and widest distance of the first leaf under the wheat spike; spike length (SL) was measured from the base of the main spike to the top of the main spike (awns were not included); and spike density (SD) was calculated by dividing spikelet number by SL. Anthesis date (AD) was measured from the planting date to the date when half the plants in a given line bloom. Among TKW and other agronomic traits, TKW data in 2018 are newly added, and the other data of TKW, PTN, SNS, PH, AD (Liu et al., 2020), SL (Li et al., 2020), FLL, and FLW (Ma et al., 2020) were reported previously (Supplementary Table 2).
The 272 CWLs were planted in six different environments, including 2012YA, 2013-2015WJ, and 2014-2015CZ (Liu et al., 2017). Fifty kernels for each accession were measured by Win-Rhizo Pro 2008a image analysis system. The mean value of each accession in a single environment was used for further analysis (Liu et al., 2017).
The 300 CWCs were planted in three different environments, including Beijing in 2018 and 2019, and Baoding in 2019 (Gao et al., 2021). One hundred twenty seeds of each accession were planted in a single row of 2-m length with 25-cm spacing between the rows in each environment (Gao et al., 2021). The spikes were harvested at physiological maturity. The seeds were manually removed from the spikelet. For the 165 SWCs, 20 seeds of each accession were planted in rows 2 m in length with 30-cm spacing and individual plants spaced 10 cm apart in 2020CZ. The kernel-related traits of 300 Chinese common wheat and 165 SWCs were measured using a Crop Grain Appearance Quality Scanning Machine (SC-A, Hangzhou Wanshen Detection Technology Co., Ltd, Hangzhou, China).
Map Construction and Statistical Analysis
The genetic linkage map utilized in this study was previously constructed by the Wheat55K SNP array. A total of 2,529 bin markers based on 2,517 wheat 55K SNPs and 12 polymerase chain reaction (PCR)–based markers were used to construct the genetic map containing 38 linkage groups in 2SY population. The total length of the genetic map is 4,761.34 cM, the average marker density is 1.88 cM, the minimum value is 0.70 cM, and the maximum value is 5.33 cM (Liu et al., 2020).
The phenotypic differences between parents, Pearson correlation between the seven kernel traits, frequency distributions obtained each year in each environment, and analysis of variance (ANOVA) for major and minor QTLs of each kernel trait with the best linear unbiased prediction (BLUP) value were tested using IBM SPSS Statistic 26 (SPSS, Chicago, IL, United States)1. SAS V8.0 (SAS Institute, Cary, NC, United States) was used for calculating BLUP and broad-sense heritability (H2) for all the investigated traits from different environments. The correlation coefficients of SNS, PH, PTN, FLL, FLW, SL, SD, and AD agronomic traits with kernel-related traits were analyzed using BLUP values of multienvironment phenotypes. The H2 was calculated as follows: H2 = VG/(VG + VGE/r + VE), where VG is genotypic variance; VGE, genotype × environment variance; r, the number of replicates; and VE, environmental variance (Smith et al., 1998).
Bip (QTL mapping in biparental populations) module of QTL IciMapping (version 4.1, based on ICIM)2 was used to detect the kernel traits QTL with values from six single environments and the BLUP dataset. Probability in stepwise regression (PIN) parameter value was 0.001, the step size chosen for all QTLs was 1 cM, and QTLs were claimed to be significantly above the 2.5 logarithm of odds (LOD) threshold. Combined analysis of kernel traits in the multienvironment by using Met (QTL mapping for multienvironmental trials) module of QTL IciMapping. The QTL interval on the genetic map was defined as the genetic distance between the two flanking markers of the QTL peak. Among the QTLs detected in more than three environments with the phenotypic variation, greater than 10% were considered as stable and major QTLs, whereas the rest were considered as secondary QTL.
Nomenclature of QTLs
QTLs were named according to the rules of International Rules of Genetic Nomenclature3.
All QTLs were named as follows: “Q” stands for “QTL,” followed by the letter Q are the abbreviations of the corresponding kernel traits (KL, KW, KT, TKW, LWR, KS, and FFD represent kernel length, kernel width, kernel thickness, thousand-kernel weight, kernel length–width ratio, kernel size, and factor from density, respectively); “sicau” is the abbreviation of “Sichuan Agricultural University,” and “2SY” stands for the mapping populations name used in this study; the last is the wheat chromosome on which the corresponding QTL is distributed; if more than one QTL for a trait was distributed on the same chromosome, a serial number, viz.1, 2, 3, etc., was used to describe their order after the chromosome name, from the short arm to the long arm.
Comparison of the Physical Intervals for Major QTLs Reported Here and Previously
The physical locations of the flanking markers associated with the major kernel trait QTLs were obtained as described previously (Liu et al., 2020). Previously reported flanking marker sequences of QTL for kernel-related genes were downloaded from NCBI4 and GrainGenes 3.05, and further blasted against the T. aestivum cv. ‘‘Chinese Spring (CS)’’ (IWGSC RefSeq v1.0)6 (International Wheat Genome Sequencing Consortium, 2018) reference genome to obtain their physical locations.
Marker Development and QTL Validation
According to QTL mapping results, we converted SNP marker AX-109379070 closely linked to the new major QTLs of KL into a KASP marker as described previously (Liu et al., 2020). Ninety lines randomly selected from the two validation populations (SSY and MTL4SY), respectively, were used to do genotyping using this KASP marker. The reaction system included 0.75 μL DNA, 2.85 μL deionized water, 5 μL SsoFast EvaGreen mixture (Bio-Rad, Hercules, CA, United States), and 1.4 μL primers (KASP-AX-109379070F: GAAGGTGACCAAGTTCATGCTTGATTTCATGTGATAGCA CC, AX-109379070H: GAAGGTCGGAGTCAACGGATTTGAT TTCATGTGATAGCACT, AX-109379070R: ACCTCCCAAAA ATCGAGGTA). The whole process was carried out on real-time PCR (BioRad, CFX-96) system. The lines were divided into two categories based on the genotype of this KASP marker: (1) lines with homozygous alleles from either of S849-8 and MTL4-5-3 and (2) lines with homozygous alleles from SY95-71.
For three variety panels genotyped by Wheat55K or Wheat660K SNP array in which the flanking marker AX-109379070 was included, the lines were also divided into two categories in each population based on the genotyping results. The BLUP values of KL data from all environments for CWLs and CWCs and average value for SWCs were used to analyze the significant differences between the two categories. Differences between the two categories were analyzed using Student t-test (P < 0.05).
Results
Phenotypic Evaluation
Descriptive statistics for KS and kernel weight in the 2SY population and two parents are presented in Table 1. The KL, KW, KT, TKW, LWR, KS, and FFD of 20828 were significantly higher than SY95-71, except for individual ecological locations (P < 0.05, Figure 1 and Table 1). Phenotypic data for the seven kernel traits in six environments and the BLUP dataset showed a continuous and normal distribution, indicating they were quantitatively inherited (Figure 2).
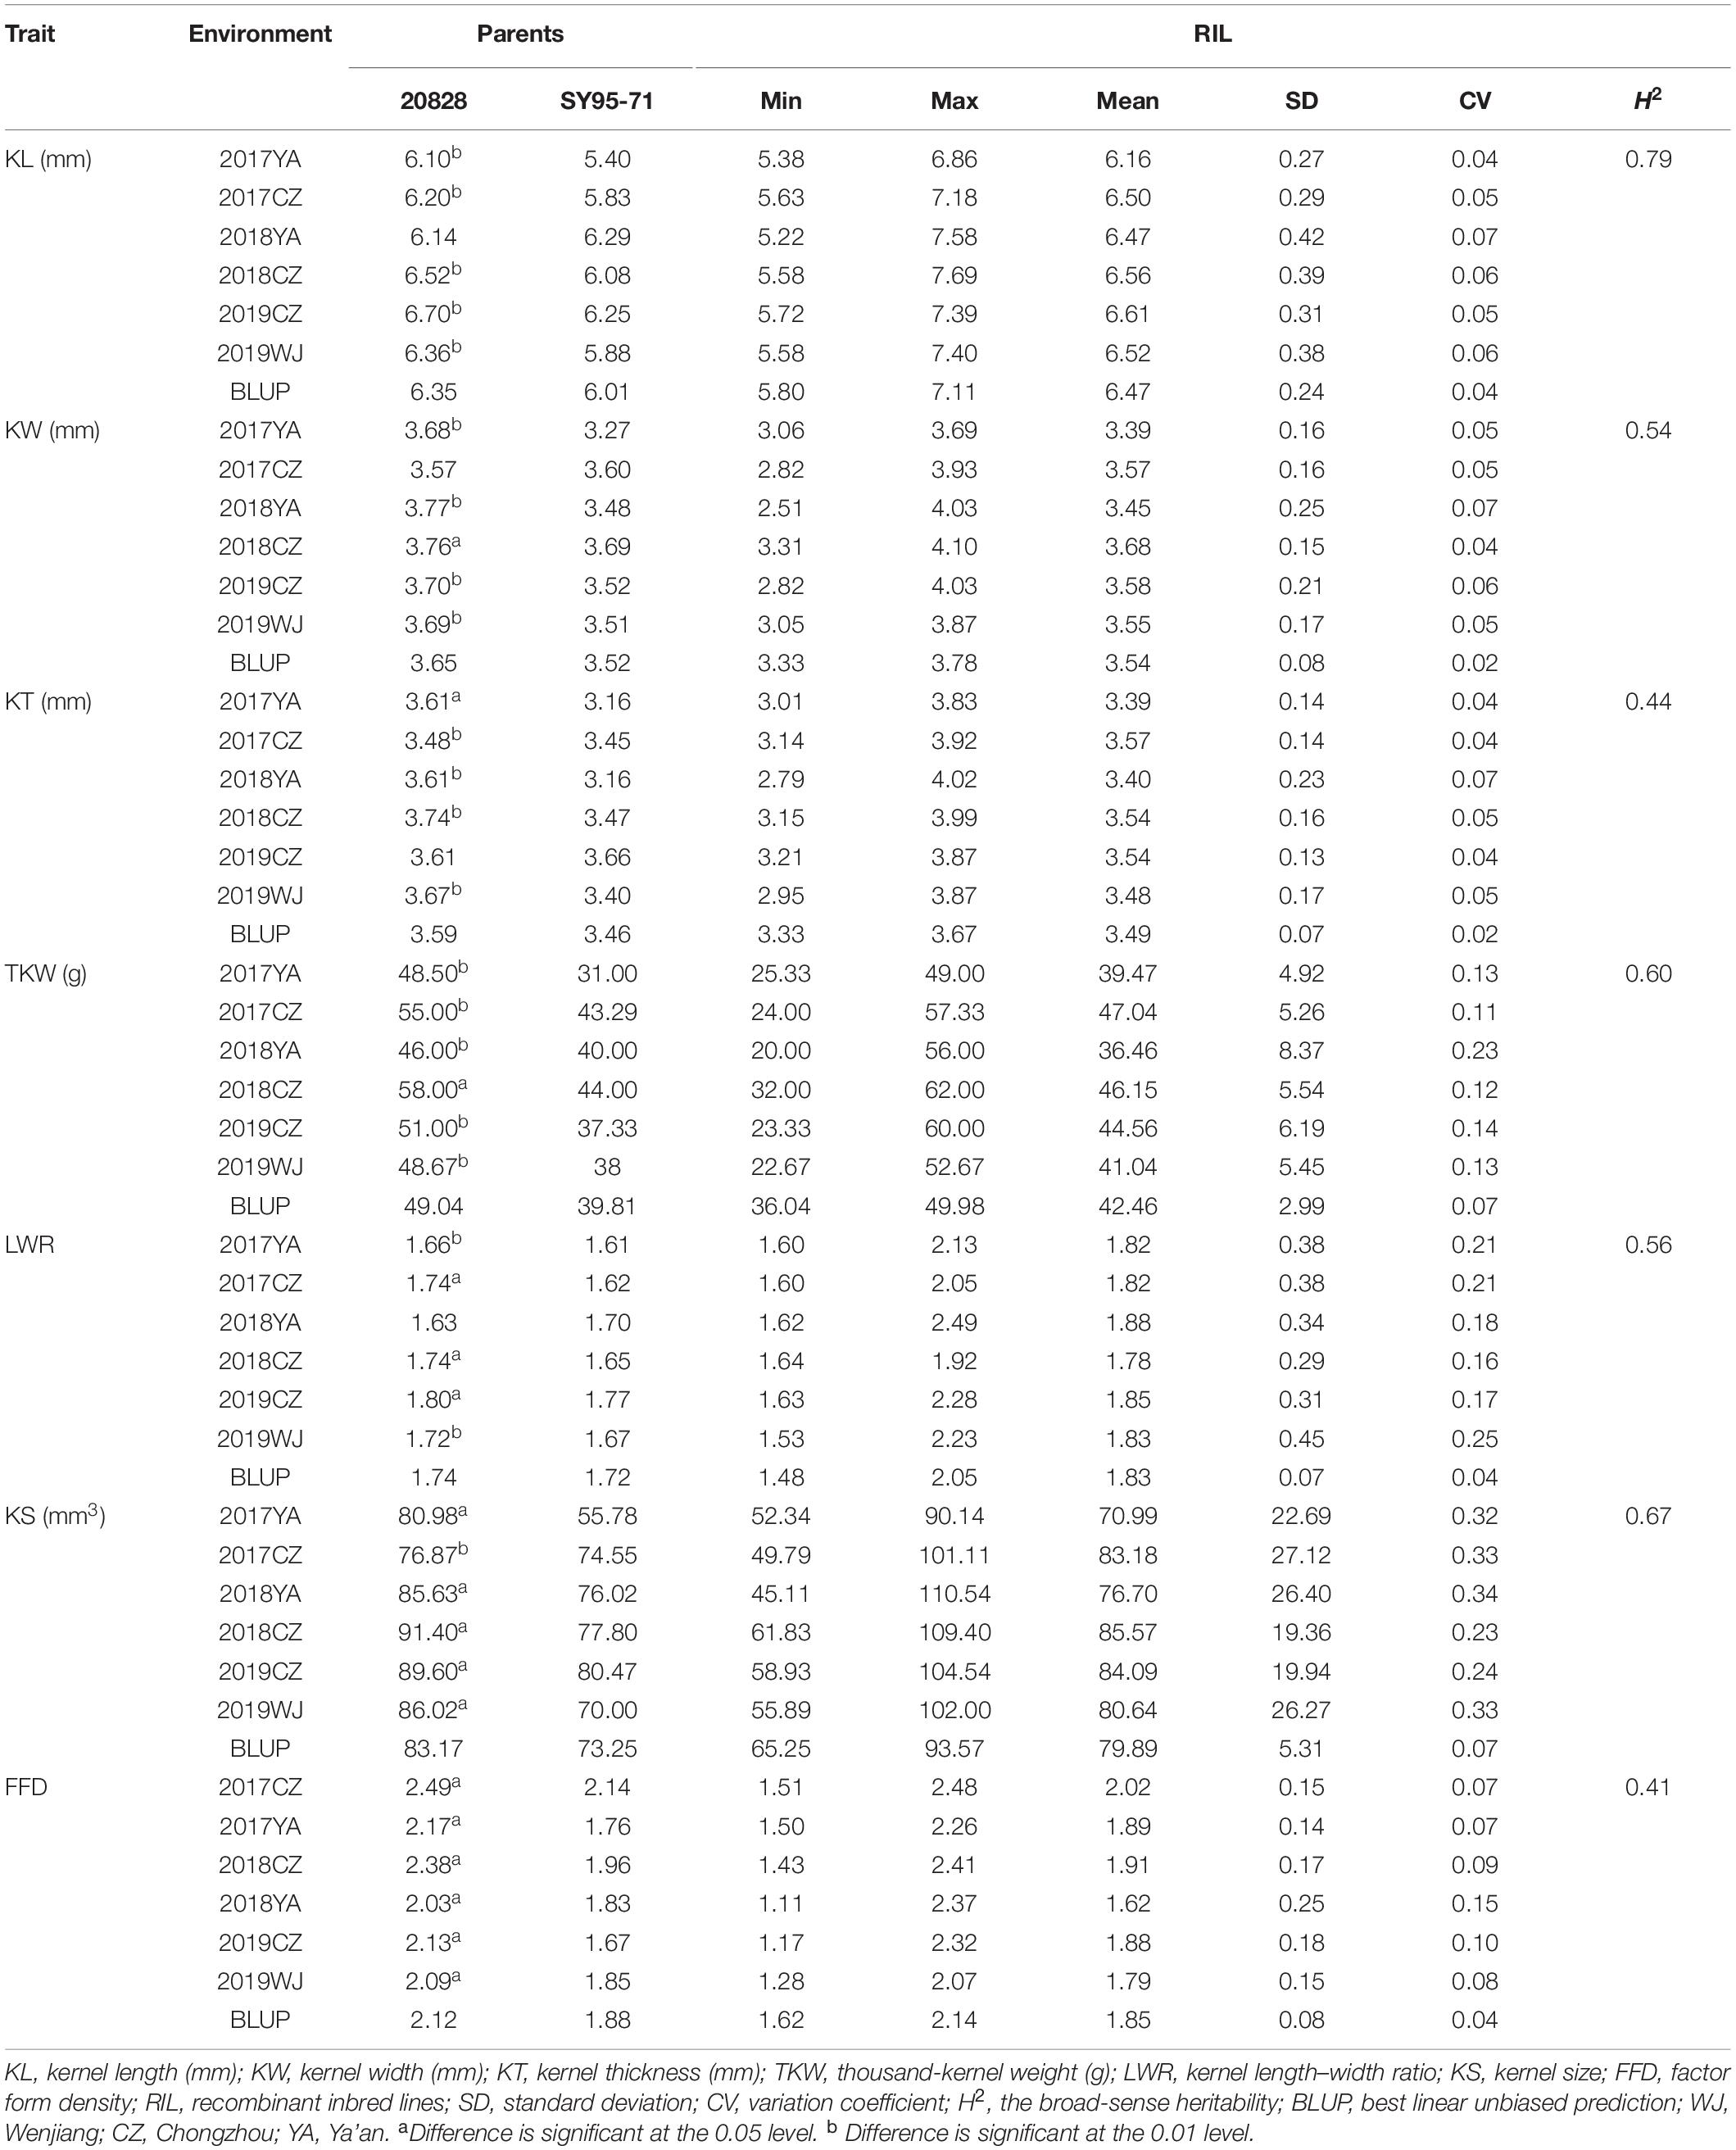
Table 1. Phenotype of the parents and RILs in this study.
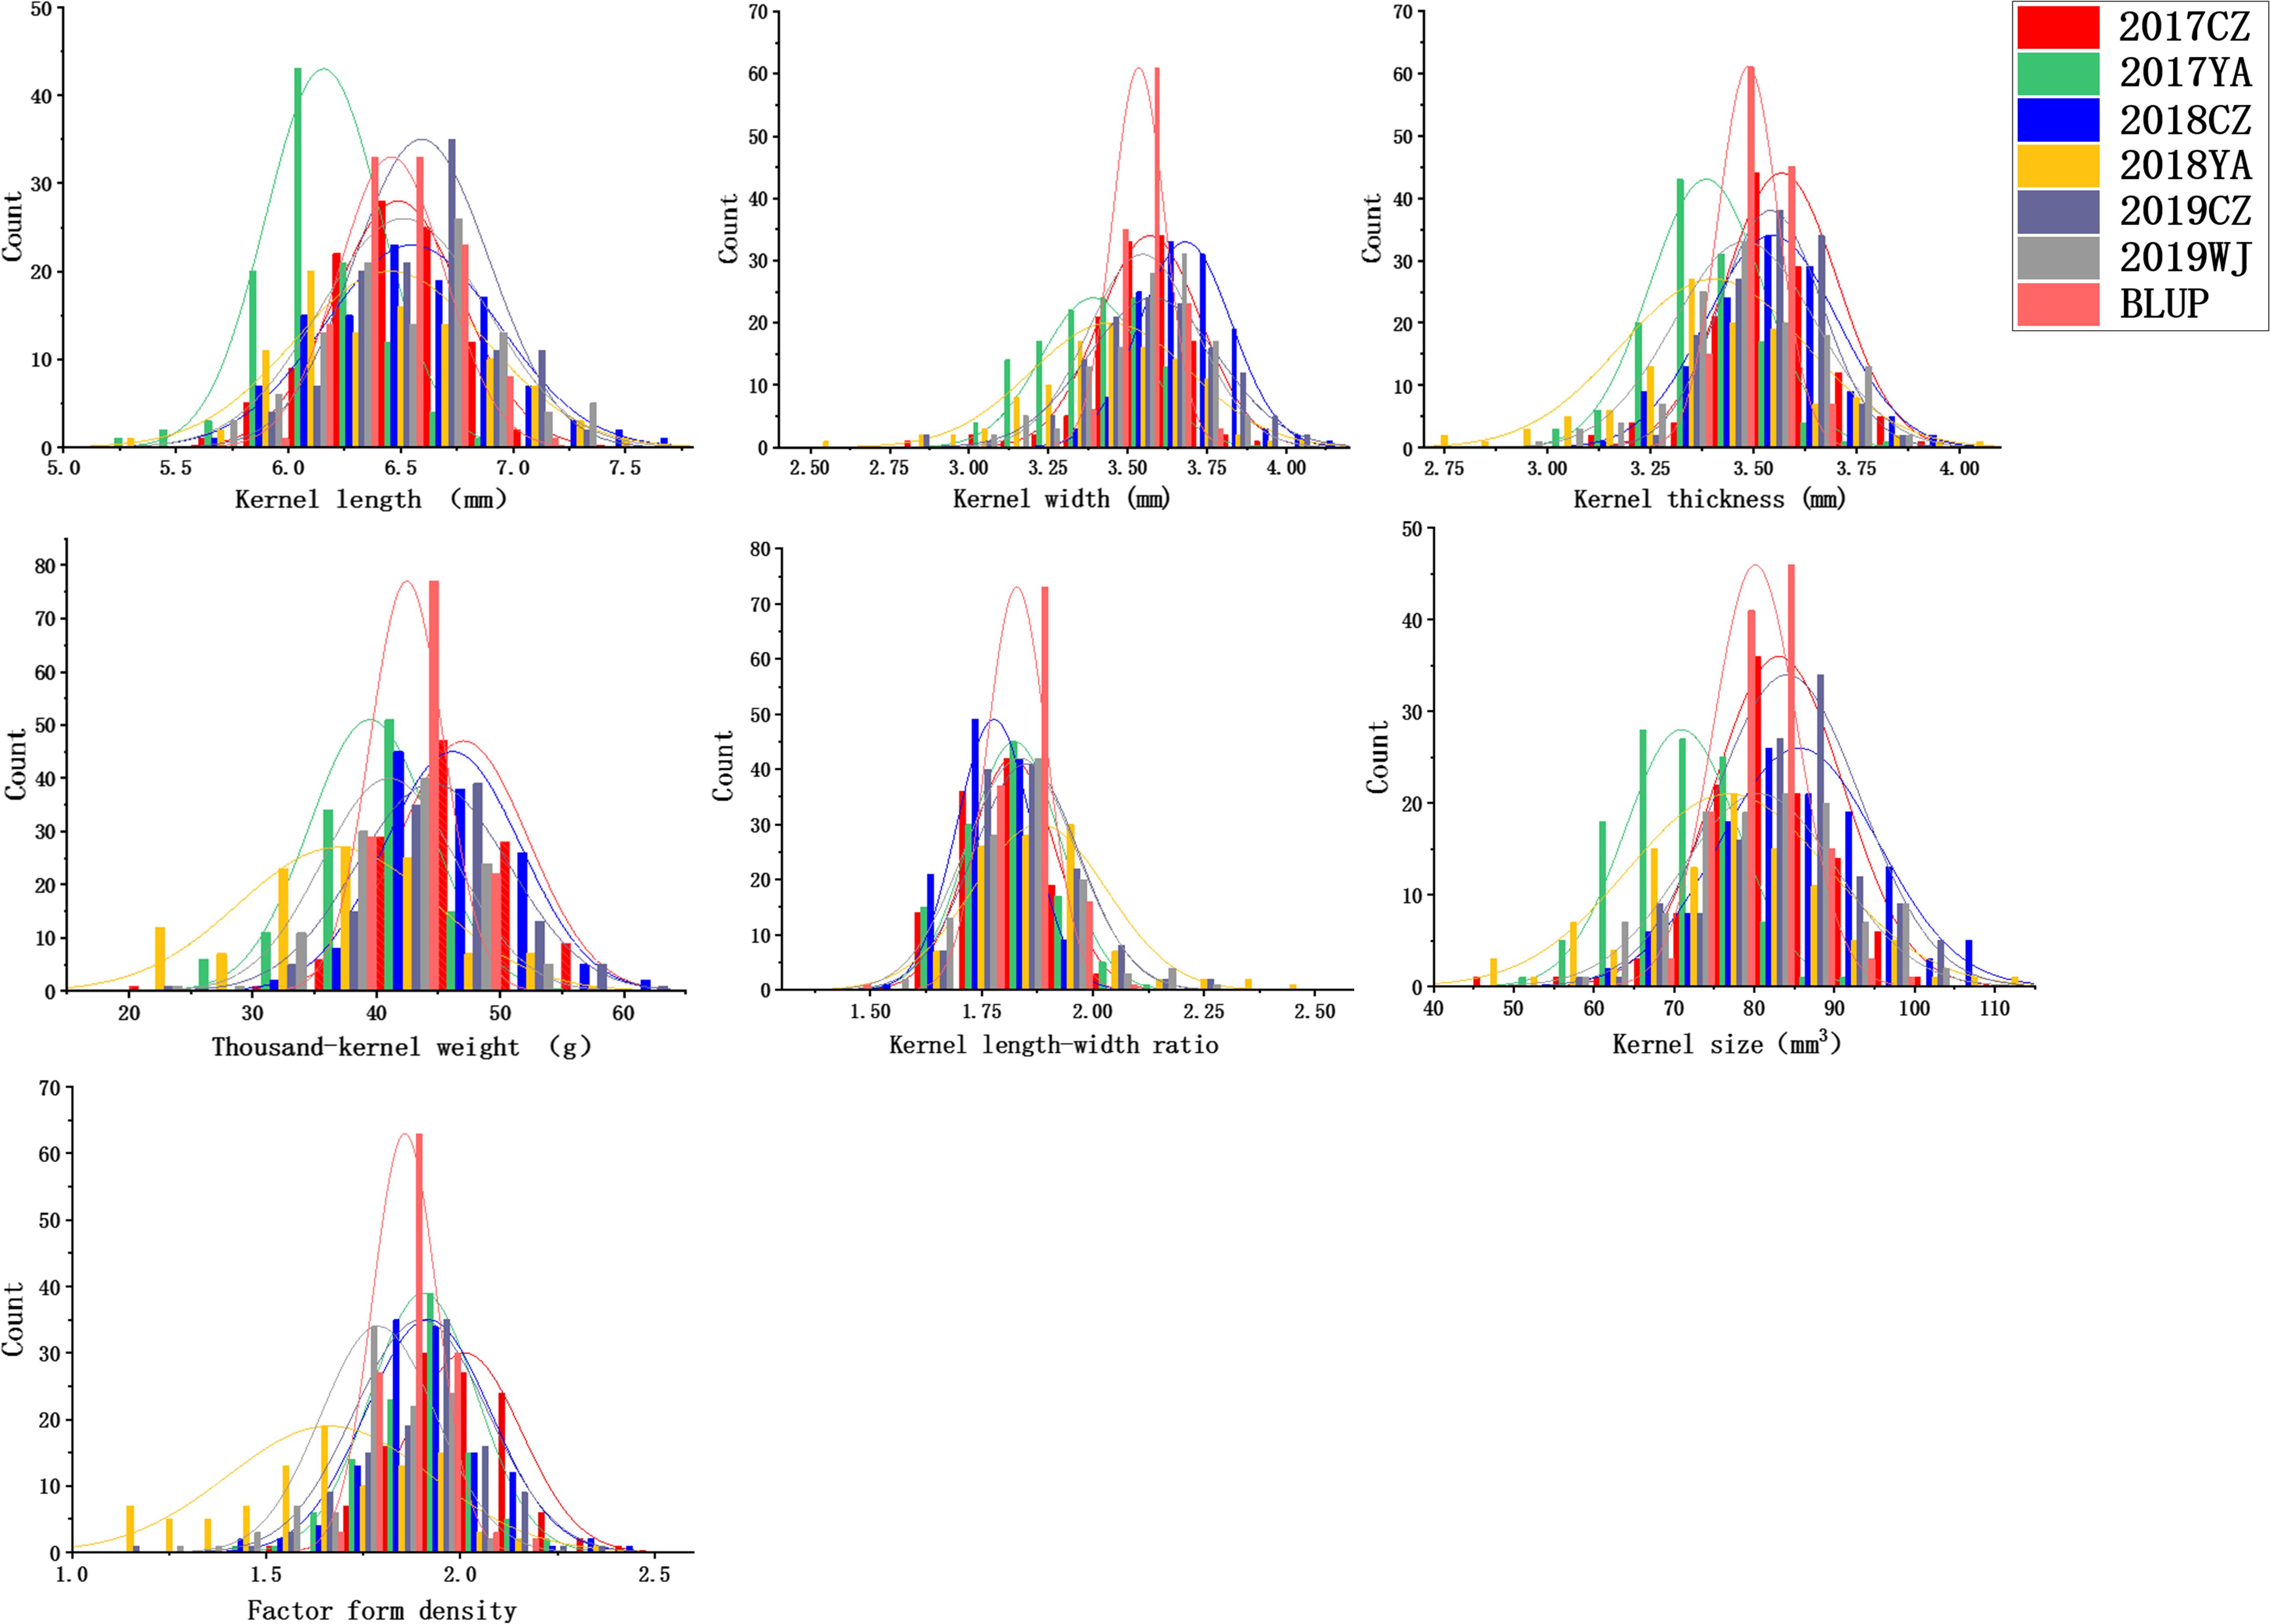
Figure 2. Frequency distributions for kernel length (KL), kernel width (KW), kernel thickness (KT), thousand-kernel weight (TKW), kernel length–width ratio (LWR), kernel size (KS), and factor form density (FFD) in different environments.
In all the environments, KL ranges from 5.22 to 7.69 mm, KW from 2.51 to 4.10 mm, KT from 2.79 to 4.02 mm, TKW from 20.00 to 62.00 g, LWR from 1.48 to 2.49, KS from 45.11 to 110.54 mm3, and FFD from 1.11 to 2.48 (Table 1 and Figure 2). The H2 of KL, KW, KT, TKW, LWR, KS, and FFD were 0.79, 0.54, 0.44, 0.60, 0.56, 0.67, and 0.41, respectively, suggesting that KL was less affected by environmental factors than other kernel traits (Table 1). The variation coefficient of a given trait was similar in different environments, and the phenotypic data of all seven traits showed distinct bidirectional transgressive segregation in all the environments, indicating that favorable alleles may exist in both parents and reassociated in some offspring (Table 1).
Correlation Analysis
Correlation analysis of kernel traits in different environments showed that only KL and TKW were correlated between all different environments (Supplementary Table 1). For KW, KT, KS, LWR, and FFD, the correlation was significant for most of the environments (Supplementary Table 3).
Positive correlations were detected among KL, KW, KT, and TKW, with correlation coefficients ranging from 0.354 to 0.756 (P < 0.01, Supplementary Table 4). LWR was negatively correlated with KW and FFD, but positively correlated with KL (P < 0.01). KS had a positive correlation with the other six kernel traits except for LWR (P < 0.01). FFD was positively correlated with KW, KT, TKW, and KS (P < 0.01, Supplementary Table 4).
The correlation analysis between the seven kernel traits and other agronomic traits measured earlier showed that KW, KT, TKW, KS, and FFD were positively related to PH (P < 0.01); KL and KW were negatively correlated with PTN (P < 0.05); KL and KS were positively correlated with FLL (P < 0.05); FLW was positively correlated with KW, TKW, and KS (P < 0.05); SL was positively correlated with all seven kernel traits (P < 0.05), and SD was negatively correlated with KL, KT, TKW, LWR, and KS (P < 0.05 Supplementary Table 5).
QTL Mapping of Kernel Traits
QTL analysis results of seven kernel-related traits in the 2SY population are shown in Table 2. A total of 65 putative QTLs related to kernel traits were detected including 14 for KL, 4 for KW, 11 for KT, 11 for TKW, 9 for LWR, 12 for KS, and 4 for FFD (Supplementary Table 6). Among them, nine QTLs can be detected in at least three different environments in the 2SY population (Table 2). They were located on 1B (two QTLs), 2D (four QTLs), and 6D (three QTLs) chromosomes (Table 2 and Figure 3). QKL.sicau-2SY-1B is the major locus and can be detected in all environments and with BLUP dataset, explaining 9.48% to 25.23% of phenotypic variation. The positive allele at QKL.sicau-2SY-1B was derived from SY95-71 (Table 2). Other three QTLs for KL (QKL.sicau-2SY-2D.1, QKL.sicau-2SY-2D.2, and QKL.sicau-2SY-2D.3, respectively) were detected on 2D chromosome and explained the phenotypic variation of 13.36–23.24% (Supplementary Table 6). Although they also have a relatively high value of phenotypic variation, they were unstable and detected only in less than three environments. QKL.sicau-2SY-6D, a minor QTL for KL, explaining 5.33–7.07% of the phenotypic variation was detected, and the positive alleles of these four minor QTLs were all derived from 20828 (Supplementary Table 6).
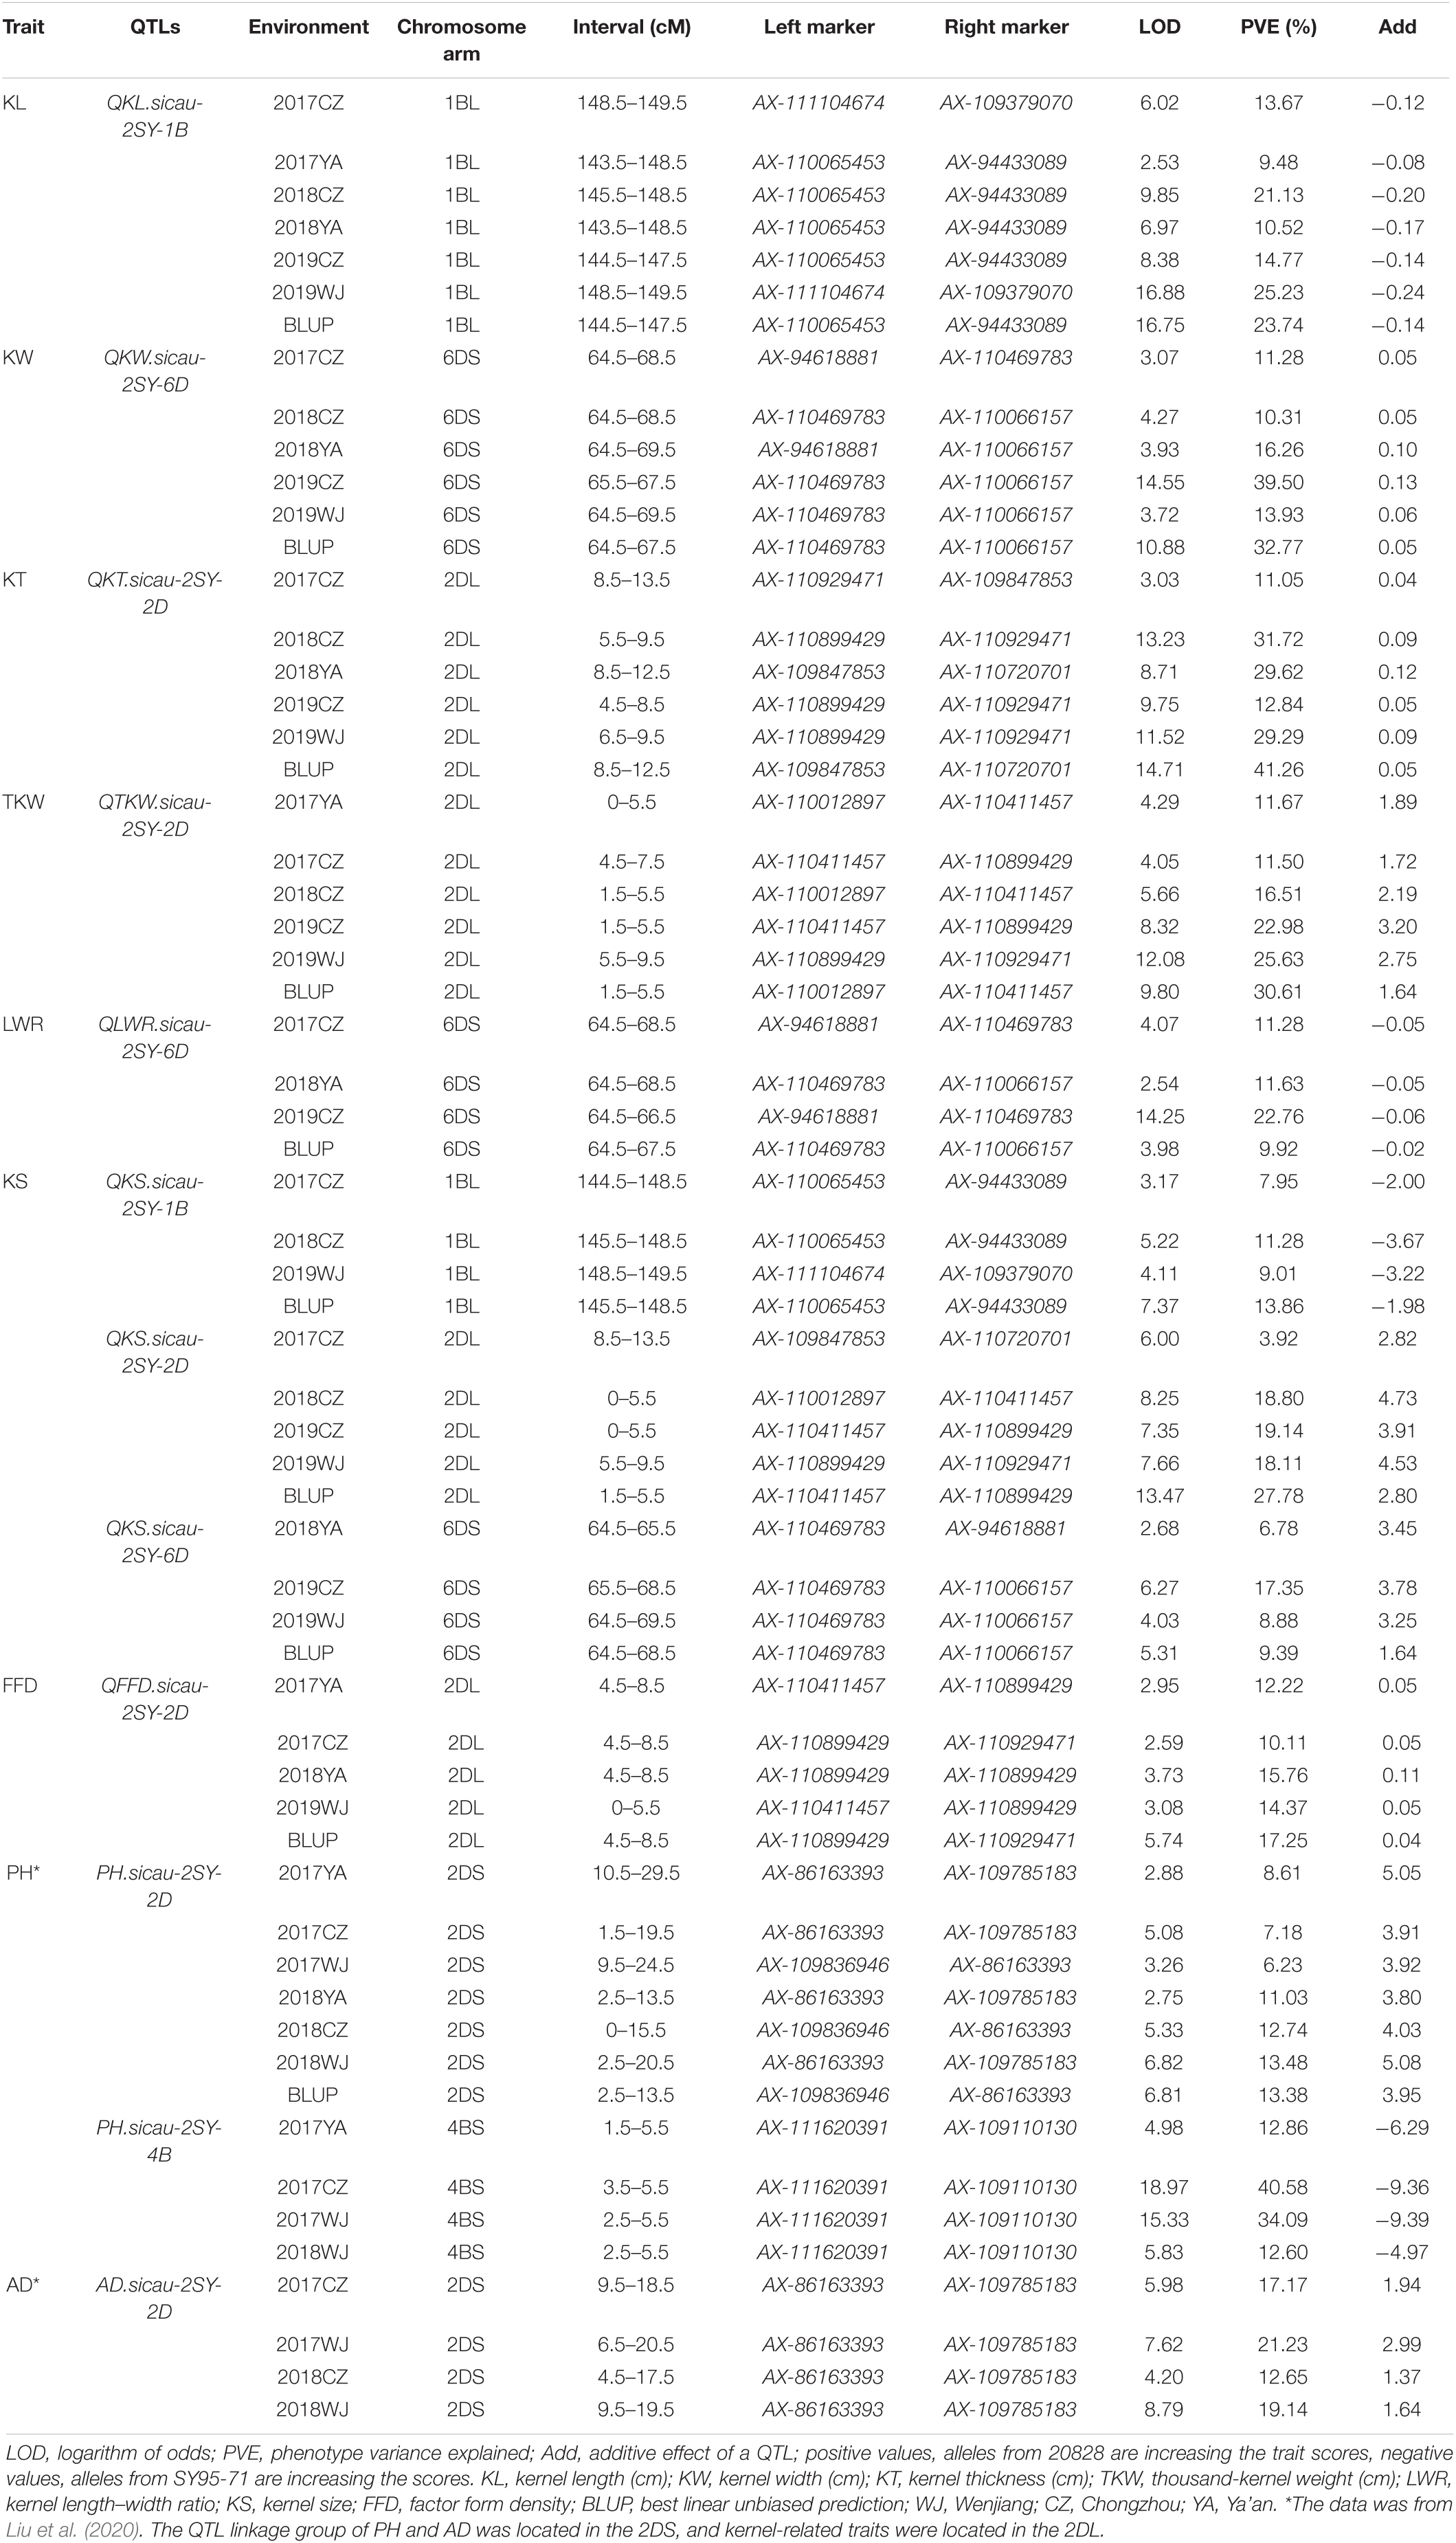
Table 2. Quantitative trait loci (QTLs) for kernel traits and plant height (PH) and anthesis date (AD) detected in more than three environments in the “20828” × “SY95-71” population.
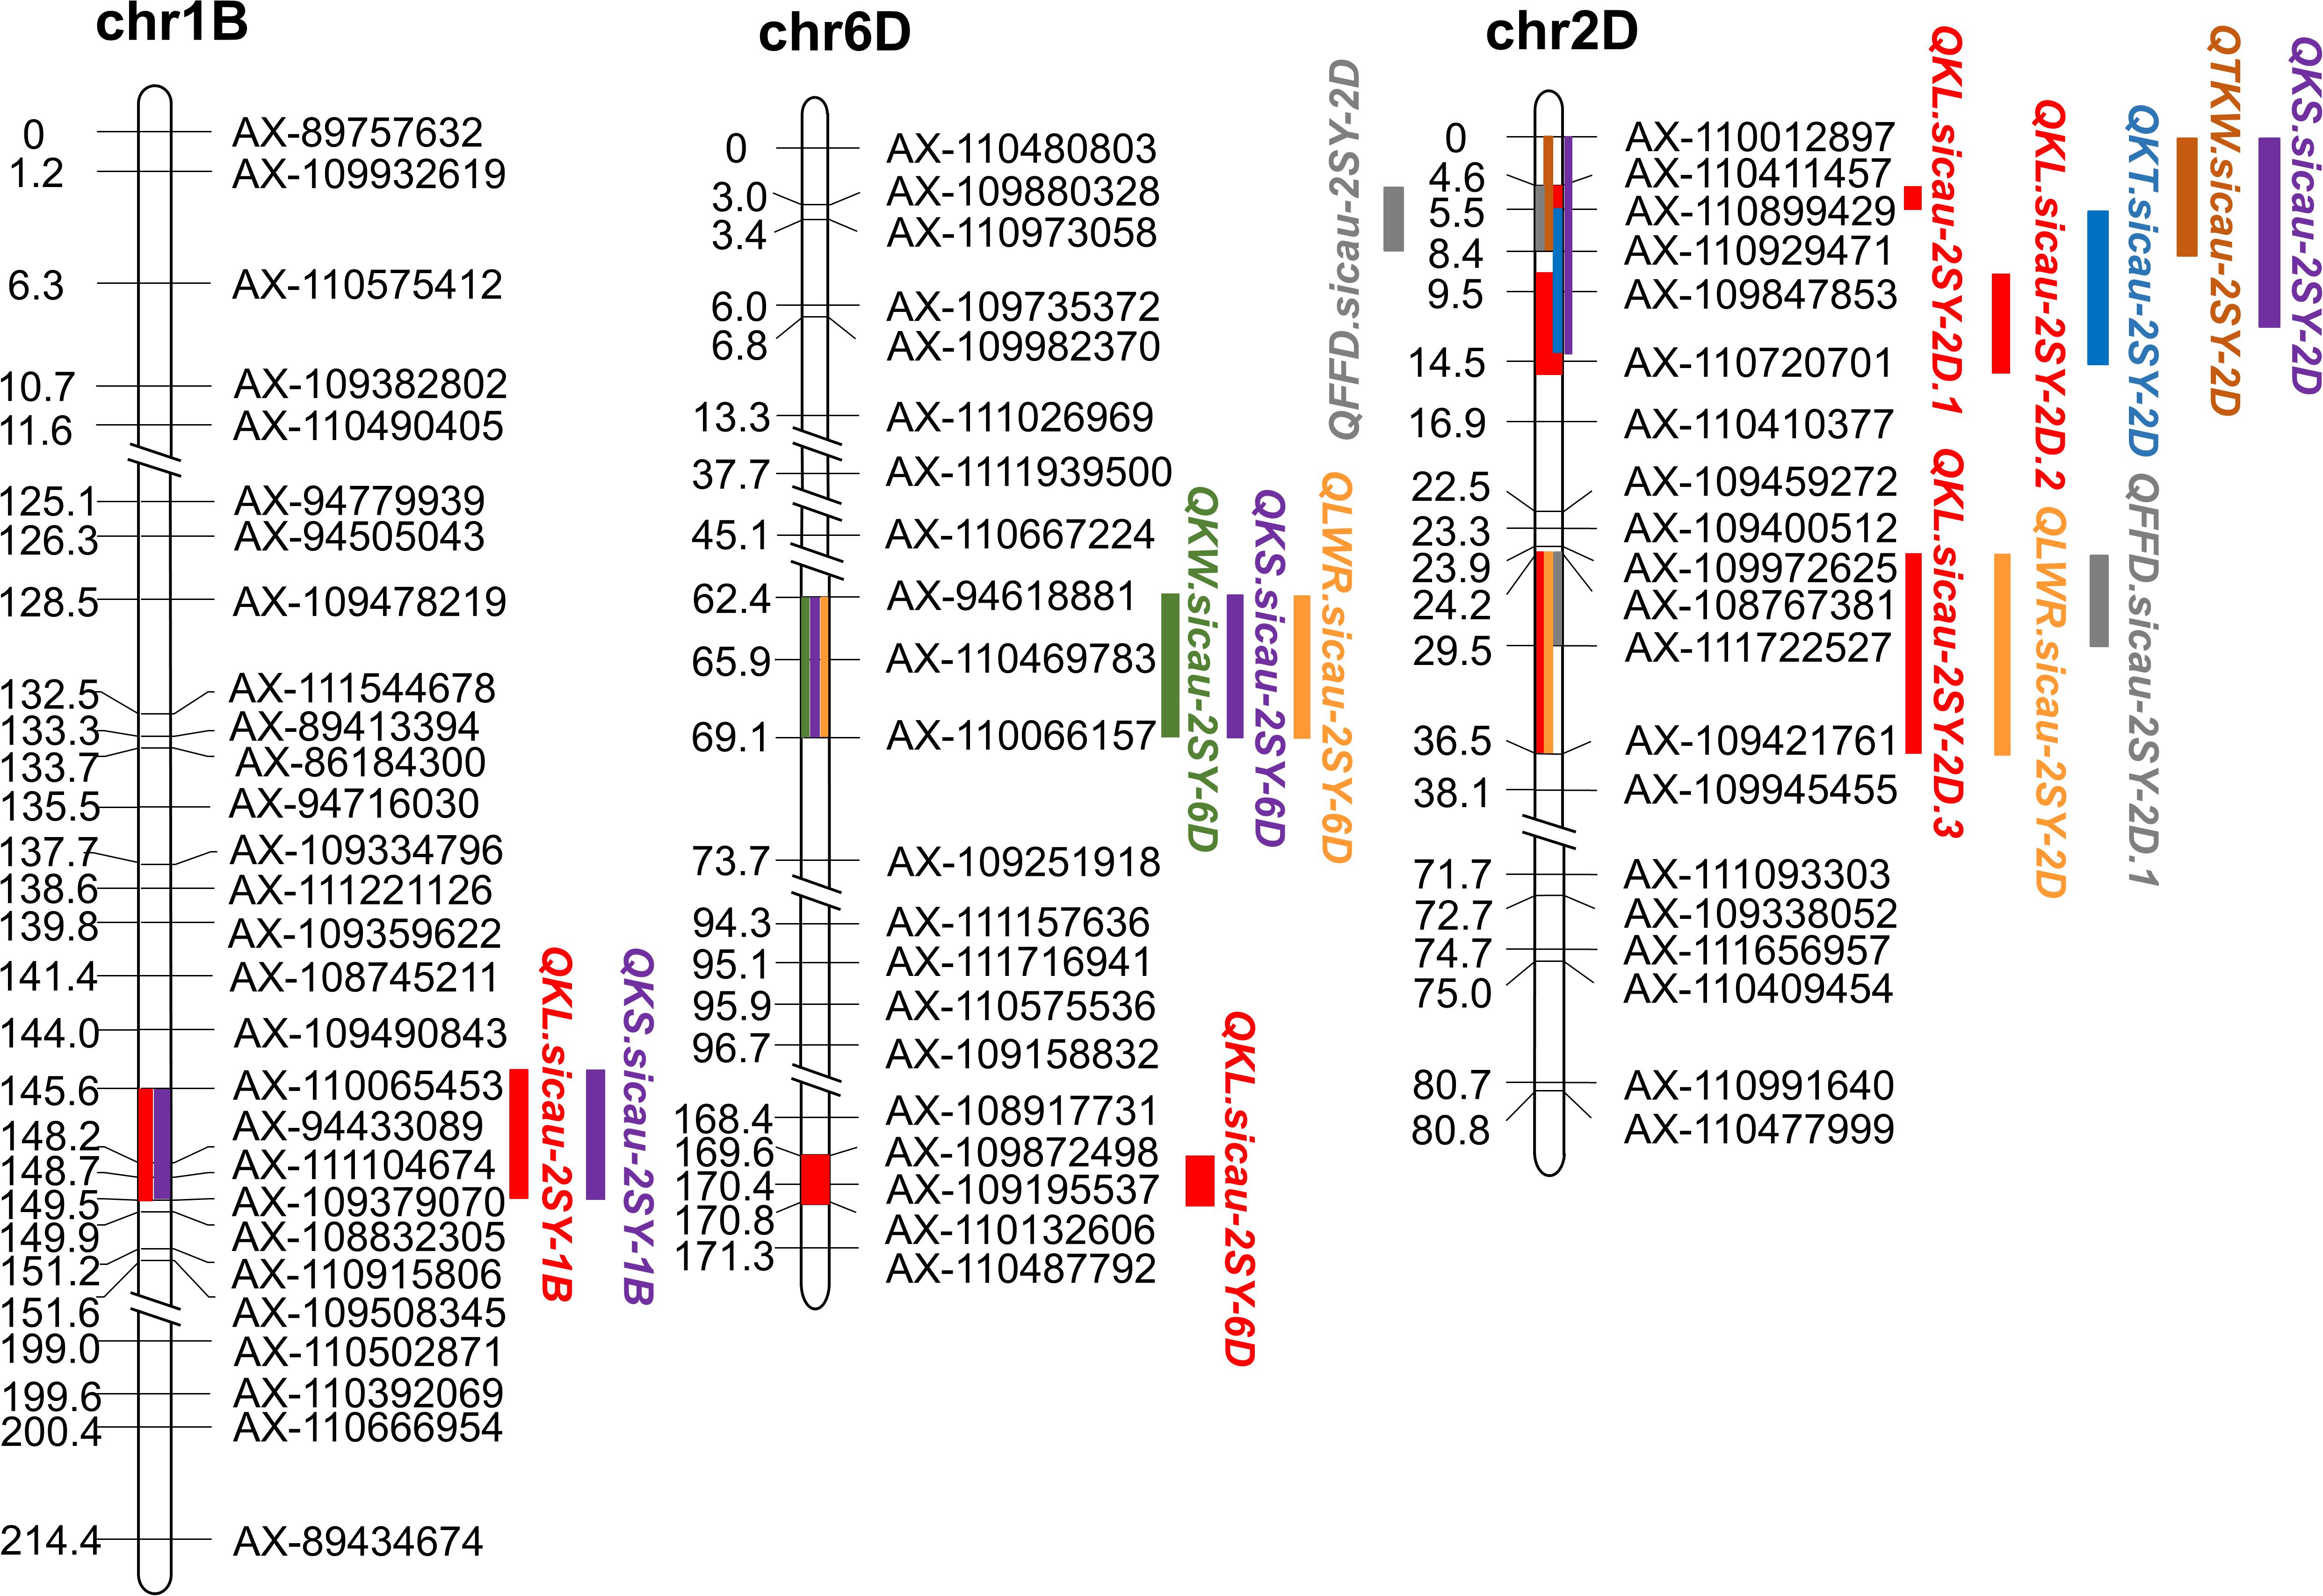
Figure 3. Fifteen major or minor QTLs for kernel traits in the genetic map. Red color represents QTL conferring kernel length (KL), green color represents QTL conferring kernel width (KW), blue color represents QTL conferring kernel thickness (KT), brown color represents QTL conferring thousand-kernel weight (TKW), orange color represents QTL conferring kernel length–width ratio (TKW), purple color represents QTL conferring kernel size (KS), and gray color represents QTL conferring factor form density (FFD).
Major QTLs for KW, KT, and TKW were detected on chromosomes 6D, 2D, and 2D, respectively. QKW.sicau-2SY-6D was detected in five different environments and with BLUP dataset, explaining the phenotypic variation of 9.36–39.50%. QKT.sicau-2SY-2D was detected in five different environments and with BLUP dataset, which explains 11.05–41.26% of the phenotypic variation. Meanwhile, QTKW.sicau-2SY-2D, the major QTL controlling TKW was also detected on 2D chromosome in five different environments and with BLUP dataset and accounted for 11.50–30.61% of the phenotypic variation. The positive alleles of these three major QTLs for KW, KT, and TKW were all contributed by 20828 (Table 2).
Major QTL QLWR.sicau-2SY-6D for LWR was detected in three different environments with BLUP dataset, explaining 9.92–22.76% of the phenotypic variance (Table 2). And the minor QTL QLWR.sicau-2SY-2D explained 8.24–9.70% of the phenotypic variance in a single environment (Supplementary Table 6). The positive alleles for these two QTL were contributed by SY95-71 and 20828, respectively (Supplementary Table 6).
Major QTLs for KS (QKS.sicau-2SY-1B, QKS.sicau-2SY-2D, and QKS.sicau-2SY-6D, respectively) were detected in four to five different environments and with BLUP dataset explaining 3.92–27.78% of the phenotypic variance (Table 2). The positive allele of the first one was derived from SY95-71 and the last two from 20828 (Table 2).
Major QTL QFFD.sicau-2SY-2D for FFD was detected in five different environments and with BLUP dataset, explaining 10.11–17.25% of the phenotypic variance (Table 2). The minor QTL QFFD.sicau-2SY-2D.1 was detected in two different environments and explained 10.19–18.79% of the phenotypic variance (Supplementary Table 6). These two QTLs’ positive alleles were both contributed by 20828 (Supplementary Table 6).
According to the genotypes of flanking markers for major QTLs of kernel-related traits, lines with homozygous alleles for a given QTL were obtained in 2SY population. For QKL.sicau-2SY-1B and QKS.sicau-2SY-1B, the phenotypic values of lines carrying SY95-71 alleles were significantly higher than those containing 20828 alleles in different environments and with BLUP dataset except for QKS.sicau-2SY-1B in 2017YA (P < 0.05, Figure 4). In major QTLs for KW, TKW, LWR, KS, and FFD (QKW.sicau-2SY-6D, QTKW.sicau-2SY-2D, QLWR.sicau-2SY-6D, QKS.sicau-2SY-2D, QKS.sicau-2SY-6D, and QFFD.sicau-2SY-2D, respectively), the phenotypic values of lines carrying 20828 alleles were significantly higher than those with SY95-71 alleles in different environments and BLUP dataset except for QKS.sicau-2SY-2D in 2017YA, QKS.sicau-2SY-6D in 2017YA, and QLWR.sicau-2SY-6D in 2018CZ (P < 0.05, Figure 4).
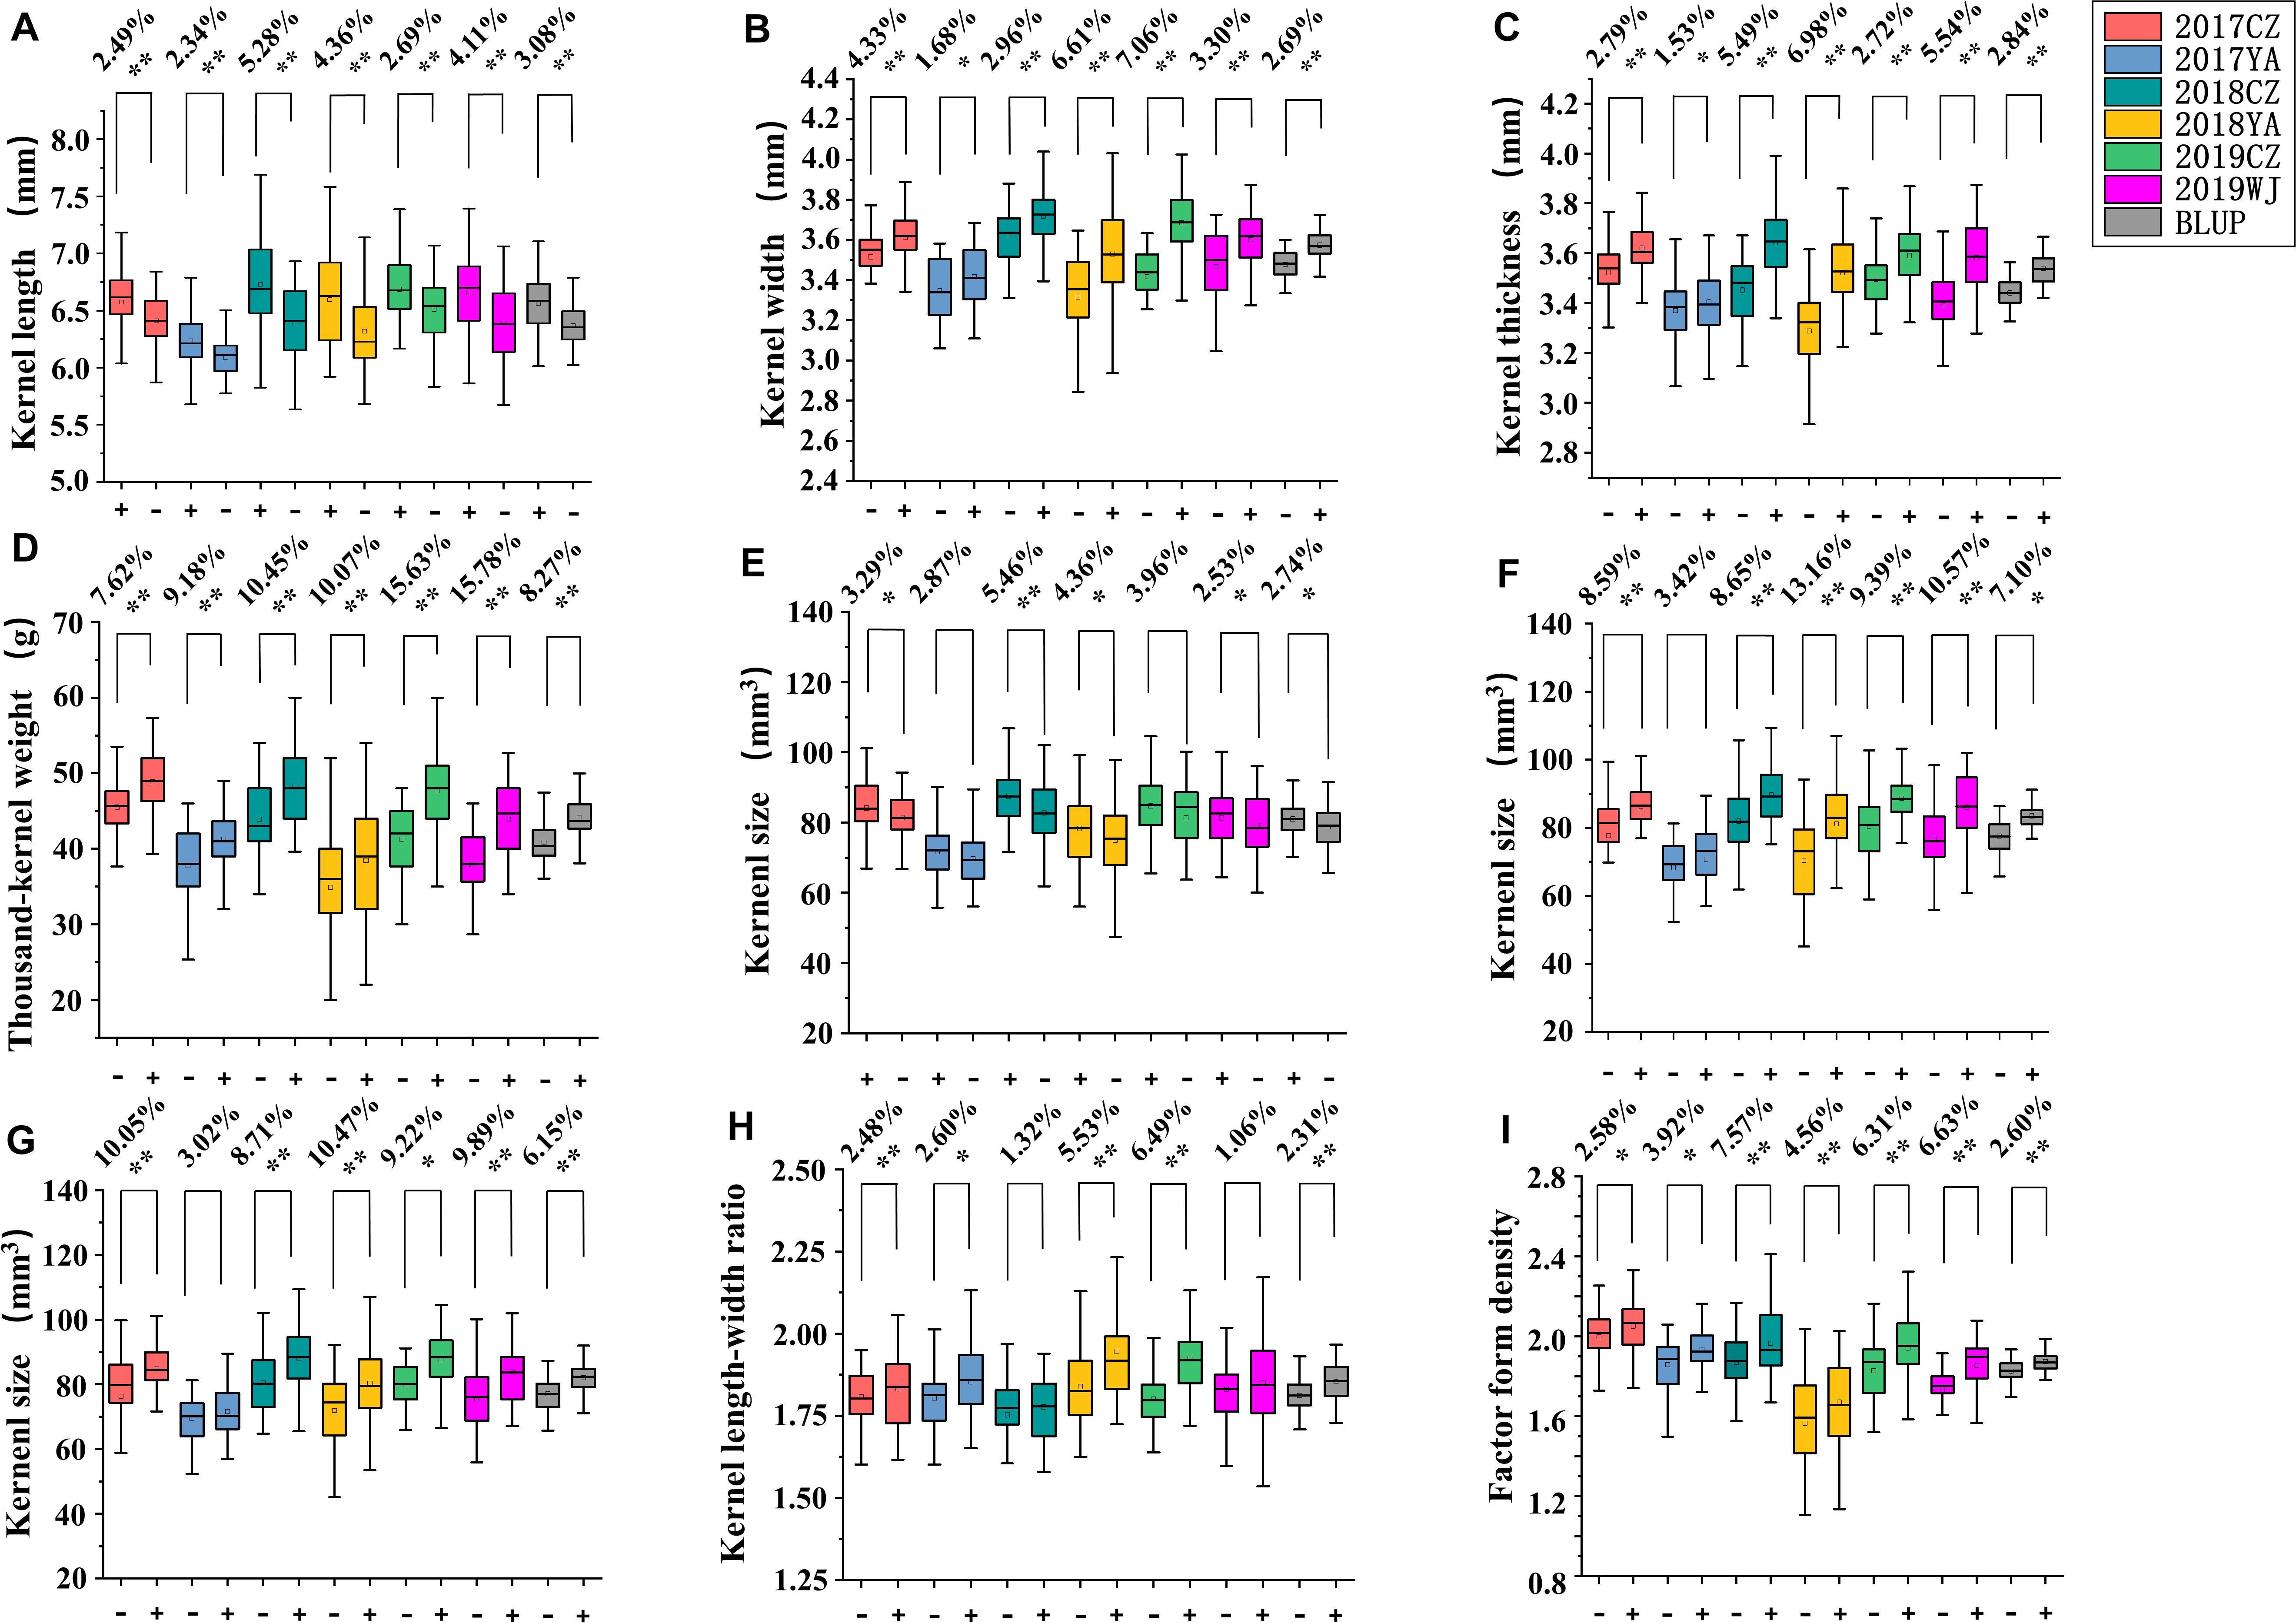
Figure 4. Genetic effects of QKL.sicau-2SY-1B (A), QKW.sicau-2SY-6D (B), QKT.sicau-2SY-2D (C), QTKW.sicau-2SY-2D (D), QKS.sicau-2SY-1B (E), QKS.sicau-2SY-2D (F), QKS.sicau-2SY-6D (G), QLWR.sicau-2SY-6D (H), and QFFD.sicau-2SY-2D (I) in 2SY population. Different colors represent different environments and BLUP. In (A,E) “+” and “-” represent homozygous lines carrying “SY95-71” and “20828” alleles, respectively; In (B–I) “+” and “-” represent homozygous lines carrying “20828” and “SY95-71” alleles, respectively. **Significance at the 0.01 probability level; *significance at the 0.05 probability level.
Effects of QKS.sicau-2SY-1B, QKS.sicau-2SY-2D, and QKS.sicau-2SY-6D on KS in the 2SY Population
The effects of the positive alleles at the three QTL for KS (QKS.sicau-2SY-1B, QKS.sicau-2SY-2D, and QKS.sicau-2SY-6D) were analyzed (Figure 5, P < 0.05). As expected, compared with those without alleles increasing KS, RILs carrying only one, two, and three alleles significantly increased KS, respectively. Lines with three alleles significantly increased KS compared with those with two and a single one, respectively. No significant differences were detected among three different combinations with any two alleles. Among the three alleles, QKS.sicau-2SY-1B has a larger effect on KS. Taken together, three alleles have the largest effect on increasing KS, followed by those with two, and those with a single one have the smallest effect (Figure 5, P < 0.05).
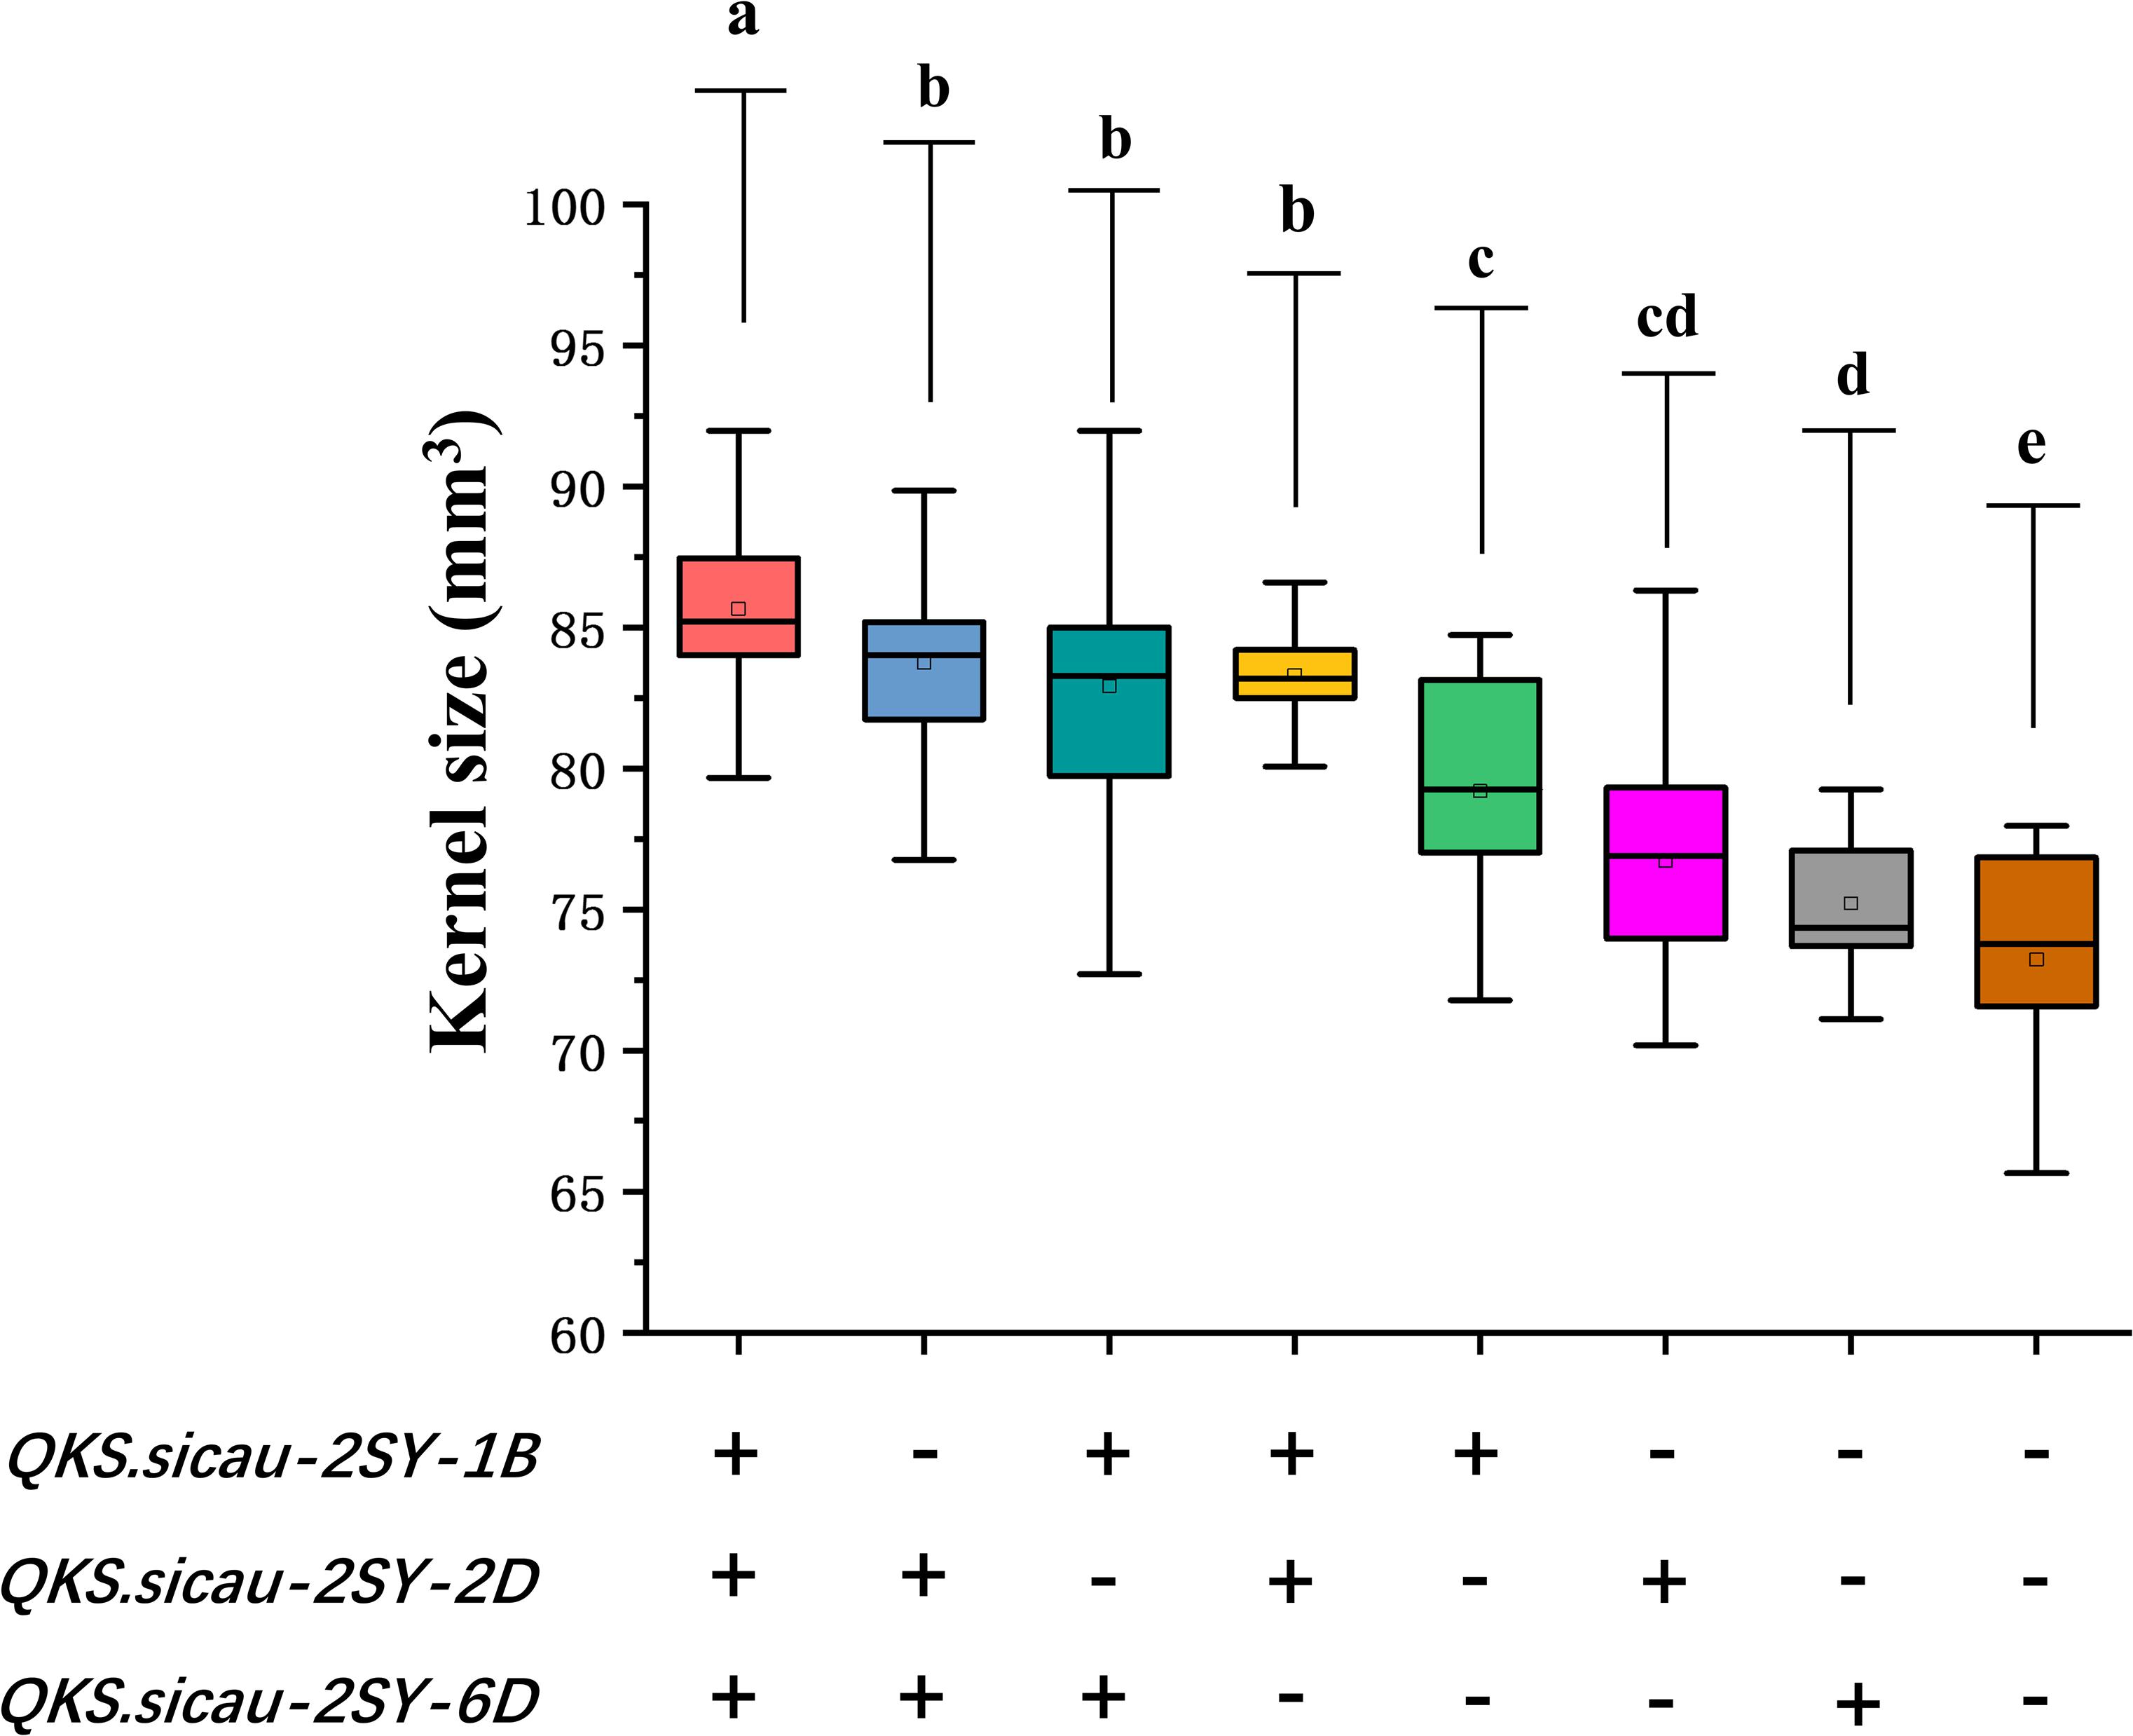
Figure 5. Pyramiding analysis of QKS.sicau-2SY-1B, QKS.sicau-2SY-2D, and QKS.sicau-2SY-6D for KS; “+” and “-” represent lines with and without the positive alleles of the target quantitative trait loci (QTLs) based on the flanking markers of the corresponding QTL, respectively. Letters a, b, c, d, and e represent significant difference.
The Factorial ANOVA for Major QTLs of Each Kernel Trait
We performed factorial analysis and the two-way interactions for the most significant markers based on the LOD values from the five QTLs on chromosomes 1B, 2D, and 6D of seven kernel-related traits to determine the contribution rate of a single marker to each trait (Supplementary Table 7).
The factorial ANOVA containing the major and minor QTLs and all possible two-way interactions explained a relative larger portion of the variation in KL (55.0%), KW (37.4%), KT (59.1%), TKW (44.0%), LWR (73.0%), KS (58.8%), and FFD (44.6%), respectively. Compared with QTLs on chromosome arm 6DL, the QTL on 1BL explained a larger proportion of variation for KL (23.6%), LWR (20.6%), KS (18.1%), and FFD (3.9%), but no variation was explained for other kernel traits (KW, KT, and TKW). The QTLs on chromosome arms 6DS and 2DL-1 explained the largest proportion of the variation for KW (13.9%), KT (18.4%), TKW (13.3%), and FFD (21.4%), respectively. Meanwhile, the 2DL-2 also explained a proportion variation for KL (6.7 %), LWR (11.3 %), and FFD (3.9%). Based on the QTL interaction analysis, we detected a total of seven pairs of QTL with interaction, and they explained the variation of less than 5% for kernel-related traits (KW, KT, TKW, LWR, and KS; P < 0.05). Additionally, no QTL interaction was detected for KL and FFD (Supplementary Table 7).
The Multienvironment Analysis
A total of 609 QTLs related to kernel traits were detected in the multienvironment analysis (Supplementary Table 8). Among them, 51 were identical with those detected in individual environment QTL mapping. Some of these QTLs can be detected only in a single environment, indicating that they are greatly affected by the environments and cannot be stably expressed. Meanwhile, QKL.sicau-2SY-1B, QKW.sicau-2SY-6D, QKT.sicau-2SY-2D, QTKW.sicau-2SY-2D, QLWR.sicau-2SY-6D, QKS.sicau-2SY-1B, QKS.sicau-2SY-2D, QKS.sicau-2SY-6D, and QFFD.sicau-2SY-2D were all detected, further indicating that they were major and stable.
Colocalized Regions and Physical Intervals for Mapped QTL
QTL mapping revealed that the major QTLs for KL and KS (QKL.sicau-2SY-1B and QKS.sicau-2SY-1B) were colocalized between makers AX-110065453 and AX-109379070 at 143.5-149.5 cM of the 1B chromosome (Table 2). Major QTLs for KW, LWR, and KS (QKW.sicau-2SY-6D, QLWR.sicau-2SY-6D, and QKS.sicau-2SY-6D, respectively) were colocalized between makers AX-94618881 and AX-110066157 at 64.5 to 69.5 cM of the 6D chromosome (Table 2). Major QTLs for KT, TKW, KS, and FFD (QKT.sicau-2SY-2D, QTKW.sicau-2SY-2D, QKS.sicau-2SY-2D, QFFD.sicau-2SY-2D, respectively), and the minor QTLs for KL (QKL.sicau-2SY-2D.1 and QKL.sicau-2SY-2D.2) were colocalized between makers AX-110012897 and AX-110720701 at 0 to 15.5 cM of the 2D chromosome (Figure 3, and Table 2).
Besides, the major QTLs of seven kernel-related traits were located at 566.6 to 583.6 Mbp in the deletion bin 1BL2 0.69 to 0.85 on chromosome 1BL, 45.9 to 73.3 Mbp in the deletion bin 6DS2 0.45 to 0.79 on chromosome 6DS, and 481.5 to 512.8 Mbp in the deletion bin 2DL3 0.49 to 0.76 on chromosome 2DL of “Chinese Spring” (Figure 6). Meanwhile, we also identified the physical intervals of these major QTLs on wild emmer and Aegilops tauschii reference genomes using flanking markers’ sequences and predicted genes in these intervals (Supplementary Table 9).
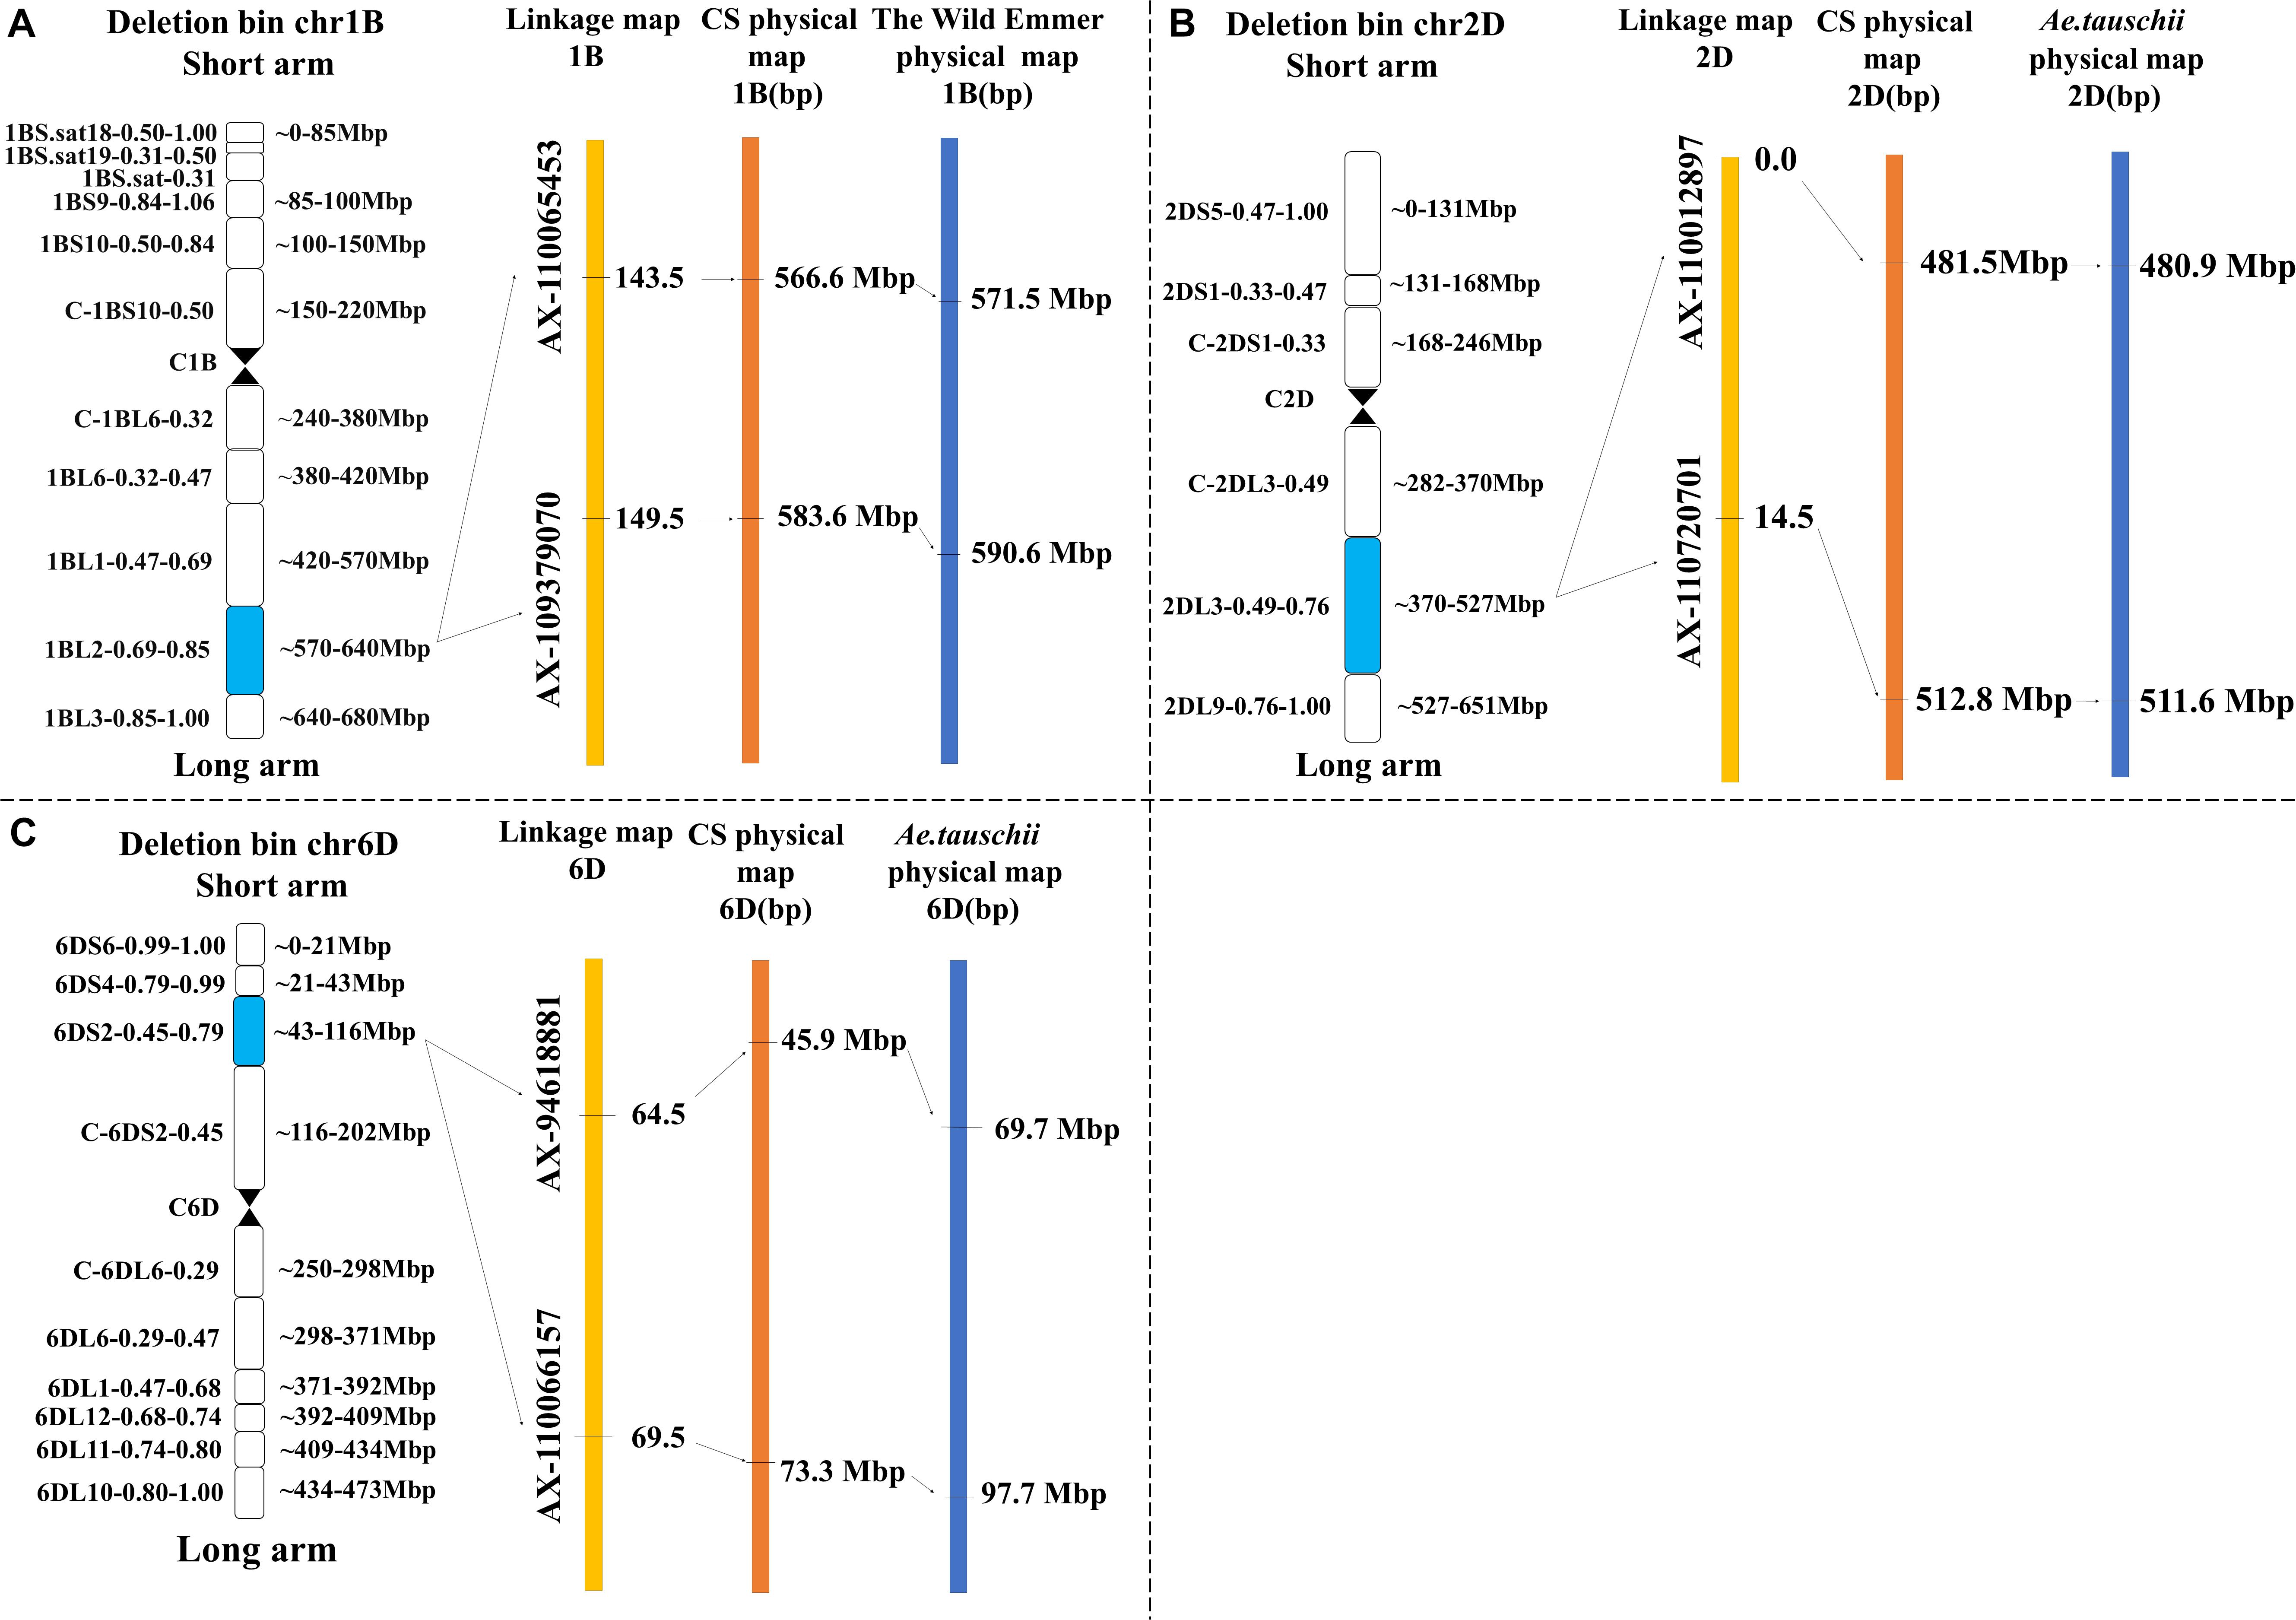
Figure 6. Genetic and physical maps of the four major QTLs in the target interval on Chinese spring, T. turgidum and A. tauschii reference genomes (“A” represents QKL.sicau-2SY-1B and QKS.sicau-2SY-1B; “B” represents QKT.sicau-2SY-2D, QTKW.sicau-2SY-2D, QKS.sicau-2SY-2D, and QFFD.sicau-2SY-2D; and “C” represents QKW.sicau-2SY-6D, QLWR.sicau-2SY-6D, and QKS.sicau-2SY-6D).
Validation of the Major and Novel KL QTL QKL.sicau-2SY-1B
Based on the QTL mapping results of KL, a new KASP marker (KASP- AX-109379070) closely linked to QKL.sicau-2SY-1B was developed. We detected the effect of QKL.sicau-2SY-1B in two verified populations with different genetic backgrounds (SSY and MTL4SY) using this marker. The marker KASP- AX-109379070 was able to detect polymorphism between parent SY95-71 and the other two parents S849-8 and MTL4-5-3. The homozygous alleles were successfully divided using KASP-AX-109379070 in SSY and MTL4SY populations (Figures 7A,B). Based on the genotyping results, 32 and 41 lines carrying SY95-71 and S849-8 alleles, respectively, were detected in SSY population, and 18 and 26 lines carrying SY95-71 alleles and MTL4-5-3 alleles, respectively, were detected in MTL4SY population. The Student t-test detected significant differences (P < 0.01) between two groups with different alleles for both two populations. The lines that carried the allele from SY95-71 significantly increased KL by 6.2 and 6.1%, respectively, compared with those without this allele in these two populations with different backgrounds (Figures 7A,B).
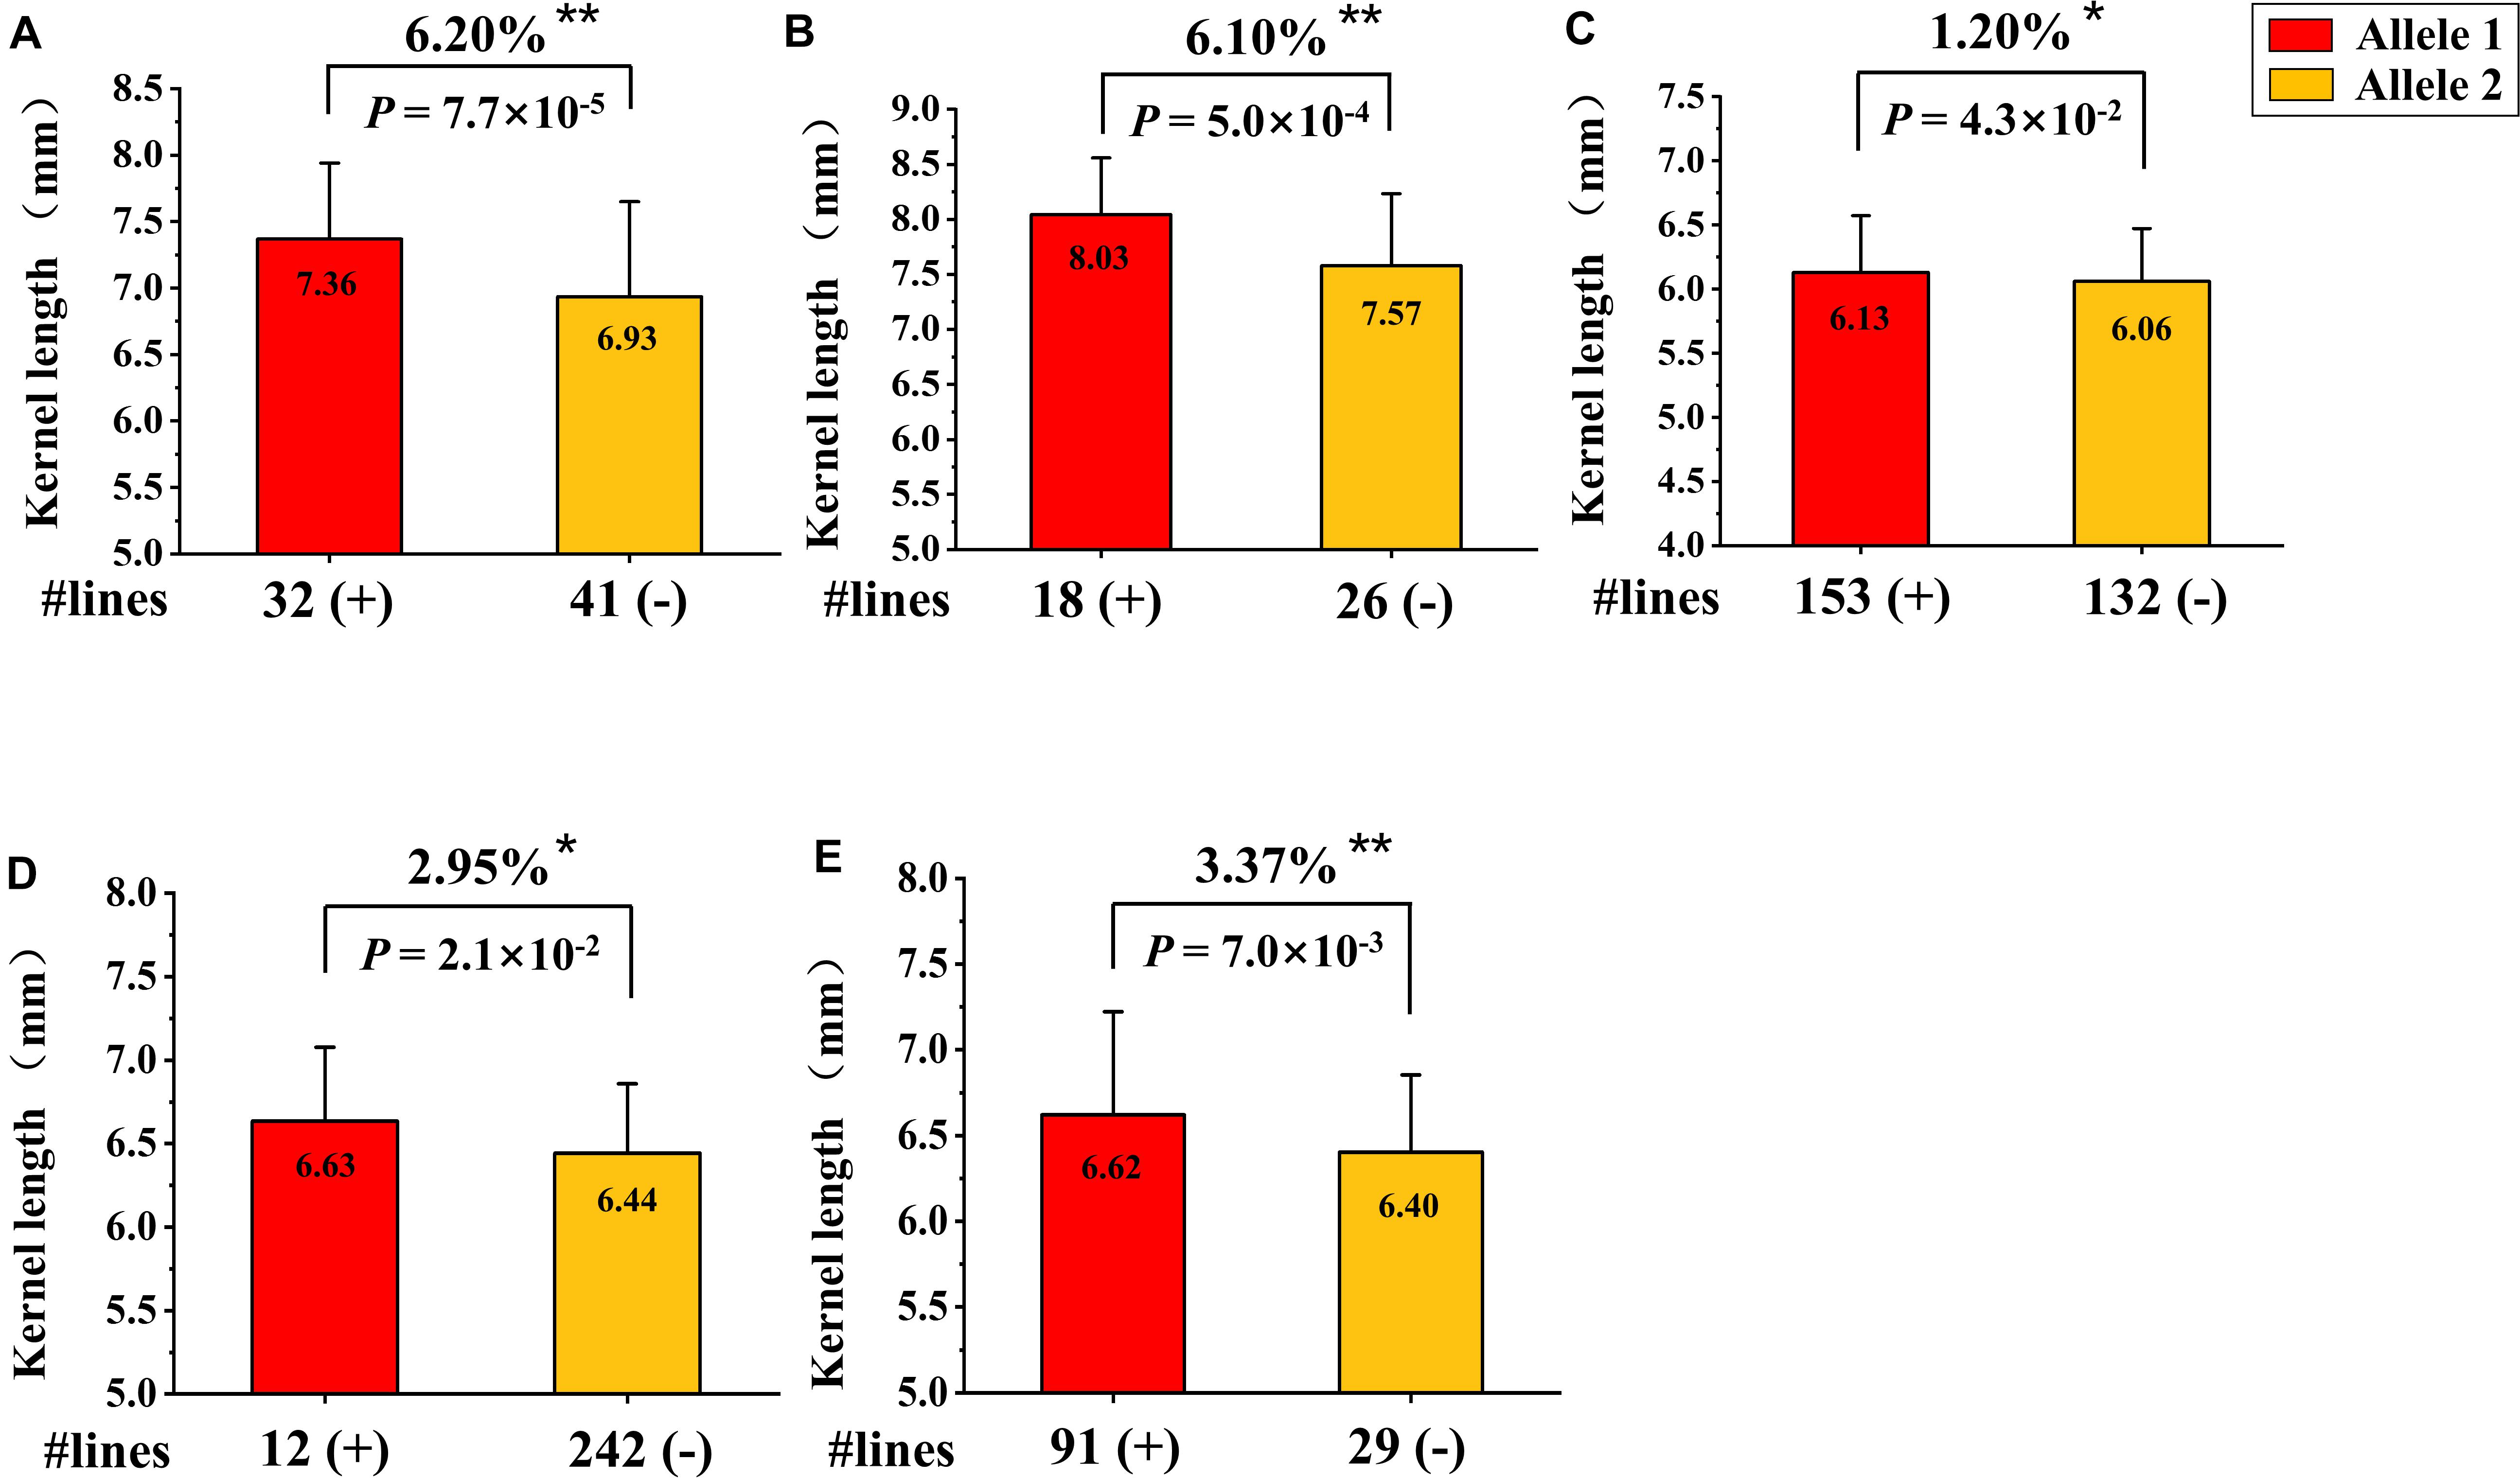
Figure 7. Validation of QKL.sicau-2SY-1B in two different genetic populations and three variety panels. (A,B) Effects of QKL.sicau-2SY-1B in two validation populations of SSY (A) and MTL4SY (B) by fluorescence PCR typing results of the Kompetitive Allele Specific PCR (KASP) marker KASP- AX-109379070, respectively. (C–E) Effects of QKL.sicau-2SY-1B based on the flanking marker AX-109379070 in 300 Chinese wheat cultivars (CWC), 272 Chinese wheat landraces (CWL), and 165 Sichuan wheat cultivars (SWC), respectively. Allele1 (+) and Allele2 (-) represent lines with and without the positive alleles of the target quantitative trait loci (QTL) based on the flanking marker. **Significance at the 0.01 probability level; *significance at the 0.05 probability level.
Additionally, based on the genotyping results of the flanking marker AX-109379070 for KL, we validated the effect of QKL.sicau-2SY-1B in three variety panels. After excluding heterozygous lines, the lines in each panel were divided into two groups. The groups carrying alleles from SY95-71 significantly increased KL by 1.2, 2.95, and 3.37% in three variety panels, respectively (P < 0.05) (Figures 7C–E).
Discussion
Contribution of D Genome to Kernel-Related Traits
Three major QTLs for KW, LWR, and KS and a minor QTL for KL were identified on the 6D chromosome, whereas four major QTLs for KT, TKW, KS, and FFD and a minor QTL for KL, LWR, and FFD were identified on 2D chromosome. Zhao et al. (2017) constructed the first genome-based gene/QTL map for A. tauschii and observed that numerous genes or QTLs were detected on the 2D and 7D chromosomes. Many previous studies also detected kernel-related traits on 2D chromosome (Ammiraju et al., 2001; Huang et al., 2003, 2006, 2015; Cuthbert et al., 2008; Zhang et al., 2015). Our results together with those reported previously suggested that 2D and 6D chromosomes may have played a positive contribution to wheat kernel improvement. Thus, A. tauschii as the important genetic resource and donor of D genome should be further utilized through synthetic hexaploidy wheat given its important role in regulating kernel size (Okamoto et al., 2013; Arora et al., 2017).
QTL Clusters on 1BL, 2DL, and 6DS Chromosomes
In wheat, QTLs for quantitative inheritance are usually located in gene-rich regions, and they are usually mapped to the same genomic region to form clusters (Mccartney et al., 2005; Li et al., 2007). In previous studies, some pleiotropic QTLs related to kernel traits were reported (Sun et al., 2009; Ramya et al., 2010; Cheng et al., 2015; Li et al., 2015; Zhang et al., 2015; Cabral et al., 2018; Kumari et al., 2018; Ma et al., 2019c). In this study, the major QTLs controlling KL and KS were located within 4 cM on the long arm of chromosome 1BL; the major QTLs controlling KT, TKW, KS, and FFD were located within 14 cM on the long arm of chromosome 2DL, and the major QTLs controlling KW, LWR, and KS were located within 5 cM on the short arm of chromosome 6DS. These overlapping QTL indicated that either a single QTL has a pleiotropic effect, or the genomic region associated with these QTL has a set of pertinent genes related to these traits. Therefore, the above three QTL clusters are of great value in marker-assisted breeding and should be paid more attention to in wheat genetics and improvement.
Favorable Alleles at Major QTL Are Inherited From Low-Value Parents
Previous studies reported that additive effects of a few QTL can be detected from lower-value parents. For example, the KW and TKW of the parent Shannong483 were significantly higher than the parent Chuan35050, but the positive alleles at QKw.sdau-6A and QTkw.sdau-6A were detected from the latter (Sun et al., 2009). Another example is from the study reported by Mohler et al. (2016). The KL of the parent Pamier was larger, and the KW was smaller than the other parent Format. However, a major QTL controlling KL, the increased allele of which was inherited from the shorter kernel parent Format, was detected between makers TaCwi-A1 and BS00090569_51 on chromosome 2A, and a major QTL controlling KW, the positive allele of which was contributed by the narrow-kernel parent Pamier, was detected between makers BS00010625_51 and IWB7258 on chromosome 1B (Mohler et al., 2016).
Here, although the KL value of SY95-71 was significantly lower than 20828, we identified a major QTL QKL.sicau-2SY-1B for KL, the positive allele from which was contributed by the former. Furthermore, the effect of this favorable allele (i.e., SY95-71 allele) at QKL.sicau-2SY-1B was successfully verified in two different RIL populations and three variety panels. These results further suggested that genetic recombination between two genotypes provides a chance of producing an offspring carrying a single locus without other inhibiting loci that can exhibit an obvious corresponding phenotype. We should also know that some major QTLs, the positive allele of which is from higher-value parents, might not be detected because of the low coverage of SNP arrays distributed in the centromeres of chromosomes (Liu et al., 2020). Thus, in order to solve the defect of low enrichment of SNP in some regions of chromosome, scanning the whole genome using more mapped markers is necessary for accurate evaluation major QTLs for kernel-related traits.
Comparison With Previous Studies
The comparison of physical regions showed that QKT.sicau-2SY-2D, QTKW.sicau-2SY-2D, QKS.sicau-2SY-2D, and QFFD.sicau-2SY-2D were colocated between 481.5 and 512.8 Mbp on chromosome 2DL of CS reference genome. These loci were overlapped with a QTL cluster for TKW, KW, and kernel area on 2D between 481.6 and 523.1 Mbp in previous research (Mohler et al., 2016), suggesting they were likely alleles (Supplementary Table 9). QGwid.ccsu-6D.1 for KW and kernel surface area were located at 62.0 to 79.9 Mbp on 6DS chromosome (Tyagi et al., 2015), which was overlapped with the physical interval 45.9 to 73.3 Mbp of the cluster QKW.sicau-2SY-6D, QLWR.sicau-2SY-6D, and QKS.sicau-2SY-6D in this study (Supplementary Table 10). Therefore, there may be QTL clusters controlling kernel traits in the 45.9- to 79.9-Mbp region of 6DS chromosome. So far, there was no other QTL in the physical interval 566.6 to 583.6 Mbp on 1BL, indicating QKL.sicau-2SY-1B and QKS.sicau-2SY-1B are likely new QTLs (Supplementary Table 10). The physical location information of each major QTL is shown in Supplementary Table 11.
Genes Located in the Intervals of the Three QTL Clusters
We attempted to predicate candidate genes for the identified QTLs conferring the kernel-related traits on chromosomes 1BL, 6DS, and 2DL based on the homology comparison results for CS with Triticum turgidum and A. tauschii reference genomes. Functional annotation results showed that the QTL cluster on 1BL between 566.6 to 583.6 Mbp on CS and 571.5 to 590.6 Mbp on T. turgidum physical regions contained 51 common predicated genes. TraesCS1B01G351200 encodes proteins containing the VQ motif, and proteins with the same domain are reported to regulate endosperm growth and kernel size in model plant A. thaliana (Wang et al., 2010). TraesCS1B01G338700 encodes a B3 domain–containing protein family and was reported to control endosperm development and kernel filling in maize TraesCS1B01G338700 encodes a B3 domain–containing protein family, and the same proteins are found to control endosperm development and kernel filling in maize (Grimault et al., 2015). NHL domain–containing protein and carboxypeptidase encoded by TraesCS1B01G349800 and TraesCS1B01G345000 and functional proteins with these two domains regulate KS and kernel weight in rice and wheat (Chen et al., 2015; Ma et al., 2016). The QTL cluster on 6DS between 45.9 to 73.3 Mbp on CS and 69.7 to 97.7 Mbp on A. tauschii physical regions contained 186 common predicated genes. The BURP domain protein RD22 is encoded by TraesCS6D01G081900 and TraesCS6D01G082000; these proteins with the same domain are related to the content of storage proteins and the composition of fatty acids in A. thaliana and ultimately affect the development of seed (Van Son et al., 2009). The cyclin-dependent kinase inhibitor is encoded by TraesCS6D01G088500; this kind of protein played an important role in the exit from the mitotic cell cycle during rice kernel formation (Barrôco et al., 2006). The QTL cluster on 2DL between 481.5 to 512.8 Mbp on CS and 480.9 to 511.6 Mbp on A. tauschii physical regions contained 147 common predicated genes. TraesCS2D01G391600 encodes an expansin protein, a protein with this domain that interacts with E3 ubiquitin ligase and regulates kernel development after ubiquitin modification in rice (Choi et al., 2018). TraesCS2D01G385000 encodes a kinesin-like protein; the gene encoding this kind of proteins has been reported to bind to the promoter of gibberellic acid (GA) biosynthesis gene and regulated cell elongation during panicle and seed development through GA biosynthesis in rice (Li et al., 2011). Interestingly, F-box family proteins were identified in all three QTL clusters. For some F-box proteins, it was involved in the nutrition and reproductive development of many plants, coding genes of which have a specific expression in flowering, spike, and seed stages and are important for the regulation of cellular protein degradation (Jain et al., 2007; van den Burg et al., 2008). These genes associated with cell expansion and plant reproductive development are the focus of our subsequent research.
Relationship Between Kernel Traits and Other Agronomic Traits
In this study, positive correlations among the KL, KW, KT, TKW, and KS kernel traits were detected (Supplementary Table 4), and similar results have been previously reported (Sun et al., 2009; Gegas et al., 2010; Liu et al., 2010; Prashant et al., 2012; Zhang et al., 2015; Ma et al., 2019c; Xin et al., 2020), suggesting selection for higher TKW kernels might lead to direct selection for larger seeds in the breeding process (Ramya et al., 2010). In the analysis of other agronomic traits, KL and KW were negatively correlated with PTN (Supplementary Table 5). The analysis of QTL mapping interval in KW showed that there were indeed genes regulating tiller number. For example, TraesCS6D01G082300 encodes a esterase/lipase/thioesterase-like protein, and the gene encoding this protein played a negative role in the regulation of PTN in rice (Liu et al., 2009; Supplementary Table 9). Therefore, the increase of tillers may be accompanied by a decline of the kernel-related traits. Zhang et al. (2015) and Ma et al. (2019c) also reached the same conclusion that PH was positively correlated with KW and TKW. We further genetically analyzed the relationship between the kernel-related traits and PH and AD. Reported QTLs for PH (32.7–46.8 Mbp) and AD (35.6–46.8 Mbp) on chromosome arm 2DS (Liu et al., 2020) were far away from the 2DL QTL cluster (Table 2). Similarly, the gene early flowering 3 (ELF3), located at 685.6 Mbp on 1BL (Wang et al., 2016), was far away from the 1BL QTL cluster. These genes/QTLs that affect flowering and PH do not overlap with the QKL.sicau-2SY-1B. The longer SL may play a positive role in regulating development of kernel-related traits given that positive correlations were detected between SL and the seven kernel-related traits (Supplementary Table 5). Consistent with previous studies, SD was negatively correlated with KL and TKW (Wu et al., 2012; Liu et al., 2019). Therefore, increasing SL without changing SD may be a way to improve spike fertility and kernel yield (Sourdille et al., 2000). These correlations among these agronomic traits indicated that a reasonable control of the relationship between them can speed up the breeding process and increase the wheat yield.
Conclusion
We identified nine stable and major QTLs for kernel-related traits including KL, KW, KT, TKW, LWR, KS, and FFD. These major QTLs formed three QTL clusters on 1BL, 2DL, and 6DS chromosomes. A novel QTL for KL was identified and validated in two RIL populations with different genetic backgrounds and three variety panels. Other major QTLs were previously detected and also identified in this study. We further analyzed and discussed the contribution and interaction of these kernel-related major QTLs. The predicted genes in the QKL.sicau-2SY-1B interval will be valuable for the subsequent fine mapping of candidate genes. The major QTLs for kernel traits identified and the developed KASP marker for QKL.sicau-2SY-1B may enhance the value of its use in wheat breeding.
Data Availability Statement
The original contributions presented in the study are included in the article/Supplementary Material, further inquiries can be directed to the corresponding author/s.
Author Contributions
XQ and JL performed the entire study and drafted this manuscript. XX did the phenotype measurement and data analysis. QX and HT did the field work and data analysis. YM, ZP, YL, JM, and YG collected and analyzed the data. QJ and YxL helped with the data analysis. GC, JW, and PQ did the QTL analysis and manuscript revision. AH and YW revised the manuscript. YZ discussed the results and revised the manuscript. XL guided the study and revised the manuscript. JM designed the experiments, guided the entire study, participated in data analysis, wrote and extensively revised this manuscript. All authors participated in the research and approved the final manuscript.
Funding
This work was supported by the National Natural Science Foundation of China (31970243 and 31971937), the Key Research and Development Program of Sichuan Province (2018NZDZX0002), the International Science and Technology Cooperation and Exchanges Program of Science and Technology Department of Sichuan Province (2021YFH0083), the Applied Basic Research Programs of Science and Technology Department of Sichuan Province (2020YJ0140 and 2021YJ0503), and the Key Projects of Scientific and Technological Activities for Overseas Students of Sichuan Province.
Conflict of Interest
The authors declare that the research was conducted in the absence of any commercial or financial relationships that could be construed as a potential conflict of interest.
Acknowledgments
We appreciate Jorge Dubcovsky’s critical suggestion on this manuscript. We thank the referees for reading and revising this manuscript.
Supplementary Material
The Supplementary Material for this article can be found online at: https://www.frontiersin.org/articles/10.3389/fpls.2021.667493/full#supplementary-material
Supplementary Table 1 | Information of three variety panels assessed in this study (S1.1–1.3).
Supplementary Table 2 | Ecological locations for measuring kernel length (KL), kernel width (KW), kernel thickness (KT), thousand-kernel weight (TKW), kernel length–width ratio (LWR), kernel size (KS), factor form density (FFD), spikelet number per spike (SNS), plant height (PH), productive tiller number (PTN), flag leaf length (FLL), flag leaf length width (FLW), spike length (SL), and spike density (SD).
Supplementary Table 3 | Correlation coefficients for kernel traits in different environments.
Supplementary Table 4 | Correlation coefficients among different kernel traits.
Supplementary Table 5 | Correlation coefficients for kernel traits with spikelet number per spike (SNS), plant height (PH), productive tiller number (PTN), flag leaf length (FLL), flag leaf width (FLW), spike length (SL), and spike density (SD) in 2SY population.
Supplementary Table 6 | All quantitative trait loci for kernel traits identified in the “20828” × “SY95-71” population evaluated in different environments.
Supplementary Table 7 | Analyses of variance for kernel-related traits.
Supplementary Table 8 | Quantitative trait loci (QTL) detected in the QTL × environment (QE) interaction module for kernel-related traits in 2SY population.
Supplementary Table 9 | Predicted genes in the interval of the major QTL (S9.1–9.3).
Supplementary Table 10 | Comparison of the major quantitative trait loci (QTL) for kernel-related traits identified in this study with previous studies.
Supplementary Table 11 | The physical location information of the detected major QTL.
Footnotes
- ^ http://en.wikipedia.org/wiki/SPSS
- ^ http://www.isbreeding.net/
- ^ http://wheat.pw.usda.gov/ggpages/wgc/98/Intro.htm
- ^ https://www.ncbi.nlm.nih.gov/
- ^ http://wheat.pw.usda.gov/GG3/index.shtml
- ^ https://urgi.versailles.inra.fr/download/iwgsc/
References
Agrama, H. A., Eizenga, G. C., and Yan, W. (2007). Association mapping of yield and its components in rice cultivars. Mol. Breed. 19, 341–356. doi: 10.1007/s11032-006-9066-6
Alexander, W. L., Smith, E. L., and Dhanasobhan, C. (1984). A comparison of yield and yield component selection in winter wheat. Euphytica 33, 953–961. doi: 10.1007/BF00021926
Ammiraju, J. S. S., Dholakia, B. B., Santra, D. K., Singh, H., Lagu, M. D., Tamhankar, S. A., et al. (2001). Identification of inter simple sequence repeat (ISSR) markers associated with seed size in wheat. Theor. Appl. Genet. 102, 726–732. doi: 10.1007/s001220051703
Arora, S., Singh, N., Kaur, S., Bains, N. S., Uauy, C., Poland, J., et al. (2017). Genome-wide association study of grain architecture in wild wheat Aegilops tauschii. Front. Plant. Sci. 8:886. doi: 10.3389/fpls.2017.00886
Ashikari, M., Sakakibara, H., Lin, S., Yamamoto, T., Takashi, T., Nishimura, A., et al. (2005). Cytokinin oxidase regulates rice grain production. Science 309, 741–745. doi: 10.1126/science.1113373
Bai, X. F., Luo, L. J., Yan, W. H., Kovi, M. R., Zhan, W., and Xing, Y. Z. (2010). Genetic dissection of rice grain shape using a recombinant inbred line population derived from two contrasting parents and fine mapping a pleiotropic quantitative trait locus qGL7. BMC Genet. 11:16. doi: 10.1186/1471-2156-11-16
Barrôco, R. M., Peres, A., Droual, A. M., De Veylder, L., De Wolf, J., Mironov, V., et al. (2006). The cyclin-dependent kinase inhibitor Orysa; KRP1 plays an important role in seed development of rice. Plant Physiol. 142, 1053–1064. doi: 10.1104/pp.106.087056
Börner, A., Schumann, E., Fürste, A., Cöster, H., Leithold, B., Röder, M. S., et al. (2002). Mapping of quantitative trait loci determining agronomic important characters in hexaploid wheat (Triticum aestivum L.). Theor. Appl. Genet. 105, 921–936. doi: 10.1007/s00122-002-0994-1
Brinton, J., Simmonds, J., Minter, F., Leverington-Waite, M., Snape, J., and Uauy, C. (2017). Increased pericarp cell length underlies a major quantitative trait locus for grain weight in hexaploid wheat. New Phytol. 215, 1026–1038. doi: 10.1111/nph.14624
Cabral, A. L., Jordan, M. C., Larson, G., Somers, D. J., Humphreys, D. G., and Mccartney, C. A. (2018). Relationship between QTL for grain shape, grain weight, test weight, milling yield, and plant height in the spring wheat cross RL4452/’AC Domain’. PLoS One 13:e0190681. doi: 10.1371/journal.pone.0190681
Cao, P., Liang, X. N., Zhao, H., Feng, B., and Hu, Y. X. (2019). Identification of the quantitative trait loci controlling spike-related traits in hexaploid wheat (Triticum aestivum L.). Planta 250, 1967–1981. doi: 10.1007/s00425-019-03278-0
Chastian, T. G., Ward, K. J., and Wysocki, D. J. (1995). Stand estblishment response of soft white winter wheat to seedbed residue and seed size. Crop Sci. 35, 213–218. doi: 10.2135/cropsci1995.0011183X003500010040x
Chen, J., Gao, H., Zheng, X. M., Jin, M. N., Weng, J. F., Ma, J., et al. (2015). An evolutionarily conserved gene, FUWA, plays a role in determining panicle architecture, grain shape and grain weight in rice. Plant J. 83, 427–438. doi: 10.1111/tpj.12895
Chen, Y., Yan, Y., Wu, T. T., Zhang, G. L., Gou, J. Y., Yin, H. R., et al. (2020). Cloning of wheat keto-acyl thiolase 2B reveals a role of jasmonic acid in grain weight determination. Nat. Commun. 11:6266. doi: 10.1038/s41467-020-20133-z
Cheng, X. J., Chai, L. L., Chen, Z., Xu, L., Zhai, H. J., Zhao, A. J., et al. (2015). Identification and characterization of a high kernel weight mutant induced by gamma radiation in wheat (Triticum aestivum L.). BMC Genet. 16:127. doi: 10.1186/s12863-015-0285-x
Cheng, X. J., Xin, M. M., Xu, R. B., Chen, Z. Y., Cai, W. L., Chai, L. L., et al. (2020). A single amino acid substitution in STKc_GSK3 kinase conferring semispherical grains and its implications for the origin of Triticum sphaerococcum. Plant Cell 32, 923–934. doi: 10.1105/tpc.19.00580
Choi, B. S., Kim, Y. J., Markkandan, K., Koo, Y. J., Song, J. T., and Seo, H. S. (2018). GW2 functions as an E3 Ubiquitin ligase for rice expansin-Like 1. Int. J. Mol. Sci. 19:1904. doi: 10.3390/ijms19071904
Cristobal, U. (2017). Wheat genomics comes of age. Curr. Opin. Plant Biol. 36, 142–148. doi: 10.1016/j.pbi.2017.01.007
Cui, F., Fan, X. L., Chen, M., Zhang, N., Zhao, C. H., Zhang, W., et al. (2016). QTL detection for wheat kernel size and quality and the responses of these traits to low nitrogen stress. Theor. Appl. Genet. 129, 469–484. doi: 10.1007/s00122-015-2641-7
Cui, F., Zhao, C. H., Ding, A. M., Li, J., Wang, L., Li, X. F., et al. (2014). Construction of an integrative linkage map and QTL mapping of grain yield-related traits using three related wheat RIL populations. Theor. Appl. Genet. 127, 659–675. doi: 10.1007/s00122-013-2249-8
Cuthbert, J. L., Somers, D. J., Brûlé-Babel, A. L., Brown, P. D., and Crow, G. H. (2008). Molecular mapping of quantitative trait loci for yield and yield components in spring wheat (Triticum aestivum L.). Theor. Appl. Genet. 117, 595–608. doi: 10.1007/s00122-008-0804-5
Fan, C. C., Xing, Y. Z., Mao, H. L., Lu, T. T., Han, B., Xu, C. G., et al. (2006). GS3, a major QTL for grain length and weight and minor QTL for grain width and thickness in rice, encodes a putative transmembrane protein. Theor. Appl. Genet. 112, 1164–1171. doi: 10.1007/s00122-006-0218-1
Gao, Y. T., Xu, X. R., Jin, J. J., Duan, S. N., Zhen, W. C., Xie, C. J., et al. (2021). Dissecting the genetic basis of grain morphology traits in Chinese Wheat by genome wide association studies. Euphytica 217:56. doi: 10.1007/s10681-021-02795-y
Gegas, V. C., Nazari, A., Griffiths, S., Simmonds, J., Fish, L., Orford, S., et al. (2010). A genetic framework for grain size and shape variation in wheat. Plant Cell 22, 1046–1056. doi: 10.1105/tpc.110.074153
Grimault, A., Gendrot, G., Chaignon, S., Gilard, F., Tcherkez, G., Thévenin, J., et al. (2015). Role of B3 domain transcription factors of the AFL family in maize kernel filling. Plant Sci. 236, 116–125. doi: 10.1016/j.plantsci.2015.03.021
Hu, Z. J., Lu, S. J., Wang, M. J., He, H. H., Sun, L., Wang, H. R., et al. (2018). A novel QTL qTGW3 encodes the GSK3/SHAGGY-like kinase OsGSK5/OsSK41 that interacts with OsARF4 to negatively regulate grain size and weight in rice. Mol. Plant 11, 736–749. doi: 10.1016/j.molp.2018.03.005
Huang, R. Y., Jiang, L. R., Zheng, J. S., Wang, T. S., Wang, H. C., Huang, Y. M., et al. (2012). Genetic bases of rice grain shape: so many genes, so little known. Trends Plant Sci. 18, 218–226. doi: 10.1016/j.tplants.2012.11.001
Huang, X., Cöster, H., Ganal, M., and Röder, M. (2003). Advanced backcross QTL analysis for the identification of quantitative trait loci alleles from wild relatives of wheat (Triticum aestivum L.). Theor. Appl. Genet. 106, 1379–1389. doi: 10.1007/s00122-002-1179-7
Huang, X. Q., Cloutier, S., Lycar, L., Radovanovic, N., Humphreys, D. G., Noll, J. S., et al. (2006). Molecular detection of QTLs for agronomic and quality traits in a doubled haploid population derived from two Canadian wheats (Triticum aestivum L.). Theor. Appl. Genet. 113, 753–766. doi: 10.1007/s00122-006-0346-7
Huang, Y. L., Kong, Z. X., Wu, X. Y., Cheng, R. R., Yu, D., and Ma, Z. Q. (2015). Characterization of three wheat grain weight QTLs that differentially affect kernel dimensions. Theor. Appl. Genet. 128, 2437–2445. doi: 10.1007/s00122-015-2598-6
International Wheat Genome Sequencing Consortium (2018). Shifting the limits in wheat research and breeding using a fully annotated reference genome. Science 361:eaar7191. doi: 10.1126/science.aar7191
Jain, M., Nijhawan, A., Arora, R., Agarwal, P., Ray, S., Sharma, P., et al. (2007). F-box proteins in rice. Genome-wide analysis, classification, temporal and spatial gene expression during panicle and seed development, and regulation by light and abiotic stress. Plant Physiol. 143, 1467–1483. doi: 10.1104/pp.106.091900
Jin, J. J., Duan, S. N., Qi, Y. Z., Yan, S. H., Li, W., Li, B. Y., et al. (2020). Identification of a novel genomic region associated with resistance to Fusarium crown rot in wheat. Theor. Appl. Genet. 113, 2063–2073. doi: 10.1007/s00122-020-03577-1
Kumari, S., Jaiswal, V., Mishra, V. K., Paliwal, R., Balyan, H. S., and Gupta, P. K. (2018). QTL mapping for some grain traits in bread wheat (Triticum aestivum L.). Physiol. Mol. Biol. Plants 24, 909–920. doi: 10.1007/s12298-018-0552-1
Lan, T. R., He, K. H., Chang, L. G., Cui, T. T., Zhao, Z. X., Xue, J. Q., et al. (2018). QTL mapping and genetic analysis for maize kernel size and weight in multi-environments. Euphytica 214:119. doi: 10.1007/s10681-018-2189-0
Li, C., Tang, H. P., Luo, W., Zhang, X. M., Mu, Y., Deng, M., et al. (2020). A novel, validated, and plant height-independent QTL for spike extension length is associated with yield-related traits in wheat. Theor. Appl. Genet. 133, 3381–3393. doi: 10.1007/s00122-020-03675-0
Li, J., Jiang, J. F., Qian, Q., Xu, Y. Y., Zhang, C., Xiao, J., et al. (2011). Mutation of rice BC12/GDD1, which encodes a kinesin-like protein that binds to a GA biosynthesis gene promoter, leads to dwarfism with impaired cell elongation. Plant Cell 23, 628–640. doi: 10.1105/tpc.110.081901
Li, M. X., Wang, Z. L., Liang, Z. Y., Shen, W. N., Sun, F. L., Xi, Y. J., et al. (2015). Quantitative trait loci analysis for kernel-related characteristics in common wheat (Triticum aestivum L.). Crop Sci. 55, 1485–1493. doi: 10.2135/cropsci2014.09.0616
Li, S. S., Jia, J. Z., Wei, X. Y., Zhang, X. C., Li, L. Z., Chen, H. M., et al. (2007). A intervarietal genetic map and QTL analysis for yield traits in wheat. Mol. Breed. 20, 167–178. doi: 10.1007/s11032-007-9080-3
Liu, H., Ma, J., Tu, Y., Zhu, J., Ding, P. Y., Liu, J. J., et al. (2019). Several stably expressed QTL for spike density of common wheat (Triticum aestivum) in multiple environments. Plant Breed. 139, 284–294. doi: 10.1111/pbr.12782
Liu, J. J., Tang, H. P., Qu, X. R., Liu, H., Li, C., Tu, Y., et al. (2020). A novel, major, and validated QTL for the effective tiller number located on chromosome arm 1BL in bread wheat. Plant Mol. Biol. 104, 173–185. doi: 10.1007/s11103-020-01035-6
Liu, T. M., Shao, D., Kovi, M. R., and Xing, Y. Z. (2010). Mapping and validation of quantitative trait loci for spikelets per panicle and 1,000-grain weight in rice (Oryza sativa L.). Theor. Appl. Genet. 120, 933–942. doi: 10.1007/s00122-009-1222-z
Liu, W. Z., Wu, C., Fu, Y. P., Hu, G. C., Si, H. M., Zhu, L., et al. (2009). Identification and characterization of HTD2: a novel gene negatively regulating tiller bud outgrowth in rice. Planta 230, 649–658. doi: 10.1007/s00425-009-0975-6
Liu, Y. X., Lin, Y., Gao, S., Li, Z. Y., Ma, J., Deng, M., et al. (2017). A genome-wide association study of 23 agronomic traits in Chinese wheat landraces. Plant J. 91, 861–873. doi: 10.1111/tpj.13614
Ma, D. Y., Yan, J., He, Z. H., Wu, L., and Xia, X. C. (2012). Characterization of a cell wall invertase gene TaCwi-A1 on common wheat chromosome 2A and development of functional markers. Mol. Breed. 29, 43–52. doi: 10.1007/s11032-010-9524-z
Ma, J., Ding, P. Y., Liu, J. J., Li, T., Zou, Y. Y., Habib, A., et al. (2019a). Identification and validation of a major and stably expressed QTL for spikelet number per spike in bread wheat. Theor. Appl. Genet. 132, 3155–3167. doi: 10.1007/s00122-019-03415-z
Ma, J., Qin, N. N., Cai, B., Chen, G. Y., Ding, P. Y., Zhang, H., et al. (2019b). Identification and validation of a novel major QTL for all-stage stripe rust resistance on 1BL in the winter wheat line 20828. Theor. Appl. Genet. 132, 1363–1373. doi: 10.1007/s00122-019-03283-7
Ma, J., Tu, Y., Zhu, J., Luo, W., Liu, H., Li, C., et al. (2020). Flag leaf size and posture of bread wheat: genetic dissection, QTL validation and their relationships with yield-related traits. Theor. Appl. Genet. 133, 297–315. doi: 10.1007/s00122-019-03458-2
Ma, J., Zhang, H., Li, S. Q., Zou, Y. Y., Li, T., Liu, J. J., et al. (2019c). Identification of quantitative trait loci for kernel traits in a wheat cultivar Chuannong16. BMC Genet. 20:77. doi: 10.1186/s12863-019-0782-4
Ma, L., Li, T., Hao, C. Y., Wang, Y. Q., Chen, X. H., and Zhang, X. Y. (2016). TaGS5-3A, a grain size gene selected during wheat improvement for larger kernel and yield. Plant Biotechnol. J. 14, 1269–1280. doi: 10.1111/pbi.12492
Mccartney, C. A., Somers, D. J., Humphreys, D. G., Lukow, O., Ames, N., Noll, J., et al. (2005). Mapping quantitative trait loci controlling agronomic traits in the spring wheat cross RL4452x’AC Domain’. Genome 48, 870–883. doi: 10.1139/g05-055
Mohler, V., Albrecht, T., Castell, A., Diethelm, M., Schweizer, G., and Hartl, L. (2016). Considering causal genes in the genetic dissection of kernel traits in common wheat. J. Appl. Genet. 57, 467–476. doi: 10.1007/s13353-016-0349-2
Okamoto, Y., Nguyen, A. T., Yoshioka, M., Iehisa, J. C. M., and Takumi, S. (2013). Identification of quantitative trait loci controlling grain size and shape in the D genome of synthetic hexaploid wheat lines. Breed. Sci. 63, 423–429. doi: 10.1270/jsbbs.63.423
Patil, R. M., Tamhankar, S. A., Oak, M. D., Raut, A. L., Honrao, B. K., Rao, V. S., et al. (2013). Mapping of QTL for agronomic traits and kernel characters in durum wheat (Triticum durum Desf.). Euphytica 190, 117–129. doi: 10.1007/s10681-012-0785-y
Prashant, R., Kadoo, N., Desale, C., Kore, P., Dhaliwal, H. S., Chhuneja, P., et al. (2012). Kernel morphometric traits in hexaploid wheat (Triticum aestivum L.) are modulated by intricate QTL × QTL and genotype × environment interactions. J. Cereal Sci. 56, 432–439. doi: 10.1016/j.jcs.2012.05.010
Qiu, X. J., Gong, R., Tan, Y. B., and Yu, S. B. (2012). Mapping and characterization of the major quantitative trait locus qSS7 associated with increased length and decreased width of rice seeds. Theor. Appl. Genet. 125, 1717–1726. doi: 10.1007/s00122-012-1948-x
Ramya, P., Chaubal, A., Kulkarni, K., Gupta, L., Kadoo, N., Dhaliwal, H. S., et al. (2010). QTL mapping of 1000-kernel weight, kernel length, and kernel width in bread wheat (Triticum aestivum L.). J. Appl. Genet. 51, 421–429. doi: 10.1007/BF03208872
Ren, T. H., Fan, T., Chen, S. L., Li, C. S., Chen, Y. Y., Ou, X., et al. (2021). Utilization of a Wheat55K SNP array-derived high-density genetic map for high-resolution mapping of quantitative trait loci for important kernel-related traits in common wheat. Theor. Appl. Genet. 4, 1–15. doi: 10.1007/s00122-020-03732-8
Sakuma, S., Golan, G., Guo, Z., Ogawa, T., Tagiri, A., Sugimoto, K., et al. (2019). Unleashing floret fertility in wheat through the mutation of a homeobox gene. Proc. Natl. Acad. Sci.U.S.A. 116, 5182–5187. doi: 10.1073/pnas.1815465116
Smith, S. E., Kuehl, R. O., Ray, I. M., Hui, R., and Soleri, D. (1998). Evaluation of simple methods for estimating broad-sense heritability in stands of randomly planted genotypes. Crop Sci. 38, 1125–1129. doi: 10.2135/cropsci1998.0011183X003800050003x
Song, X. J., Huang, W., Shi, M., Zhu, M. Z., and Lin, H. X. (2007). A QTL for rice grain width and weight encodes a previously unknown RING-type E3 ubiquitin ligase. Nat. Genet. 39:623. doi: 10.1038/ng2014
Sourdille, P., Tixier, M. H., Charmet, G., Cadalen, T., Bernard, S., and Bernard, M. (2000). Location of genes involved in ear compactness in wheat (Triticum aestivum) by means of molecular markers. Mol. Breed. 6, 247–255. doi: 10.1023/A:1009688011563
Sun, X. Y., Wu, K., Zhao, Y., Kong, F. M., Han, G. Z., Jiang, H. M., et al. (2009). QTL analysis of kernel shape and weight using recombinant inbred lines in wheat. Euphytica 165:615. doi: 10.1007/s10681-008-9794-2
Tu, Y., Liu, H., Liu, J. J., Tang, H. P., Mu, Y., Deng, M., et al. (2021). QTL mapping and validation of bread wheat flag leaf morphology across multiple environments in different genetic backgrounds. Theor. Appl. Genet. 134, 261–278. doi: 10.1007/s00122-020-03695-w
Tyagi, S., Mir, R. R., Balyan, H. S., and Gupta, P. K. (2015). Interval mapping and meta-QTL analysis of grain traits in common wheat (Triticum aestivum L.). Euphytica 201, 367–380. doi: 10.1007/s10681-014-1217-y
van den Burg, H. A., Tsitsigiannis, D. I., Rowland, O., Lo, J., Rallapalli, G., MacLean, D., et al. (2008). The F-box protein ACRE189/ACIF1 regulates cell death and defense responses activated during pathogen recognition in tobacco and tomato. Plant Cell 20, 697–719. doi: 10.1105/tpc.107.056978
Van Son, L., Tiedemann, J., Rutten, T., Hillmer, S., Hinz, G., Zank, T., et al. (2009). The BURP domain protein AtUSPL1 of Arabidopsis thaliana is destined to the protein storage vacuoles and overexpression of the cognate gene distorts seed development. Plant Mol. Biol. 71:319. doi: 10.1007/s11103-009-9526-6
Wang, A. H., Garcia, D., Zhang, H. Y., Feng, K., Chaudhury, A., Berger, F., et al. (2010). The VQ motif protein IKU1 regulates endosperm growth and seed size in Arabidopsis. Plant J. 63, 670–679. doi: 10.1111/j.1365-313x.2010.04271.x
Wang, J. P., Wen, W., Hanif, M., Xia, X. C., Wang, H. G., Liu, S. B., et al. (2016). TaELF3-1DL, a homolog of ELF3, is associated with heading date in bread wheat. Mol. Breed. 36:161. doi: 10.1007/s11032-016-0585-5
Wu, Q. H., Chen, Y. X., Zhou, S. H., Fu, L., Chen, J. J., Xiao, Y., et al. (2015). High-density genetic linkage map construction and QTL mapping of grain shape and size in the wheat population Yanda1817× Beinong6. PLoS One 10:e0118144. doi: 10.1371/journal.pone.0118144
Wu, X. S., Chang, X. P., and Jing, R. L. (2012). Genetic insight into yield-associated traits of wheat grown in multiple rain-fed environments. PLoS One 7:e31249. doi: 10.1371/journal.pone.0031249
Xia, D., Zhou, H., Liu, R. J., Dan, W. H., Li, P. B., Wu, B., et al. (2018). GL3. 3, a novel QTL encoding a GSK3/SHAGGY-like kinase, epistatically interacts with GS3 to produce extra-long grains in rice. Mol. Plant 11, 754–756. doi: 10.1016/j.molp.2018.03.006
Xin, F., Zhu, T., Wei, S. W., Han, Y. C., Zhao, Y., Zhang, D. Z., et al. (2020). QTL mapping of kernel traits and validation of a major QTL for kernel length-width ratio using SNP and bulked segregant analysis in wheat. Sci. Rep. 10:25. doi: 10.1038/s41598-019-56979-7
Yan, X. F., Zhao, L., Ren, Y., Dong, Z. D., Cui, D. Q., and Chen, F. (2019). Genome-wide association study revealed that the TaGW8 gene was associated with kernel size in Chinese bread wheat. Sci. Rep. 9:2702. doi: 10.1038/s41598-019-38570-2
Yang, C., Zhang, L., Jia, A. M., and Rong, T. Z. (2016). Identification of QTL for maize grain yield and kernel-related traits. J. Genet. 95, 239–247. doi: 10.1007/s12041-016-0628-z
Ye, X. L., Li, J., Cheng, Y. K., Yao, F. J., Long, L. L., Yu, C., et al. (2019). Genome-wide association study of resistance to stripe rust (Puccinia striiformis f. sp. tritici) in Sichuan wheat. BMC Plant Biol. 19:147. doi: 10.1186/s12870-019-1764-4
Ying, J. Z., Ma, M., Bai, C., Huang, X. H., Liu, J. L., Fan, Y. Y., et al. (2018). TGW3, a major QTL that negatively modulates grain length and weight in rice. Mol. Plant 11, 750–753. doi: 10.1016/j.molp.2018.03.007
Zhang, G. Z., Wang, Y. Y., Ying, G., Yan, Z., Kong, F. M., and Li, S. S. (2015). Characterization and mapping of QTLs on chromosome 2D for grain size and yield traits using a mutant line induced by EMS in wheat. Crop J. 3, 135–144. doi: 10.1016/j.cj.2014.11.002
Zhang, L., Zhao, Y. L., Gao, L. F., Zhao, G. Y., Zhou, R. H., Zhang, B. S., et al. (2012). TaCKX6-D1, the ortholog of rice OsCKX2, is associated with grain weight in hexaploid wheat. New Phytol. 195, 574–584. doi: 10.1111/j.1469-8137.2012.04194.x
Zhao, G. Y., Zou, C., Li, K., Wang, K., Li, T. B., Gao, L. F., et al. (2017). The Aegilops tauschii genome reveals multiple impacts of transposons. Nat. Plants 3, 946–955. doi: 10.1038/s41477-017-0067-8
Zheng, X. W., Wen, X. J., Qiao, L., Zhao, J. J., Zhang, X. J., Li, X., et al. (2019). A novel QTL QTrl.saw-2D.2 associated with the total root length identified by linkage and association analyses in wheat (Triticum aestivum L.). Planta 250, 129–143. doi: 10.1007/s00425-019-03154-x
Zhou, X. H., Ma, J., Luo, W., Jiang, Y. F., Sun, M., Yang, Y. J., et al. (2020). QTL maping for kernel morphology traits of tibetan semi-wild wheat. J. Triticeae Crop 36, 27–35. (in Chineses).,Google Scholar
Keywords: common wheat, 55K SNP array, kernel traits, quantitative trait locus, validation
Citation: Qu X, Liu J, Xie X, Xu Q, Tang H, Mu Y, Pu Z, Li Y, Ma J, Gao Y, Jiang Q, Liu Y, Chen G, Wang J, Qi P, Habib A, Wei Y, Zheng Y, Lan X and Ma J (2021) Genetic Mapping and Validation of Loci for Kernel-Related Traits in Wheat (Triticum aestivum L.). Front. Plant Sci. 12:667493. doi: 10.3389/fpls.2021.667493
Received: 15 February 2021; Accepted: 22 April 2021;
Published: 07 June 2021.
Edited by:
Sean Mayes, University of Nottingham, United KingdomReviewed by:
Flavio Breseghello, Brazilian Agricultural Research Corporation (EMBRAPA), BrazilElisabetta Mazzucotelli, Council for Agricultural and Economics Research (CREA), Italy
Copyright © 2021 Qu, Liu, Xie, Xu, Tang, Mu, Pu, Li, Ma, Gao, Jiang, Liu, Chen, Wang, Qi, Habib, Wei, Zheng, Lan and Ma. This is an open-access article distributed under the terms of the Creative Commons Attribution License (CC BY). The use, distribution or reproduction in other forums is permitted, provided the original author(s) and the copyright owner(s) are credited and that the original publication in this journal is cited, in accordance with accepted academic practice. No use, distribution or reproduction is permitted which does not comply with these terms.
*Correspondence: Xiujin Lan, lanxiujin@163.com; Jian Ma, jianma@sicau.edu.cn; plantgbmj@hotmail.com
†These authors have contributed equally to this work