 Valentin Changenet1,2
 Catherine Macadré1,2Stéphanie Boutet-Mercey3Kévin Magne1,2Mélanie Januario1,2Marion Dalmais1,2Abdelhafid Bendahmane1,2Grégory Mouille3
 Marie Dufresne1,2*
- 1Université Paris-Saclay, CNRS, INRAE, University of Evry, Institute of Plant Sciences Paris-Saclay, Orsay, France
- 2Université de Paris, Institute of Plant Sciences Paris-Saclay, Orsay, France
- 3Institut Jean-Pierre Bourgin, INRAE, AgroParisTech, Université Paris-Saclay, Versailles, France
Fusarium Head Blight (FHB) is a cereal disease caused primarily by the ascomycete fungus Fusarium graminearum with public health issues due to the production of mycotoxins including deoxynivalenol (DON). Genetic resistance is an efficient protection means and numerous quantitative trait loci have been identified, some of them related to the production of resistance metabolites. In this study, we have functionally characterized the Brachypodium distachyon BdCYP711A29 gene encoding a cytochrome P450 monooxygenase (CYP). We showed that BdCYP711A29 belongs to an oligogenic family of five members. However, following infection by F. graminearum, BdCYP711A29 is the only copy strongly transcriptionally induced in a DON-dependent manner. The BdCYP711A29 protein is homologous to the Arabidopsis thaliana MAX1 and Oryza sativa MAX1-like CYPs representing key components of the strigolactone biosynthesis. We show that BdCYP711A29 is likely involved in orobanchol biosynthesis. Alteration of the BdCYP711A29 sequence or expression alone does not modify plant architecture, most likely because of functional redundancy with the other copies. B. distachyon lines overexpressing BdCYP711A29 exhibit an increased susceptibility to F. graminearum, although no significant changes in defense gene expression were detected. We demonstrate that both orobanchol and exudates of Bd711A29 overexpressing lines stimulate the germination of F. graminearum macroconidia. We therefore hypothesize that orobanchol is a susceptibility factor to FHB.
Introduction
Fusarium Head Blight (FHB) is a major disease of small-grain cereals, including wheat (Dweba et al., 2017; Figueroa et al., 2017; Duba et al., 2018). FHB is due to a complex association of different ascomycete fungal species belonging to either the Fusarium or the Microdochium genera (Siou et al., 2015) but is primarily due to Fusarium graminearum (teleomorph Gibberella zeae) (Goswami and Kistler, 2004). FHB damages consist of yield losses and in contamination of grains by mycotoxins which are harmful for humans and animals (Yazar and Omurtag, 2008; McCormick et al., 2011). F. graminearum has indeed the ability to produce secondary metabolites mainly belonging to type B trichothecenes, including deoxynivalenol (DON), representing potent inhibitors of eukaryotic translation (Rocha et al., 2005).
Cereals protection toward FHB has for a long time relied on chemicals mainly belonging to the demethylation inhibitors (DMI) family, however none confers full protection against the disease (Yuen and Schoneweis, 2007; Dweba et al., 2017; Chen et al., 2019). Alternative strategies such as biocontrol (Comby et al., 2017; Legrand et al., 2017) or innovative strategies using interfering RNAs (Machado et al., 2017; He et al., 2019) are emerging but they are not fully operational yet. Cultivar resistance remains therefore the most efficient protection strategy. Resistance to FHB is polygenic and more than 300 QTLs involved in partial resistance to the disease have been identified in the wheat genome (recently reviewed in Venske et al., 2019). Numerous large-scale studies have been performed to decipher the biological functions associated with resistance to FHB. These were designed to identify either differentially expressed genes (DEGs; for a review, see Kazan and Gardiner, 2017) or differentially produced metabolites (Kumaraswamy et al., 2011; Gunnaiah et al., 2012; Gauthier et al., 2015) related to quantitative resistance. Although these results could not be properly compared due to diverse host genetic backgrounds, they nevertheless allowed the identification of resistance-related families of secondary metabolites: phenylpropanoids reinforcing cell walls or scavenging reactive oxygen species, lignins, and lignans involved in cell wall thickness, polyamines strengthening physical barriers through their ability to bind cell wall components, terpenoids often having antimicrobial activities, and fatty acids which oxidation products can lead among others to jasmonate (JA) precursors (Bollina et al., 2010, 2011; Kumaraswamy et al., 2011; Kushalappa and Gunnaiah, 2013; Gunnaiah and Kushalappa, 2014; Kage et al., 2017; Karre et al., 2017).
Jasmonates are well-known phytohormones involved in plant responses to biotic stress, and are especially associated with defense against necrotrophs and herbivorous pests (Yang et al., 2013; Wasternack and Song, 2017). F. graminearum, the causal agent of FHB has been described as a hemibiotroph through deep cytological studies (Brown et al., 2010). JA are therefore not likely the only phytohormones involved in cereals defense against FHB. Recent works have explored the role and the possible involvement of different phytohormones in FHB-induced resistance. Salicylic acid (SA) was shown in several studies to promote basal resistance to FHB during early infection stages (Makandar et al., 2010, 2012; Ding et al., 2011). However, these studies mostly relied on the analysis of DEGs during infection of cereal cultivars exhibiting contrasting response to the disease. Nevertheless, in a very recent work, Qi et al. (2019) have demonstrated by using a transgenic F. graminearum strain able to metabolize SA, that endogenous SA levels influence the resistance to FHB. Numerous studies have concluded on the role of ethylene (ET) in the promotion of FHB resistance at later infection stages (Makandar et al., 2010; Ding et al., 2011; Gottwald et al., 2012; Sun et al., 2016; Wang et al., 2018b). In contrast, other researches have shown that ET promotes disease (Chen et al., 2009) or has no impact on disease development (Sun et al., 2016). Other phytohormones less frequently associated with plant responses to biotic stress may also play a role in infection. Abscisic acid (ABA) was shown to increase susceptibility whereas gibberellic acids promote FHB resistance but these effects appeared mostly due to the modulation of F. graminearum gene expression of Buhrow et al. (2016). Brassinosteroids (BR) were also shown to improve FHB resistance either following exogenous application of epibrassinolide (Ali et al., 2013) or by using Brachypodium distachyon or barley mutants insensitive to BR (Chen et al., 2014; Goddard et al., 2014). A recent integrated transcriptome and hormone profiling study has investigated the involvement and modulation of five major phytohormones, SA, JA, ET, ABA, and auxin, during FHB infection. Wheat cultivars exhibiting contrasting responses to FHB were used including the well-known highly resistant Sumai 3 accession (Wang et al., 2018a). This work has indicated that the Sumai3 resistance is likely due to elevated basal SA levels coupled with stronger and faster production of ET. In contrast, susceptible varieties also showed increased ET levels but at late stages of infection during which ET may rather promote disease spread (Wang et al., 2018a). This study, as several previous ones in other plant species, therefore confirmed the sequential roles of the phytohormones at different infection stages and also points out the complexity of possible crosstalks in defense against biotic stress (Kazan, 2013; Yang et al., 2013; Pozo et al., 2015; Akamatsu et al., 2016).
Strigolactones (SLs) constitute a new class of phytohormones. SLs are carotenoid-derived compounds for which both the biosynthetic pathway and the perception have been extensively studied in the last decade (de Saint Germain et al., 2013; Ruyter-Spira et al., 2013; Lopez-Obando et al., 2015; Marzec, 2016). The SLs biosynthesis can be divided into two parts: the core and the diversification biosynthetic pathways. The core pathway is highly conserved among plant species and starts from all-trans-β-carotene. It involves activities of three successive enzymes—namely an all-trans-/9-cis-β-carotene isomerase and two carotenoid-cleavage dioxygenases, to end up with the formation of carlactone (CL; Ruyter-Spira et al., 2013). The diversification pathway is named after the high diversity of SLs it can produce. It is less conserved and involves cytochrome P450 monooxygenases (CYP) belonging to the CYP711A subfamily (Nelson, 2009; Wang and Bouwmeester, 2018). The first functionally characterized member of the CYP711A subfamily was the Arabidopsis thaliana MAX1 enzyme (Booker et al., 2005). Later studies have led to the identification of MAX1 homologs in various plant species such as petunia (Drummond et al., 2012), poplar (Czarnecki et al., 2014), rice (Cardoso et al., 2014; Zhang et al., 2014), and tomato (Zhang et al., 2018). Interestingly, whereas most dicotyledonous plant species hold a single copy of MAX1, grass genomes usually contain several copies suggesting more specialized functions of the corresponding enzymes (Challis et al., 2013).
First identified as stimulating the seed germination of root parasitic plants (Cook et al., 1966), SLs were later shown to promote the branching of arbuscular mycorrhizal fungi (AMF; Akiyama et al., 2005). Concomitantly, genetic studies highlighted the contribution of SLs in the inhibition of shoot branching (Booker et al., 2005; Gomez-Roldan et al., 2008; Umehara et al., 2008) but also as regulators of a number of other plant developmental processes such as primary root growth, secondary growth, and leaf senescence (reviewed in Al-Babili and Bouwmeester, 2015). In the last few years, the role of SLs in plant–microbe interactions beyond mycorrhization has been investigated either through in vitro tests to evaluate potential direct effects on microorganisms or by using biosynthetic or signaling plant mutants (reviewed in López-Ráez et al., 2017). In vitro studies, mostly using racemic mixtures of the synthetic analog GR24 (Johnson et al., 1981), were conducted on diverse plant–pathogenic fungal species covering both the diversity of trophic habits with host plant cells—biotrophy, hemibiotrophy, and necrotrophy—and the targeted plant part (root or shoot). If some work showed the ability of SLs to stimulate hyphal branching of Colletotrichum acuctatum, Sclerotinia sclerotiorum, Alternaria alternata, and Fusarium solani (Dor et al., 2011; Decker et al., 2017), others observed no impact of these molecules in Rhizoctonia solani, Verticillium dahlia, Cladosporium sp. (Steinkellner et al., 2007), or Pythium irregular (Blake et al., 2016). Furthermore, contradictory results were obtained for a few fungal species such as Botrytis cinerea (Steinkellner et al., 2007; Dor et al., 2011; Torres-vera et al., 2014; Belmondo et al., 2017) and Fusarium oxysporum (Steinkellner et al., 2007; Dor et al., 2011; Foo et al., 2016), leading to an unclear overall picture. In planta assays using comparative studies between wild-type (WT) and SL biosynthetic or signaling plant mutants, led to less contrasted results concluding, in numerous cases, on a role of SLs in disease resistance (Torres-vera et al., 2014; Piisilä et al., 2015; Stes et al., 2015; Decker et al., 2017; Xu et al., 2019). Nevertheless, as for in vitro assays, some work could not show any impact of SLs (Blake et al., 2016; Foo et al., 2016) and very recent work on root-knot nematodes both belonging to the Meloidogyne genus led to contradictory results in tomato (Meloidogyne incognita; Xu et al., 2019) and rice (Meloidogine graminicola; Lahari et al., 2019) despite the use of similar experimental approaches. In conclusion, if SL are mostly involved in plant resistance to pathogenic microorganisms, their clear role in plant–pathogens interactions is not fully depicted yet.
In a previous transcriptomic analysis, we have identified the B. distachyon Bradi1g75310 gene as specifically induced following infection by a DON-producing F. graminearum strain (FgDON+) but not by a mutant strain unable to produce the mycotoxin (FgDON–) (Pasquet et al., 2014). Interestingly, this gene encodes a CYP similar to A. thaliana MAX1 previously demonstrated to be necessary to metabolize CL into carlactonoate (Abe et al., 2014). Our results strongly suggest that the Bradi1g75310 gene encoding BdCYP711A29 is involved in orobanchol biosynthesis and that its overexpression increases FHB susceptibility in B. distachyon.
Materials and Methods
Plant Material and Growth Conditions
The B. distachyon WT ecotype Bd21-3 (Vogel et al., 2009) and all B. distachyon lines generated or selected in this study (Table 1) were cultivated as described in Pasquet et al. (2016). For expression studies, roots and leaves were collected from three week-old plants whereas spikes were collected from 5 week-old plants (mid-anthesis stage plus 96 h that is the same stage as the one chosen for expression analysis of defense genes). For hydroponic cultures, the palea and lemma of each seed were removed and seeds were surface sterilized by incubation in a 0.6% sodium hypochlorite solution for 5 min with gentle shaking followed by three rinses in sterile distilled water. Sterilized seeds were subsequently incubated for 5 days at 4°C in sterile distilled water then pre-germinated on filter paper soaked with sterile water for three days at 24°C, both steps in the dark. Seedlings were transferred on hydroponic boxes (Araponics system, http://www.araponics.com/) in sterile self-made liquid Murashige and Skoog medium [2.1 mM NH4NO3, 1.9 mM KNO3, 0.3 mM CaCl2.2H2O, 0.15 mM MgSO4.7H2O, 10 μM H3BO4, 10 μM MnSO4.H2O, 0.5 μM KI, 3 μM ZnSO4.7H2O, 0.1 μM Na2MoO4.2H2O, 0.01 μM CoCl2.6H2O, 0.01 μM CuSO4.H2O, 10 μM FeCl2, 1 mM KH2PO4, (Murashige and Skoog, 1962)] for 4 weeks, with the medium changed every 3 days. One week before recovery of exudates for SL detection and quantification assays, plants were transferred to sterile self-made phosphate deficient (-KH2PO4) MS.
Table 1. List and characteristics of the B. distachyon lines used in this study.
Binary Vector Construction and Brachypodium distachyon Transformation
The BdCYP711A29 complementary DNA (cDNA) was amplified from spikelet cDNAs using primers BdCYP711A29_BI5’ATG and BdCYP711A29_EV3’TAA (Supplementary Table 1), adding a BamHI restriction site at the 5’-end and an EcoRV restriction site at the 3’-end, respectively. The PCR product was digested using the BamHI and an EcoRV restriction enzymes, purified using a NucleoSpin® Gel and PCR Clean-up kit (Macherey-Nagel EURL, Hoerdt, France) using the manufacturer’s instructions then ligated into the pENTR1A plasmid linearized by the same restriction enzymes. The resulting pEntry-CYP711A29 plasmid was used to transfer the BdCYP711A29 cDNA fragment into the pIPKb002 binary vector (Himmelbach et al., 2007) by in vitro recombination using the Gateway® LR Clonase® II Enzyme mix according the manufacturer’s recommendations (InvitrogenTM, Life Technologies SAS, Saint-Aubin, France). The resulting construct, named pIPKb002::BdCYP711A29, carried both the BdCYP711A29 full-length cDNA under the control of the Zea mays ubiquitin promoter (ZmUbi) and a hygromycin resistance expression cassette allowing selection of the primary transformants.
The pIPKb002::BdCYP711A29 binary vector was then electroporated into Agrobacterium tumefaciens (AGL1 strain). The Bd21-3 WT line was genetically transformed using a method adapted from that described by Vogel and Hill (2008) and Alves et al. (2009). Selection of the transformants and segregation analysis were conducted as described in Pasquet et al. (2016).
Screening of TILLING Mutants Collection
Two thousand five hundred mutant families the B. distachyon TILLING mutant collection1 available at the Institute of Plant Sciences Paris Saclay (Orsay, France) were screened for point mutations via Illumina® sequencing of a 401-bp fragment located at the 3′ end of the BdCYP711A29 gene encompassing a region encoding important domain of the C-terminal part of the protein: the P(E)R(F) signature, the EER triad and the heme binding domain (Supplementary Figures 1, 2). Primers used for the generation of the BdCYP711A29 PCR product were CYP711A29-F1 and CYP711A29-R (Supplementary Table 1).
Fusarium graminearum Strains, Maintenance and Spore Production
Fusarium graminearum strain PH-1 (FgDON+) and the Δtri5 mutant strain MU102 (FgDON–; Cuzick et al., 2008) unable to produce DON were cultured as described in Pasquet et al. (2016).
In vitro Orobanchol or Exudates Assay on F. graminearum Macroconidia
An average of 1,000 F. graminearum macroconidia were plated on water agar slides containing either 0.01% DMSO or various concentrations of (rac)-orobanchol (OlChemIm, Olomouk, Czech Republic) diluted into 0.01% DMSO. Slides were further incubated at 26°C in a moist environment for 12 h. Germ tubes were then counted on a minimum of 500 macroconidia per condition per replicate through observation on an Axio Zoom V.16 under bright field light (Zeiss, Marly-le-Roi, France). To determine the impact of exudates of different B. distachyon lines on F. graminearum macroconidial germination, macroconidia at a final concentration of 105 macroconidia/mL were directly incubated in tubes containing 2 mL of each recovered exudate. After incubation for 12 h at room temperature, the germination percentage was determined on a minimum number of 1,000 macroconidia. For each experiment, three biological replicates were performed.
Spike Treatments
For DON application, a single floret per spike at mid-anthesis was inoculated by a mixture containing 2 μg of the myxotoxin (Sigma-Aldrich, Saint-Quentin Fallavier, France) in 5 μL of a mixture of acetonitrile (1.65 μL) and 0.01% Tween 20 (1.35 μL). The control condition corresponded to spikes inoculated with the same mixture without the mycotoxin. For fungal infection, whole spikes at mid-anthesis were sprayed with the fungal spore suspension (1 × 10⁵ conidia/mL), until dripping. Inoculated plants were covered with clear plastic bags for which the internal face had been sprayed with distilled water beforehand. The first 24 h inoculated heads were kept in the dark, then incubated with a photoperiod of 16 h light and 8 h darkness at 20°C with the same light intensities as those used for plant development (Pasquet et al., 2016). Applications of 0.01% Tween 20 was performed as control condition for each inoculation experiment. Symptoms were observed at 7 and 14 days after spraying of the conidial suspension. A spikelet was considered as symptomatic if at least half of its florets were symptomatic.
RNA Extraction
Leaves from three 2-week old plants plant or five spikelets from independent plants were ground in liquid nitrogen and total RNA was extracted from 0.1 g of the resulting powder using TRIzol® (Invitrogen, Life Technologies SAS, Saint-Aubin, France) followed by an RNase-free DNase I step (Ambion®, Applied Biosystems, Courtaboeuf, France) according to manufacturers’ instructions. Total RNA was further purified using the NucleoSpin RNA Clean-up XS kit (Macherey-Nagel, Hoerdt, France).
Fungal DNA Quantification by qPCR
For quantification of F. graminearum DNA, 10 spikes spray-inoculated with either of the two strains used in this study were pooled per time-point. Genomic DNA was extracted as described in Pasquet et al. (2016). Quantification of fungal DNA was realized by qPCR (see below) on 10 ng of total DNA using primers specific for the 18S ribosomal subunit-encoding genomic region (Mudge et al. (2006; Supplementary Table 2).
Real-Time PCR
Complementary DNA synthesis was performed on 1 μg of total RNA using the ImProm-IITM reverse transcription system (Promega France, Melun-les-Charbonnières, France) according to the manufacturer’s instructions. The resulting product was diluted 10 times in nuclease-free water. Primers were designed to amplify plant gene transcripts (Supplementary Table 2), including reference genes Bradi4g00660 (UBC18) and Bradi4g41850 (ACT3-like under accession number XM_003578821 in the nucleotide NCBI database) as previously determined by Hong et al. (2008); (Supplementary Table 2). qPCR reactions were performed on 2 μL of the diluted cDNA product using 8 pmoles of each specific primer and 10 μL of SYBRGreen Master Mix in a final volume of 20 μL. Reactions were performed in a Light Cycler LC480 Real-time PCR system (Roche Diagnostics, Meylan, France). All qPCR reactions were carried out on biological triplicates, each in technical duplicate. The final threshold cycle (Ct) values were the mean of three values (biological triplicates), each corresponding to the mean of technical duplicates. The comparative ΔΔCt method was used to evaluate the relative quantities of each amplified product in the samples. The Ct was automatically determined for each reaction by the Light Cycler LC480 Real-time PCR system set with default parameters. The specificity of the qPCR reactions was determined by melt curve analysis of the amplified products using the standard method installed in the system.
Strigolactones Detection and Quantification
Detection and quantification of SLs exuded from the roots has been performed according to a method adapted from Ravazzolo et al. (2019). B. distachyon lines were grown hydroponically and exudation was performed in fresh MS-KH2PO4 medium during 24 h. When necessary, exudates were immediately frozen in liquid nitrogen and conserved at −80°C before analysis. SLs were extracted from liquid medium complemented with 10 ng of (rac)-GR24 as internal standard, by adding the same volume of ethyl acetate followed by a manual and vigorous mixing during 10 min. Organic phase was decanted and dried using a rotary evaporator (Rotavapor, Buchi). The solid phase was resuspended in acetonitrile, and conserved at −20°C before analysis according to Boutet-Mercey et al. (2017). Separation was performed on a BEHC18 column (2.1 × 100 mm, particle size 1.7 μm, Waters), using an ACQUITY UPLC I-class system (Waters), and detection on Waters Xevo TQ-S equipped with an ESI source and operated in positive ion mode. Identification and quantification were performed by the very sensitive MRM mode in LC-MS/MS (Supplementary Table 3), however, the signal in the sample was not sufficient to obtain a fullscan MS/MS spectrum. We first optimized all the conditions of MRM acquisition on the orobanchol standard in full scan methods (Supplementary Figure 3A), and chose the two main MRM transitions, then we analyzed the sample with this MRM methods on both transitions to guarantee the identification (Supplementary Figure 3B).
Phylogenetic Analyses
Amino acid sequences were recovered from The Cytochrome P450 Homepage (Nelson, 2009) or through reciprocal BLAST analysis for the Hordeum vulgare protein sequences. Phylogenetic analyses were inferred from a multiple sequence alignment generated by CLUSTAL W and by using the Maximum Likelihood method based on the JTT matrix-based model, conducted on MEGAX software (Kumar et al., 2018).
Results
The Bradi1g75310 Gene Belongs to an Oligogenic Family Homologous to the Arabidopsis MAX1 Gene and Is Specifically Induced Under F. graminearum Infection in a DON-Dependent Manner
A previous study has identified Bradi1g75310 as a gene induced by a DON-producing F. graminearum [FgDON+, 6.93 fold log2 compared to the mock condition 96 hours post inoculation (hpi)] while it does not respond to a mutant strain unable to produce the mycotoxin [FgDON–, 0.77 fold log2 compared to the mock condition (96 hpi); Pasquet et al., 2014]. In order to validate these transcriptomic data, reverse transcription-quantitative PCR (RT-qPCR) was conducted on the same RNA samples as those used for microarrays. Results showed good correlation between microarrays and RT-qPCR data as the Bradi1g75310 gene was strongly induced by the FgDON+ strain (15.4 fold log2 at 96 hpi) and far less (6.2 fold log2 at 96 hpi) by the FgDON– strain (Figure 1A). To determine whether expression could also be induced by the mycotoxin itself, similar experiments were conducted on spikes point-inoculated with DON along kinetics from 0 to 48 hours post application (hpa). Expression of the Bradi1g75310 gene was strongly and rapidly induced by DON reaching a maximum of 10.74 induction fold log2 24 hpa (Figure 1B). Overall, these results confirm that the Bradi1g75310 gene expression is strongly induced by DON either produced by F. graminearum during infection or as a commercial molecule. The rapid and strong induction of expression following application of the mycotoxin alone reinforces the idea of a direct inductive action of the molecule.
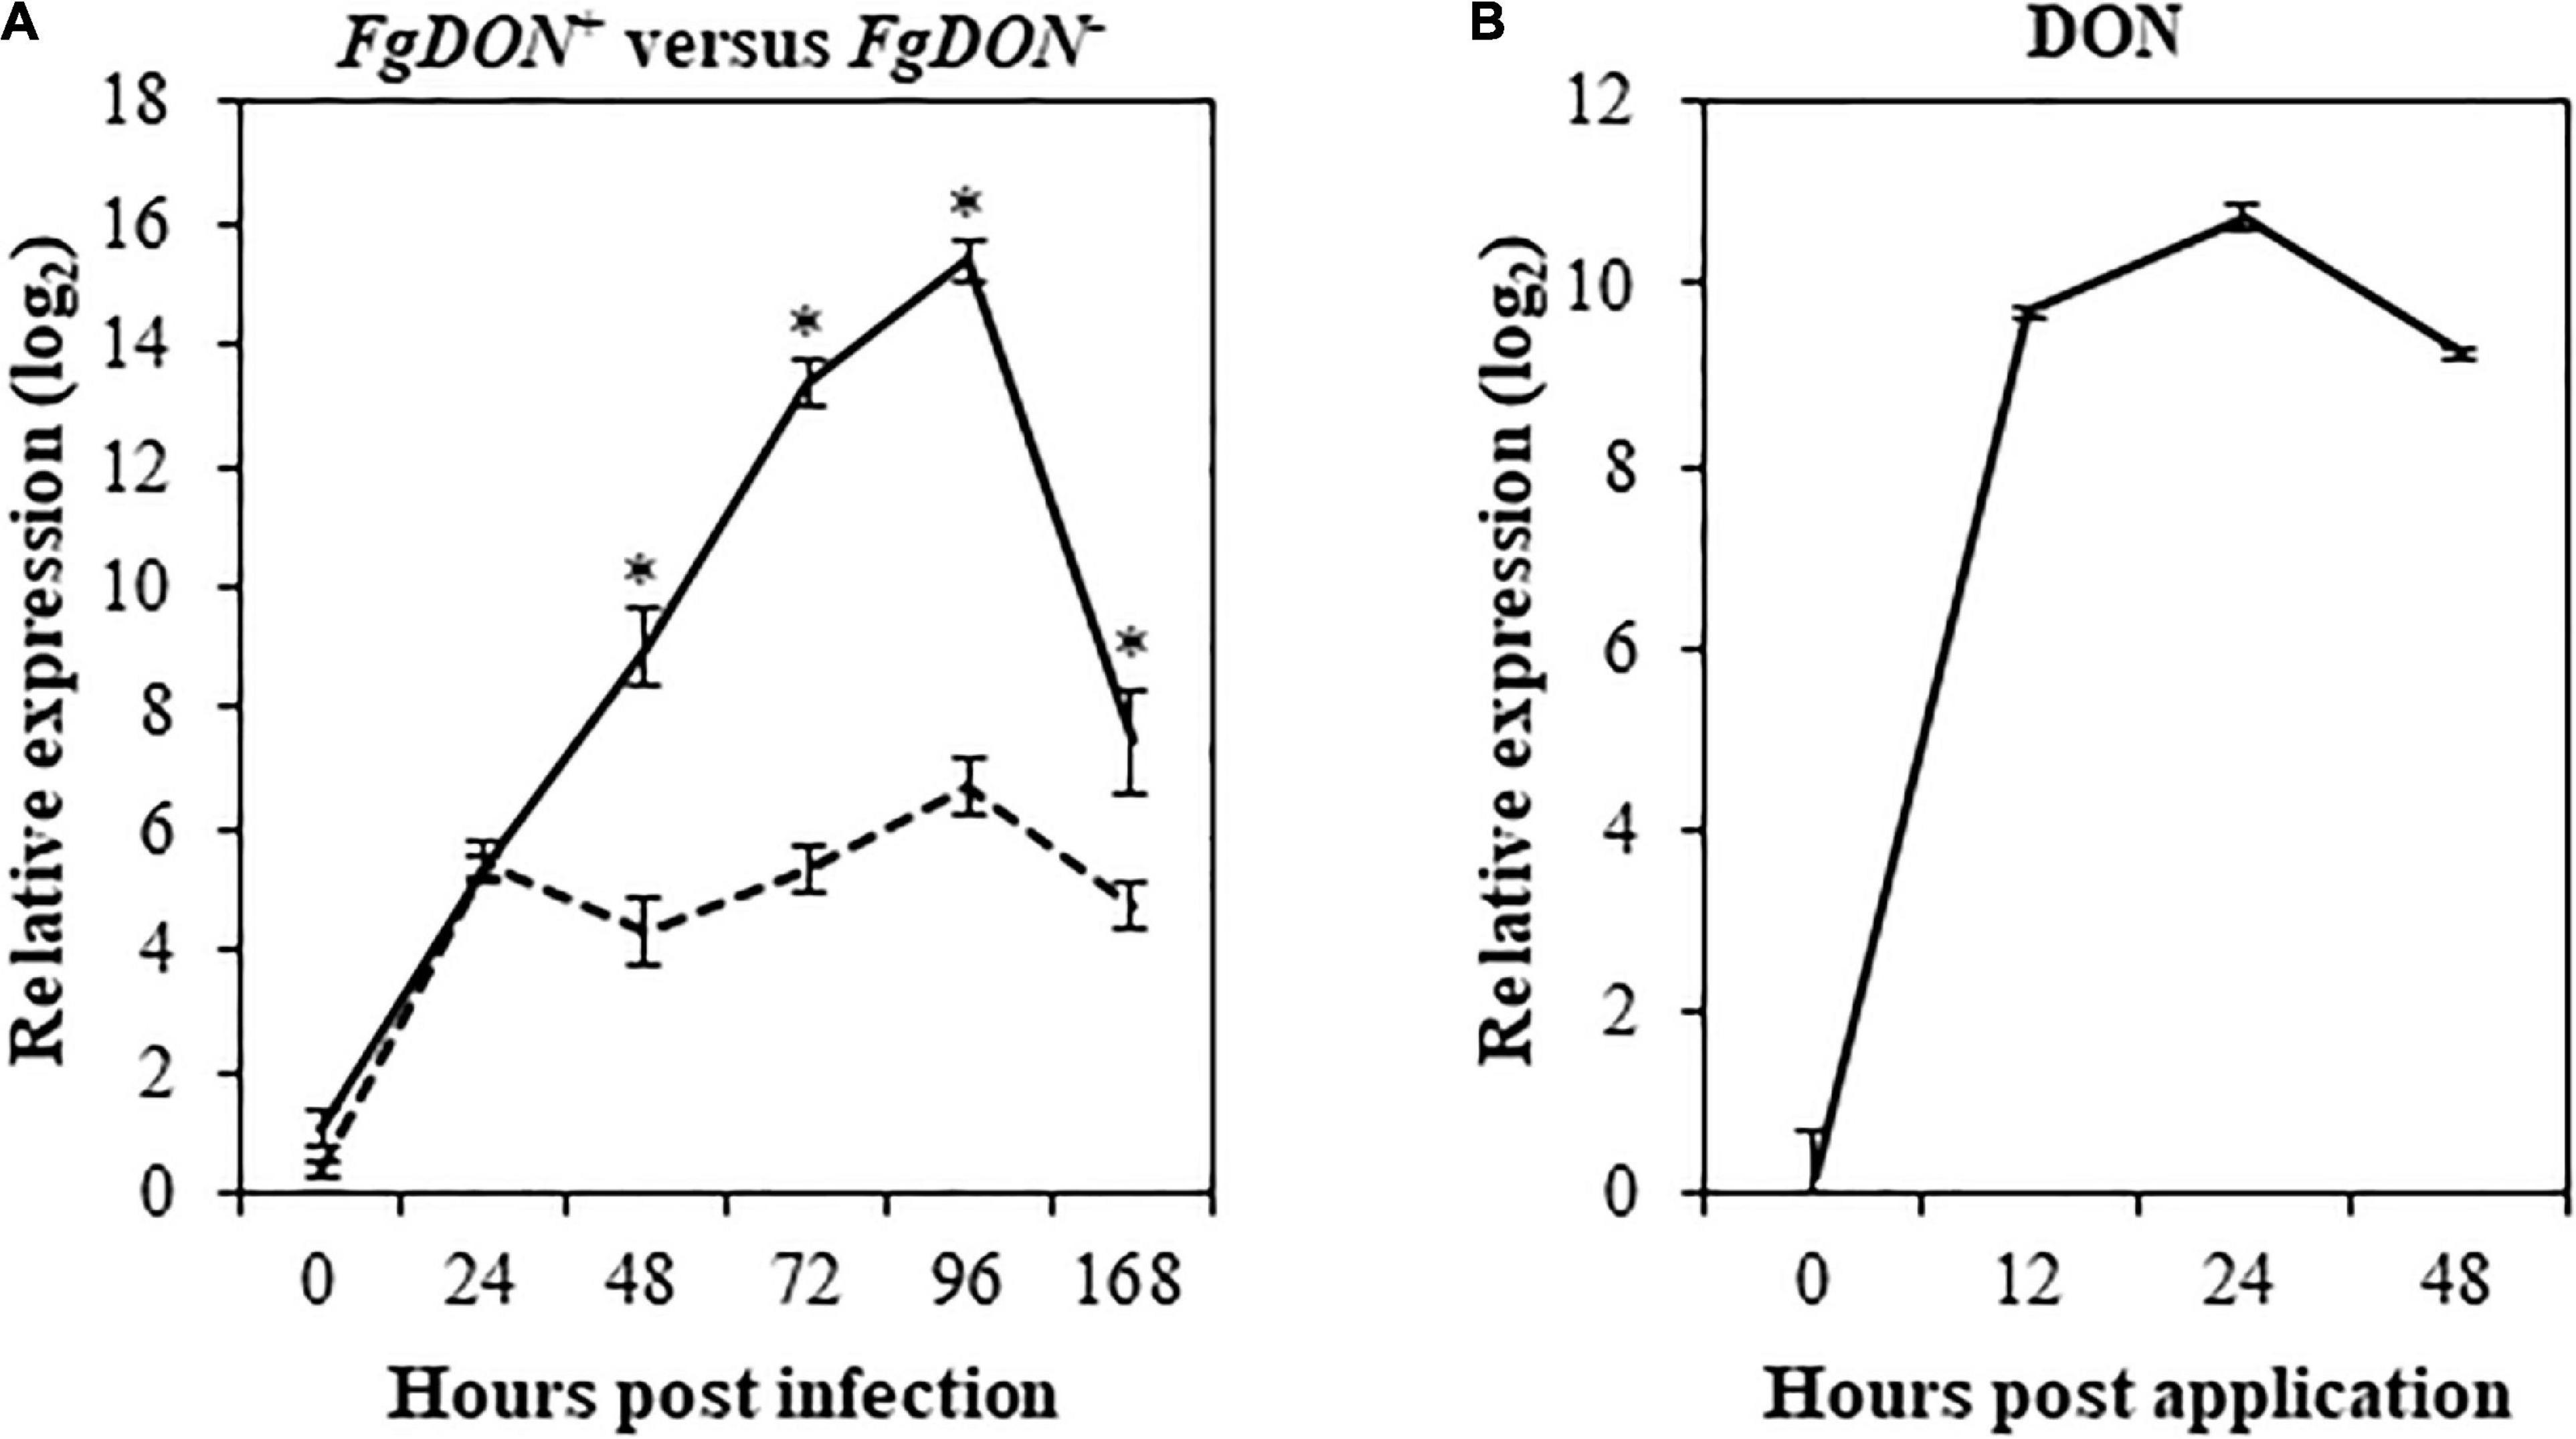
Figure 1. The Bradi1g75310 (BdCYP711A29) gene is transcriptionally induced during FHB and following DON treatment. Relative quantification of Bradi1g75310 transcripts in the Bd21-3 (WT) ecotype of B. distachyon following F. graminearum infections or following DON treatment. (A) Bradi1g75310 expression level (fold-change. log2) following point infection with the FgDON+ (solid line) or with the FgDON– (dashed line) strain of F. graminearum compared to mock treatment. (B) Bradi1g75310 expression level (fold-change. log2) following DON treatment compared to mock treatment. The relative quantity of the Bradi1g75310 transcripts compared to mock condition was calculated using the comparative cycle threshold (Ct) method (2–ΔΔCt). The B. distachyon UBC18 and ACT7 genes (Bradi4g00660 and Bradi4g41850) were used as endogenous controls to normalize the data for differences in input RNA between the different samples. Mean of three independent biological replicates ± standard deviation. Asterisks indicate significant differences between conditions (Student’s t-test p value < 0.05).
The Bradi1g75310 gene is 2178 base pairs (bp) long, including 48 and 18 bp of 5′- and 3′-untranslated regions (UTR), respectively. The nucleotide sequence is constituted of 5 exons and 4 introns and the 1,572-bp coding sequence encodes a putative 523 amino acid CYP (Supplementary Figure 1), which has been classified as belonging to the CYP711A subfamily and named BdCYP711A29 (Nelson, 2009).2 This notation will be therefore used throughout this work to refer both to the protein (BdCYP711A29) and the gene (BdCYP711A29). According to this database, BdCYP711A29 belongs to an oligomeric subfamily comprising 4 other members: BdCYP711A5 (Bradi3g08360), BdCYP711A6 (Bradi1g37730), BdCYP711A30 (Bradi4g08970), and BdCYP711A31 (Bradi4g09040). Sequences from A. thaliana and Oryza sativa CYP711A proteins (1 and 5 members, respectively) were used together with B. distachyon CYP711A protein sequences to perform multiple protein sequence alignment of the full-length proteins and phylogenetic analysis. The CYP711A1 sequence from the non-vascular plant species Selaginella moellendorffii has been used to root the tree (Figure 2 and Supplementary Table 4). BdCYP711A5, HvCYP711A5 and O. sativa OsCYP711A5, as well as BdCYP711A6, HvCYP711A6, and OsCYP711A6, constitute two specific clades. The other B. distachyon, H. vulgare, and O. sativa CYP711A proteins [BdCYP711A29, BdCYP711A30, BdCYP711A31, HvCYP711A29 (also named HvMAX1), HvCYP711A30, OsCYP711A2, OsCYP711A3, and OsCYP711A4] strongly grouped with A. thaliana MAX1 (At2g26510), and were distributed in two subclades. One subclade contains all rice proteins and the barley and B. distachyon CYP711A30 proteins and exhibits a strong species structuration. The BdCYP711A29 protein belongs to the other subclade together with the barley HvCYP711A29 and the BdCYP711A31 protein. The BdCYP711A29 protein exhibits 55.8% with the A. thaliana MAX1 protein involved in SL biosynthesis, converting CL into carlactonoic acid (CLA; Abe et al., 2014). BdCYP711A29 also shares between 46 and 58% identity with O. sativa CYP711A proteins (A2, A3, A4), all but one recently demonstrated to be involved at different steps of SL biosynthesis downstream of CL (Cardoso et al., 2014; Zhang et al., 2014).
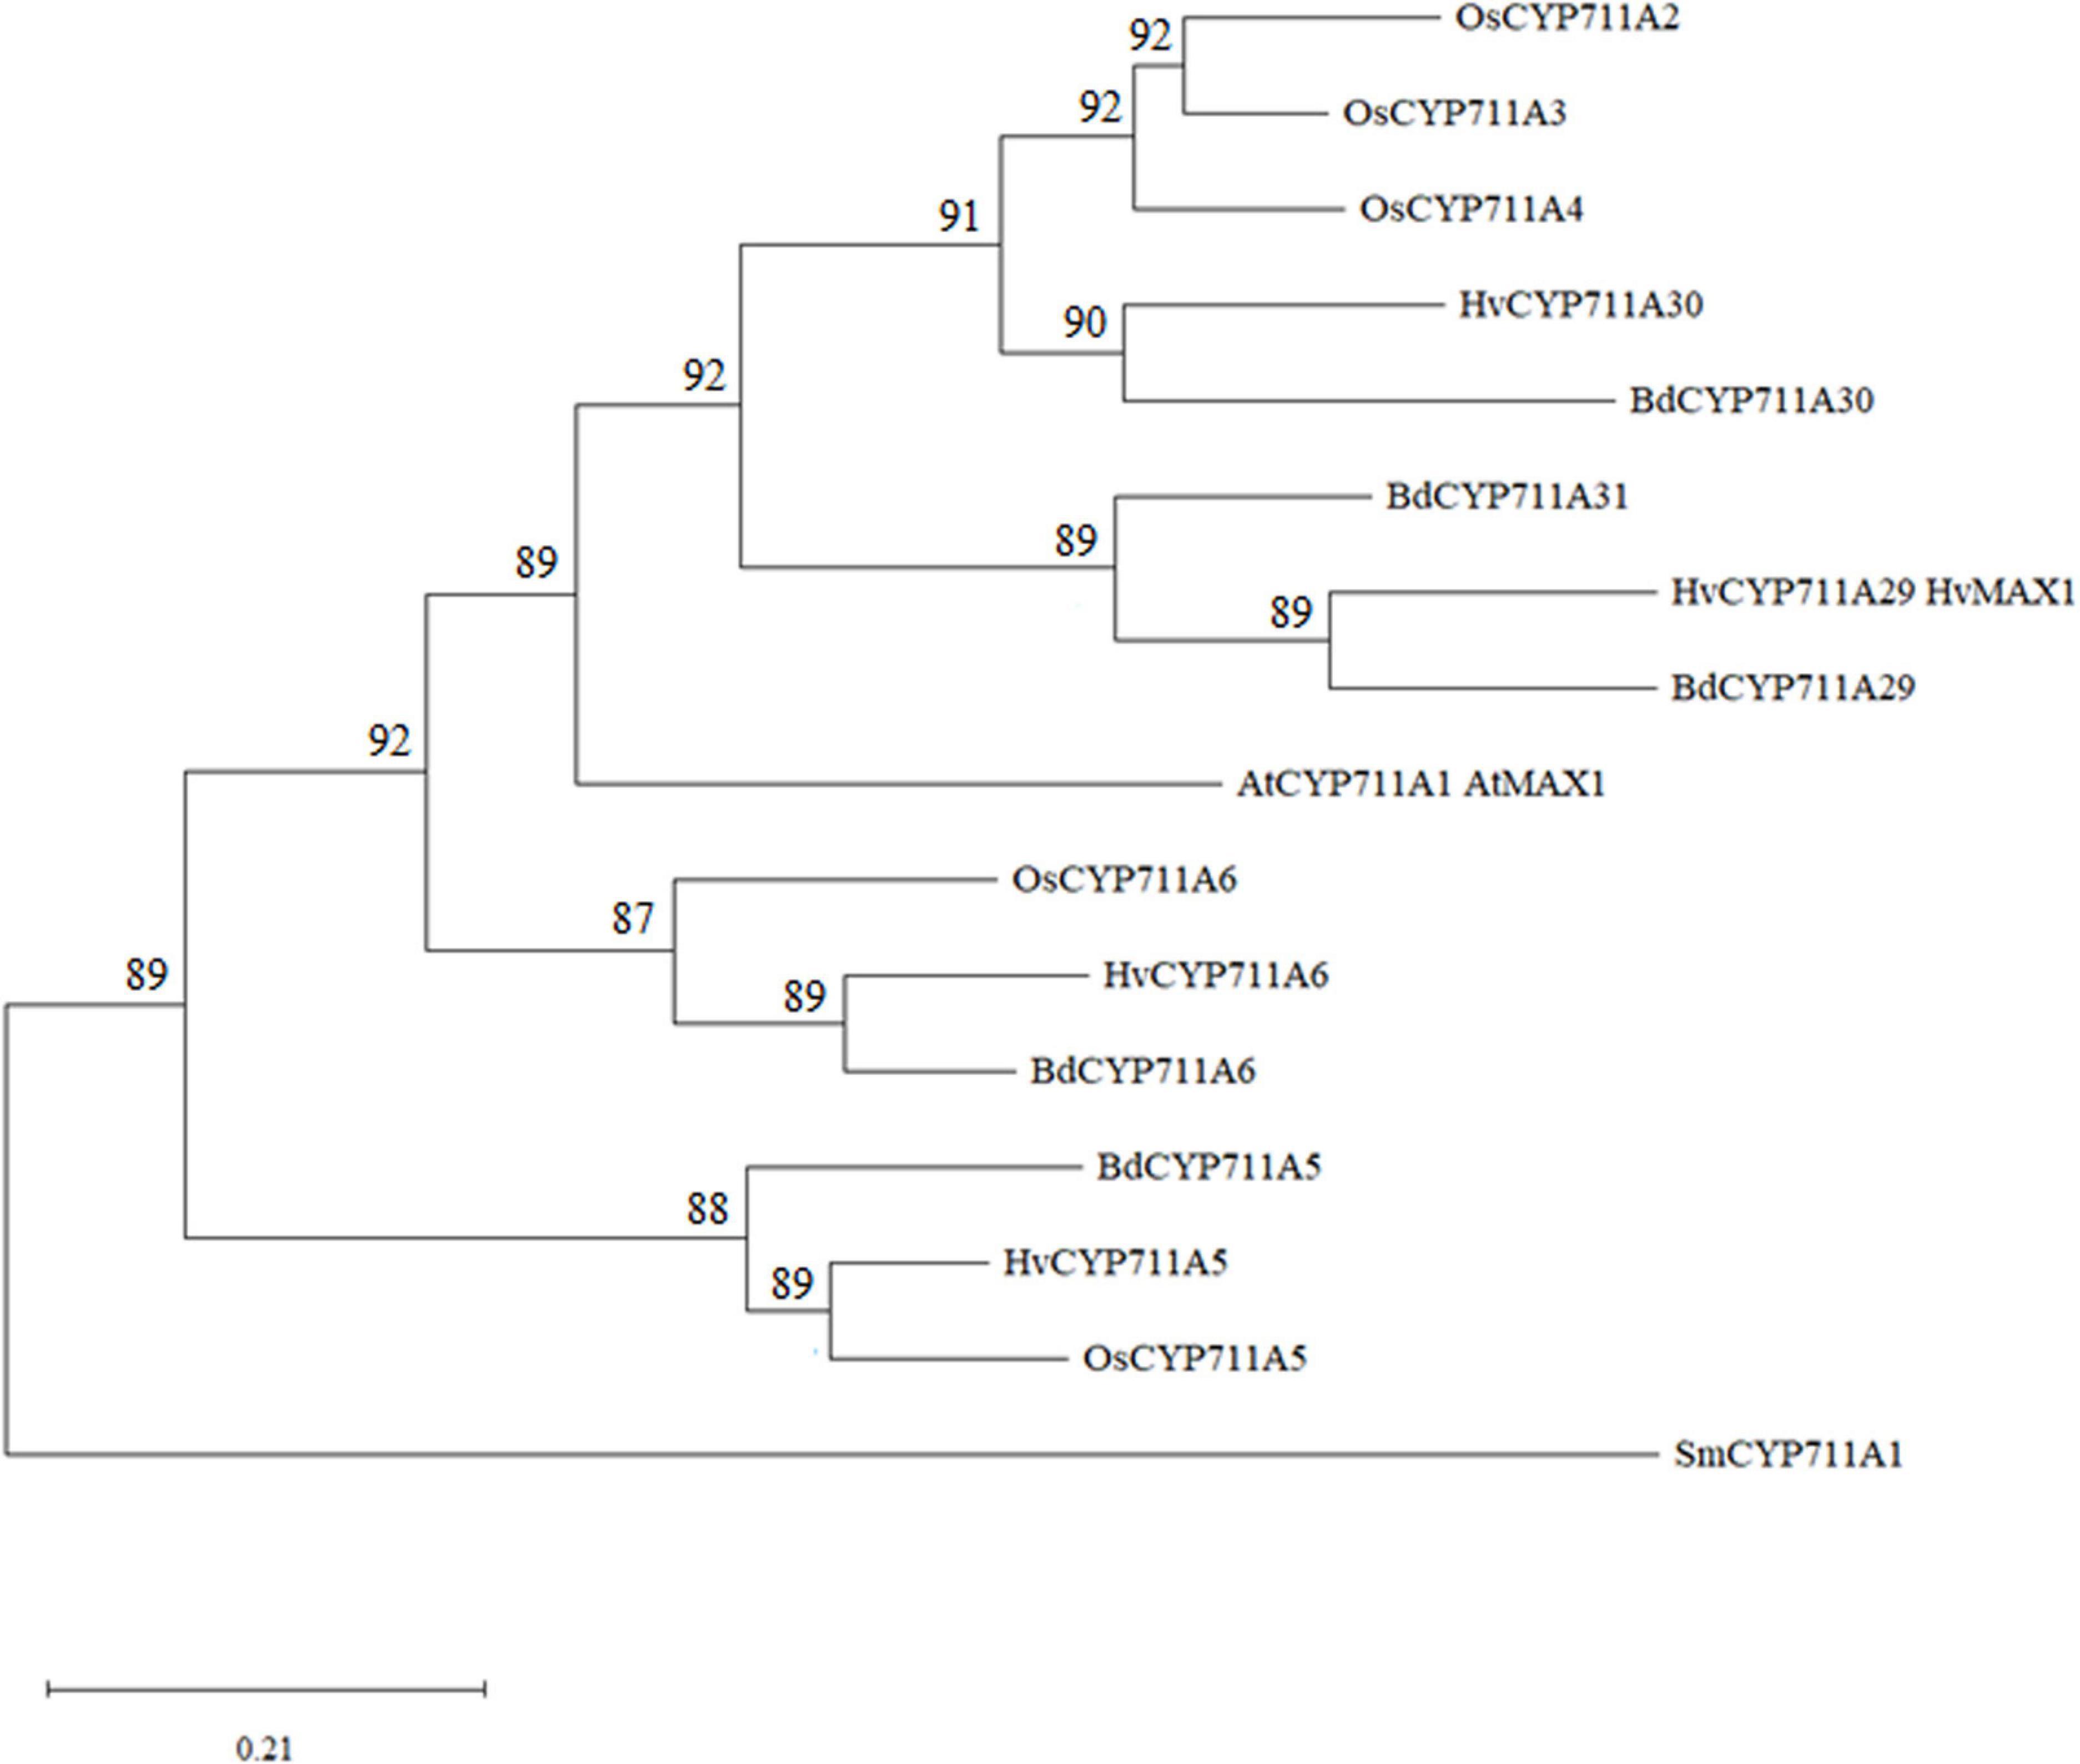
Figure 2. Molecular phylogenetic analysis of A. thaliana, B. distachyon, H. vulgare, O. sativa, and S. moellendorffii CYP711As. The protein evolutionary history was inferred by using the Maximum Likelihood method based on the JTT matrix-based model (Jones et al., 1992). The bootstrap consensus tree inferred from 500 replicates (Felsenstein, 1985) is taken to represent the evolutionary history of the taxa analyzed (Felsenstein, 1985). Branches corresponding to partitions reproduced in less than 50% bootstrap replicates are collapsed. The percentage of replicate trees in which the associated taxa clustered together in the bootstrap test (500 replicates) are shown next to the branches (Felsenstein, 1985). Initial tree(s) for the heuristic search were obtained automatically by applying Neighbor-Join and BioNJ algorithms to a matrix of pairwise distances estimated using the JTT model, and then selecting the topology with superior log likelihood value. This analysis involved 16 amino acid sequences. There were a total of 567 positions in the final dataset. Evolutionary analyses were conducted in MEGA X (Kumar et al., 2018). The tree has been rooted with Selaginella moellendorffii CYP711A1 (SmCYP711A1). At: A. thaliana; Bd: B. distachyon; Hv: Hordeum vulgare; Os: O. sativa; Sm: S. moellendorffii. Protein sequences used in this analysis are available under the following accession numbers: AtCYP711A1, OAP07831.1; BdCYP711A5, XP_003571126.1; BdCYP711A6: XP_003560652.1; BdCYP711A29, XP_003562092.2; BdCYP711A30: XP_003575594.2; BdCYP711A31, XP_010237353.2; HvCYP711A5, BAJ97619.1; HvCYP711A6, KAE87888859.1; HVCYP711A29, BAJ98237.1; HvCYP711A30, KAE8810993.1; OsCYP711A2, XP_015633367.1; OsCYP711A3, XP_015644699.2; OsCYP711A4, XP_015642272.1; OsCYP711A5, XP_015626073.1; OsCYP711A6, XP_015644019.1; SmCYP711A1, XP_002972055.1.
In order to better characterize the B. distachyon CYP711A gene family, the relative expression of the five genes was examined by RT-qPCR in three week-old roots and leaves, and spikes of five week-old plants. Three different categories could be depicted based on the CYP711A gene expression pattern (Figure 3). The first one, with BdCYP711A5 gene as a single member, exhibits an overall low expression level with stronger expression in leaves and spikes (Figure 3A). BdCYP711A6 and BdCYP711A29 genes belong to the second category characterized similarly to the first one by a low expression level, and a significantly higher expression in roots and spikes (Figure 3B). The third category contains the BdCYP711A30 and BdCYP711A31 genes showing higher expression in roots only (Figure 3C). These results therefore indicate that the five BdCYP711A genes exhibit different spatial expression in the plant.
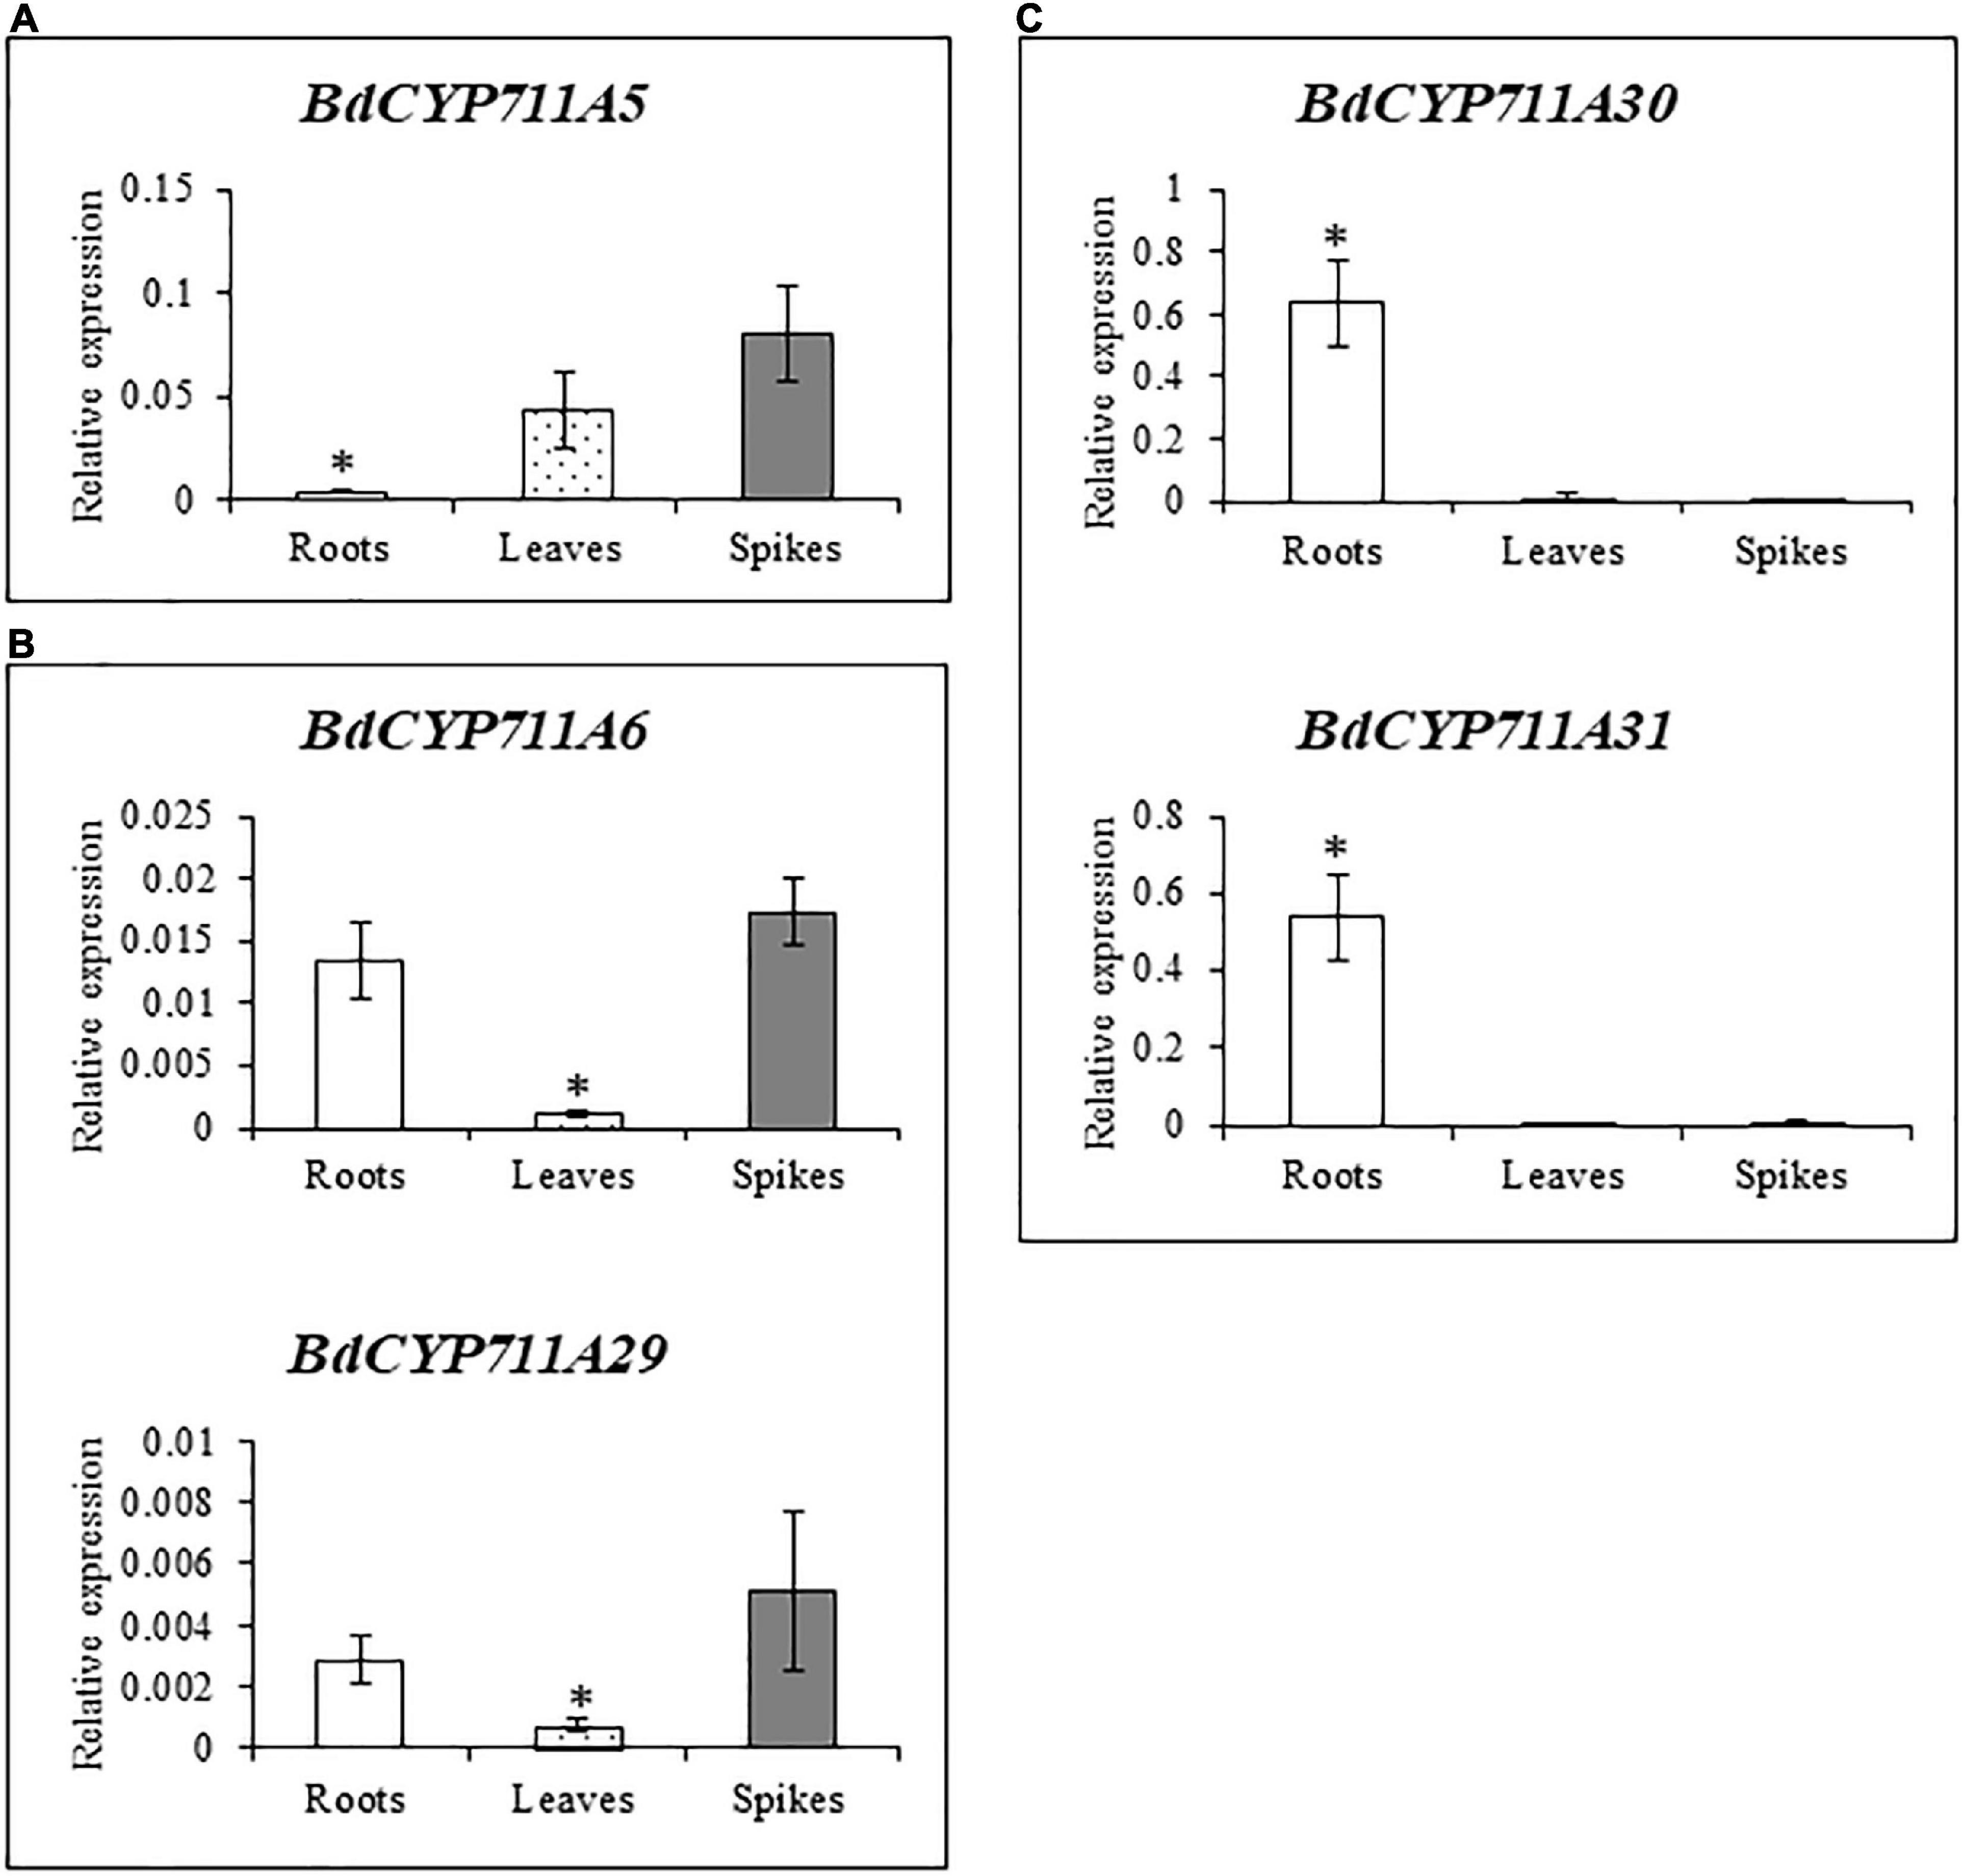
Figure 3. Expression pattern of the 5 BdCYP711A genes in roots, leaves, and spikes. (A), (B), and (C) correspond to different expression patterns, mentioned as categories in the main text. Relative quantification of transcripts of the BdCYP711A5 (Bradi3g08360), BdCYP711A6 (Bradi1g37730), BdCYP711A29 (Bradi1g75310), BdCYP711A30 (Bradi4g08970), and BdCYP711A31 (Bradi4g09040) genes in different organs of the Bd21-3 (WT) ecotype of B. distachyon: roots and leaves were collected from 3 week-old plants under hydroponic conditions in ½ MS liquid medium and spikes were collected at mid-anthesis on plants grown in pots under standard conditions. The relative quantity of transcripts was calculated using the comparative cycle threshold (Ct) method (2– ΔCt) using the B. distachyon UBC18 and ACT7 genes (Bradi4g00660 and Bradi4g41850) as endogenous controls to normalize the data for differences in input RNA between the different samples. Mean of three independent biological replicates ± standard deviation. For each gene, asterisks indicate significant differences between organs (*p value < 0.05, Student’s t-test).
As mentioned before, previous transcriptomic data indicated that BdCYP711A29 is the only member of this oligogenic family to be differentially expressed following F. graminearum infection in a DON-dependent manner. To validate these data, RT-qPCR experiments using primers specific of the BdCYP711A5, BdCYP711A6, BdCYP711A30, and BdCYP711A31 genes (Supplementary Table 2) were conducted on the same samples as for the BdCYP711A29 gene. Following DON application, no significant induction of expression was detected for any of the four genes (Supplementary Figure 4A) apart from a decreased expression of the BdCYP711A6 gene from 12 hpa compared with the mock-inoculated control spikes. The expression of the BdCYP711A5, BdCYP711A30, and BdCYP711A31 genes was induced following infection by the F. graminearum FgDON+ strain, at different timepoints: [from 168 hpi onward for BdCYP711A5, 48 hpi for BdCYP711A30 and 96 hpi for BdCYP711A31 (Supplementary Figure 4B)]. However, besides the difference in its timing, the magnitude of induction is by no means equivalent to the one observed for the BdCYP711A29 gene (Figure 1). Indeed, whereas the maximal level of induction of BdCYP711A29 at 48 hpi reaches more than 15-fold log2 (that is more than 18,000 fold in absolute values, Figure 1A), maximal levels of expression for the BdCYP711A5, BdCYP711A30, and BdCYP711A31 correspond at most to a 5, 6.5, and 17-fold induction compared with the mock-inoculated control (Supplementary Figure 4B). From these results, we can conclude that, among the five BdCYP711A genes, BdCYP711A29 is the only gene copy which exhibits such a strong transcriptional induction following F. graminearum infection in a DON-dependent manner.
Construction of B. distachyon Lines Overexpressing BdCYP711A29 and Selection of BdCYP711A29 TILLING Mutants
Following Agrobacterium tumefaciens-mediated transformation of the B. distachyon Bd21-3 ecotype (see section “Materials and Methods”), two independent homozygous BdCYP711A29 overexpressing lines were recovered (data not shown),. In addition, a null segregant, NS-11.26, that is a plant regenerated from the in vitro culture steps but devoid of the transgene, was selected to be used as a control (Table 1). RT-qPCR experiments were conducted to verify the expected overexpression of the BdCYP711A29 gene in spikes, leaves and roots. As shown in Figure 4, overexpression rates were highly similar in the three organs with line OE-CYP12.20 exhibiting a significantly higher level of expression than line OE-CYP11.29. These two overexpressing lines were used in further experiments (Table 1).
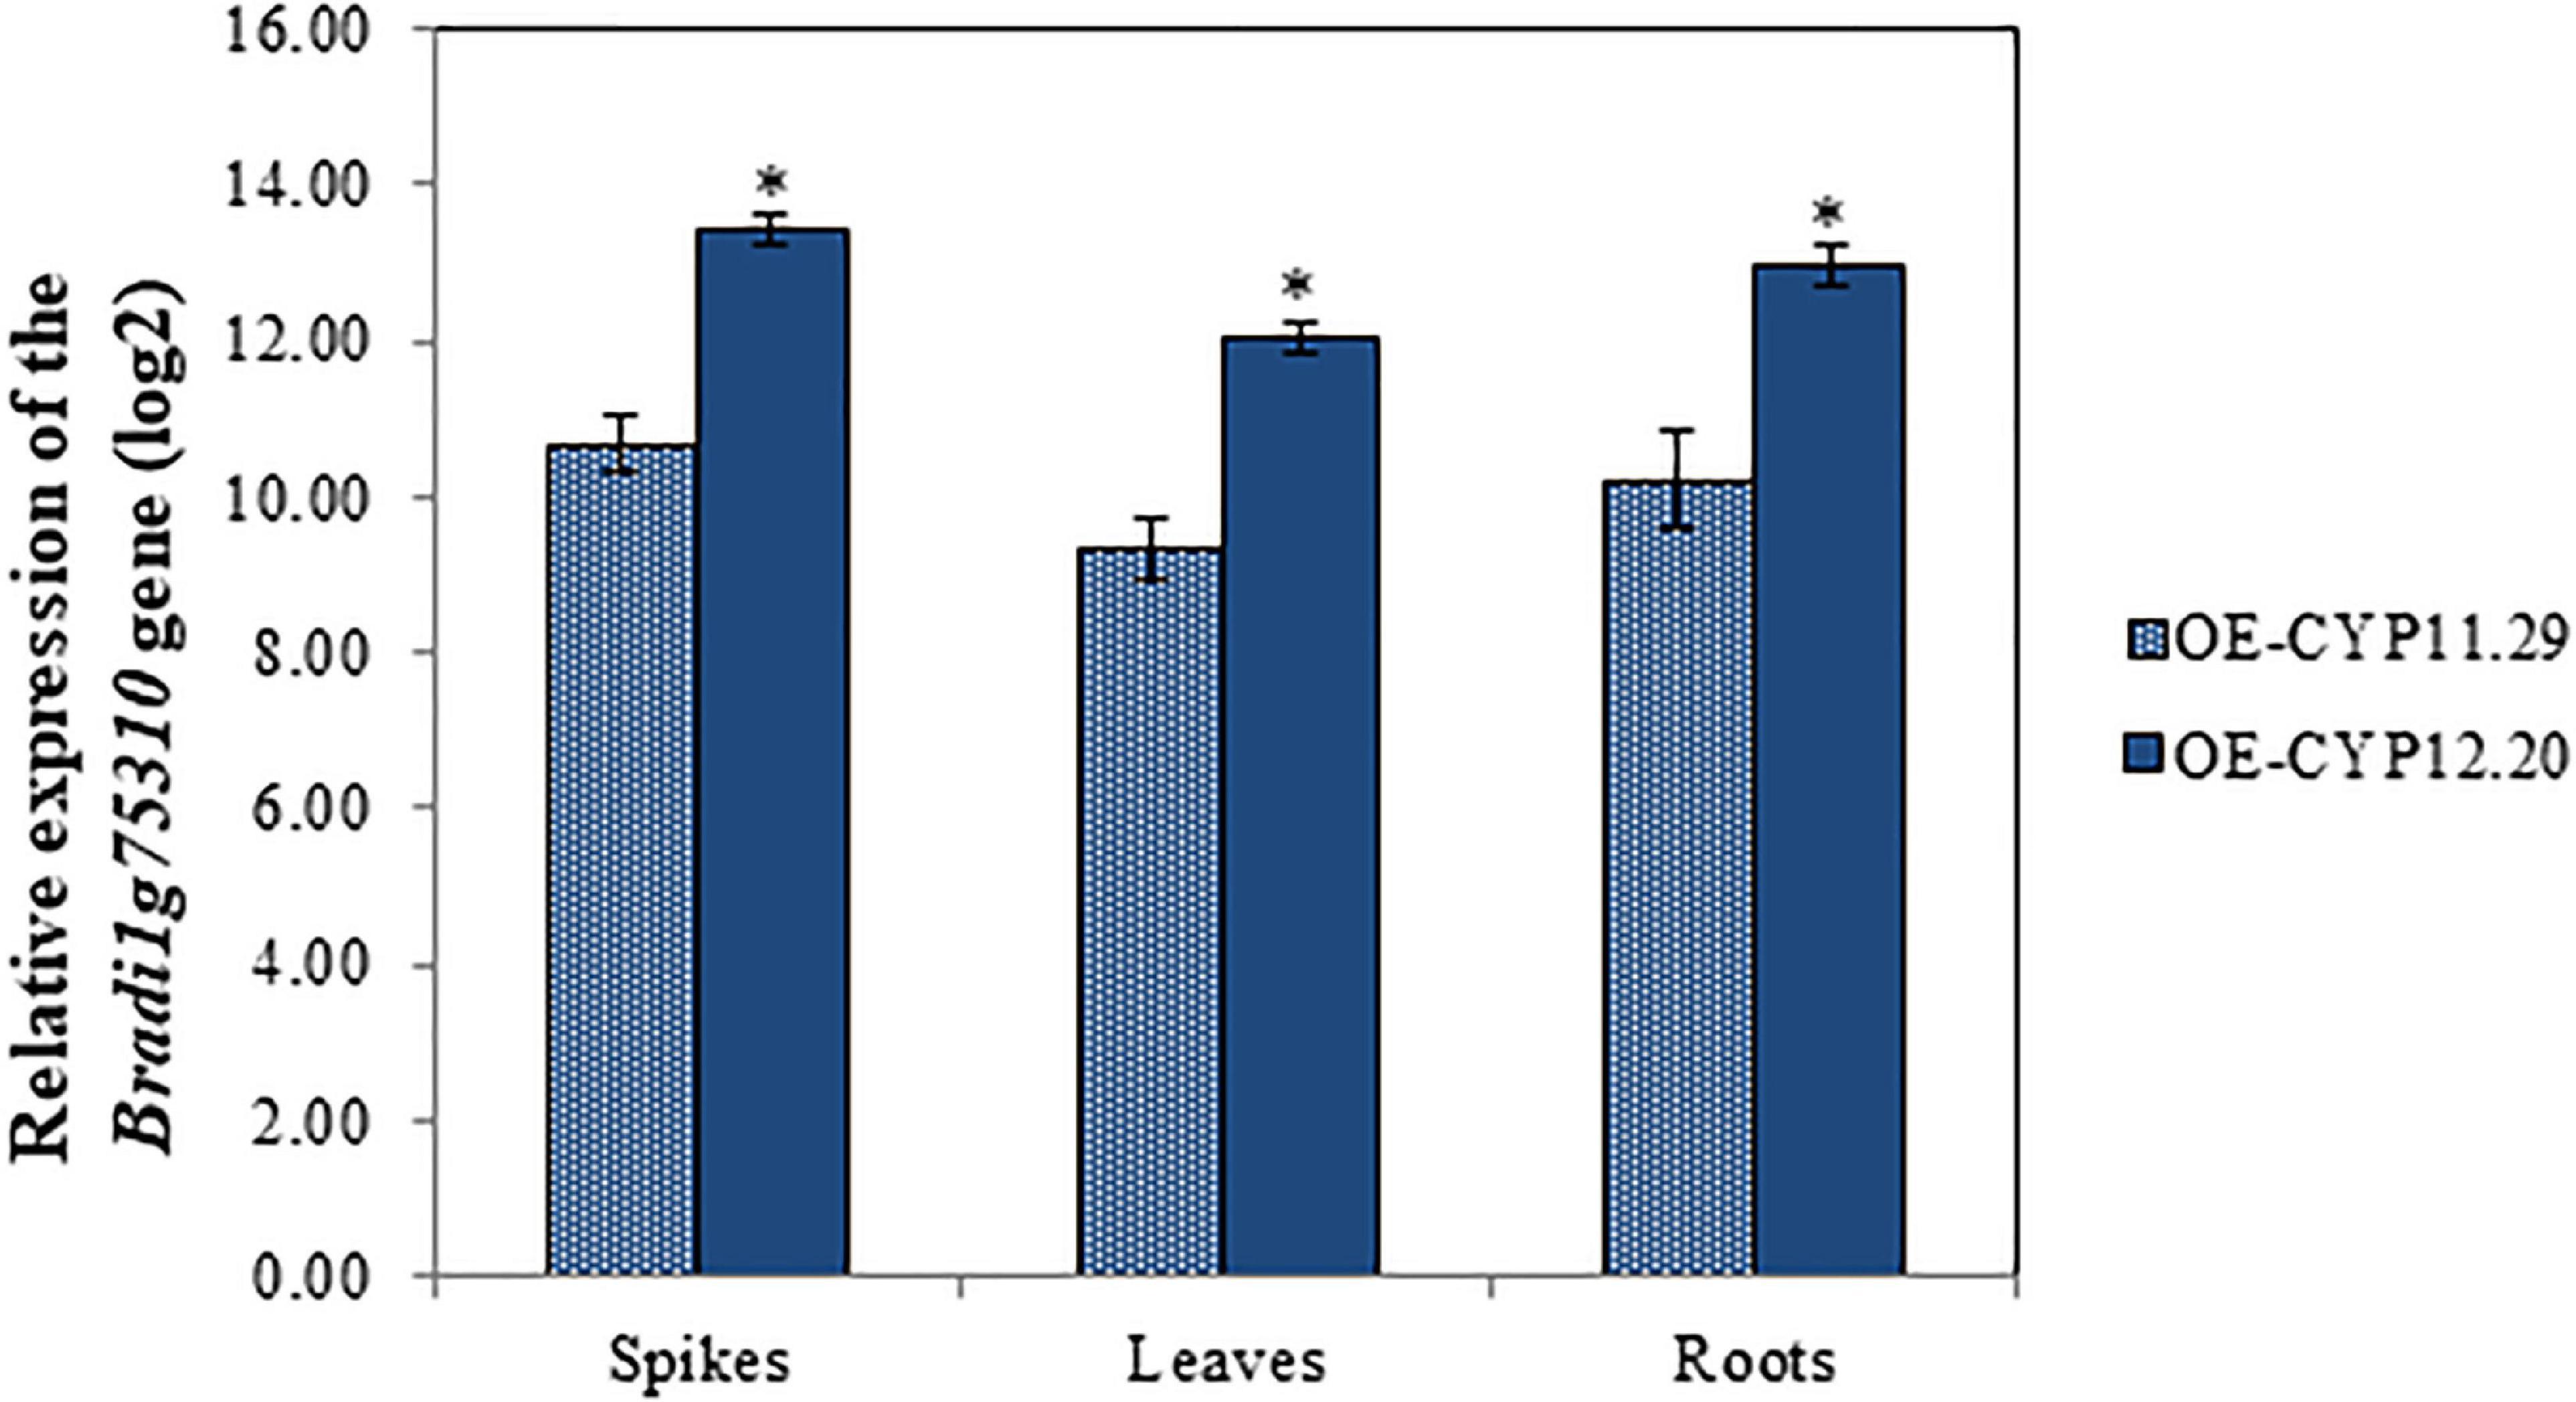
Figure 4. Molecular characterization of B. distachyon lines overexpressing the BdCYP711A29 gene. Relative expression of the BdCYP711A29 gene in spikes. leaves and roots of overexpressing lines OE-CYP11.29 and OE-CYP12.20. The relative quantity of BdCYP711A29 transcripts (fold-change. log2) of OE lines as compared with the Bd21-3 WT line was calculated using the comparative cycle threshold method (2– ΔΔCt). The B. distachyon UBC18 and ACT7 genes (Bradi4g00660 and Bradi4g41850) were used as endogenous controls to normalize the data for differences in input RNA between the different samples. Data represent mean values of three independent biological experiments (n = 3) and two technical repetitions ± standard deviation. Different letters indicate significant differences between conditions (Student’s t-test p value < 0.01).
Lines mutated for the BdCYP711A29 gene were obtained by screening the B. distachyon TILLING mutant collection available in the Bd21-3 ecotype (Dalmais et al., 2013, see section “Materials and Methods” and Supplementary Figures 1, 2). Eleven mutant families carrying point mutations in the region of interest were recovered (Supplementary Table 5). A Sorting Intolerant From Tolerant (SIFT) analysis (Kumar et al., 2009) showed that four mutant families exhibited a SIFT score below 0.05 and were therefore likely to carry point mutations predicted to strongly impact the functionality of the protein (Supplementary Table 5): three families exhibited missense mutations (8,687, 7,708, and 7,424) and one (5,374) carried a nonsense mutation (R450*) leading to a protein truncated of the last 73 amino-acids, therefore lacking the highly conserved heme-binding domain (Supplementary Figure 2). Control lines carrying a BdCYP711A29 WT allele could be selected for families 8,687 and 5,374 but not for two other mutant families 7,424 and 7,708, which is problematic considering the numerous mutations per genome in TILLING mutant families. Therefore, only the two mutant lines, notated M8687#12 and M5374#135, respectively, and their corresponding controls, notated WT8687#2 and WT5374#139, respectively, were considered for further analyses (Table 1).
BdCYP711A29 Overexpression Increases Orobanchol Exudation From B. distachyon Roots
As previously mentioned BdCYP711A29 belongs to the CYP711A subfamily and is closely related to A. thaliana MAX1 and rice MAX1-like CYPs (Figure 2). Members of this subfamily are involved in SL biosynthesis (Bak et al., 2011; Stirnberg et al., 2002; Booker et al., 2005; Challis et al., 2013; Zhang et al., 2014). However, as for other multicopy families of proteins involved in plant secondary metabolism, phylogeny is usually insufficient to demonstrate functional homology (Moghe and Kruse, 2018). To determine whether the B. distachyon BdCYP711A29 is involved in SL biosynthesis, SL quantification was performed from root exudates.
First, we performed preliminary experiments on root exudates from the WT line collected after 1 week of phosphate starvation using ethyl acetate supplemented with 10 ng (rac)-GR24 as the internal standard (see section “Materials and Methods” and Supplementary Figure 3). Analyses were performed by LC-MS/MS via Multiple Reaction Monitoring (MRM). Supplementary Table 3 lists the chromatographic peaks of characteristic m/z MRM transitions detected at least in one biological replicate as compared to blank sample. Both orobanchol- and strigol-type SLs were found but most of detected transitions were not specific to one SL (e.g., 345 > 97, 345 > 248 and 367 > 270 could be linked to both didehydroorobanchol and didehydrostrigol, Supplementary Table 3). We therefore focused on compounds detected through at least two different characteristic transitions: orobanchol, orobanchyl acetate, solanacol, and solanacyl acetate, each giving a chromatographic peak at only one retention time (RT). Among these, only orobanchol characteristic transitions were recorded at the same RT (9.2 min). An additional experiment using the WT line allowed us to detect a chromatographic peak at the same RT (9.2 min) for 3 orobanchol characteristic transitions (347 > 205; 347 > 97; and 347 > 233). Finally, this RT was confirmed by adding orobanchol standard in samples, which resulted in a single peak at this same RT for each transition and similar ratios as in WT line (Supplementary Figure 3B). Therefore, following MRM, we were able to confirm the presence of orobanchol in B. distachyon WT root exudates.
Second, the relative amount of orobanchol exuded from the roots of three selected contrasting lines, the WT, overexpressing (OE-CYP12.20) and TILLING mutant (M5374#135) lines was then measured by calculating the ratio between the area under the curve (AUC) of the 347 > 97 chromatographic peak, specific to orobanchol, and the AUC of the 321 > 224 chromatographic peak, and comparing it to values of the internal standard (rac)-GR24 (Boutet-Mercey et al., 2017). Data were normalized over root fresh weight. We observed a significant increase of about 16 times of the relative quantity of orobanchol in OE-CYP12.20 exudates, as compared to WT and M5374#135 lines (Figure 5 and Supplementary Table 6). These results strongly suggest that the B. distachyon BdCYP711A29 protein is involved in orobanchol biosynthesis. No significant difference was observed between Bd21-3 and the TILLING mutant line, suggesting potential functional redundancy with one or several B. distachyon other CYP711A copies.
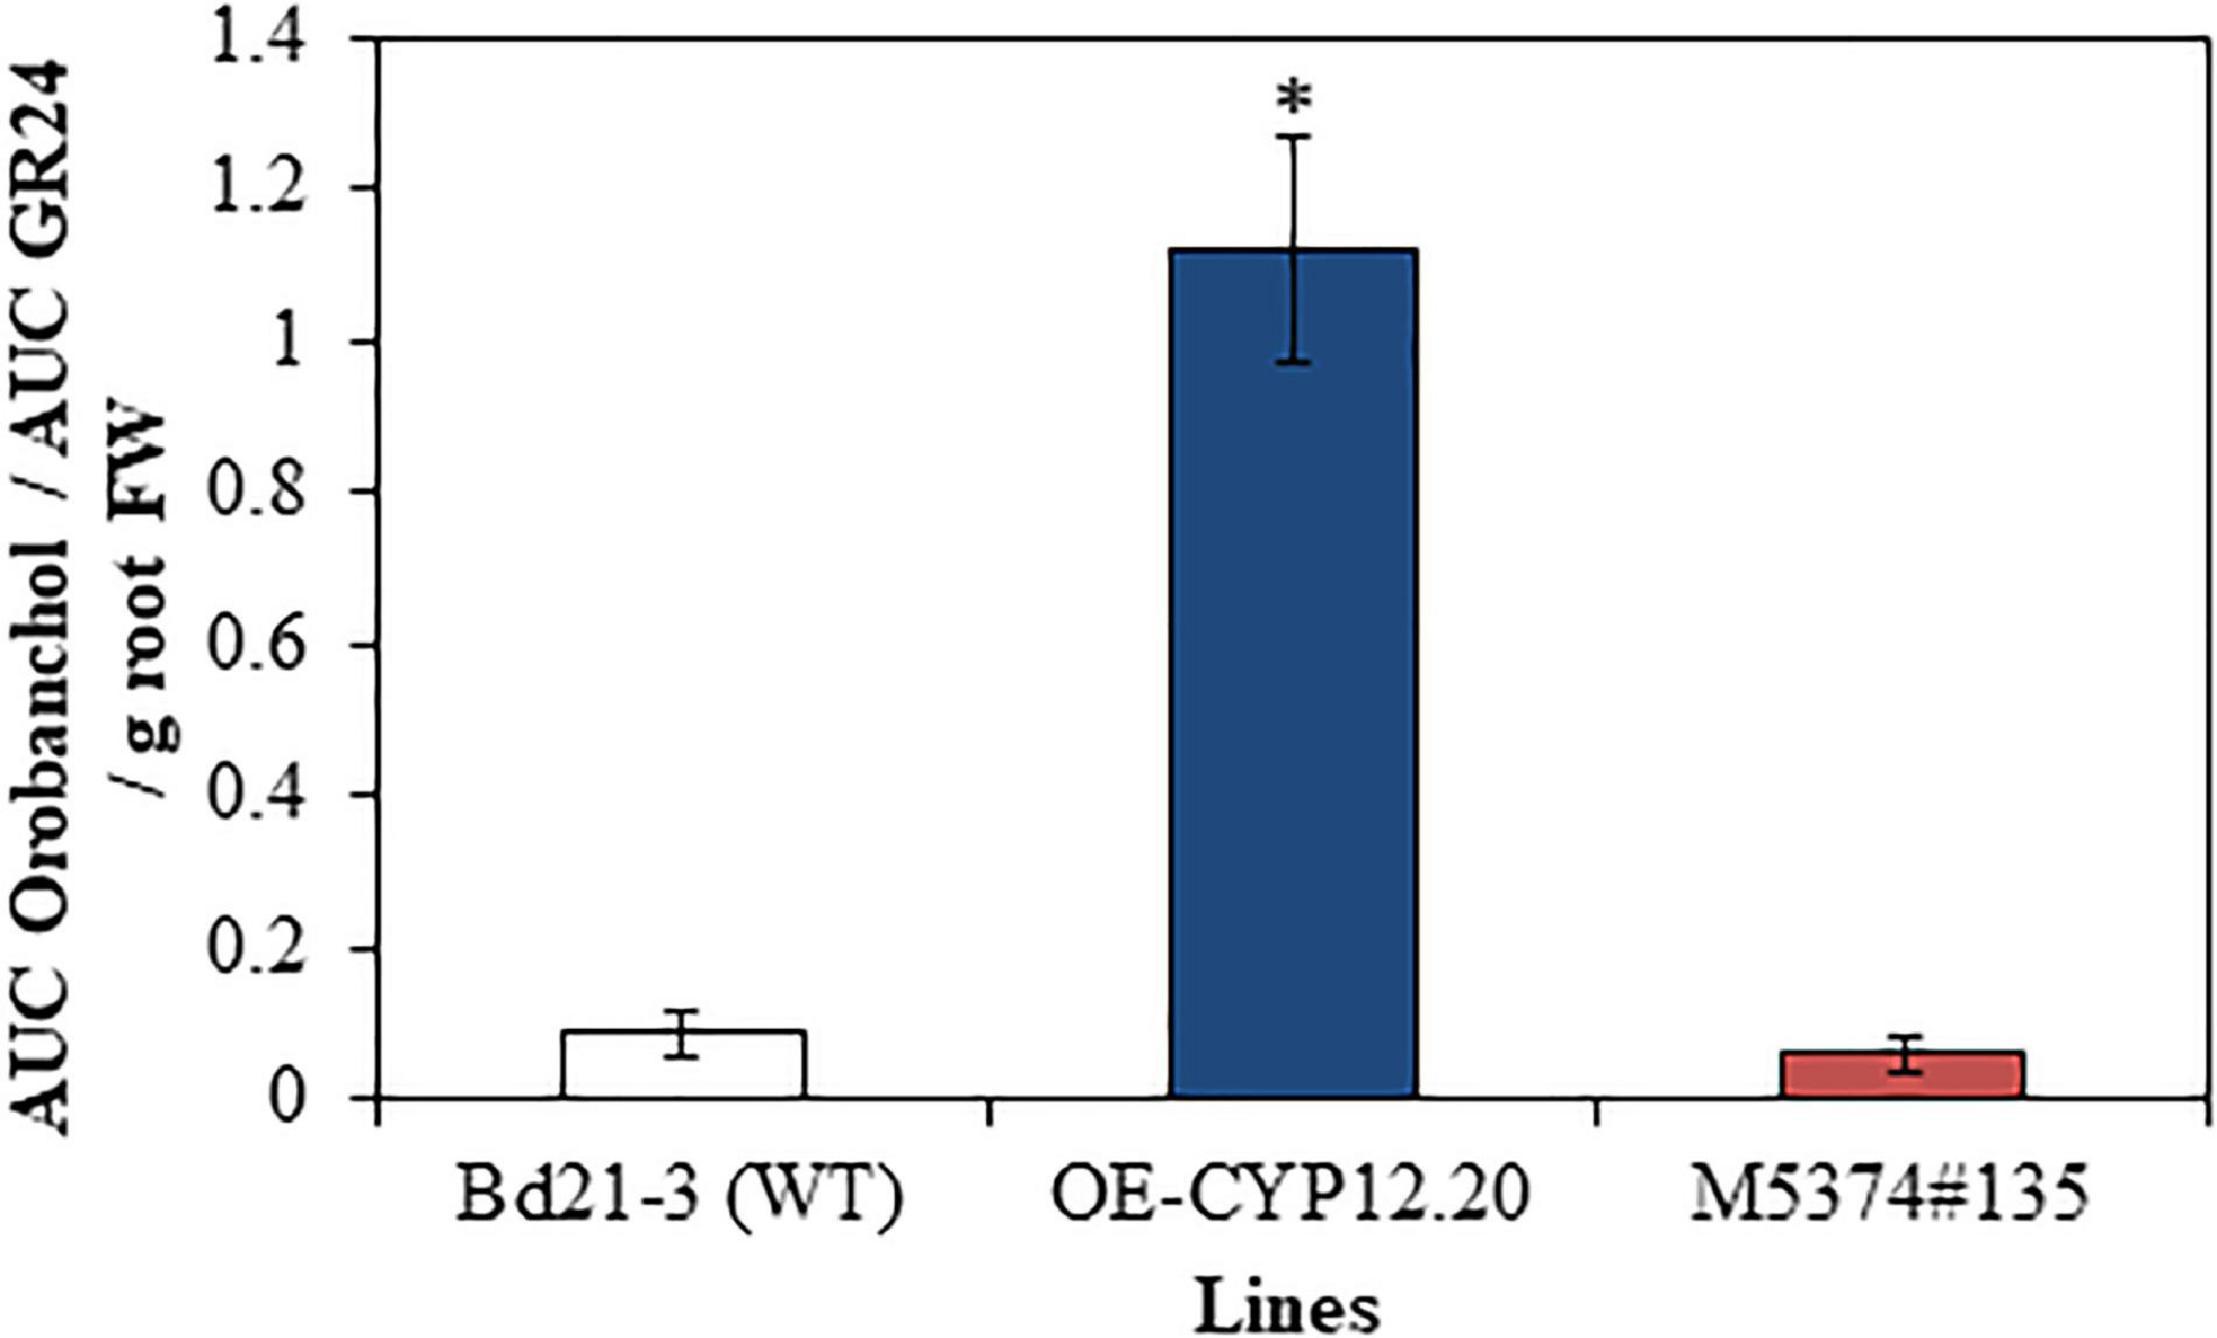
Figure 5. Quantification of orobanchol in B. distachyon exudates. Relative quantification of orobanchol in root exudates of WT (Bd21-3), overexpressing (OE-CYP12.20), and mutant (M5374#135) lines after 7 days of phosphorus starvation. AUC, Area under the curve. MRM transitions 321 > 224 and 347 > 97 were used to quantify GR24 and orobanchol signals, respectively. Mean of three biological replicates ± standard deviation. The asterisk indicates significant differences between conditions (p-value < 0.05, Tukey’s test).
Overexpression of the BcCYP711A29 Gene Increases Susceptibility to FHB but Has no Impact on Plant Development
Considering that the B. distachyon BdCYP711A29 is involved in orobanchol biosynthesis, 4 weeks-old (end of the vegetative stage in our conditions) plants of overexpressing lines and TILLING mutants and their respective control lines were examined for the number of tillers and compared to the WT Bd21-3 ecotype. Apart from control and mutant lines WT5374#139 and M5374#135, no statistically significant difference could be observed compared to the WT line (Supplementary Figure 5). This indicates that BdCYP711A29 does not significantly participate to B.distachyon development.
In order to determine whether the BdCYP711A29 gene is involved in the interaction between B. distachyon and F. graminearum, spray inoculations by spore suspensions of the F. graminearum FgDON+ strain were performed on whole spikes of the lines previously described: WT, overexpressing lines (OE-CYP11.29 and OE-CYP12.20) and the corresponding null segregant (NS-11.26), TILLING mutant lines (M5374#135, M8687#12) and their control lines (WT5374#139 and WT8687#2, respectively). Representative symptoms, that is more or less extended bleaching on spikelets, at 7 and 14 dpi are presented in Figure 6A. FHB symptoms were quantified at 7 and 14 dpi by counting the number of spikelets exhibiting more than 50% of symptomatic florets over the total number of spikelets (Figure 6B). The results represent the mean of four independent biological replicates. Seven dpi, both overexpressing lines OE-CYP11.29 and OE-CYP12.20 exhibited more developed symptoms (35.9 ± 4.7% and 46.2 ± 6.1% of symptomatic spikelets, respectively) as compared to WT (11.2 ± 3.3%) and NS-11.26 (14.4 ± 3.3%) (Figure 6B). All the TILLING mutant lines, carrying either the mutant or WT allele for the BdCYP71A29 gene, presented symptoms equivalent to those observed with the WT line (Figure 6B). After another week of disease development (14 dpi), the tendency described above was conserved. Both overexpressing lines presented increased symptoms as compared with control lines (48.3 ± 4.9% for OE-CYP11.29 and 68.6 ± 5.2% for OE-CYP12.20 compared to 32.5 ± 5.1% and 26.3 ± 5.0% for Bd21-3 and NS-11.26, respectively) (Figure 6B). The approx. 20% differential development of symptoms between the two overexpressing lines was statistically significant (Figure 6B). As observed at 7 dpi, the TILLING lines did not show any significant difference in the level of symptomatic spikelets as compared to the WT line (Figure 6B).
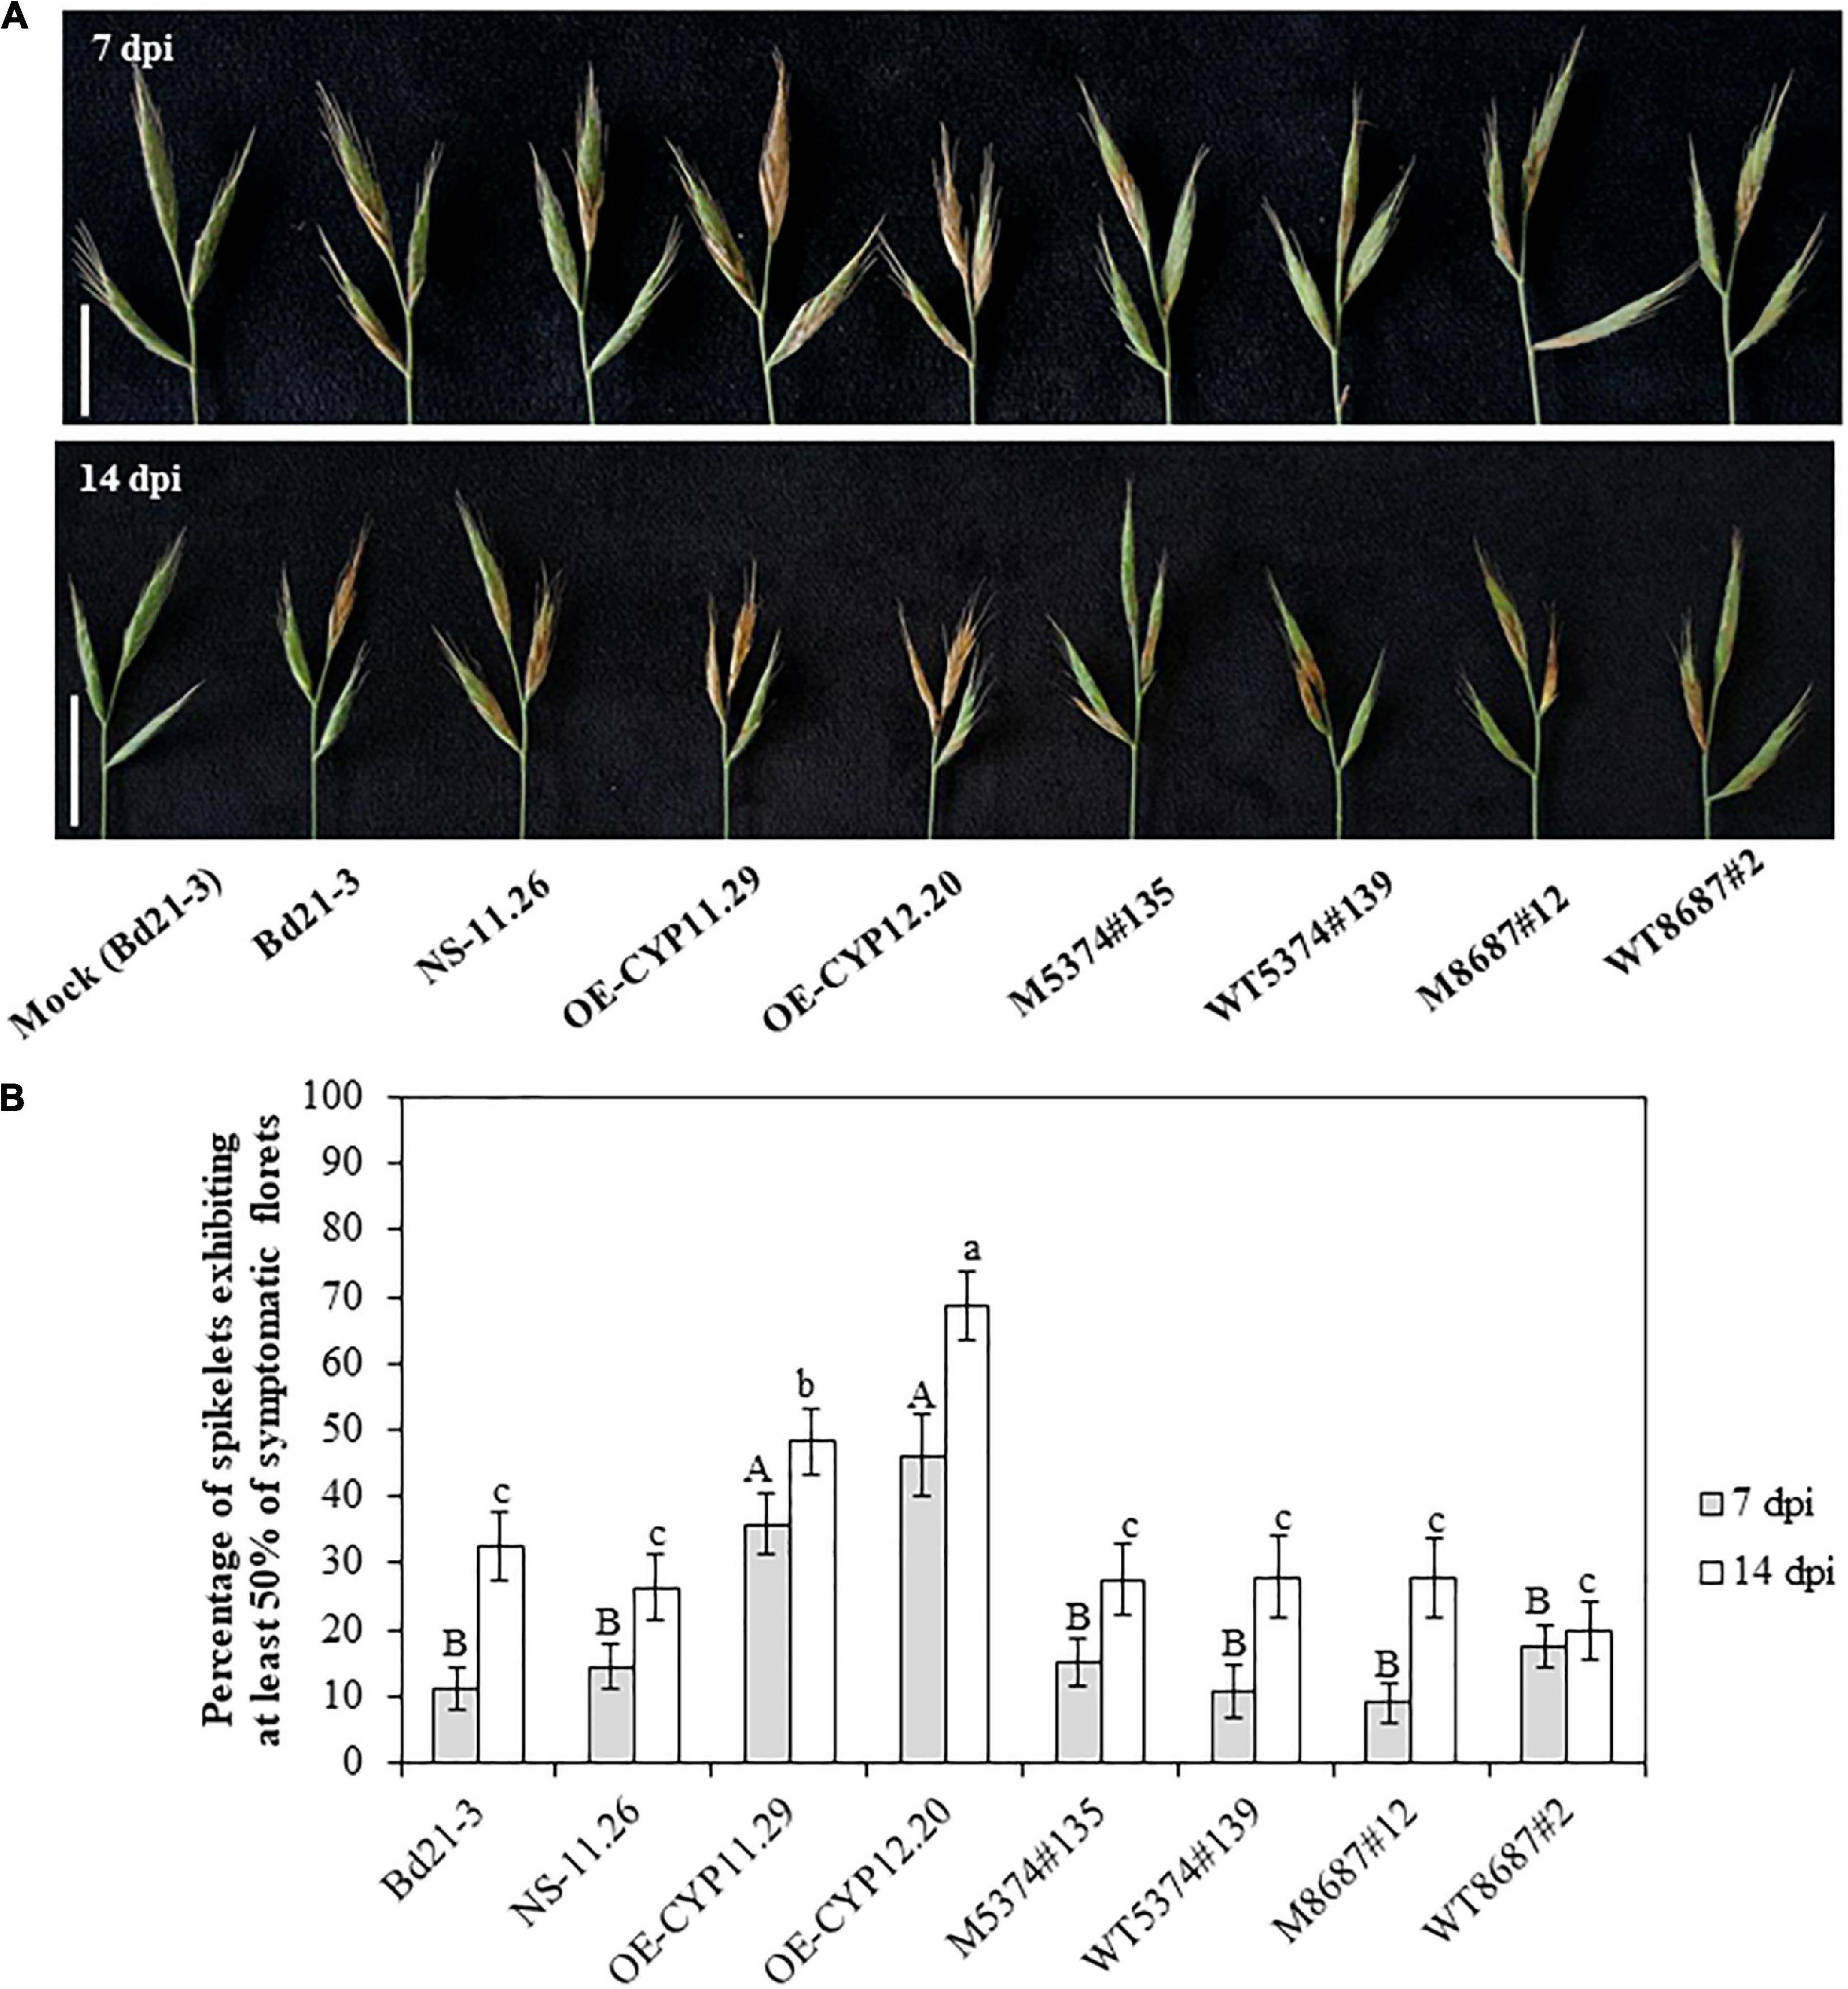
Figure 6. Overexpression of the BdCYP711A29 gene increases FHB susceptibility following spray inoculation of F. graminearum. (A) Typical FHB symptoms at 7 and 14 days following spray inoculation of whole spikes of the different lines by the F. graminearum FgDON+ strain. Bars equal 1 cm. (B) Percentage of spikelets exhibiting FHB symptoms on at least 50% of the florets of the inoculated spikes at 7 and 14 dpi by the PH-1 strain. Mean of four independent biological replicates (n = 52). Different letters indicate significant differences between conditions; upper case and lower case letters indicate the statistical comparison at 7 and 14 dpi, respectively (p-value < 0.05, Tukey’s test).
To be able to correlate the differences of disease symptoms described above with a differential fungal development, we quantified by qPCR the relative amount of fungal gDNA on the same material used for symptoms quantification (3 out of 4 biological replicates). At 7 dpi, WT samples exhibited 20.3 ± 10.8% of fungal DNA and the other control lines showed similar values: 24.7 ± 11.3; 11.9 ± 7.6 and 21.6 ± 14.9% for NS-11.26, WT5374#139 and WT8687#2, respectively (Figure 7). Whereas TILLING mutant lines did not exhibit differences greater than 10% compared to WT and TILLING control lines (22.5 ± 11.6 and 13.4 ± 10.9% for M5374#135 and M8687#12, respectively), both overexpressing lines contained an increased percentage of fungal DNA as compared to Bd21-3 and NS-11.26 (45.8 ± 16.4 and 62.8 ± 12.5% for OE-CYP11.29 and OE-CYP12.20, respectively, Figure 7). This tendency was conserved at the 14 dpi time-point since all the control lines and TILLING mutant lines ranged from 28.7 ± 15.6 (M5374#135) to 40.6 ± 5.4% (M8687#12), contrary to overexpressing lines which exhibited from around 20–45% more fungal DNA (59.0 ± 4.3 and 75.5 ± 8.9% for OE-CYP11.29 and OE-CYP12.20, respectively, Figure 7). Statistical analyses were conducted on these results and showed that the OE-CYP lines contained significantly more fungal DNA compared to the control lines Bd21-3 and NS-11.26 either at one (OE-CYP11.29, 7 dpi) or both time-points (OE-CYP12.20, 7 and 14 dpi) therefore confirming the increased susceptibility of these lines to fungal infection (Figure 7).
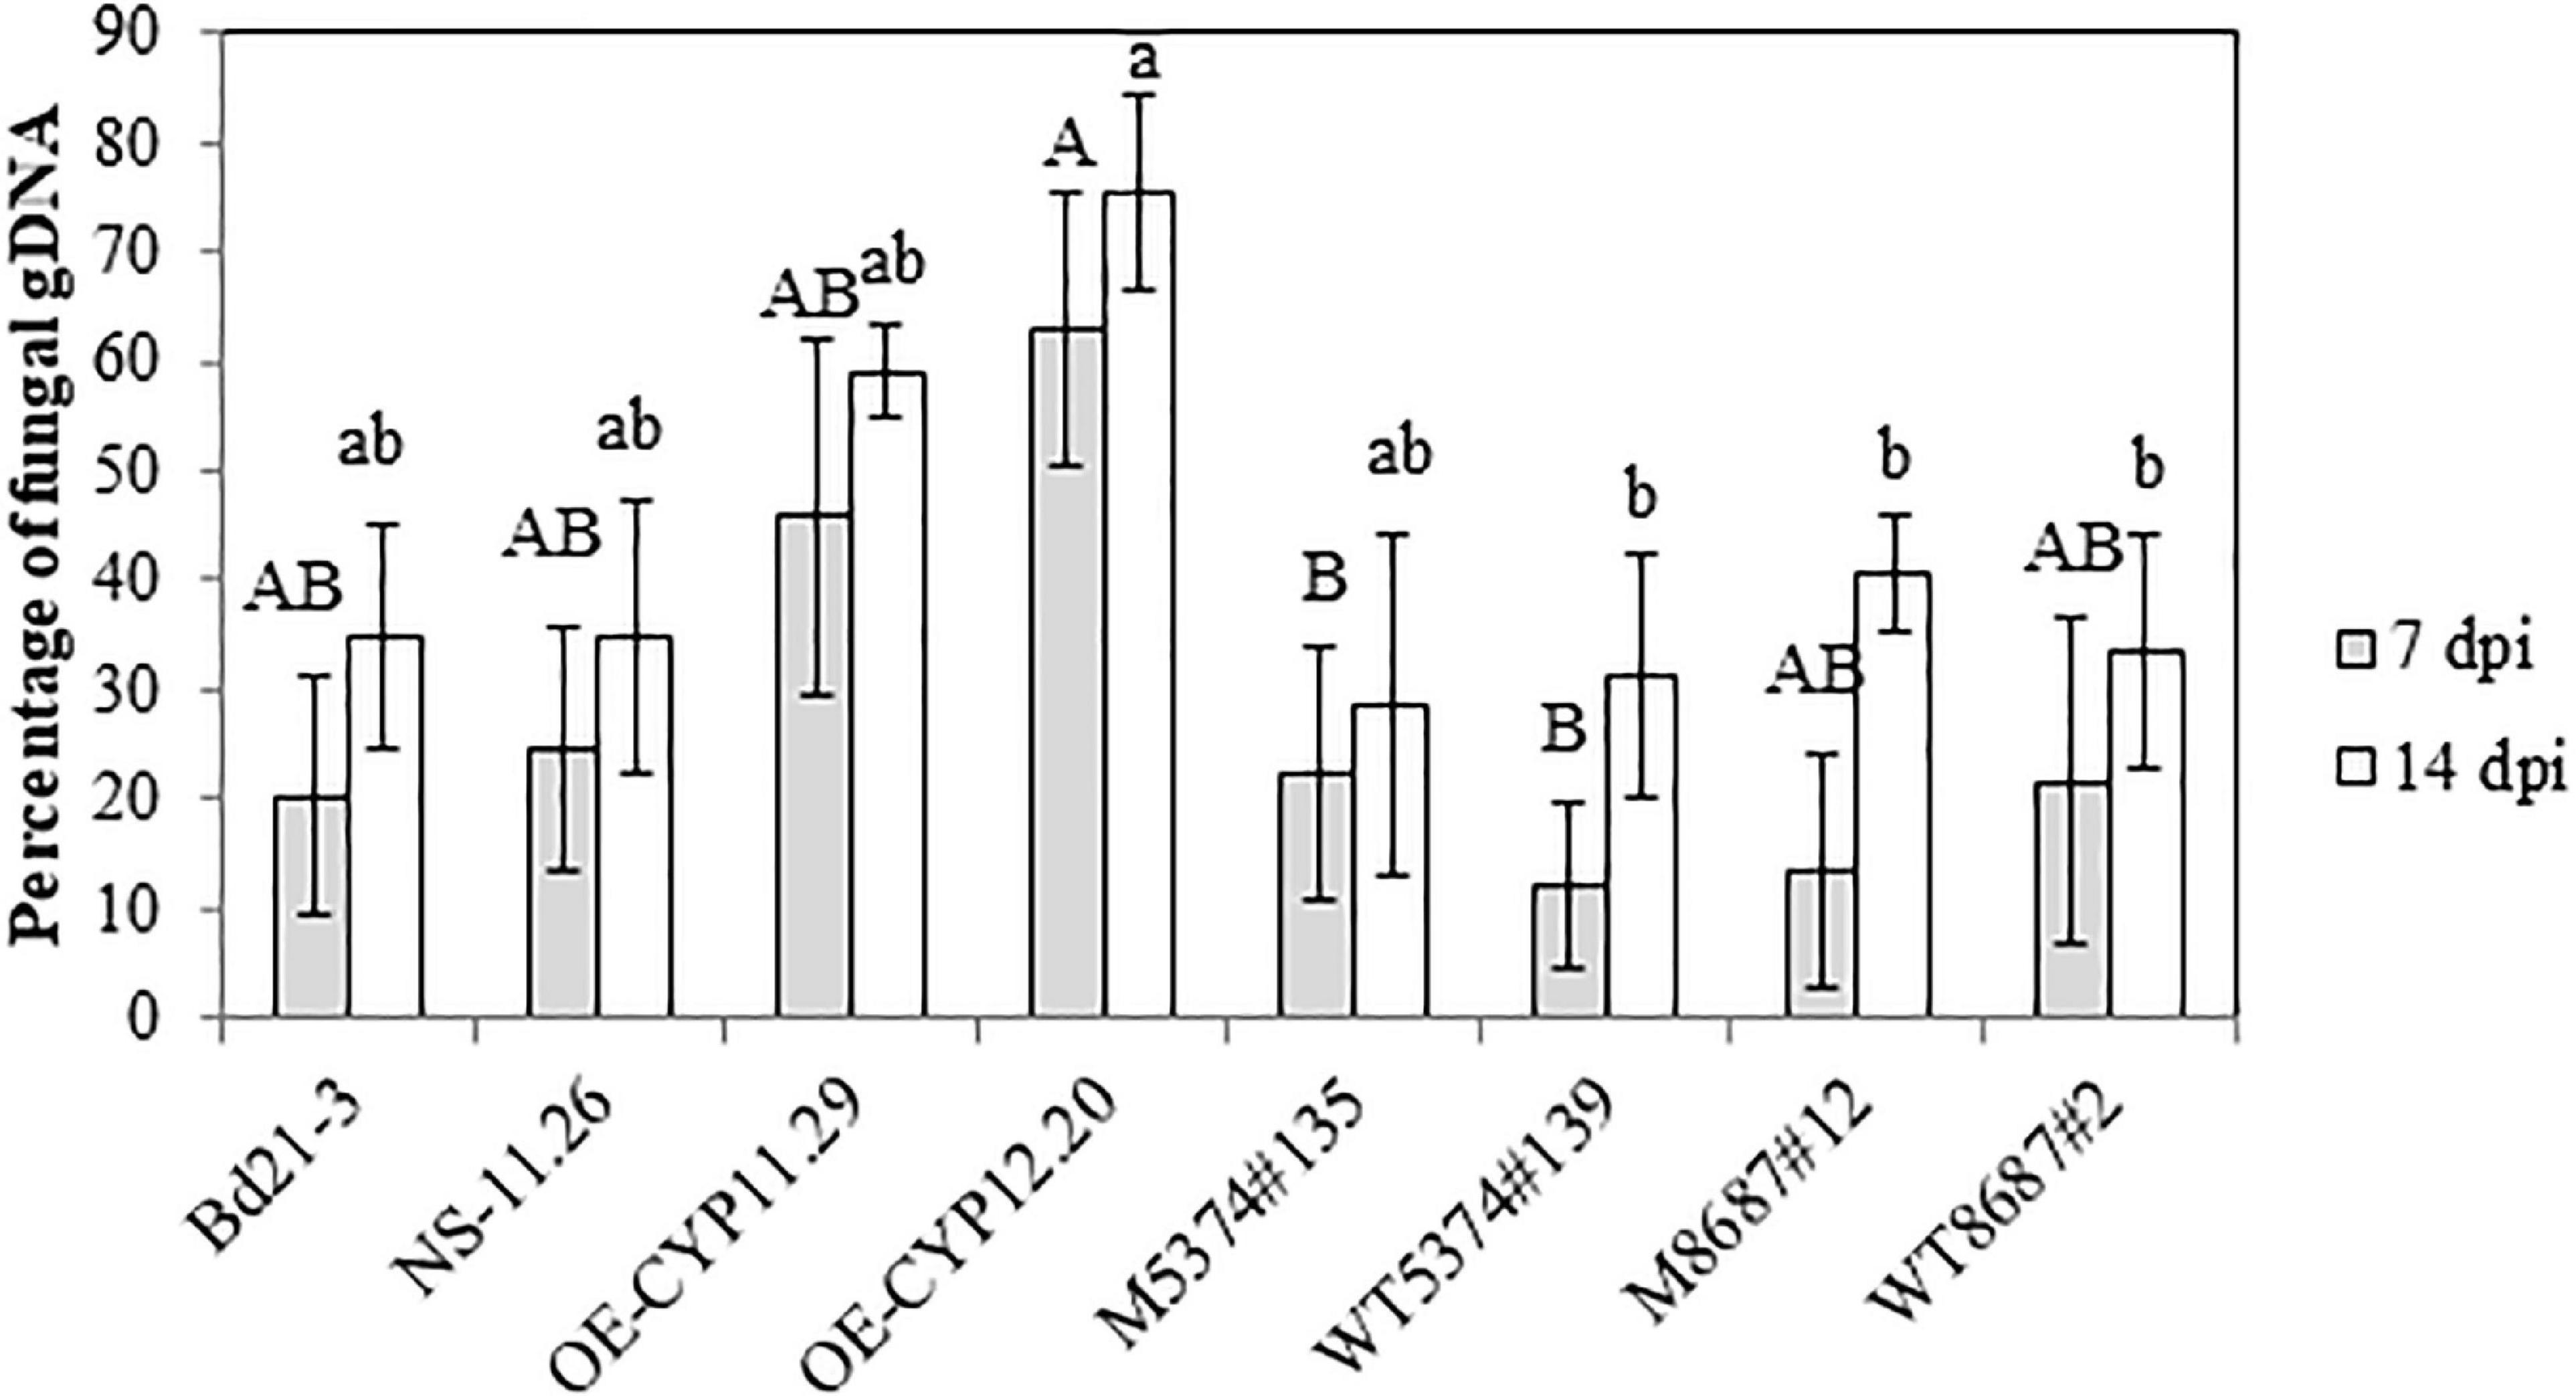
Figure 7. Overexpression of the BdCYP711A29 gene promotes F. graminearum development on B. distachyon spikes following spray inoculation. Relative quantification of fungal DNA by qPCR compared to total DNA 7 and 14 days after spray inoculation of different B. distachyon lines with the FgDON+ strain of F. graminearum. Mean of three independent biological replicates ± standard error. Different letters indicate significant differences between conditions (p-value < 0.05, one way ANOVA and pairwise t-tests with Bonferroni correction).
BdCYP711A29 Does Not Participate to B. distachyon Defenses Following F. graminearum Infection
To determine if the observed increased susceptibility of the overexpressing lines may be due to a modification of plant defenses, expression of B. distachyon defense marker genes previously shown to be induced upon F. graminearum infection (Pasquet et al., 2016) was investigated by RT-qPCR on spikes of the WT line, the NS-11.26 null segregant, the two overexpressing lines (OE-CYP11.29 and OE-CYP12.20), the two TILLING mutant lines (M5374#135 and M8687#12) and their corresponding controls (WT5374#139 and WT8687#2, respectively). To do so, we used four defense marker genes, two genes encode pathogenesis-related proteins, PR1-5 (Bradi1g57590, Kakei et al., 2015; Kouzai et al., 2016) and PR9 (Bradi1g39190, Pasquet et al., 2014), the third one encodes a phenylalanine ammonia lyase, recently renamed BdPAL6 (Bradi3g47110, Cass et al., 2015) and the last one codes for a uridine diphosphate (UDP)-glucosyltransferase shown to be involved in the conjugation of DON into DON-3-O-glucose (Bradi5g03300, Pasquet et al., 2016). The expression of these four defense genes was first assessed on healthy spikes. Very low basal levels of expression prevented proper comparison of the expression levels in healthy plants of the different genotypes (data not shown). Nevertheless, relative expression of the four marker genes could be quantified after spray inoculation by the F. graminearum FgDON+ strain. The 96 hpi time-point was chosen because it corresponds both to the infection time-point used in the transcriptomic analysis of B. distachyon response to fungal infection (Pasquet et al., 2014) and to maximal expression of most of the defense genes in our conditions (Schweiger et al., 2013; Pasquet et al., 2016). Almost no statistically significant difference could be detected between the different lines, whatever the alteration of the BdCYP711A29 gene, overexpression or mutation (Figure 8). The unique difference was observed for the PR9 gene (Bradi1g39190, Figure 8A), for which a stronger induction was observed 96 hpi in the OE-CYP12.20 line as compared to the WT Bd21-3 line (1.6 fold log2) and to the NS-11.26 null segregant (1.7 fold log2). These results suggest that the increased susceptibility of lines overexpressing the BdCYP711A29 gene likely does not result from an alteration of plant defense responses.
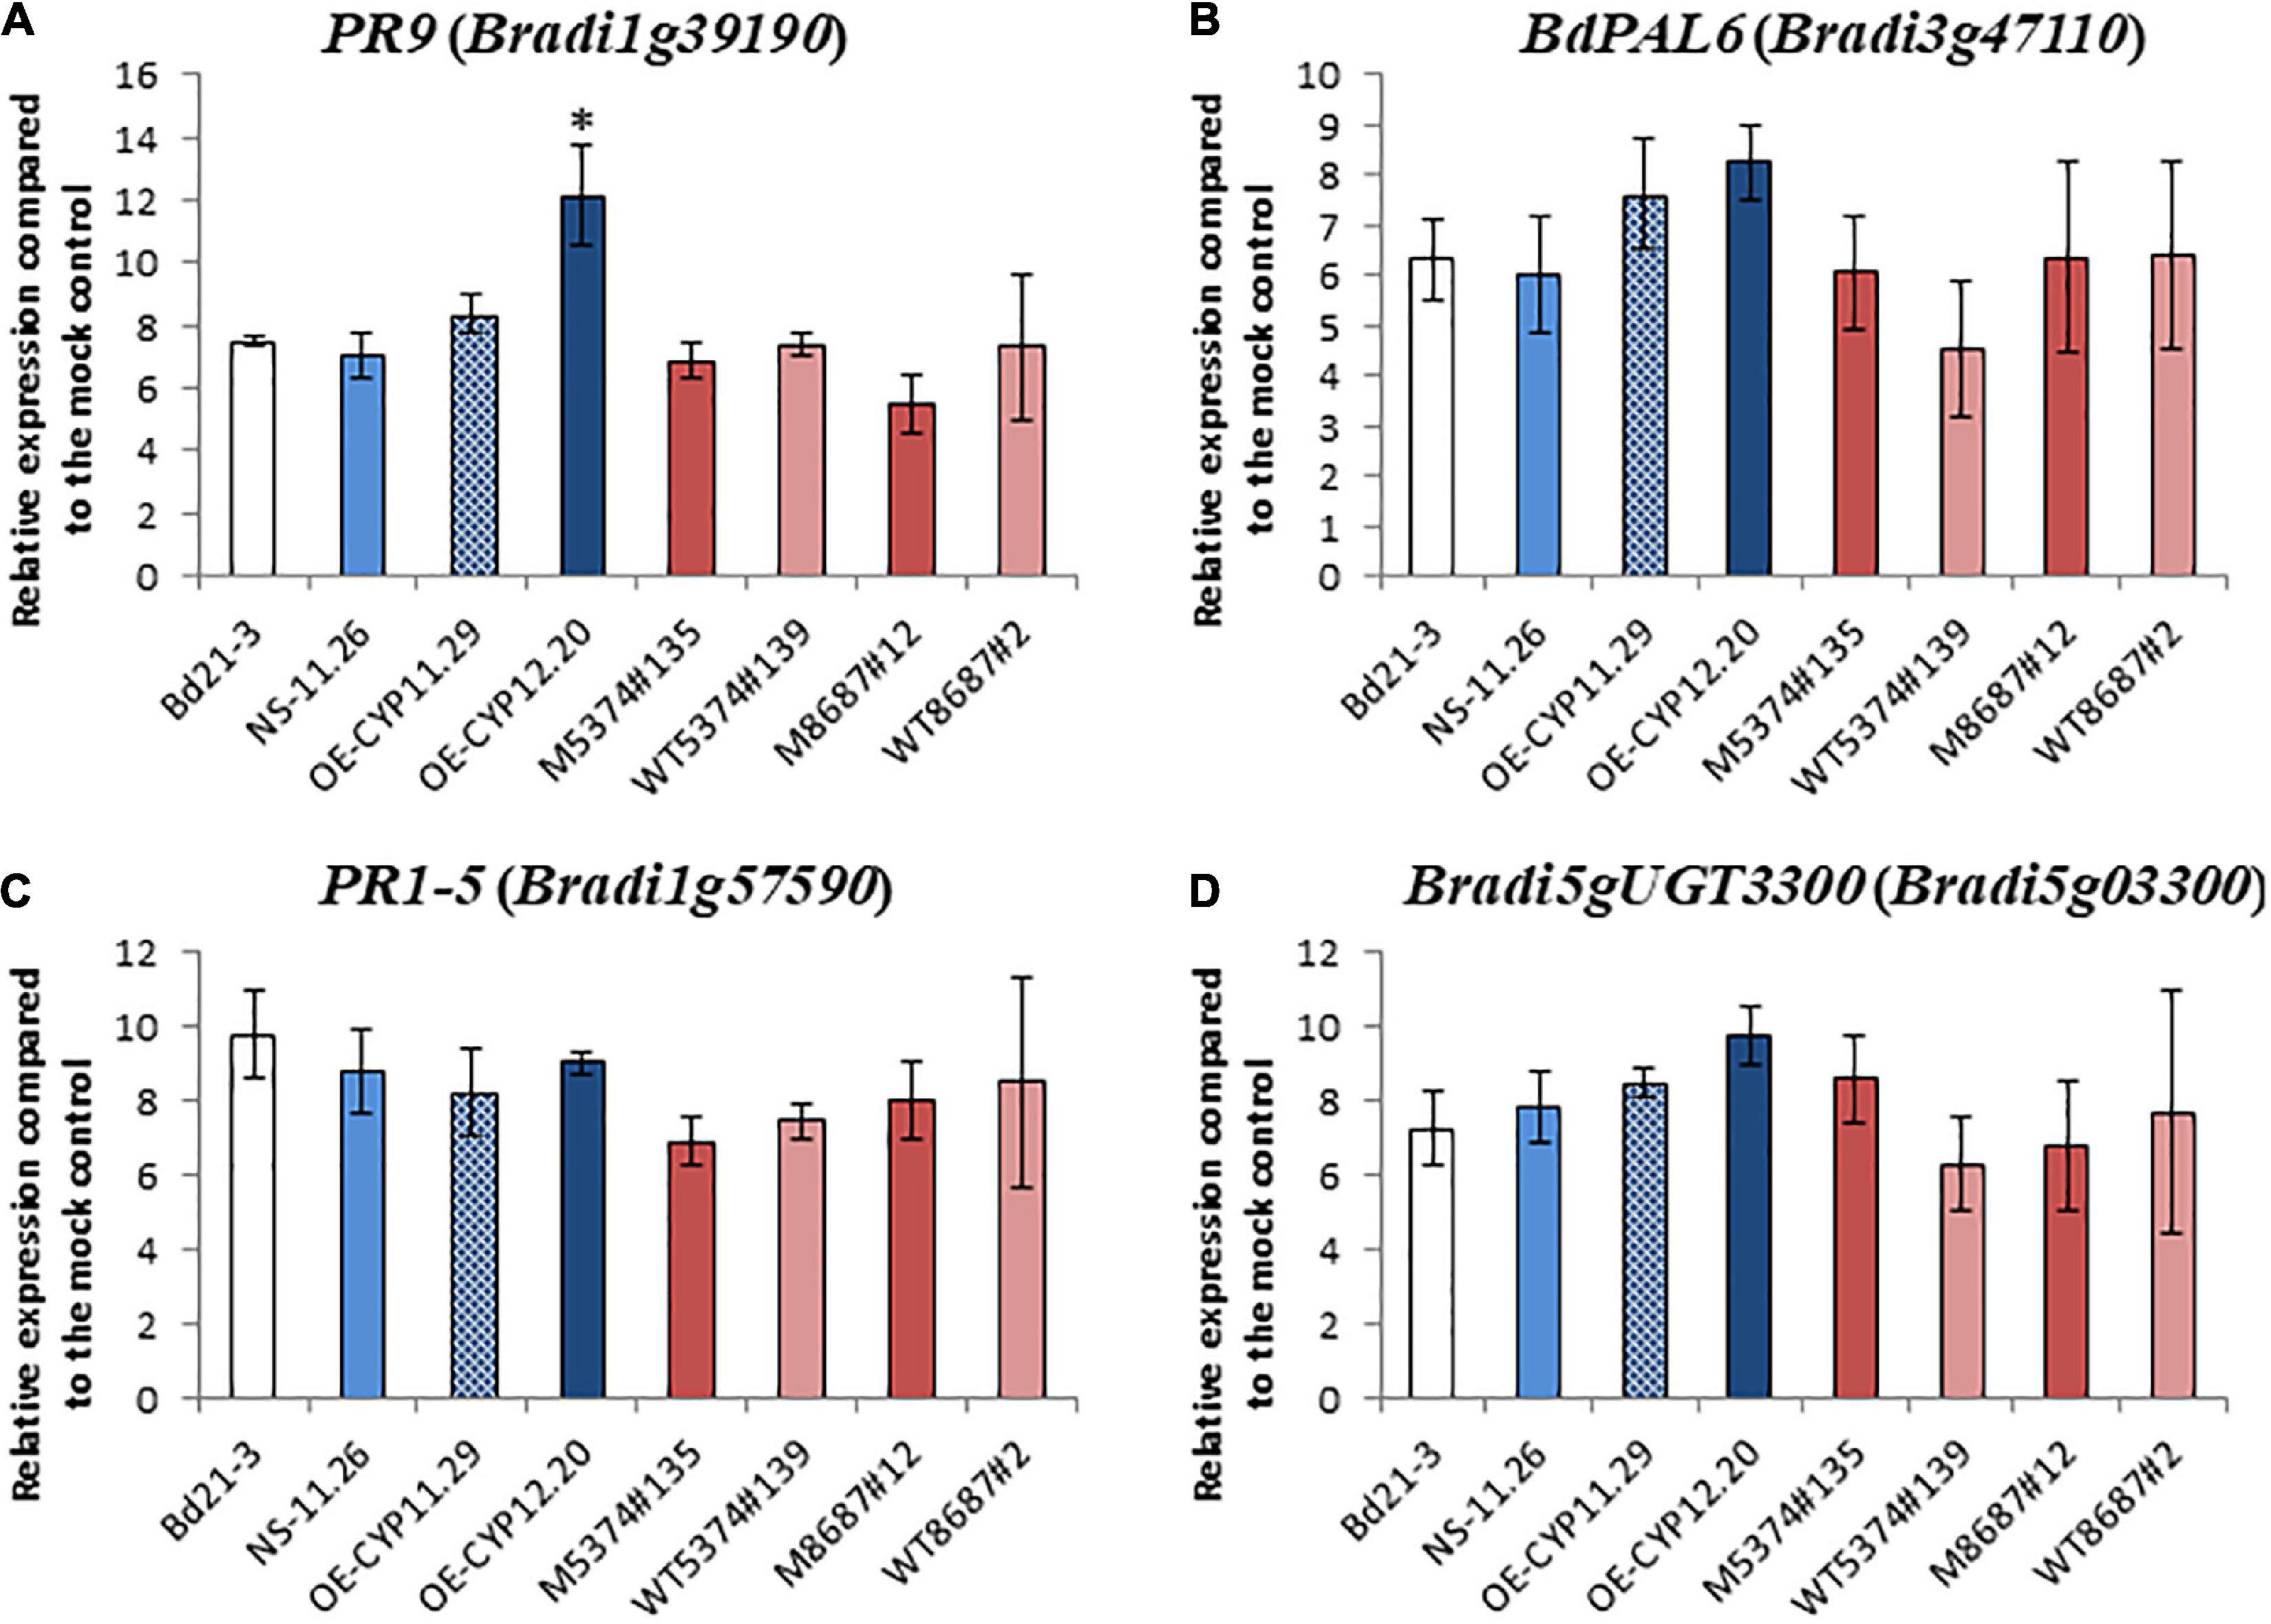
Figure 8. Relative defense gene expression levels in B. distachyon lines altered in BdCYP711A29 following F. graminearum infection compared to mock condition. Relative quantification (fold-change, log2) of the PR9 (Bradi1g39190), (A), BdPAL6 (Bradi3g47110), (B), PR1-5 (Bradi1g57590), (C), and Bradi5gUGT3300 (Bradi5g03300), (D) expression levels in the B. distachyon lines altered in the BdCYP711A29 locus or gene expression 96 hours after F. graminearum infection (FgDON+ strain) compared to mock treatment. The relative quantity of gene transcripts compared to mock condition was calculated using the comparative cycle threshold (Ct) method (2–ΔΔCt). The B. distachyon UBC18 and ACT7 genes (Bradi4g00660 and Bradi4g41850) were used as endogenous controls to normalize the data for differences in input RNA between the different samples. Mean of three independent biological replicates ± standard deviation. The asterisk (A) indicates significant differences (Student’s t-test, p value < 0.05). No difference was shown to be statistically significant under more stringent conditions (Student’s t-test, p value < 0.01).
Orobanchol Promotes F. graminearum Macroconidial Germination in vitro
Strigolactones have been shown to promote pre-symbiotic growth of AMF (Akiyama et al., 2005) and more recently to regulate root entry through the modulation of hyphopodia formation (Kobae et al., 2018). As mentioned in the Introduction part, the picture is less clear for other fungi, in particular for plant pathogenic fungi (Steinkellner et al., 2007; Dor et al., 2011; Torres-vera et al., 2014; Foo et al., 2016; Belmondo et al., 2017; Decker et al., 2017). No major difference in plant defense gene expression could explain the increased susceptibility of lines overexpressing the BdCYP711A29 (Figure 8) and the OE-CYP12.20 line overexpressing the BdCYP711A29 gene exudates increased levels of orobanchol (Figure 5). We therefore investigated the direct impact of this SL on F. graminearum, and more specifically on the germination of typical 5–6 cell asexual spores named macroconidia (Booth, 1975). Various concentrations of orobanchol were tested and their impact on the germination of F. graminearum macroconidia was estimated using an in vitro test on small agar slides. As shown in Figure 9A (see also Supplementary Figure 6 for characteristic macroconidial germination patterns at each orobanchol concentration), orobanchol increased the number of fungal germ tubes per macroconidium after 12 h incubation with a peak at 10–10 M. These results show that orobanchol stimulates F. graminearum macroconidial germination.
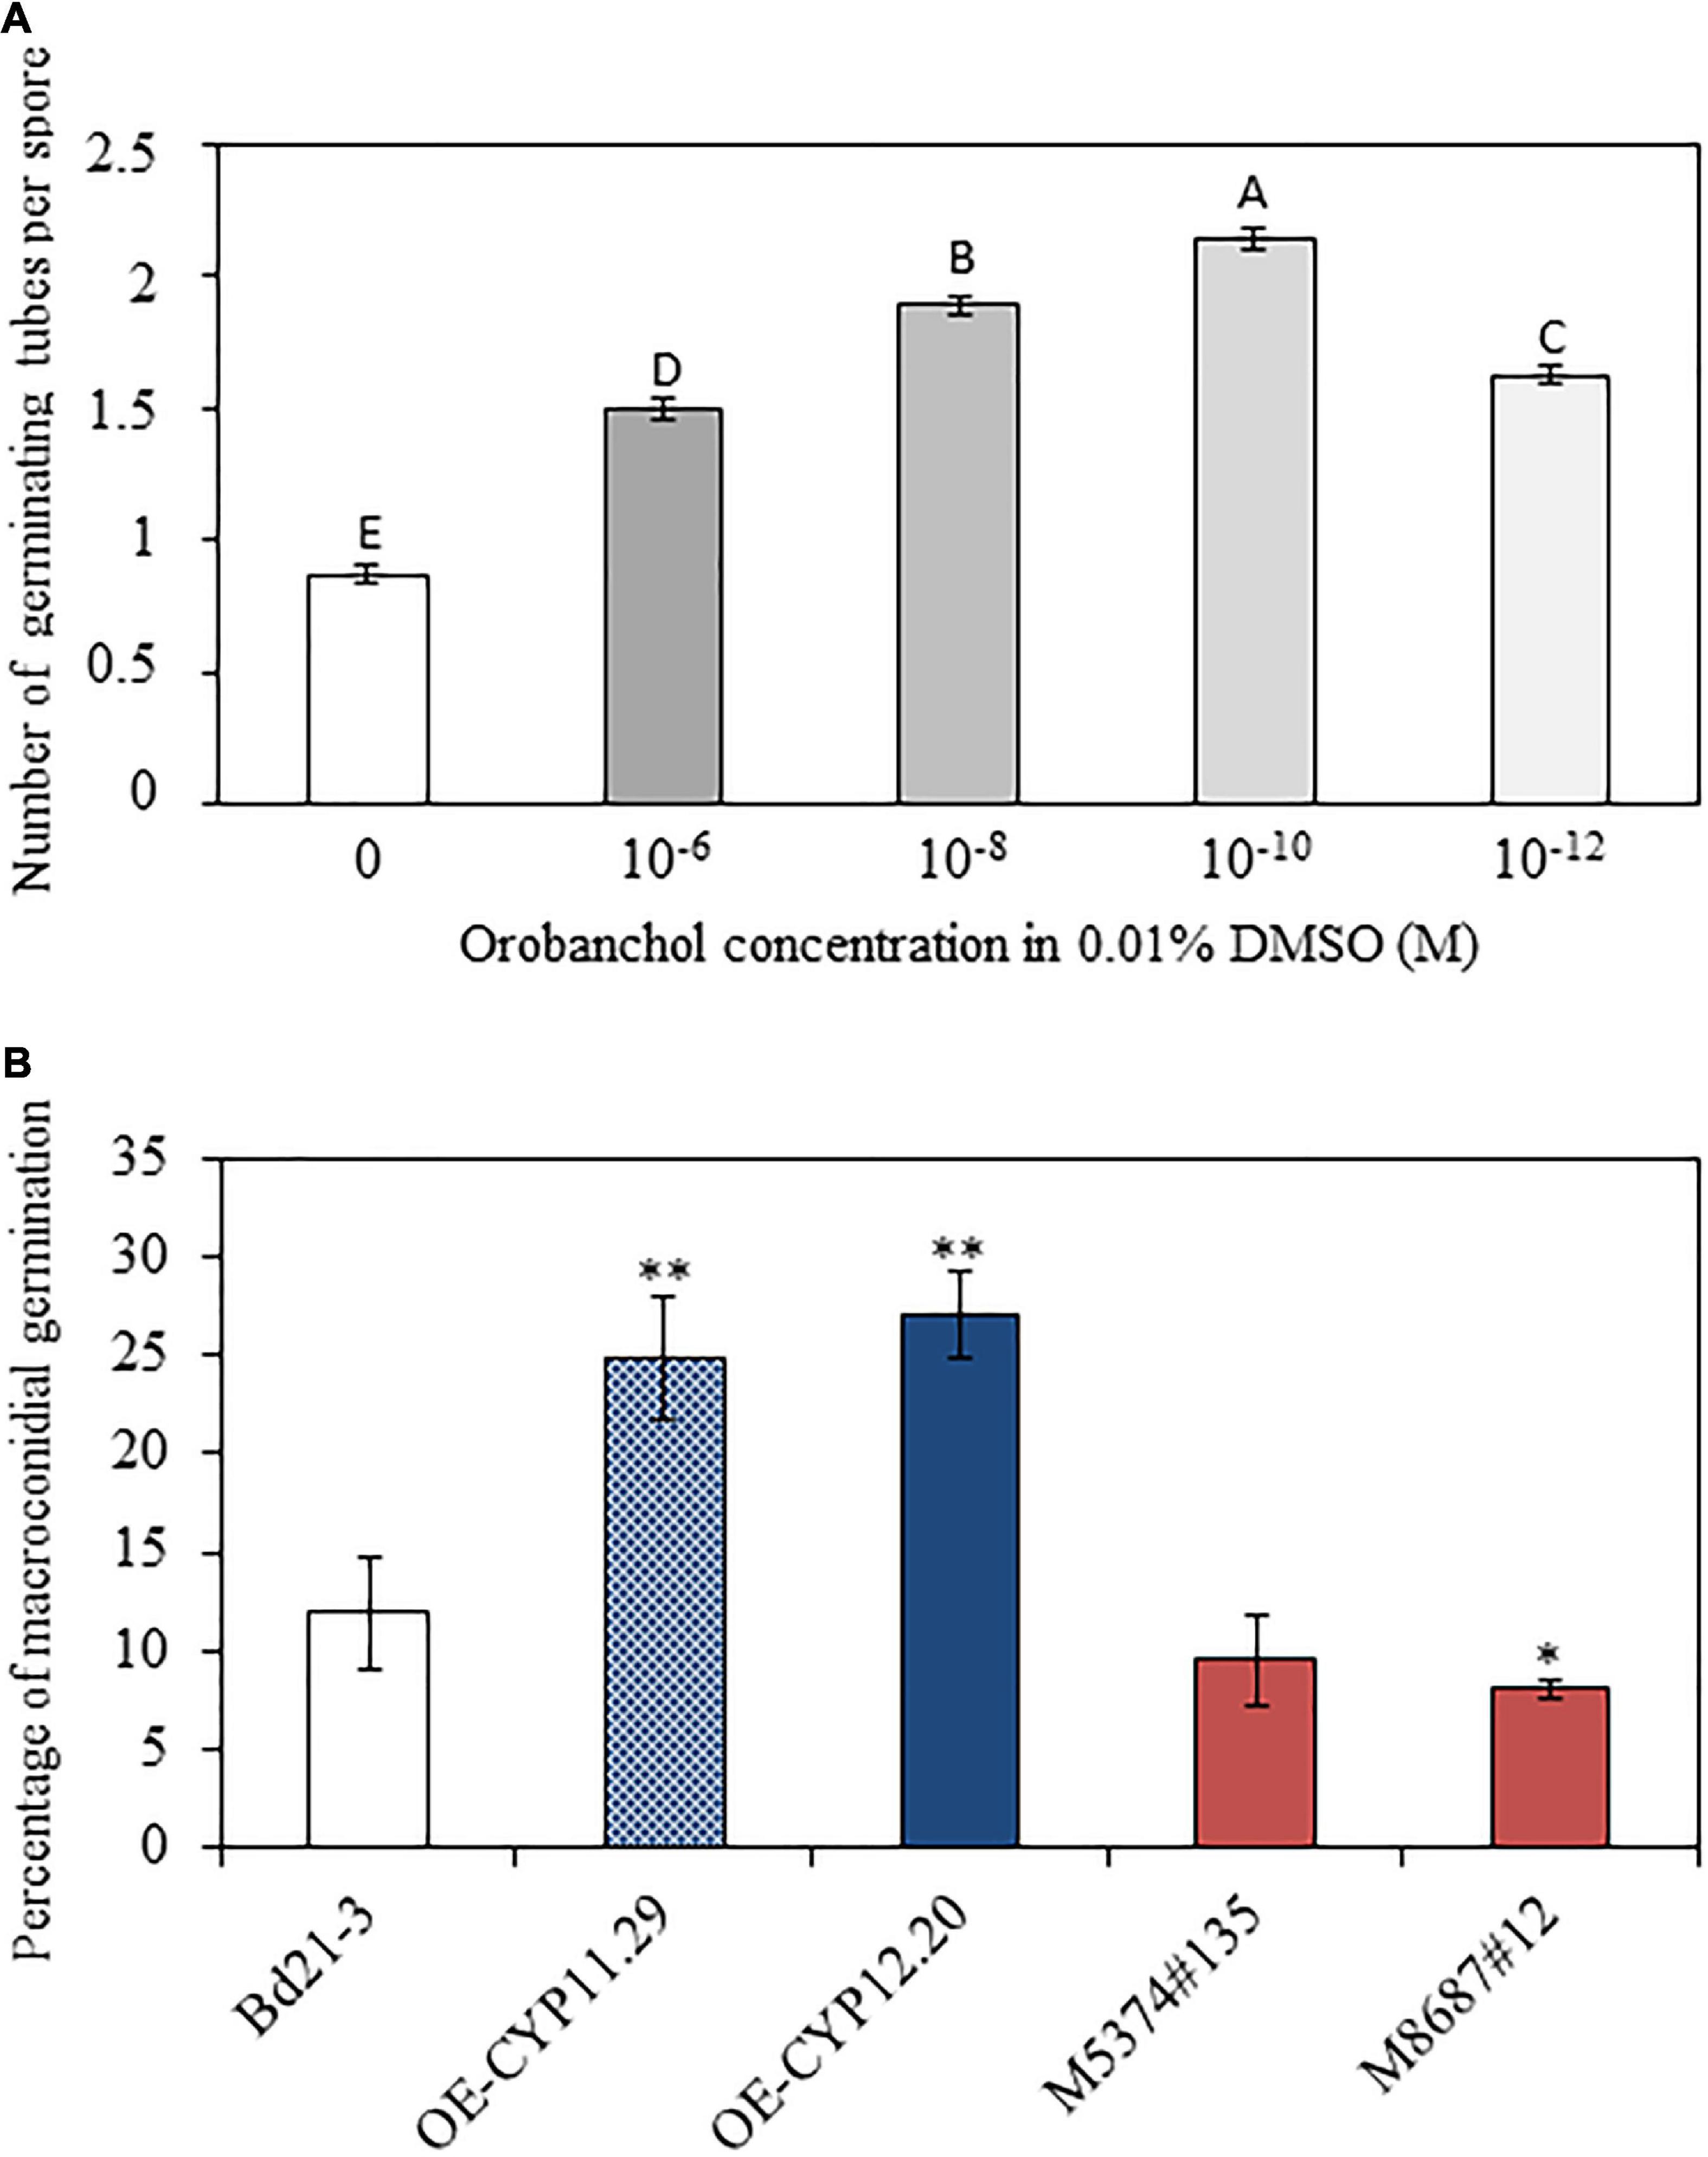
Figure 9. Orobanchol promotes spore germination of F. graminearum. (A) Counting of germinating tubes developed by macroconidia of the F. graminearum FgDON+ strain 12h after incubation on agar medium containing different concentrations of orobanchol. 0.01% DMSO was used as a negative control as it corresponds to the dilution solution of orobanchol. Counts were performed on at least 500 macroconidia per condition and repeated in three biological replicates. Different letters indicate statistically significant differences (p-value < 0.01, Tukey’s test). (B) Percentage of macroconidial germination of the F. graminearum FgDON+ strain 12 h after incubation in exudates of the different B. distachyon lines. Asterisks indicate significant differences compared to the wild-type line Bd21-3 (*p-value < 0.05, **p-value < 0.001, Student’s t-test).
To further establish the relationship between alteration of the BdCYP711A29 gene or of its expression and F. graminearum macroconidial germination, similar experiments were conducted using root exudates of the WT, overexpressing (OE-CYP11.29 and OE-CYP12.20) or mutant (M5374#135 and M8687#12) lines obtained in phosphate-deprived conditions (see section “Materials and Methods” and Figure 9B) in place of pure orobanchol. After 12 h incubation at room temperature, germination percentages were 11.90 ± 2.83% if exudates were obtained from Bd21-3 (WT) roots (Figure 9B). The values were significantly increased if root exudates from the OE-CYP11.29 (24.90 ± 3.20%) or the OE-CYP12.20 (27.15 ± 2.23%) lines were used (Figure 9B). No significant differences were observed with root exudates from the mutant line M5374#135 (9.51 ± 2.30) nevertheless a significant difference (reduction) observed for the mutant line M8687#12 (7.05 ± 0.43) (Figure 9B). These results show that altering the BdCYP711A29 gene sequence or expression modifies the composition of root exudates and consequently their ability to promote F. graminearum macroconidial germination. Together with the data obtained with commercial orobanchol (Figure 9A) and the analysis of SL amounts shown previously (Figure 5), the modification of germination presumably occurs through a modulation of orobanchol content.
Discussion
Fusarium Head Blight is primarily due to the ascomycete fungus F. graminearum and represents one of the most damaging diseases on small-grain cereals in temperate areas (Dweba et al., 2017). It induces yield losses and is a major public health issue due to the production by the fungus of mycotoxins harmful to humans and animals (Chen et al., 2019). Plant–pathogen interactions have been shown to involve phytohormones, the main ones being SA, JA, and ET (Glazebrook, 2005). Numerous studies using transcriptomics and/or metabolomics approaches have correlated SA and JA biosynthesis and signaling with FHB resistance (Li and Yen, 2008; Ding et al., 2011; Gottwald et al., 2012; Makandar et al., 2012; Sun et al., 2016). ET was also mentioned to have contrasted impacts, either neutral (Sun et al., 2016), preventing (Li and Yen, 2008) or promoting fungal infection (Chen et al., 2009). However, only few researches could fully demonstrate the involvement of phytohormones in cereals/F. graminearum interactions through reverse genetics approaches. Functional genetics studies performed using transgenic wheat lines or fungal strains expressing the NahG gene, have shown that the degradation of SA through the NahG salicylate hydroxylase activity increased disease severity (Makandar et al., 2012; Qi et al., 2019). Expression of the A. thaliana NPR1 gene in wheat has further confirmed the involvement of SA signaling in FHB resistance (Makandar et al., 2006). No functional studies are available yet for JA biosynthesis or signaling. Chen et al. (2009) have shown that wheat ein2-silenced lines exhibited increased FHB resistance suggesting that F. graminearum may take advantage of the host ET signaling pathway for infection. In more recent studies, other phytohormones have been correlated either with FHB susceptibility (auxins, ABA) or with resistance (GAs) to FHB (Buhrow et al., 2016; Wang et al., 2018a). Such a picture exemplifies the complexity of hormonal crosstalk during the interaction, as already described in many pathosystems (Pieterse et al., 2009).
Two decades ago, SLs emerged as a new class of phytohormones (Al-Babili and Bouwmeester, 2015). Even more recently, the role of SLs in plant–pathogen interactions using biosynthesis or signaling mutants has been investigated. Mostly conducted in dicotyledonous plant species, these works have concluded on either no impact (Piisilä et al., 2015; Blake et al., 2016; Foo et al., 2016) or a role of SLs in resistance toward pathogenic microorganisms whatever their trophic habit (Torres-vera et al., 2014; Piisilä et al., 2015; Stes et al., 2015; Xu et al., 2019). To our knowledge, a single work on rice has described the impact of impaired SLs biosynthesis on the interaction with a plant pathogen (Lahari et al., 2019). In contrast with the results obtained on the tomato—Meloidogyne incognita interaction concluding on a role of SLs in resistance (Xu et al., 2019), Lahari et al. (2019) have shown that SLs increased rice susceptibility to the root-knot nematode M. graminicola, suggesting that differences may exist between dicots and monocots.
BdCYP711A29 Gene Is Induced by DON and Involved in Orobanchol Biosynthesis
In this work, we have functionally characterized a CYP-encoding gene from B. distachyon, BdCYP711A29 (Bradi1g75310), previously identified as differentially induced in a transcriptomic study of the plant response to F. graminearum-produced DON during infection (Pasquet et al., 2014). Detailed analysis of the deduced amino-acid sequence (Supplementary Figure 1) revealed that the gene encodes the B. distachyon BdCYP711A29 protein of the CYP711A subfamily comprising four additional members in B. distachyon [BdCY711A5, A6, A30, and A31 (Figure 2)]. The BdCYP711A29 protein belongs to the same clade as the A. thaliana MAX1 protein involved in the conversion of CL into CLA (Abe et al., 2014) and as two O. sativa CYP711A proteins (OsCYP711A2 and A3) involved in SL biosynthesis downstream of CL (Cardoso et al., 2014; Zhang et al., 2014, Figure 2). We validated differential induction of BdCYP711A29 expression following infection by a DON-producing F. graminearum strain compared to a mutant strain unable to produce the mycotoxin and also showed that expression was induced following direct application of the mycotoxin (Figure 1). We further showed that the expression of the four other BdCYP711A genes were either not or far less regulated in the same conditions (Supplementary Figure 4). The five members of the oligogenic family were differentially expressed in B. distachyon organs with BdCYP711A5 being more expressed in leaves and spikes, BdCYP711A6 and A29 more expressed in roots and spikes whereas BdCYP711A30 and A31 are almost exclusively expressed in roots (Figure 3). These results suggested that, based on the expression of the five corresponding genes, the proteins may either play redundant roles (BdCYP711A6 and A29 or BdCYP711A30 and A31) or differential ones along the whole plant.
To investigate the role of BdCYP711A29 in SL biosynthesis, B. distachyon lines altered in BdCYP711A29 gene expression or sequence were generated or selected. Two transgenic lines carrying a single T-DNA insertion and overexpressing the gene were generated as well as their corresponding null segregant (Figure 4 and Table 1). Using a TILLING mutant collection available in our laboratory (Dalmais et al., 2013), two mutant lines were selected both carrying mutations predicted to strongly impact the CYP functionality, together with their control lines carrying a WT BdCYP711A29 allele (Table 1 and Supplementary Figure 2 and Table 4). Based on the role of SLs in plant development (Al-Babili and Bouwmeester, 2015), OE and mutant lines were characterized for shoot branching by measuring the tillers number and compared to the WT and their corresponding control lines. No statistically supported difference related to the alteration of the BdCYP711A29 sequence or expression could be observed (Supplementary Figure 5) suggesting that BdCYP711A29 may not play per se a significant role in B. distachyon shoot development. Alternatively, functional redundancy with one of the four other CYP711A copies encoded by the B. distachyon genome could occur considering the expression patterns of the five genes (Figure 3).
Due to their very low amounts in plant tissues, SLs are difficult to quantify in planta. Nevertheless, when plants are grown on phosphate-deprived media, root exudation is stimulated allowing their detection and quantification (López-Ráez et al., 2008). To determine whether BdCYP711A29 is involved in SL biosynthesis, root exudates of the strongest overexpressing line OE-CYP12.20, the mutant line carrying a STOP codon M5374#135 and the WT line were extracted and relative quantification of SLs was performed. A 16-fold increase in orobanchol was observed in the OE line as compared to the WT line (Figure 5). Few studies have deeply investigated the role of MAX1-like proteins in SL biosynthesis and diversification. In rice, as in B. distachyon, five CYP711A proteins are found, all but one (Os1500) being functional (Zhang et al., 2014). Using in vitro co-expression studies, Zhang et al. (2014) have shown that among the four functional rice MAX1-like proteins, Os900 is a CL oxidase, catalyzing the conversion of CL into ent-22-epi-5-deoxystrigol whereas Os1400 catalyzes the conversion of the latter product into orobanchol. The BdCYP711A29 protein groups in the same clade as Os900 and Os1400, together with two other B. distachyon proteins, BdCYP711A30 and BdCYP711A31 (Figure 2). Altogether, our results strongly suggest that the BdCYP711A29 is involved in orobanchol biosynthesis. Additional experiments involving in vitro co-expression studies in yeast or in Nicotiana benthamiana leaves as described in Zhang et al. (2014) will determine the exact step catalyzed by the BdCYP711A29 protein.
Overexpression of BdCYP711A29 Increases Plant Susceptibility Toward FHB
Few CYPs have been shown to be involved in the interaction between cereals and F. graminearum and only two of them have been characterized as strongly associated with resistance to DON. Ito et al. (2013) identified a CYP from the Gram-negative bacterium Sphingomonas sp. able to convert DON into 16-hydroxy-deoxynivalenol. More recently, virus-induced gene silencing of wheat TaCYP72A copies demonstrated their involvement in resistance to DON and grain development (Gunupuru et al., 2018). Among the five B. distachyon CYP711A-encoding genes, BdCYP711A29 is the only one strongly induced in spikes in a DON-dependent manner (Figure 1 and Supplementary Figure 4), suggesting a specific role in FHB. To assess the involvement of BdCYP711A29 in FHB, spikes of the different lines were spray-inoculated by a DON-producing F. graminearum strain and symptoms were scored 7 and 14 days after inoculation. Whereas no difference was observed between the WT ecotype Bd21-3, the null segregant NS-11-26 and the TILLING mutant lines or their corresponding control lines, the two OE lines, OE-CYP11.29 and OE-CYP12.20 were significantly more susceptible to FHB whatever the time-point (Figure 6). These results were confirmed by the quantification of fungal biomass by qPCR (Figure 7).
Strigolactones have been shown to be involved in complex cross-talks with other phytohormones (recently reviewed in Omoarelojie et al., 2019). In particular, tomato SL biosynthesis mutants were shown to have reduced JA content (Torres-vera et al., 2014). However, a more recent study in Arabidopsis has revealed no clear relationship between SLs and JA (Rozpadek et al., 2018). In contrast, in the same study, the authors have provided evidence of a complex crosstalk between SLs and SA: high doses of GR24 (1 μM) strongly induced SA biosynthesis in WT plantlets and max1 mutants exhibited increased SA content (Rozpadek et al., 2018). Nevertheless, reports are not sufficient yet to fully decipher the relationships between SLs and other phytohormones in plant-biotic interactions. In our study, although no SA or JA quantification has been performed in the different lines, we could show that increased susceptibility is unlikely correlated to an alteration of plant defenses. Indeed, no major difference in the induction of defense marker genes frequently used in our team (Pasquet et al., 2014), could be observed (Figure 8). Even if we cannot rule out that some specific defense pathways may be altered in some lines, major changes in plant defense is therefore not the explanation for increased susceptibility of the OE lines.
Orobanchol and Exudates of the BdCYP711A29 Overexpressing Lines Stimulate F. graminearum Macroconidial Germination in vitro
Beyond their role in planta, SLs have been shown to have a direct impact on the development of fungal microorganisms (De Cuyper and Goormachtig, 2017; López-Ráez et al., 2017). In vitro studies using the synthetic analog GR24 provided contrasted results likely due to variation in experimental set ups rather than to species-specific differences. As an example, the impact of GR24 on the growth of the fungal ascomycete B. cinerea has been investigated in several studies but has led to contradictory results (Steinkellner et al., 2007; Dor et al., 2011; Torres-vera et al., 2014; Belmondo et al., 2017). Given the increased exudation of orobanchol by the OE line OE-CYP12.20, we have investigated the impact of a range of physiological concentrations of this SL on F. graminearum. We have shown that orobanchol concentrations from 10–12 to 10–6 M significantly stimulated germination of F. graminearum macroconidia as exemplified by an increased number of germ tubes (Figure 9A, Supplementary Figure 5). Using exudates recovered from phosphate-deprived hydroponic cultures of WT, BdCYP711A29 overexpressing or mutant lines, we have further shown that F. graminearum macroconidial germination was significantly increased in root exudates of the two overexpressing lines (OE-CYP11.29 and OE-CYP12.20) whereas it was reduced in exudates of one of the mutant lines (M8687#12) compared to the WT line Bd21-3 (Figure 9B). Together with the increased orobanchol content found by LC-MS/MS in root exudates of the OE-CYP12.20 line, these results strongly support a role of this SL in the stimulation of germination of F. graminearum macroconidia. Such a role is highly reminiscent of the well-documented role of SLs in the stimulation of spore germination of AMF (García-Garrido et al., 2009). F. graminearum beyond its ability to infect cereal spikes, has been also shown to be a root pathogen (Wang et al., 2015). The impact of plant root exudates and more specifically of orobanchol on the stimulation of spore germination of this soil-borne fungus is therefore biologically relevant. In a recent study, Ding et al. (2020) have set up an experimental design to quantitatively assess F. graminearum root infection using B. distachyon as a model plant. We were however unable to reproduce this experimental set up and future experiments are needed to better correlate increased orobanchol in root exudates with F. graminearum aggressiveness on plant roots.
Considering spike infection, SL quantification in spikes of the different B distachyon lines has not been performed in this study due to the very low concentrations of SLs in planta. Nevertheless, the expression pattern of BdCYP711A29 indicates both a higher basal expression in spikes as well as a strong induction of expression in the same organ at early steps of F. graminearum infection in a DON-dependent manner (Figures 1, 3). These results are therefore consistent with an involvement of this gene in the plant response during infection, likely through increasing orobanchol contents.
Altogether, the results obtained in this study strongly suggest that during the early steps F. graminearum infection the expression of the B. distachyon BdCYP711A29 gene is induced which increases orobanchol production in its targeted organ. As a stimulant of spore germination, orobanchol may consequently promote infection and FHB development.
Data Availability Statement
The original contributions presented in the study are included in the article/Supplementary Material, further inquiries can be directed to the corresponding author/s.
Author Contributions
VC, SB-M, GM, and MDu conceived and designed the experiments. KM, MDa, and AB conducted the selection of TLLING mutants. VC, CM, SB-M, KM, GM, and MD conducted the experiments and analyses. VC and MD drafted the manuscript. All authors have read and approved the final version of the manuscript.
Funding
VC’s Ph.D. was funded by the French Ministry of Higher Education, Research and Innovation. The Institute of Plant Sciences Paris-Saclay and the Institut Jean-Pierre Bourgin benefit from the support of Saclay Plant Sciences (SPS; ANR-17-EUR-0007). The funder had no role in study design, data collection and analysis, decision to publish, or preparation of the manuscript.
Conflict of Interest
The authors declare that the research was conducted in the absence of any commercial or financial relationships that could be construed as a potential conflict of interest.
Acknowledgments
We thank François-Didier Boyer (IJPB, Versailles, France) for providing GR24. This work has benefited from the support of IJPB’s Plant Observatory technological platforms. We thank Pascal Ratet for critical reading of the manuscript.
Supplementary Material
The Supplementary Material for this article can be found online at: https://www.frontiersin.org/articles/10.3389/fpls.2021.662025/full#supplementary-material
Supplementary Figure 1 | Nucleotide and deduced amino-acid sequence of the BdCYP711A29 (Bradi1g75310) gene. The nucleotide sequence starts from the first line and the deduced protein sequence is indicated on the above line. Start and Stop codons as well as the initial methionine residue are indicated in bold. Introns are shaded in gray. The nucleotide sequences of primers used to amplify the region subjected to the TILLING screen are underlined. Amino-acid residues corresponding to the PERF signature and to the heme-binding domain are shown by blue and red letters, respectively.
Supplementary Figure 2 | Schematic representation of the BdCYP711A29 protein (after Bak et al., 2011) and location of the mutations in TILLING families 8687 and 5374 (black arrows). The amplicon used for the selection of mutations in the B. distachyon TILLING mutant collection is indicated by a black bar.
Supplementary Figure 3 | (A) Daughter profil of [M+H]+ 347 : orobanchol standard. (B) Chromatogram of MRM transitions in a typical sample and in the orobanchol standard.
Supplementary Figure 4 | Expression pattern of the 5 BdCYP711A genes during FHB and following DON treatment. Relative quantification of BdCYP711A5 (Bradi3g08360), BdCYP711A6 (Bradi1g37730), BdCYP711A30 (Bradi4g08970) and BdCYP711A31 (Bradi4g09040) transcripts in the Bd21-3 (WT) ecotype of B. distachyon following DON treatment (A) or F. graminearum infection (B). Timepoints are expressed in hours post-application (hpa, DON treatment) hours post-infection (hpi, F. graminearum infection). (A) Expression levels following DON treatment compared to mock treatment. (B) Expression levels following point infection with the FgDON+ strain of F. graminearum compared to mock treatment. The relative quantity of transcripts compared to mock condition was calculated using the comparative cycle threshold (Ct) method (2–ΔΔCt). The B. distachyon UBC18 and ACT7 genes (Bradi4g00660 and Bradi4g41850) were used as endogenous controls to normalize the data for differences in input RNA between the different samples. Mean of three independent biological replicates ± standard deviation. Asterisks indicate significant differences with the “0” timepoint in each condition and for each gene (*p value < 0.05, Student’s t test).
Supplementary Figure 5 | Number of tillers developed by the different B. distachyon lines after 4 weeks growth under normal growth conditions (see section “Materials and Methods”). Mean numbers out of three biological replicates ± standard deviation. Different letters indicate significant differences between conditions (p-value < 0.01, Tukey’s test).
Supplementary Figure 6 | Characteristic germination patterns of macroconidia of the F. graminearum FgDON+ exposed at different orobanchol concentrations. (A) Control condition (0.01% DMSO), (B) 10–6 M orobanchol in 0.01% DMSO, (C) 10–8 M orobanchol in 0.01% DMSO, (D) 10–10 M orobanchol in 0.01% DMSO, (E) 10–12 M orobanchol in 0.01% DMSO. m: macroconidium, gt: germ tube. Bars: 100 μm.
Supplementary Table 1 | List of BdCYP711A29-specific primers used for the construction of overexpressing lines and the selection of TILLING mutant lines.
Supplementary Table 2 | List of primers used in qPCR experiments.
Supplementary Table 3 | List of characteristic parent and product ions detected during multiple reaction monitoring (MRM) in B. distachyon (Bd21-3) exudates.
Supplementary Table 4 | Pairwise distances matrix of of CYP711As from B. distachyon, H. vulgare, O. sativa, A. thaliana and S. moellendorffii. At: A. thaliana; Bd: B. distachyon; Hv: Hordeum vulgare; Os: O. sativa; Sm: S. moellendorffii. Protein sequences used in this analysis are available under the following accession numbers: AtCYP711A1, OAP07831.1; BdCYP711A5, XP_003571126.1; BdCYP711A6: XP_003560652.1; BdCYP711A29, XP_003562092.2; BdCYP711A30: XP_003575594.2; BdCYP711A31, XP_010237353.2; HvCYP711A5, BAJ97619.1; HvCYP711A6, KAE87888859.1; HVCYP711A29, BAJ98237.1; HvCYP711A30, KAE8810993.1; OsCYP711A2, XP_015633367.1; OsCYP711A3, XP_015644699.2; OsCYP711A4, XP_015642272.1; OsCYP711A5, XP_015626073.1; OsCYP711A6, XP_015644019.1; SmCYP711A1, XP_002972055.1. The protein mainly studied in this study is highlighted in orange, the protein sequence used as the outgroup uq highlighted in grey.
Supplementary Table 5 | Characteristics of the mutant families identified in the BdCYP711A29 gene following screening of the Bd21-3 TILLING collection (Dalmais et al., 2013).
Supplementary Table 6 | Raw data and calculation of relative quantity of oranbanchol in exudates of WT (Bd21-3), overexpressing (OE-CYP12.20) and mutant (M5374#135) lines after 7 d phosphorus starvation. AUC: Area under the curve. MRM transitions 321 > 224 and 347 > 97 were used to quantify GR24 and orobanchol signals, respectively.
Footnotes
References
Abe, S., Sado, A., Tanaka, K., Kisugi, T., Asami, K., Ota, S., et al. (2014). Carlactone is converted to carlactonoic acid by MAX1 in Arabidopsis and its methyl ester can directly interact with AtD14 in vitro. Proc. Natl. Acad. Sci. U S A. 111, 18084–18089. doi: 10.1073/pnas.1410801111
Akamatsu, A., Shimamoto, K., and Kawano, Y. (2016). Crosstalk of signaling mechanisms involved in host defense and symbiosis against microorganisms in rice. Curr. Genom. 17, 297–307. doi: 10.2174/1389202917666160331201602
Akiyama, K., Matsuzaki, K. I., and Hayashi, H. (2005). Plant sesquiterpenes induce hyphal branching in arbuscular mycorrhizal fungi. Nature 435, 824–827. doi: 10.1038/nature03608
Al-Babili, S., and Bouwmeester, H. J. (2015). Strigolactones, a novel carotenoid-derived plant hormone. Annu. Rev. Plant Biol. 66, 161–186. doi: 10.1146/annurev-arplant-043014-114759
Ali, S. S., Kumar, G. B. S., Khan, M., and Doohan, F. M. (2013). Brassinosteroid enhances resistance to Fusarium diseases of barley. Phytopathology 103, 1260–1267. doi: 10.1094/phyto-05-13-0111-r
Alves, S. C., Worland, B., Thole, V., Snape, J. W., Bevan, M. W., and Vain, P. (2009). A protocol for agrobacterium-mediated transformation of brachypodium distachyon community standard line Bd21. Nat. Protoc. 4, 638–649. doi: 10.1038/nprot.2009.30
Bak, S., Beisson, G., Hamberger, B., Höfer, R., Paquette, S., and Weirck-Reichhart, D. (2011). Cytochromes P450. Arab B 9:e0144.
Belmondo, S., Marschall, R., Tudzynski, P., López Ráez, J. A., Artuso, E., Prandi, C., et al. (2017). Identification of genes involved in fungal responses to strigolactones using mutants from fungal pathogens. Curr. Genet. 63, 201–213. doi: 10.1007/s00294-016-0626-y
Blake, S. N., Barry, K. M., Gill, W. M., Reid, J. B., and Foo, E. (2016). The role of strigolactones and ethylene in disease caused by pythium irregulare. Mol. Plant Pathol. 17, 680–690. doi: 10.1111/mpp.12320
Bollina, V., Kumaraswamy, G. K., Kushalappa, A. C., Choo, T. M., Dion, Y., Rioux, S., et al. (2010). Mass spectrometry-based metabolomics application to identify quantitative resistance-related metabolites in barley against Fusarium head blight. Mol. Plant Pathol. 11, 769–782.
Bollina, V., Kushalappa, A. C., Choo, T. M., Dion, Y., and Rioux, S. (2011). Identification of metabolites related to mechanisms of resistance in barley against Fusarium graminearum, based on mass spectrometry. Plant Mol. Biol. 77, 355–370. doi: 10.1007/s11103-011-9815-8
Booker, J., Sieberer, T., Wright, W., Williamson, L., Willett, B., Stirnberg, P., et al. (2005). MAX1 encodes a cytochrome P450 family member that acts downstream of MAX3/4 to produce a carotenoid-derived branch-inhibiting hormone. Dev. Cell 8, 443–449. doi: 10.1016/j.devcel.2005.01.009
Boutet-Mercey, S., Perreau, F., Roux, A., Clavé, G., Pillot, J.-P., Schmitz-Afonso, I., et al. (2017). Validated method for strigolactone quantification by ultra high-performance liquid chromatography - electrospray ionisation tandem mass spectrometry using novel deuterium labelled standards. Phytochem. Anal. 29, 59–68. doi: 10.1002/pca.2714
Brown, N. A., Urban, M., van de Meene, A. M. L., and Hammond-Kosack, K. E. (2010). The infection biology of Fusarium graminearum: defining the pathways of spikelet to spikelet colonisation in wheat ears. Fungal. Biol. 114, 555–571. doi: 10.1016/j.funbio.2010.04.006
Buhrow, L. M., Cram, D., Tulpan, D., Foroud, N. A., and Loewen, M. C. (2016). Exogenous abscisic acid and gibberellic acid elicit opposing effects on Fusarium graminearum infection in wheat. Phytopathology 106, 986–996.
Cardoso, C., Zhang, Y., Jamil, M., Hepworth, J., Charnikhova, T., Dimkpa, S. O. N., et al. (2014). Natural variation of rice strigolactone biosynthesis is associated with the deletion of two MAX1 orthologs. Proc. Natl. Acad. Sci. U S A. 111, 2379–2384. doi: 10.1073/pnas.1317360111
Cass, C. L., Peraldi, A., Dowd, P. F., Mottiar, Y., Santoro, N., Karlen, S. D., et al. (2015). Effects of phenylalanine ammonia lyase (pal) knockdown on cell wall composition, biomass digestibility, and biotic and abiotic stress responses in Brachypodium. J. Exp. Bot. 66, 4317–4335. doi: 10.1093/jxb/erv269
Challis, R. J., Hepworth, J., Mouchel, C., Waites, R., and Leyser, O. (2013). A Role for more axillary growth1 (MAX1) in evolutionary diversity in strigolactone signaling upstream of MAX2. Plant Physiol. 161, 1885–1902. doi: 10.1104/pp.112.211383
Chen, G., Yan, W., Liu, Y., Wei, Y., Zhou, M., Zheng, Y., et al. (2014). The non-gibberellic acid-responsive semi-dwarfing gene uzu affects Fusarium crown rot resistance in barley. BMC Plant Biol. 14:22. doi: 10.1186/1471-2229-14-22
Chen, X., Steed, A., Travella, S., Keller, B., and Nicholson, P. (2009). Fusarium graminearum exploits ethylene signalling to colonize dicotyledonous and monocotyledonous plants. New Phytol. 182, 975–983. doi: 10.1111/j.1469-8137.2009.02821.x
Chen, Y., Kistler, H. C., and Ma, Z. (2019). Fusarium graminearum trichothecene mycotoxins: biosynthesis, regulation, and management. Annu. Rev. Phytopathol. 57, 15–39.
Comby, M., Gacoin, M., Robineau, M., Rabenoelina, F., Ptas, S., Dupont, J., et al. (2017). Screening of wheat endophytes as biological control agents against Fusarium head blight using two different in vitro tests. Microbiol. Res. 202, 11–20. doi: 10.1016/j.micres.2017.04.014
Cook, C. E., Whichard, L. P., Turner, B., Wall, M. E., and Egley, G. H. (1966). Germination of witchweed (Striga lutea Lour.): isolation and Properties of a Potent Stimulant. Science 154, 1189–1190. doi: 10.1126/science.154.3753.1189
Cuzick, A., Urban, M., and Hammond-Kosack, K. (2008). Fusarium graminearum gene deletion mutants map1 and tri5 reveal similarities and differences in the pathogenicity requirements to cause disease on Arabidopsis and wheat floral tissue. New Phytol. 177, 990–1000. doi: 10.1111/j.1469-8137.2007.02333.x
Czarnecki, O., Yang, J., Wang, X., Wang, S., Muchero, W., Tuskan, G. A., et al. (2014). Characterization of more axillary growth genes in populus. PLoS One 9:e102757. doi: 10.1371/journal.pone.0102757
Dalmais, M., Antelme, S., Ho-Yue-Kuang, S., Wang, Y., Darracq, O., d’Yvoire, M. B., et al. (2013). A TILLING platform for functional genomics in Brachypodium distachyon. PLoS One 8:e65503. doi: 10.1371/journal.pone.0065503
De Cuyper, C., and Goormachtig, S. (2017). Strigolactones in the rhizosphere: friend or foe? Mol. Plant-Microbe Interact 30, 683–690. doi: 10.1094/mpmi-02-17-0051-cr
de Saint Germain, A., Bonhomme, S., Boyer, F. D., and Rameau, C. (2013). Novel insights into strigolactone distribution and signalling. Curr. Opin. Plant Biol. 16, 583–589. doi: 10.1016/j.pbi.2013.06.007
Decker, E. L., Alder, A., Hunn, S., Ferguson, J., Lehtonen, M. T., Scheler, B., et al. (2017). Strigolactone biosynthesis is evolutionarily conserved, regulated by phosphate starvation and contributes to resistance against phytopathogenic fungi in a moss. physcomitrella patens. New Phytol. 216, 455–468. doi: 10.1111/nph.14506
Ding, L., Xu, H., Yi, H., Yang, L., Kong, Z., Zhang, L., et al. (2011). Resistance to hemi-biotrophic F. graminearum infection is associated with coordinated and ordered expression of diverse defense signaling pathways. PLoS One 6:e19008. doi: 10.1371/journal.pone.0019008
Ding, Y., Gardiner, D. M., Xiao, D., and Kazan, K. (2020). Regulators of nitric oxide signaling triggered by host perception in a plant pathogen. Proc. Natl. Acad. Sci. U S A. 117, 11147–11157. doi: 10.1073/pnas.1918977117
Dor, E., Joel, D. M., Kapulnik, Y., Koltai, H., and Hershenhorn, J. (2011). The synthetic strigolactone GR24 influences the growth pattern of phytopathogenic fungi. Planta 234, 419–427. doi: 10.1007/s00425-011-1452-6
Drummond, R. S. M., Sheehan, H., Simons, J. L., Martínez-Sánchez, N. M., Turner, R. M., Putterill, J., et al. (2012). The expression of petunia strigolactone pathway genes is altered as part of the endogenous developmental program. Front. Plant Sci. 2:115. doi: 10.3389/fpls.2011.00115
Duba, A., Goriewa-Duba, K., and Wachowska, U. (2018). A review of the interactions between wheat and wheat pathogens: Zymoseptoria tritici, Fusarium spp. and Parastagonospora nodorum. Int. J. Mol. Sci. 19, 1–21. doi: 10.1007/978-3-319-23534-9_1
Dweba, C. C., Figlan, S., Shimelis, H. A., Motaung, T. E., Sydenham, S., Mwadzingeni, L., et al. (2017). Fusarium head blight of wheat: pathogenesis and control strategies. Crop. Prot. 91, 114–122. doi: 10.1016/j.cropro.2016.10.002
Felsenstein, J. (1985). Confidence limits on phylogenies: an approach using the bootstrap. Evolution (N Y) 39:783. doi: 10.2307/2408678
Figueroa, M., Hammond-Kosack, K. E., and Solomon, P. S. (2017). A review of wheat diseases-a field perspective. Mol. Plant Pathol. 19, 1523–1536. doi: 10.1111/mpp.12618
Foo, E., Blake, S. N., Fisher, B. J., Smith, J. A., and Reid, J. B. (2016). The role of strigolactones during plant interactions with the pathogenic fungus Fusarium oxysporum. Planta 243, 1387–1396. doi: 10.1007/s00425-015-2449-3
García-Garrido, J. M., Lendzemo, V., Castellanos-Morales, V., Steinkellner, S., and Vierheilig, H. (2009). Strigolactones, signals for parasitic plants and arbuscular Mycorrhizal fungi. Mycorrhiza 19, 449–459. doi: 10.1007/s00572-009-0265-y
Gauthier, L., Atanasova-Penichon, V., Chéreau, S., and Richard-Forget, F. (2015). Metabolomics to decipher the chemical defense of cereals against Fusarium graminearum and deoxynivalenol accumulation. Int. J. Mol. Sci. 16, 24839–24872. doi: 10.3390/ijms161024839
Glazebrook, J. (2005). Contrasting mechanisms of defense against biotrophic and necrotrophic pathogens. Annu. Rev. Phytopathol. 43, 205–227. doi: 10.1146/annurev.phyto.43.040204.135923
Goddard, R., Peraldi, A., Ridout, C., and Nicholson, P. (2014). Enhanced disease resistance caused by BRI1 mutation is conserved between brachypodium distachyon and barley (Hordeum vulgare). Mol. Plant Microbe Interact. 27, 1095–1106. doi: 10.1094/mpmi-03-14-0069-r
Gomez-Roldan, V., Fermas, S., Brewer, P. B., Puech-Pagès, V., Dun, E. A., Pillot, J. P., et al. (2008). Strigolactone inhibition of shoot branching. Nature 455, 189–194.
Goswami, R. S., and Kistler, H. C. (2004). Heading for disaster: Fusarium graminearum on cereal crops. Mol. Plant Pathol. 5, 515–525. doi: 10.1111/j.1364-3703.2004.00252.x
Gottwald, S., Samans, B., Lück, S., and Friedt, W. (2012). Jasmonate and ethylene dependent defence gene expression and suppression of fungal virulence factors: two essential mechanisms of Fusarium head blight resistance in wheat? BMC Genom. 13:369. doi: 10.1186/1471-2164-13-369
Gunnaiah, R., and Kushalappa, A. C. (2014). Metabolomics deciphers the host resistance mechanisms in wheat cultivar Sumai-3, against trichothecene producing and non-producing isolates of Fusarium graminearum. Plant Physiol. Biochem. 83, 40–50. doi: 10.1016/j.plaphy.2014.07.002
Gunnaiah, R., Kushalappa, A. C., Duggavathi, R., Fox, S., and Somers, D. J. (2012). Integrated metabolo-proteomic approach to decipher the mechanisms by which wheat qtl (Fhb1) contributes to resistance against Fusarium graminearum. PLoS One 7:e40695. doi: 10.1371/journal.pone.0040695
Gunupuru, L. R., Arunachalam, C., Malla, K. B., Kahla, A., Perochon, A., Jia, J., et al. (2018). A wheat cytochrome P450 enhances both resistance to deoxynivalenol and grain yield. PLoS One 13:e0204992. doi: 10.1371/journal.pone.0204992
He, F., Zhang, R., Zhao, J., Qi, T., Kang, Z., and Guo, J. (2019). Host-Induced silencing of Fusarium graminearum genes enhances the resistance of brachypodium distachyon to Fusarium head blight. Front. Plant Sci. 10:1362. doi: 10.3389/fpls.2019.01362
Himmelbach, A., Zierold, U., Hensel, G., Riechen, J., Douchkov, D., Schweizer, P., et al. (2007). A set of modular binary vectors for transformation of cereals. Plant Physiol. 145, 1192–1200. doi: 10.1104/pp.107.111575
Hong, S.-Y., Seo, P., Yang, M.-S., Xiang, F., and Park, C.-M. (2008). Exploring valid reference genes for gene expression studies in Brachypodium distachyon by real-time PCR. BMC Plant Biol. 8:112. doi: 10.1186/1471-2229-8-112
Ito, M., Sato, I., Ishizaka, M., Yoshida, S. I., Koitabashi, M., Yoshida, S., et al. (2013). Bacterial cytochrome P450 System catabolizing the Fusarium toxin deoxynivalenol. Appl. Environ. Microbiol. 79, 1619–1628. doi: 10.1128/aem.03227-12
Johnson, A. W., Gowda, G., Hassanali, A., Knox, J., Monaco, S., Razawi, Z., et al. (1981). The preparation of synthetic analogues of strigol. J. Chem. Soc. Perkin Trans. 1, 1734–1743. doi: 10.1039/p19810001734
Jones, D. T., Taylor, W. R., and Thornton, J. M. (1992). The rapid generation of mutation data matricies from protein sequences. Comput. Appl. Biosci. 8, 275–282. doi: 10.1093/bioinformatics/8.3.275
Kage, U., Karre, S., Kushalappa, A. C., and McCartney, C. (2017). Identification and characterization of a Fusarium head blight resistance gene TaACT in wheat QTL-2DL. Plant Biotechnol. J. 15, 447–457. doi: 10.1111/pbi.12641
Kakei, Y., Mochida, K., Sakurai, T., Yoshida, T., Shinozaki, K., and Shimada, Y. (2015). Transcriptome analysis of hormone-induced gene expression in Brachypodium distachyon. Sci. Rep. 5:14476.
Karre, S., Kumar, A., Dhokane, D., and Kushalappa, A. C. (2017). Metabolo-transcriptome profiling of barley reveals induction of chitin elicitor receptor kinase gene (HvCERK1) conferring resistance against Fusarium graminearum. Plant Mol. Biol. 93, 247–267. doi: 10.1007/s11103-016-0559-3
Kazan, K. (2013). Auxin and the integration of environmental signals into plant root development. Ann. Bot. 112, 1655–1665. doi: 10.1093/aob/mct229
Kazan, K., and Gardiner, D. M. (2017). Transcriptomics of cereal- Fusarium graminearum interactions: what we have learned so far. Mol. Plant Pathol. 19, 764–778. doi: 10.1111/mpp.12561
Kobae, Y., Kameoka, H., Sugimura, Y., Saito, K., Ohtomo, R., Fujiwara, T., et al. (2018). Strigolactone biosynthesis genes of rice are required for the punctual entry of arbuscular mycorrhizal fungi into the roots. Plant Cell Physiol. 59, 544–553. doi: 10.1093/pcp/pcy001
Kouzai, Y., Kimura, M., Yamanaka, Y., Watanabe, M., Matsui, H., Yamamoto, M., et al. (2016). Expression profiling of marker genes responsive to the defence-associated phytohormones salicylic acid, jasmonic acid and ethylene in Brachypodium distachyon. BMC Plant Biol. 16:59. doi: 10.1186/s12870-016-0749-9
Kumar, P., Henikoff, S., and Ng, P. C. (2009). Predicting the effects of coding non-synonymous variants on protein function using the SIFT algorithm. Nat. Protoc. 4, 1073–1082. doi: 10.1038/nprot.2009.86
Kumar, S., Stecher, G., Li, M., Knyaz, C., and Tamura, K. (2018). MEGA X: molecular evolutionary genetics analysis across computing platforms. Mol. Biol. Evol. 35, 1547–1549. doi: 10.1093/molbev/msy096
Kumaraswamy, K. G., Kushalappa, A. C., Choo, T. M., Dion, Y., and Rioux, S. (2011). Mass spectrometry based metabolomics to identify potential biomarkers for resistance in barley against Fusarium head blight (Fusarium graminearum). J. Chem. Ecol. 37, 846–856. doi: 10.1007/s10886-011-9989-1
Kushalappa, A. C., and Gunnaiah, R. (2013). Metabolo-proteomics to discover plant biotic stress resistance genes. Trends Plant Sci. 18, 522–531. doi: 10.1016/j.tplants.2013.05.002
Lahari, Z., Ullah, C., Kyndt, T., Gershenzon, J., and Gheysen, G. (2019). Strigolactones enhance root-knot nematode (Meloidogyne graminicola) infection in rice by antagonizing the jasmonate pathway. New Phytol. 224, 454–465. doi: 10.1111/nph.15953
Legrand, F., Picot, A., Cobo-Díaz, J. F., Chen, W., and Le Floch, G. (2017). Challenges facing the biological control strategies for the management of Fusarium head blight of cereals caused by F. graminearum. Biol. Control 113, 26–38. doi: 10.1016/j.biocontrol.2017.06.011
Li, G., and Yen, Y. (2008). Jasmonate and ethylene signaling pathway may mediate Fusarium head blight resistance in wheat. Crop Sci. 48, 1888–1896. doi: 10.2135/cropsci2008.02.0097
Lopez-Obando, M., Ligerot, Y., Bonhomme, S., Boyer, F.-D., and Rameau, C. (2015). Strigolactone biosynthesis and signaling in plant development. Development 142, 3615–3619. doi: 10.1242/dev.120006
López-Ráez, J. A., Charnikhova, T., Gómez-Roldán, V., Matusova, R., Kohlen, W., De Vos, R., et al. (2008). Tomato strigolactones are derived from carotenoids and their biosynthesis is promoted by phosphate starvation. New Phytol. 178, 863–874. doi: 10.1111/j.1469-8137.2008.02406.x
López-Ráez, J. A., Shirasu, K., and Foo, E. (2017). Strigolactones in plant interactions with beneficial and detrimental organisms: the yin and yang. Trends Plant Sci. 22, 527–537. doi: 10.1016/j.tplants.2017.03.011
Machado, A. K., Brown, N. A., Urban, M., Kanyuka, K., and Hammond-Kosack, K. E. (2017). RNAi as an emerging approach to control Fusarium head blight disease and mycotoxin contamination in cereals. Pest Manag. Sci. 74, 790–799. doi: 10.1002/ps.4748
Makandar, R., Essig, J. S., Schapaugh, M. A., Trick, H. N., and Shah, J. (2006). Genetically engineered resistance to Fusarium head blight in wheat by expression of Arabidopsis NPR1. Mol. Plant-Microbe Interact 19, 123–129. doi: 10.1094/mpmi-19-0123
Makandar, R., Nalam, V., Chaturvedi, R., Jeannotte, R., Sparks, A. A., and Shah, J. (2010). Involvement of salicylate and jasmonate signaling pathways in Arabidopsis interaction with Fusarium graminearum. Mol. Plant Microbe Interact 23, 861–870. doi: 10.1094/mpmi-23-7-0861
Makandar, R., Nalam, V. J., Lee, H., Trick, H. N., Dong, Y., and Shah, J. (2012). Salicylic acid regulates basal resistance to Fusarium head blight in wheat. Mol. Plant-Microbe Interact 25, 431–439. doi: 10.1094/mpmi-09-11-0232
Qi, P. F., Zhang, Y. Z., Liu, C. H., Chen, Q., Guo, Z. R., Wang, Y., et al. (2019). Functional analysis of FgNahG clarifies the contribution of salicylic acid to wheat (Triticum aestivum) resistance against Fusarium head blight. Toxins (Basel) 11:59. doi: 10.3390/toxins11020059
Marzec, M. (2016). Perception and signaling of strigolactones. Front. Plant Sci. 7:1260. doi: 10.3389/fpls.2016.01260
McCormick, S. P., Stanley, A. M., Stover, N. A., and Alexander, N. J. (2011). Trichothecenes: from simple to complex mycotoxins. Toxins (Basel) 3, 802–814. doi: 10.3390/toxins3070802
Moghe, G. D., and Kruse, L. H. (2018). The study of plant specialized metabolism: challenges and prospects in the genomics era. Am. J. Bot. 105, 959–962. doi: 10.1002/ajb2.1101
Mudge, A. M., Dill-Macky, R., Dong, Y., Gardiner, D. M., White, R. G., and Manners, J. M. (2006). A role for the mycotoxin deoxynivalenol in stem colonisation during crown rot disease of wheat caused by Fusarium graminearum and Fusarium pseudograminearum. Physiol. Mol. Plant Pathol. 69, 73–85. doi: 10.1016/j.pmpp.2007.01.003
Murashige, T., and Skoog, F. (1962). A revised medium for rapid growth and bio assays with tobacco tissue cultures. Physiol. Plant. 15, 473–497. doi: 10.1111/j.1399-3054.1962.tb08052.x
Omoarelojie, L. O., Kulkarni, M. G., Finnie, J. F., Staden, J., and Van, and Here, S. (2019). Strigolactones and their crosstalk with other phytohormones. Ann. Bot. 124, 749–767. doi: 10.1093/aob/mcz100
Pasquet, J.-C., Changenet, V., Macadré, C., Boex-Fontvieille, E., Soulhat, C., Bouchabké-Coussa, O., et al. (2016). A Brachypodium UDP-glycosytransferase confers root tolerance to deoxynivalenol and resistance to Fusarium infection. Plant Physiol. 172, 559–574. doi: 10.1104/pp.16.00371
Pasquet, J.-C., Chaouch, S., Macadré, C., Balzergue, S., Huguet, S., Martin-Magniette, M.-L., et al. (2014). Differential gene expression and metabolomic analyses of Brachypodium distachyon infected by deoxynivalenol producing and non-producing strains of Fusarium graminearum. BMC Genomics 15:629. doi: 10.1186/1471-2164-15-629
Pieterse, C. M. J., Leon-Reyes, A., Van Der Ent, S., and Van Wees, S. C. M. (2009). Networking by small-molecule hormones in plant immunity. Nat. Chem. Biol. 5, 308–316. doi: 10.1038/nchembio.164
Piisilä, M., Keceli, M. A., Brader, G., Jakobson, L., Jõesaar, I., Sipari, N., et al. (2015). The F-box protein MAX2 contributes to resistance to bacterial phytopathogens in Arabidopsis thaliana. BMC Plant Biol. 15:53. doi: 10.1186/s12870-015-0434-4
Pozo, M. J., López-Ráez, J. A., Azcón-Aguilar, C., and García-Garrido, J. M. (2015). Phytohormones as integrators of environmental signals in the regulation of mycorrhizal symbioses. New Phytol. 205, 1431–1436. doi: 10.1111/nph.13252
Ravazzolo, L., Trevisan, S., Manoli, A., Boutet-Mercey, S., Perreau, F., and Quaggiotti, S. (2019). The control of zealactone biosynthesis and exudation is involved in the response to nitrogen in maize root. Plant Cell Physiol. 60, 2100–2112. doi: 10.1093/pcp/pcz108
Rocha, O., Ansari, K., and Doohan, F. M. (2005). Effects of trichothecene mycotoxins on eukaryotic cells: a review. Food Addit. Contam. 22, 369–378. doi: 10.1080/02652030500058403
Rozpadek, P., Domka, A. M., Nosek, M., Wazny, R., Jedrzejczyk, R. J., Wiciarz, M., et al. (2018). The role of strigolactone in the cross-talk between Arabidopsis thaliana and the endophytic fungus Mucor sp. Front. Microbiol. 9:441. doi: 10.3389/fmicb.2018.00441
Ruyter-Spira, C., Al-Babili, S., van der Krol, S., and Bouwmeester, H. (2013). The biology of strigolactones. Trends Plant Sci. 18, 72–83.
Schweiger, W., Pasquet, J.-C., Nussbaumer, T., Paris, M. P. K., Wiesenberger, G., Macadré, C., et al. (2013). Functional characterization of two clusters of brachypodium distachyon UDP-Glycosyltransferases encoding putative deoxynivalenol detoxification genes. Mol. Plant-Microbe Interact. 26, 781–792. doi: 10.1094/mpmi-08-12-0205-r
Siou, D., Gélisse, S., Laval, V., Elbelt, S., Repinçay, C., Bourdat-Deschamps, M., et al. (2015). Interactions between head blight pathogens: consequences for disease development and toxin production in wheat spikes. Appl. Environ. Microbiol. 81, 957–965. doi: 10.1128/aem.02879-14
Steinkellner, S., Lendzemo, V., Langer, I., Schweiger, P., Khaosaad, T., Toussaint, J. P., et al. (2007). Flavonoids and strigolactones in root exudates as signals in symbiotic and pathogenic plant-fungus interactions. Molecules 12, 1290–1306. doi: 10.3390/12071290
Stes, E., Depuydt, S., De Keyser, A., Matthys, C., Audenaert, K., Yoneyama, K., et al. (2015). Strigolactones as an auxiliary hormonal defence mechanism against leafy gall syndrome in Arabidopsis thaliana. J. Exp. Bot. 66, 5123–5134. doi: 10.1093/jxb/erv309
Stirnberg, P., van De Sande, K., and Leyser, H. M. O. (2002). MAX1 and MAX2 control shoot lateral branching in Arabidopsis. Development 129, 1131–1141.
Sun, Y., Xiao, J., Jia, X., Ke, P., He, L., Cao, A., et al. (2016). The role of wheat jasmonic acid and ethylene pathways in response to Fusarium graminearum infection. Plant Growth Regul. 80, 69–77. doi: 10.1007/s10725-016-0147-1
Torres-vera, R., García, J. M., Pozo, M. J., and López-ráez, J. A. (2014). Do strigolactones contribute to plant defence ? Mol. Plant Pathol. 15, 211–216. doi: 10.1111/mpp.12074
Umehara, M., Hanada, A., Yoshida, S., Akiyama, K., Arite, T., Takeda-Kamiya, N., et al. (2008). Inhibition of shoot branching by new terpenoid plant hormones. Nature 455, 195–200. doi: 10.1038/nature07272
Venske, E., dos Santos, R. S., Farias, D., da, R., Rother, V., da Maia, L. C., et al. (2019). Meta-analysis of the QTLome of Fusarium head blight resistance in bread wheat: refining the current puzzle. Front. Plant Sci. 10:727. doi: 10.3389/fpls.2019.00727
Vogel, J., Bragg, J., and Jorgensen, R. A. (2009). Brachypodium distachyon, a new model for the triticeae. Genet Genom. Triticeae 7, 427–449. doi: 10.1007/978-0-387-77489-3_16
Vogel, J., and Hill, T. (2008). High-efficiency agrobacterium-mediated transformation of brachypodium distachyon inbred line Bd21-3. Plant Cell Rep. 27, 471–478. doi: 10.1007/s00299-007-0472-y
Wang, L., Li, Q., Liu, Z., Surendra, A., Pan, Y., Li, Y., et al. (2018a). Integrated transcriptome and hormone profiling highlight the role of multiple phytohormone pathways in wheat resistance against Fusarium head blight. PLoS One 13:e0207036. doi: 10.1371/journal.pone.0207036
Wang, Q., Shao, B., Shaikh, F. I., Friedt, W., and Gottwald, S. (2018b). Wheat resistances to Fusarium root rot and head blight are both associated with deoxynivalenol- and jasmonate-related gene expression. Phytopathology 108, 602–616. doi: 10.1094/phyto-05-17-0172-r
Wang, Q., Buxa, S. V., Furch, A., Friedt, W., and Gottwald, S. (2015). Insights into triticum aestivum seedling root rot caused by Fusarium graminearum. Mol. Plant-Microbe Interact 28, 1288–1303. doi: 10.1094/mpmi-07-15-0144-r
Wang, Y., and Bouwmeester, H. J. (2018). Structural diversity in the strigolactones. J. Exp. Bot. 69, 2219–2230. doi: 10.1093/jxb/ery091
Wasternack, C., and Song, S. (2017). Jasmonates: biosynthesis, metabolism, and signaling by proteins activating and repressing transcription. J. Exp. Bot. 68, 1303–1321.
Xu, X., Fang, P., Zhang, H., Chi, C., Song, L., Xia, X., et al. (2019). Strigolactones positively regulate defense against root-knot nematodes in tomato. J. Exp. Bot. 70, 1325–1337. doi: 10.1093/jxb/ery439
Yang, D. L., Yang, Y., and He, Z. (2013). Roles of plant hormones and their interplay in rice immunity. Mol. Plant 6, 675–685. doi: 10.1093/mp/sst056
Yazar, S., and Omurtag, G. Z. (2008). Fumonisins, trichothecenes and zearalenone in cereals. Int. J. Mol. Sci. 9, 2062–2090. doi: 10.3390/ijms9112062
Yuen, G. Y., and Schoneweis, S. D. (2007). Strategies for managing Fusarium head blight and deoxynivalenol accumulation in wheat. Int. J. Food Microbiol. 119, 126–130. doi: 10.1016/j.ijfoodmicro.2007.07.033
Zhang, Y., Cheng, X., Wang, Y., Díez-Simón, C., Flokova, K., Bimbo, A., et al. (2018). The tomato MAX1 homolog, SlMAX1, is involved in the biosynthesis of tomato strigolactones from carlactone. New Phytol. 219, 297–309. doi: 10.1111/nph.15131
Keywords: Brachypodium distachyon, Fusarium Head Blight, cytochrome P450, orobanchol, susceptibility
Citation: Changenet V, Macadré C, Boutet-Mercey S, Magne K, Januario M, Dalmais M, Bendahmane A, Mouille G and Dufresne M (2021) Overexpression of a Cytochrome P450 Monooxygenase Involved in Orobanchol Biosynthesis Increases Susceptibility to Fusarium Head Blight. Front. Plant Sci. 12:662025. doi: 10.3389/fpls.2021.662025
Received: 31 January 2021; Accepted: 11 March 2021;
Published: 01 April 2021.
Edited by:
Dilantha Fernando, University of Manitoba, CanadaReviewed by:
Paul Nicholson, John Innes Centre, United KingdomZhiyong Liu, Institute of Genetics and Developmental Biology, Chinese Academy of Sciences, China
Copyright © 2021 Changenet, Macadré, Boutet-Mercey, Magne, Januario, Dalmais, Bendahmane, Mouille and Dufresne. This is an open-access article distributed under the terms of the Creative Commons Attribution License (CC BY). The use, distribution or reproduction in other forums is permitted, provided the original author(s) and the copyright owner(s) are credited and that the original publication in this journal is cited, in accordance with accepted academic practice. No use, distribution or reproduction is permitted which does not comply with these terms.
*Correspondence: Marie Dufresne, marie.dufresne@ips2.universite-paris-saclay.fr; marie.dufresne@u-psud.fr