 Feng Wang
 Jingwen Gao
 Jean W. H. Yong
 Qiang Wang1
 Xinhua He
- 1Institute of Environmental Resources, Soil and Fertilizer, Zhejiang Academy of Agricultural Sciences, Hangzhou, China
- 2Centre of Excellence for Soil Biology, College of Resources and Environment, Southwest University, Chongqing, China
- 3School of Biological Sciences, The University of Western Australia, Perth, WA, Australia
- 4Department of Biosystems and Technology, Swedish University of Agricultural Sciences, Alnarp, Sweden
Photosynthesis of wheat and maize declined when grown with NH4+ as a nitrogen (N) source at ambient CO2 concentration compared to those grown with a mixture of NO3– and NH4+, or NO3– as the sole N source. Interestingly, these N nutritional physiological responses changed when the atmospheric CO2 concentration increases. We studied the photosynthetic responses of wheat and maize growing with various N forms at three levels of growth CO2 levels. Hydroponic experiments were carried out using a C3 plant (wheat, Triticum aestivum L. cv. Chuanmai 58) and a C4 plant (maize, Zea mays L. cv. Zhongdan 808) given three types of N nutrition: sole NO3– (NN), sole NH4+ (AN) and a mixture of both NO3– and NH4+ (Mix-N). The test plants were grown using custom-built chambers where a continuous and desired atmospheric CO2 (Ca) concentration could be maintained: 280 μmol mol–1 (representing the pre-Industrial Revolution CO2 concentration of the 18th century), 400 μmol mol–1 (present level) and 550 μmol mol–1 (representing the anticipated futuristic concentration in 2050). Under AN, the decrease in net photosynthetic rate (Pn) was attributed to a reduction in the maximum RuBP-regeneration rate, which then caused reductions in the maximum Rubisco-carboxylation rates for both species. Decreases in electron transport rate, reduction of electron flux to the photosynthetic carbon [Je(PCR)] and electron flux for photorespiratory carbon oxidation [Je(PCO)] were also observed under AN for both species. However, the intercellular (Ci) and chloroplast (Cc) CO2 concentration increased with increasing atmospheric CO2 in C3 wheat but not in C4 maize, leading to a higher Je(PCR)/ Je(PCO) ratio. Interestingly, the reduction of Pn under AN was relieved in wheat through higher CO2 levels, but that was not the case in maize. In conclusion, elevating atmospheric CO2 concentration increased Ci and Cc in wheat, but not in maize, with enhanced electron fluxes towards photosynthesis, rather than photorespiration, thereby relieving the inhibition of photosynthesis under AN. Our results contributed to a better understanding of NH4+ involvement in N nutrition of crops growing under different levels of CO2.
Introduction
The application of chemical nitrogen (N) fertilizers has greatly increased global crop yields and decreased world hunger over the past five decades (Gong et al., 2011). However, only 30–40 % of applied N is utilized by crops; most is lost in numerous ways, including run-off, leaching, denitrification and volatilization, which together lead to a range of environmental problems (Richter and Roelcke, 2000; Xing and Zhu, 2000). Thus, increasing plant nitrogen use efficiency (NUE) is crucial for the development of sustainable agriculture. Unlike nitrate (NO3–), ammonium (NH4+) can be assimilated by plants without further chemical reduction (Mehrer and Mohr, 1989; Onoda et al., 2004). NH4+ can be provided by both manure and urea fertilizers (Xu et al., 2012; Coskun et al., 2017). A promising future strategy for improving agronomic NUE is the application of stabilized-NH4+-based fertilizers together with other active compounds, such as nitrification inhibitors, which can inhibit the nitrification of NH4+, thereby maintaining a high soil N content in the form of NH4+ over extended periods (IPCC, 2007; Ariz et al., 2011). Some crops, including wheat and maize, are able to grow well when provided with a mixture of NO3– and NH4+ (Mix-N), or NO3– as the sole N source (NN) (Miller and Cramer, 2005). Under certain environmental conditions, NH4+ may reduce growth by decreasing photosynthesis, thereby lowering crop productivity (Britto and Kronzucker, 2002). Since urea and NH4+-based N fertilizers are used commonly to support the growth of cereals, vegetables and fruits, a better understanding of the toxic effects of NH4+ in plant nutrition should facilitate better crop productivity (Miller and Cramer, 2005; Fernández-Crespo et al., 2012).
Photosynthesis is a synergistic process that involves electron harvesting, transport, and utilization (Kühlbrandt et al., 1994). Photosynthetic electron transport typically involves two reaction centers: photosystems I and II (PSI and PSII, respectively). The D1 protein of PSII is sensitive to NH4+, and a loss of PSII function occurs when NH4+-based fertilizers are applied in excessive quantities (Drath et al., 2008). When this occurs, impairment of the photosynthetic electron transport chain will lead to a decrease in photochemical efficiency (ΦPSII) and the electron transport rate (Jt), in turn leading to a deficiency in NADPH and ATP for CO2 assimilation (Wang et al., 2019). The atmospheric CO2 concentration (Ca) has increased from 280 μmol mol–1 in pre-industrial times to 400 μmol mol–1 at present, and is expected to reach 550 μmol mol–1 by the 2050 s (IPCC, 2013). The elevation of CO2 concentration at the sites of Rubisco carboxylation alters plant photosynthetic sensitivity, potentially modulating sensitivity to a diversity of N sources. Due to the importance of food production security and crops in the global carbon cycle, an improved understanding of Ca changes on the N nutrition of C3 and C4 plants will become more and more crucial (Lloyd and Farquhar, 1996; Ghannoum et al., 2000). In general, plants with the C4 photosynthetic pathway have anatomical and biochemical traits that increase CO2 levels around the carboxylating Rubisco enzyme (Hatch and Slack, 1966). Bloom et al. (2014) and Dier et al. (2018) showed that NO3– assimilation is inhibited by elevated CO2 concentrations in field-grown C3 wheat plants. We postulated that an elevated Ca increases photosynthesis to produce more carbon skeletons, which in turn would increase NH4+ assimilation, thereby ameliorating the possible physiological stress of having excess free NH4+ in C3 plants. The detailed comparative physiological responses of C3 and C4 plants to NH4+ fertilization under elevated Ca are still not fully understood (Bloom et al., 2002, 2010; Cousins and Bloom, 2003; Bloom, 2015).
A wide variety of equipment, including open-top chambers (OTC), controlled-environment (CE) systems, and free-air CO2 enrichment (FACE) systems, has been used to study the effects of elevated Ca. In the OTC system, plants are held in a chamber with an open top that facilitates gas exchange with the atmosphere (Owensby et al., 1999). However, the temperature is generally higher inside the chamber than outside, inevitably increasing plant transpiration, which influences plant growth rates. The FACE system minimally perturbs the plant growth environment and is suitable for long-term experiments under elevated Ca. However, the FACE system could not be used to study the effects of sub-ambient CO2 concentrations. Controlled environment experiments can also be performed in greenhouses and artificial growth chambers (Yong et al., 2000: Aranjuelo et al., 2009; Kanemoto et al., 2009; Robredo et al., 2011). To design a system having minimal impact on natural temperature, light and seasonality, while also having the capacity to provide either sub-ambient or elevated levels of CO2, we custom-fabricated experimental chambers in which the inside temperature and humidity were kept similar to outside open field conditions while regulating the Ca.
Our primary objective was to improve understanding of (i) the physiological mechanisms underlying the photosynthetic inhibition caused by NH4+ nutrition and (ii) the mechanism by which Ca affects the NH4+ tolerance of C3 and C4 plants. We therefore studied the photosynthetic responses of a C3 plant (wheat, Triticum aestivum L.) and a C4 plant (maize, Zea mays L.). Both these species prefer NO3– as the N nutrient source and we grew them under three Ca concentrations (280, 400, or 550 μmol mol–1) combined with three forms of N nutrition: Mix-N, NN and sole NH4+ nitrogen (AN). Our other objective was to provide new knowledge facilitating (i) directed breeding programs aiming to produce N-efficient cultivars, and (ii) the development of sustainable crop N management strategy to adapt to a future with elevated Ca, as predicted by current models of global climate change.
Materials and Methods
Plant Materials and Experimental Design
Wheat (T. aestivum cv. Chuanmai 58) and maize (Z. mays cv. Zhongdan 808), two common crop species in Chongqing, China, were grown under hydroponic experimental conditions. Seeds of both species, of uniform size, were sterilized in 20% (v/v) H2O2 for 10 min, rinsed with distilled water, and germinated in darkness in culture dishes covered with wet sterile gauze. When the cotyledons were 1.0 cm long, the seedlings were transferred to silica sand (previously soaked in 1% HCl for 2 days, followed by flushing with copious amounts of water to remove all traces of HCl) and watered twice daily with distilled water. Uniform 14-day-old (two-leaf stage) seedlings were transplanted into opaque plastic growth containers containing a modified Hoagland’s solution (Wang et al., 2016a; Gao et al., 2018), with three N sources: Mix-N, NN or AN. The composition of the Mix-N solution was as follows: macronutrients were provided as 5.0 mM N in the form of Ca(NO3)2, KNO3 and (NH4)2SO4 (the ratio of NO3– to NH4+ in the Mix-N was 3 : 2), 3.0 mM K in the form of KH2PO4 and KNO3, 1.5 mM Ca as Ca(NO3)2 and CaCl2, 1.0 mM Mg as MgSO4, 1.0 mM P as KH2PO4, and 0.6 mM Na as NaCl. Micronutrients were provided as 0.1 mM Fe as Fe-EDTA, 455 × 10–3 mM Mn as MnSO4, 38.1 × 10⁻⁶ mM Zn as ZnSO4, 15.6 × 10⁻⁶ mM Cu as CuSO4, 2.31 × 10⁻³ mM B as H3BO3, and 6.2 × 10⁻⁶ mM Mo as MoO3. Macronutrients were provided in the NO3–-source solution as 5.0 mM N in the form of Ca(NO3)2 and KNO3, 3.0 mM K in the form of KH2PO4 and KNO3, 1.5 mM Ca as Ca(NO3)2, 1.0 mM Mg as MgSO4, 1.0 mM P as KH2PO4, and 0.5 mM Na as NaCl. Macronutrients were provided in the NH4+-source solution as 5.0 mM N in the form of (NH4)2SO4, 3.0 mM K as KH2PO4 and K2SO4, 1.5 mM Ca as CaCl2 and CaSO4, 1.0 mM Mg as MgSO4, 1.0 mM P as KH2PO4, and 0.5 mM Na as NaCl. Micronutrients in NN or AN source solution were identical to those in the Mix-N source solution; and then kept in chambers (Figure 1A) with the following CO2 levels: 280 μmol mol–1 [pre-industrial revolution (i.e., 1840) concentration], 400 μmol mol–1 (current level), and 550 μmol mol–1 (projected concentration by the 2050 s) (IPCC, 2013). The temperature and humidity inside the chambers were automatically maintained to match those of the atmosphere outside (Figure 1B). During the night, the CO2 gradients were held at concentrations 150 ± 1 μmol mol–1 above daytime levels (Anderson et al., 2001).
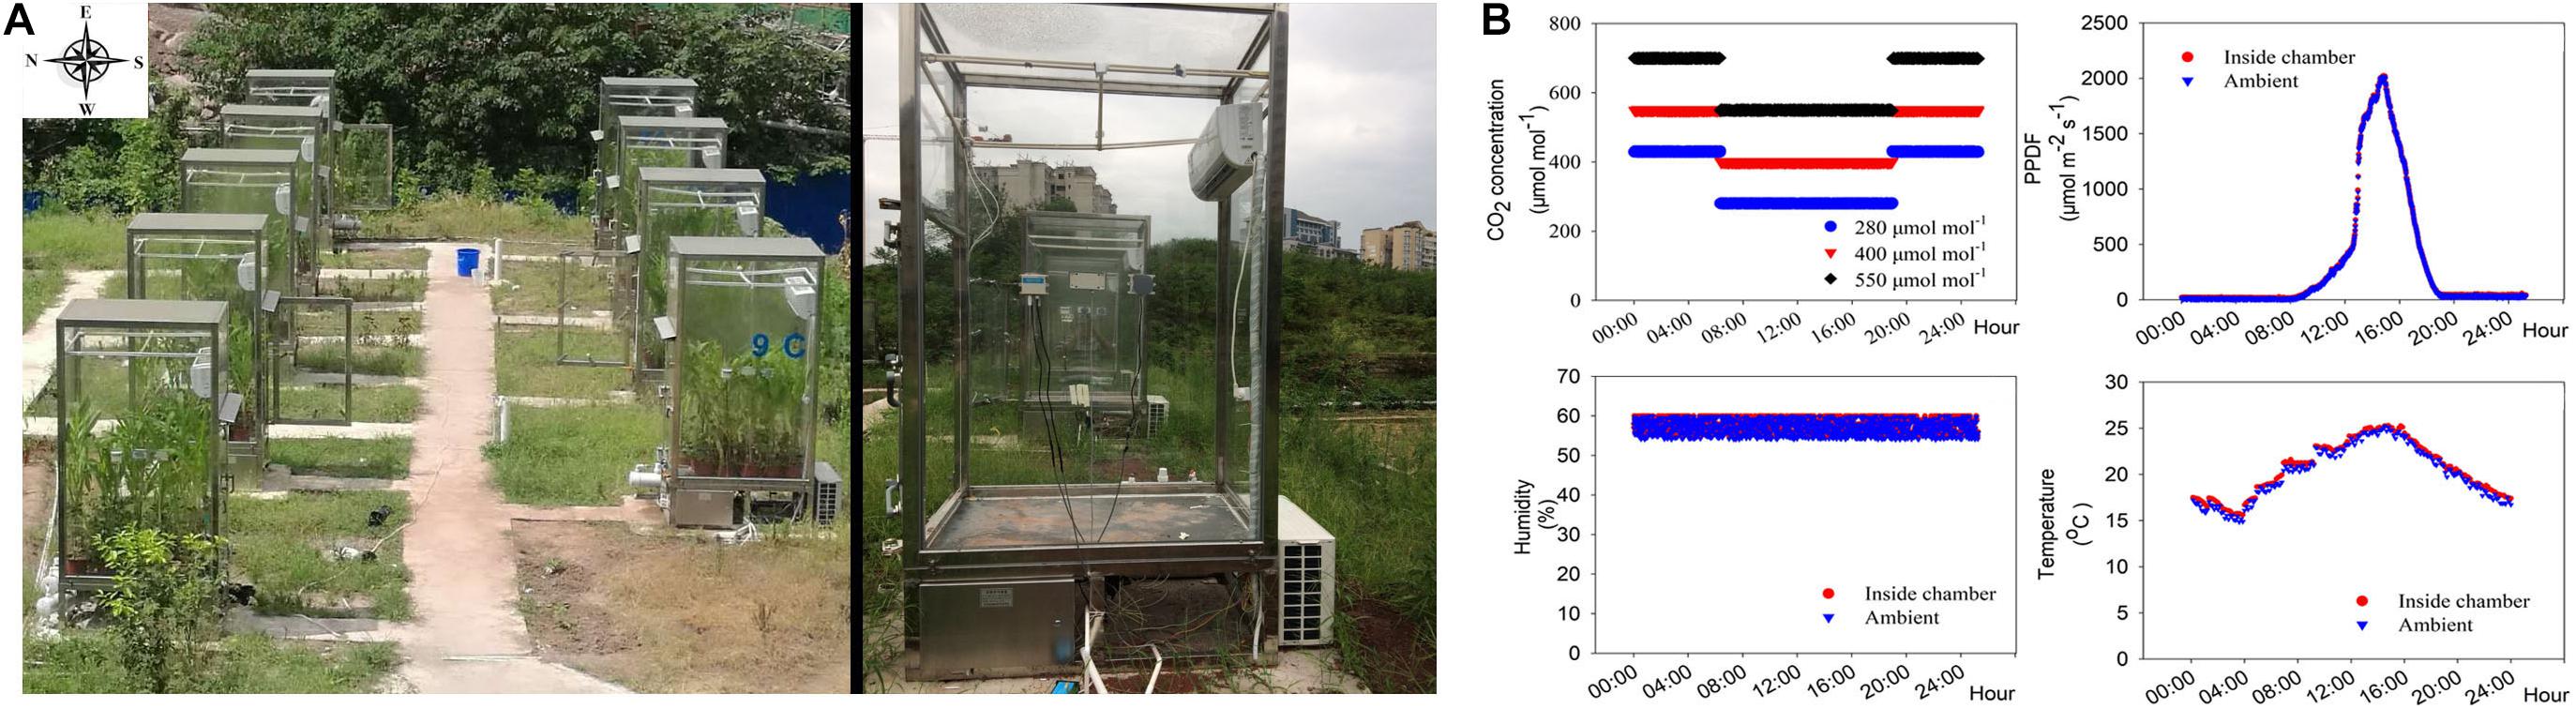
Figure 1. Custom-built chambers (A) that automatically maintained desired CO2 levels, while temperature and humidity of the chambers were similar to the outside atmospheric environment and (B) mean CO2 concentrations maintained inside the CO2 chamber; intensity of photon flux intensity (PPFD); humidity and temperature inside and outside the chambers over a period of 21 days of growth.
A nitrification inhibitor (dicyandiamide, 1 mM) was added to the nutrition solutions to prevent microbial oxidation of NH4+. The pH of the Hoagland’s solution was adjusted daily to 5.5 using 0.1 mM NaOH for the plants treated with NH4+, or with 0.1 mM H2SO4 for those treated with NO3–. The N concentrations were kept constant by replacing the media at 3-day intervals; aeration was provided continuously. We used three CO2 treatments, with three replicates each in separate chambers (9 chambers in total), and deployed three N treatments for each species in each chamber. Ideally, each experiment should be repeated at least once in every chamber, for each of the planned treatments, to eliminate any intrinsic technical effect of each chamber on plant growth; this represented a potential small shortcoming of the current study in our facility.
Experimental Field Chambers
The automatically CE facility consisted of a CO2 control system (2543CN; Shengsen Corp., Qingdao, China; Supplementary Figures S1-1) and a CO2 generator (12864; Shengsen Corp.; Supplementary Figure S1-2). The CO2 generator comprised of several components, i.e., an electric connection point pressure meter (STC90C516RD; Shengsen Corp.), pressure sensors (13864; Shengsen Corp.), and Na2CO3 and H2SO4 feeding inlets (Supplementary Figures S1-5, 6), where the CO2 was generated according to the following equation: Na2CO3 + H2SO4 = Na2SO4 + H2O + CO2 The CO2 generator was connected to the CO2 control system to maintain the CO2 concentration in the chambers within a desired set range; CO2 was delivered through pipes into each chamber.
The chambers were built using toughened glass (10 mm thick, 99% transmittance) walls and roofs (Supplementary Figure S1-13). The floors were covered using a polyvinyl chloride (PVC) material (Supplementary Figure S1-7). Each chamber measured 1,500 × 1,000 × 2,000 mm (length × width × height). CO2, temperature and humidity sensors were mounted on both the outer and inner surfaces of the walls (Supplementary Figures S1-8–10). The environmental control mechanism in this system operated automatically and regulated the internal CO2 concentration (±2.5 μmol mol–1), air temperature (±0.5°C) and humidity (±5%) (Figure 1B). The CO2 control system sensed and assessed the chamber environmental data; these data were later used to regulate the CO2 injection process and attaining the desired chamber CO2 levels. When the CO2 concentration in a chamber exceeded the set concentration, the air was filtered through 1.0 mol mol–1 NaOH solution using a pump controlled by a mini-computer. When the humidity of a chamber exceeded the set concentration, the air was filtered through dry calcium carbonate using a separate pump controlled by the mini-computer.
Plant Sampling
The seedlings were sampled between 10:00 and 11:00 at the 21st day of the experiment. Plant organs were separated into two portions: the first was immersed in liquid-N and then stored at –80°C for later chemical analyses, and the second portion was oven-dried at 105°C for 20 min, and then at 75°C for at least 48 hours. The dried material was used later for different chemical analyses. Fresh leaf area was measured using a leaf area scanning device (Li-3000; Li-Cor Inc., Lincoln, NE, United States).
Gas-exchange Measurements
After 21 days of growth under different N source and CO2 level conditions, we measured gas exchange and chlorophyll fluorescence simultaneously on the first fully developed leaves during the morning (09:00–11:00) using a Li-Cor 6400 infrared gas analyzer (Li-Cor 6400; Li-Cor Inc.). The leaf temperature during measurements was maintained at 25.0 ± 0.5oC. Leaves were illuminated with a steady red and blue light source at a photosynthetic photon flux density (PPFD) of 1,500 μmol m–2 s–1 (Yong et al., 2000, 2010). The reference CO2 concentrations in the cuvettes matched the treatment CO2 concentrations to which samples had been previously subjected (Ctreatment), i.e., 280 ± 2.5, 400 ± 2.5 or 550 ± 2.5 μmol mol–1. The vapor pressure deficit (Vpdl) was 1.1 ± 0.05 kPa, and the relative humidity was in the range 55–65%. The gas exchange instrument was calibrated each day before the measurements and matched at least twice a day (between the curves). Data were recorded after sample acclimation in the cuvette for at least 15 min.
Two types of curves were plotted: net photosynthesis (An) vs. intercellular CO2 concentrations (Ci, Supplementary Figure S2), and An vs. PPFD. Simultaneous measurements of chlorophyll fluorescence and parameters for plotting the A/Ci curves were made on the same leaf using the Li-Cor 6400 infrared gas analyzer. Leaf temperature, PPFD, Vpdl and relative humidity were maintained as indicated above. Prior to measurement, leaves were held in the cuvette at a reference CO2 concentration of Ctreatment for at least 10 min. The reference CO2 concentration was controlled across a series of Ctreatment values: 200, 150, 100, 50, 400, 600, 800, 1,000, 1,200, and 1,500 μmol mol–1. Data were collected after the prevailing CO2 had reached a steady state (2–3 min).
Method for Determining Photosynthetic Parameters of C3 and C4 Plants
The parameters for the C3 wheat plant photosynthesis model were calculated using the equations of Farquhar et al. (1980); Long and Bernacchi (2003), Gao et al. (2018), and Wang et al. (2019).
According to the photosynthesis model that we used for C4 maize plants (von Caemmerer and Farquhar, 1999), the rates of phosphoenolpyruvate (PEP) and Rubisco carboxylation (Vp and Vc, respectively) are the major determinants of the net CO2 assimilation rate. The Rubisco carboxylation rate (Vcmax), the maximal rate of PEP carboxylation (Vpmax), maximum RuBP-regeneration rate (Jmax) and CO2 concentration in the bundle sheath (Cs) for maize were calculated using the following equations. The photosynthetic rate was expressed mathematically as:
and
where Rm is the mitochondrial respiration of the mesophyll cells, L is the rate of CO2 leakage from the bundle sheath into the mesophyll, and Rd is the mitochondrial respiration rate in the light.
where gbs is the bundle sheath conductance for CO2, gi is the mesophyll conductance for CO2, Cs is the CO2 concentration in the bundle sheath, and Cm is the CO2 concentration in the mesophyll cells. Vo is the rate of Rubisco oxygenation:
where γ∗ is one half of the reciprocal of Rubisco specificity (Sc/o), and O is the oxygen concentration in the bundle sheath cells, which matches the oxygen concentration in the mesophyll cells. By fitting equation (3) to equation (1), and equation (5) to equation (2), we obtained the following expressions:
and
Vp and Vc depend on Vcmax, Vpmax, Jmax, the Michaelis constants for O2 and CO2 (Ko, Kc and Kp), and the relative specificity of Rubisco (Sc/o).
To calculate Vcmax and Vpmax, we used the enzyme-limited expressions of Vp and Vc:
By fitting equation (8) to equation (6), and equation (9) to equation (7), we obtained the following expressions:
and
In equations (4), (10) and (11), gi, gbs, Rm, Kp, Kc, Ko, O, Rd and γ∗ were constant parameters at a given temperature [as described by von Caemmerer and Farquhar (1999)], A and Ci were measured values, and Cm, Cs, Vcmax and Vpmax were unknowns. Two pairs of (A, Ci) (with Ci limited to 40–80 μmol mol–1) were then inserted into two sets of equations (5), (8) and (9), following which we obtained six equations and six unknowns (Vcmax, Vpmax, Cs1, Cs2, Cm1 and Cm2) using the Matlab software (MathWorks, Natick, MA, United States).
To calculate Jmax, we used the electron transport limited expressions of Vp and Vc:
where x is a partitioning factor of electron transport, and Jt is the electron transport rate, given by:
where I2 is the total absorbed irradiance, which is a function of the incident irradiance I, and θ is an empirical curvature factor.
By fitting equation (11) to equation (6), and equation (12) to equation (7), we obtained:
and
Cm was obtained from equation (4). In equations (15) and (16), x and γ∗ are constants at a given temperature, A, Cm and I (PPFD) are known values, and Jmax and Cs are unknown entities. With two equations and two unknowns, and incorporating the single values of A and I (PPFD), we obtained the values for Jmax and Cs.
Chlorophyll Fluorescence Measurements
Light adapted chlorophyll fluorescence was measured with a Li-Cor 6400 infrared gas analyzer while simultaneously measuring gas exchange, as described above. Steady-state fluorescence (Fs) was measured under actinic light. A saturating light pulse (∼8,000 μmol photons m–2 s–1) was applied for 0.7 s to obtain the maximum fluorescence (Fm’). After removing the actinic light and applying 3 s of far-red light, the minimal fluorescence of the light-adapted state (Fo’) was obtained. The quantum efficiency of PSII (ΦPSII) and Jt were calculated using equations (17) and (18), respectively, following Genty et al. (1989) and Li et al. (2009):
The central portion of the same leaf (∼70% leaf area) was chosen for measurement of dark-adapted and light-adapted chlorophyll fluorescence parameters using a Fluor imager (CF Imager; Technologia Ltd., Colchester, United Kingdom). The minimum and maximum chlorophyll fluorescence (Fo and Fm, respectively) values were determined after full dark adaptation for at least 30 min. Fs, Fm’, and Fo’ were obtained as described above. The maximum quantum efficiency of PSII (Fv/Fm) was calculated using equation (32) of Genty et al. (1989):
Photochemical quenching (qL) was calculated using equation (20) and non-photochemical quenching (NPQ) was calculated using equation (21), following Kramer et al. (2004).
Calculating Electron Flux to the Photosynthetic Carbon Reduction Cycle [Je(PCR)], and Electron Flux to the Photorespiratory Carbon Oxidation Cycle [Je(PCO)]
The Jt in the photosynthetic carbon reduction and photorespiratory carbon oxidation cycles were expressed as follows (Zhou et al., 2004):
Determination of Free NH4+ and Soluble Sugar Concentrations
The free NH4+ in plant tissues was determined according to Balkos et al. (2010) with some modifications. Briefly, plant tissues were desorbed in 10 mM CaSO4 for 5 min, and then rinsed with deionized water to remove any extracellular NH4+. Approximately 0.5 g of fresh material was homogenized with liquid nitrogen; NH4+ was then extracted in 5 ml of 10 mM formic acid. Supernatants were collected after centrifugation at 10,000 g (4°C) for 15 min, transferred to 5-ml polypropylene tubes after filtration through 0.45-μm organic ultra-filtration membranes, and re-centrifuged at 50,000 g (4°C) for 10 min. An O-phthalaldehyde (OPA) reagent was prepared by combining 200 mM potassium phosphate buffer (equimolar amounts of potassium dihydrogen phosphate and potassium monohydrogen phosphate), 3.75 mM OPA, and 2 mM 2-mercaptoethanol (v/v/v = 1:1:1). Prior to adding 2-mercaptoethanol, the pH was adjusted to 7.0 using 1 M NaOH, and the solution was then filtered through two layers of filter paper. A 10-μl aliquot of tissue extract was mixed with 3 ml of OPA reagent. The color was developed in darkness at 25°C for 30 min before carrying out absorbance measurements at 410 nm using a spectrophotometer (model UV-2401, Shimadzu Corp., Kyoto, Japan).
Soluble sugar concentrations were measured following the method of Wang et al. (2016a). Dry powdered shoot and root samples (0.5 g) were extracted in 80% (v/v) ethanol at 80°C for 30 min. The extracts were later centrifuged at 3000 g for 10 min and the supernatants were collected. This extraction procedure was repeated three times to ensure all soluble sugars were extracted. The supernatants were evaporated on china dishes in a hot water bath. Residues were then re-dissolved in 1-3 ml of distilled water and filtered through 0.4-μm film to assay soluble sugars. Concentrations of soluble sugar were measured using the anthrone method. Anthrone sulfuric acid (5 ml) solution (75% v/v) was added to 0.1 ml of supernatant and heated to 90°C for 15 min. Absorbance at 620 nm was measured using a spectrophotometer (model UV-2401, Shimadzu Corp., Kyoto, Japan).
Statistical Analysis
We found significant effects of N forms (Mix-N, NN, AN) and CO2 levels on the measured parameters in wheat and maize using the two-way ANOVA (P < 0.05, n = 3). Significant pairwise differences between means were identified with Dunnett’s multiple comparisons test (P < 0.05). The proportion of variation (%) explainable by each factor was estimated as the total sums of squares. Calculations were performed with SPSS software (SPSS, Inc., Chicago, United States). Graphs were plotted using SigmaPlot 10.0 software (Systat Software, Inc., Chicago, IL, United States).
Results
Dry Biomass, Leaf Area and Free NH4+
Compared with the Mix-N treatment, AN significantly reduced the shoot and root biomass of both wheat and maize plants (Figure 2). However, with increasing CO2 concentration, wheat shoot and root biomass increased significantly, although these biomass parameters did not differ significantly according to CO2 levels in maize. Shoot biomass in wheat under AN was reduced by 38%, 27%, and 14% at CO2 concentrations of 280, 400 and 550 μmol mol–1, respectively (in comparison with the Mix-N treatment). The decreases were larger in maize (46%, 44% and 44% at CO2 concentrations of 280, 400, or 550 μmol mol–1, respectively) (Figure 2). The AN treatment reduced the total leaf area, where the reduction was again greater in maize than in wheat. With increasing CO2 concentrations, the total foliage area of wheat increased significantly, but this was not the case for maize. Free NH4+ concentrations did not differ significantly in either species between the Mix-N and NN treatments with increasing CO2 concentration (Figure 2) whereas, in comparison with the other two treatments, the AN increased free NH4+ in shoots and roots. The concentration of free NH4+ decreased significantly with increasing CO2 concentration in wheat, but not in maize.
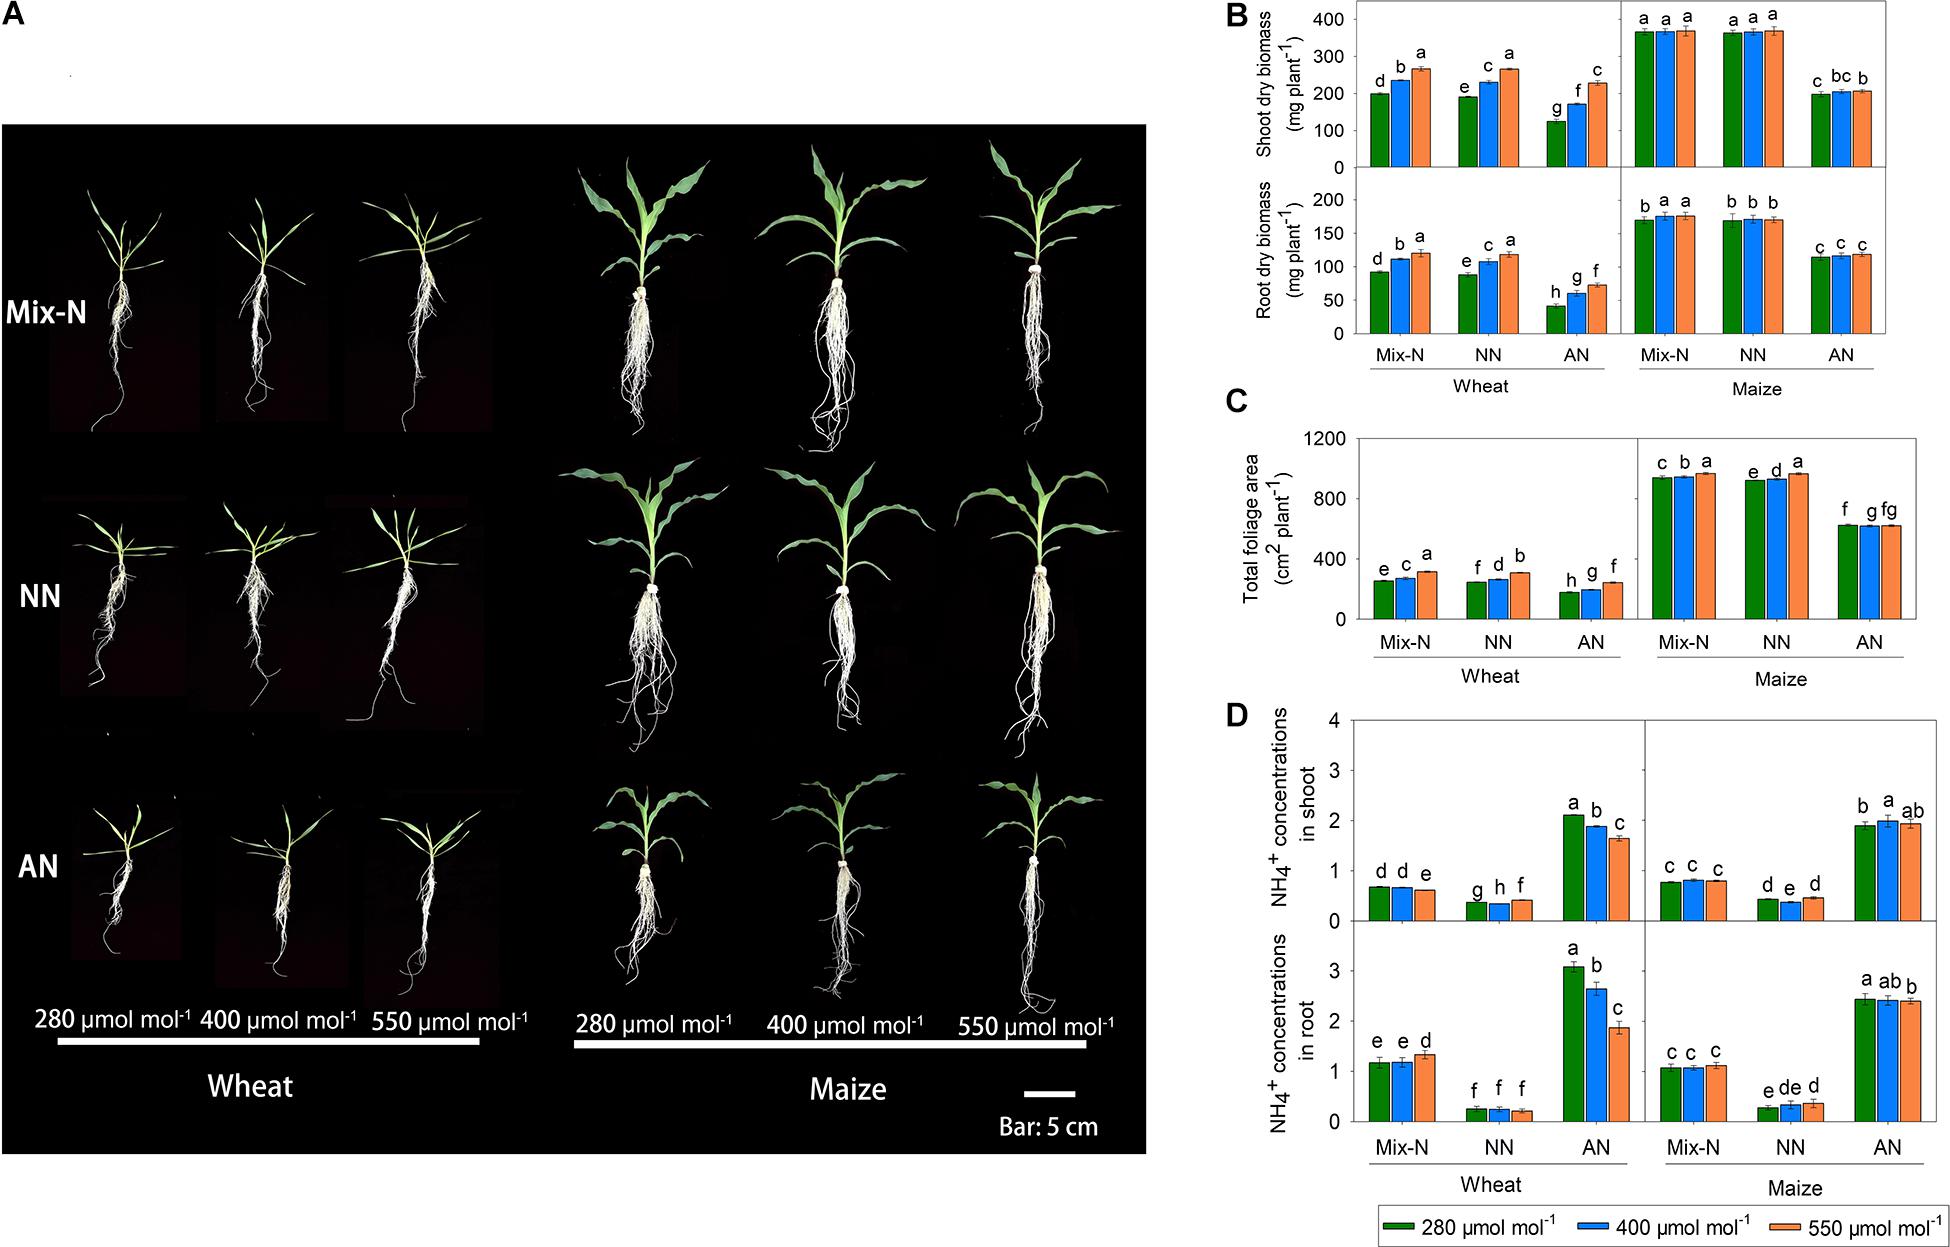
Figure 2. Effects of CO2 levels on shoot and root biomass (A,B, mg DW plant–1), total foliage area (C, cm2 plant–1) and free NH4+ (D, μg g–1 FW) of C3 wheat and C4 maize seedlings after 21 days of treatment with different N-sources. Data are means ± SE (n = 3); Lower-case letters indicate a significant difference at p < 0.05.
Only the N form had significant effects on maize shoot dry biomass; in wheat, the N form, CO2 level, and their interaction significantly affected shoot biomass (Table 1). Changes in CO2 levels caused a higher proportion of the variance in wheat shoot dry biomass than did changes in N form. Total leaf area in the two species was significantly affected by both N form and CO2 level. N form explained a larger proportion of the variance in total leaf area in both species. Alterations in CO2 levels explained a much greater proportion of the variance in total leaf area variation in wheat (38%) than in maize (0.5%). In both species, the quantity of free NH4+ in shoots and roots differed significantly according to the form of N supplied. Interestingly, the CO2 level had significant effects on free NH4+ in tissues of wheat, but not in maize.
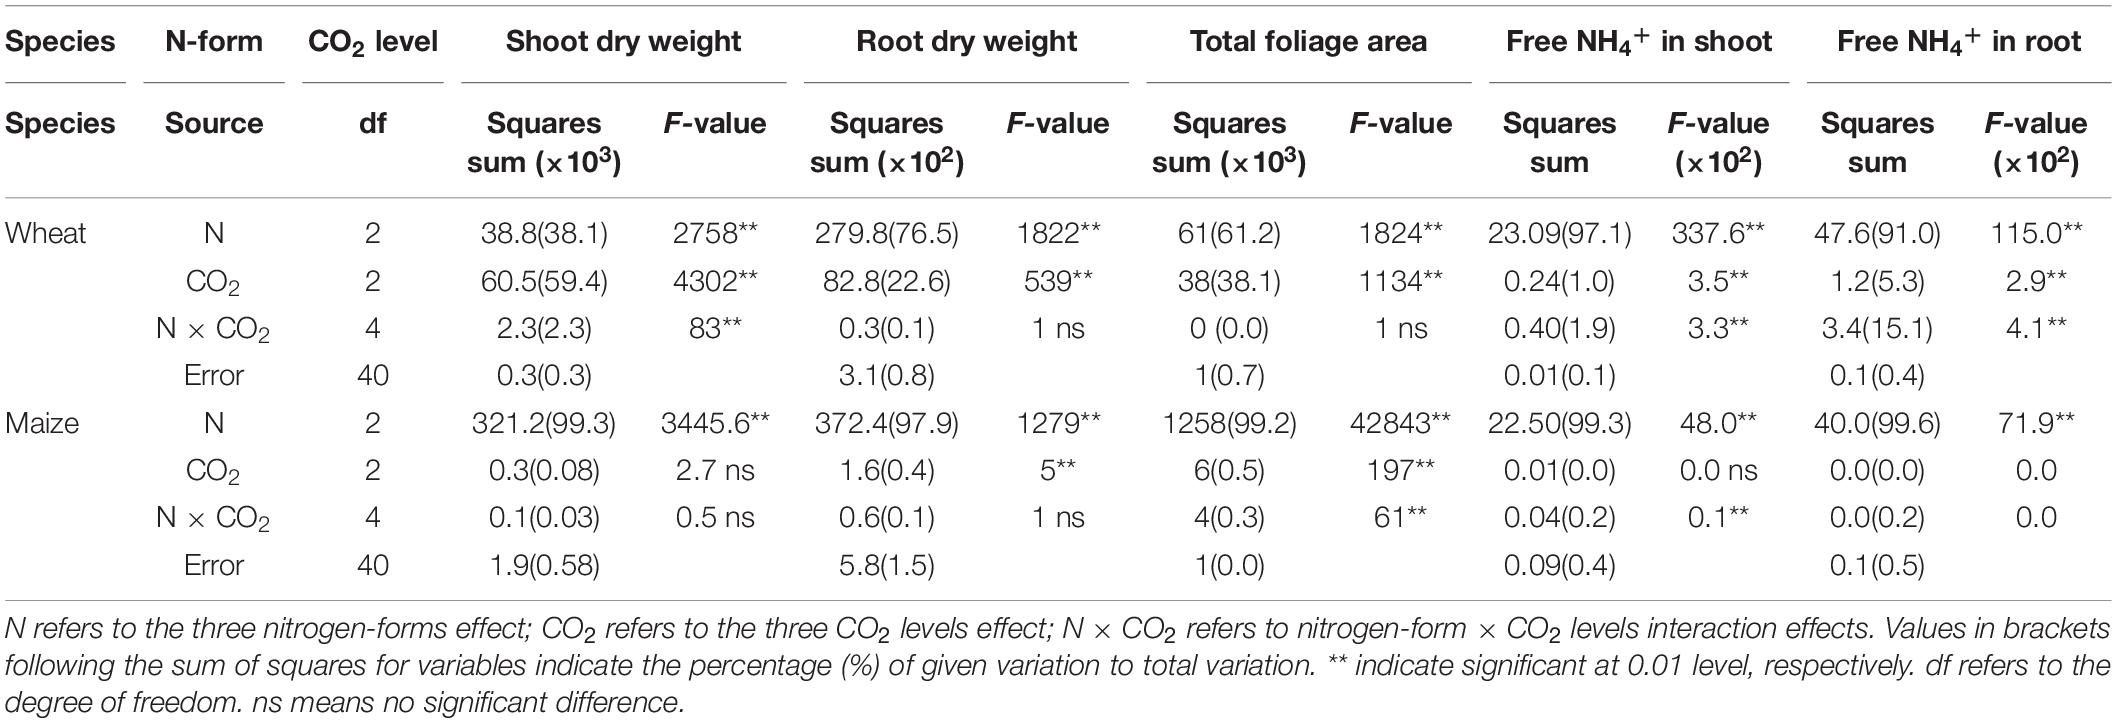
Table 1. F-values in two-way ANOVA analysis of biomass, total foliage area and free NH4+ in newly expanded leaves of C3 wheat and C4 maize seedlings after 21 days of treatment with different N-sources.
Photosynthesis and Its Related Parameters
Compared with Mix-N and NN, AN treatment reduced the net photosynthetic rate (Pn) of both maize and wheat, although the effect was greater in the former species (Figure 3). The Pn of wheat plants growing under 550 μmol CO2 mol–1 was significantly higher than that of plants grown under 280 and 400 μmol CO2 mol–1. Conversely, the Pn of maize plants under AN did not differ significantly according to the CO2 level. On day 21 of the experiment, the Pn of maize under AN was reduced in comparison with those under the Mix-N treatment, by 34%, 32% and 32% at CO2 concentrations of 280, 400, and 550 μmol mol–1, respectively. The respective reductions in wheat were 30%, 27 % and 19%.
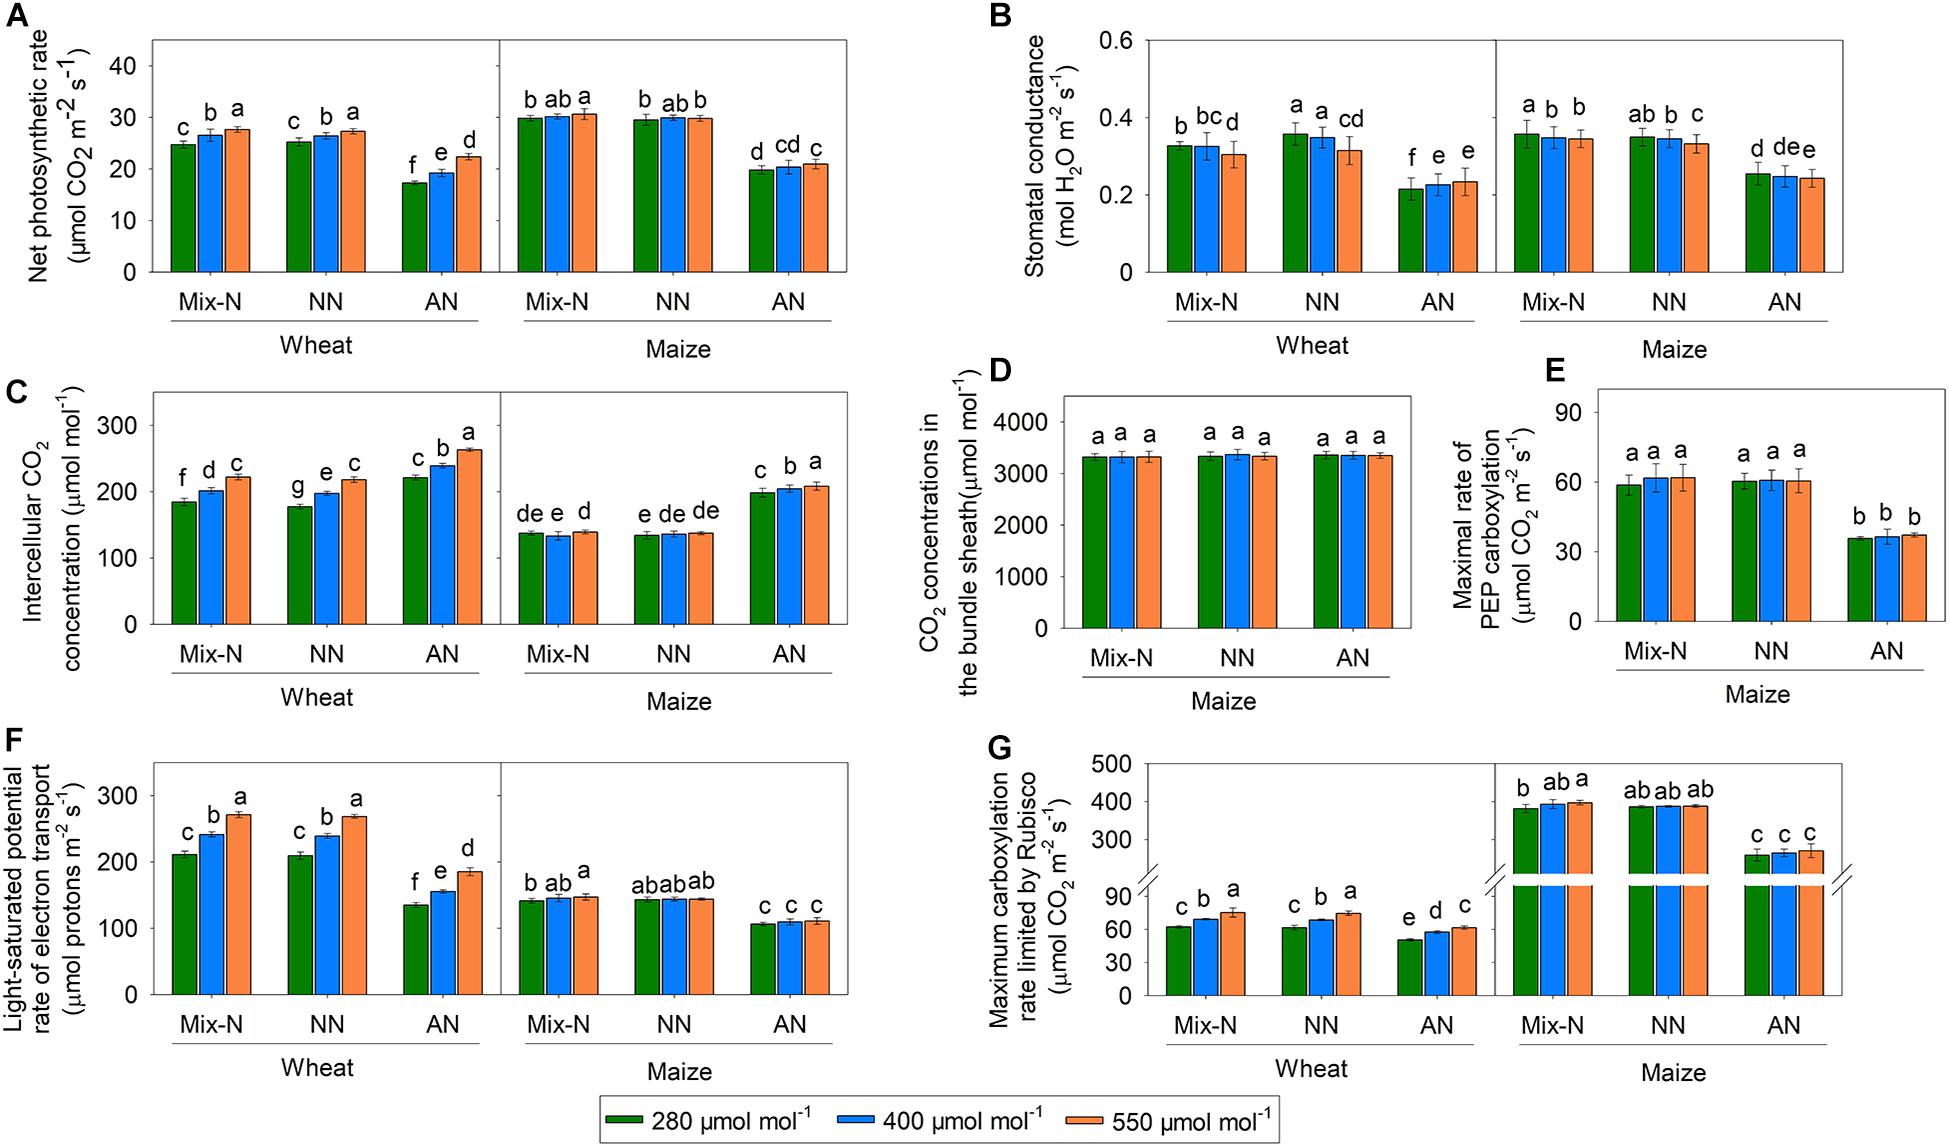
Figure 3. Effects of CO2 levels on Pn (A, μmol CO2 m–2 s–1), gs (B, mol H2O m–2 s–1), Ci (C, μmol mol–1), Cs (D, μmol mol–1), Vcmax (E, μmol CO2 m–2 s–1), Vpmax (F, μmol CO2 m–2 s–1), and Jmax (G, μmol protons m–2 s–1) in newly expanded leaves of C3 wheat and C4 maize seedlings after 21 days of treatment with different N-sources. Data are means ± SE (n = 3); Lower-case letters indicate a significant difference at p < 0.05.
The gs values did not differ significantly by CO2 concentration, but were significantly reduced by AN treatment compared with the other two treatments, in both species (Figure 3). Ci increased significantly with increasing CO2 concentration in wheat, but not in maize. The AN treatment significantly increased Ci in both species in comparison with the other two treatments. On day 21 of the experiment, we found no significant differences in Cs according to either the treatment or CO2 concentration. Vpmax did not vary significantly by CO2 concentration, but was significantly reduced under AN in comparison with the other two treatments.
The Vcmax and Jmax of wheat increased significantly with increasing CO2 concentration within the same level of the N form factor, but this was not the case for maize (Figure 3). In comparison with the other two treatments, AN reduced Vcmax and Jmax in both species. The reduction in Vcmax associated with AN was larger in maize than in wheat, while the reduction in Jmax was smaller in maize than in wheat. On day 21 of the experiment, AN reduced Vcmax in maize in comparison with Mix-N, by 32%, 33% and 32% at CO2 concentrations of 280, 400, and 550 μmol mol–1, respectively. The respective reductions in wheat were 19%, 17%, and 18%. Moreover, AN reduced the Jmax of maize in comparison with Mix-N, by 25%, 25%, and 24% at CO2 concentrations of 280, 400, and 550 μmol mol–1, respectively. The respective reductions in wheat were 36%, 36%, and 32%.
The Pn, gs, Ci, Vcmax and Jmax varied significantly according to both the N treatment type and the CO2 level. The N form accounted for a larger proportion of the variance in these parameters in both species (Table 2). The effect of CO2 level was much greater in wheat than in maize. The Vpmax of maize was significantly affected only by the N form. The Cs in maize was not affected by the N form, CO2 level, or their interaction, nor by the interaction between pH and the N form.
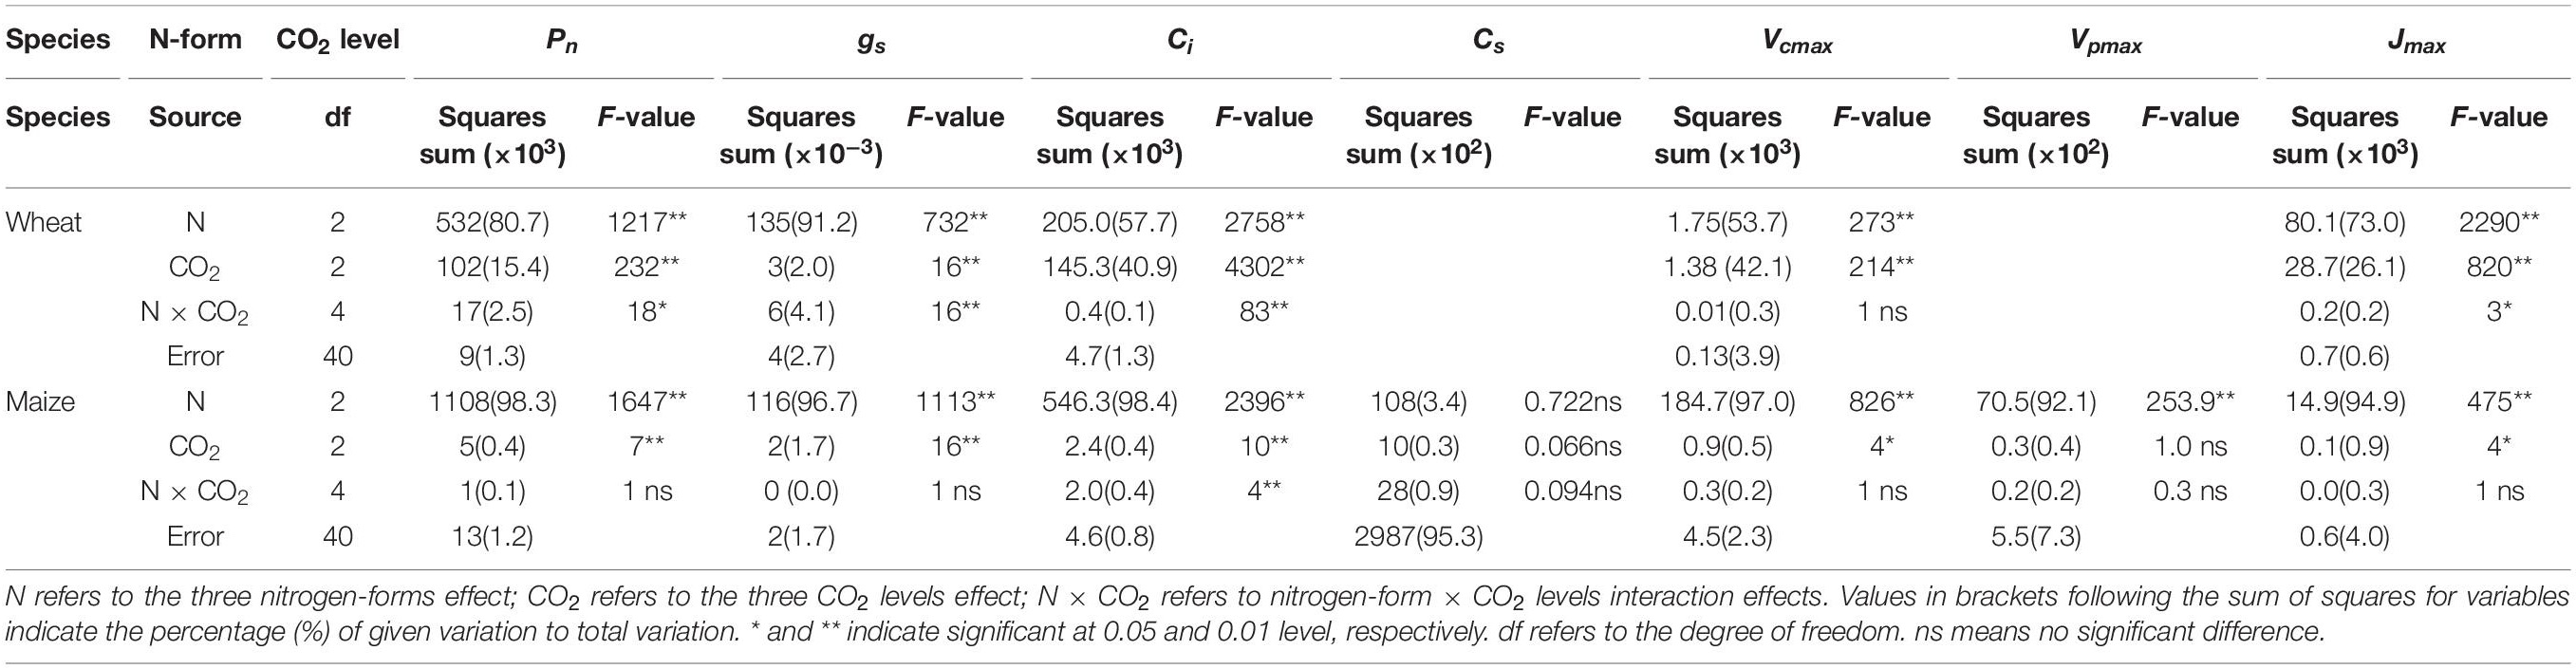
Table 2. F-values in two-way ANOVA analysis of Pn, gs, Ci, Cs, Vcmax, Vpmax, and Jmax in newly expanded leaves of C3 wheat and C4 maize seedlings after 21 days of treatment with different N-sources.
Electron Transport Parameters
Under Mix-N and NN, the Fv/Fm, ΦPSII and qL values of the two species did not vary significantly across different CO2 concentration (Figures 4A–C). The values of these parameters decreased with increasing CO2 concentration in maize plants under AN, but increased in wheat plants as CO2 concentrations rose. NPQ increased significantly under AN in comparison with the other treatments, but did not differ significantly by CO2 level (Figure 4D). The Fv/Fm, ΦPSII and qL values of wheat varied significantly by both N form and CO2 concentration, as observed for ΦPSII and qL in maize (but not for Fv/Fm). N form explained a larger proportion of the variance in these parameters in both species than CO2 concentration (Table 3). CO2 level accounted for a larger proportion of the variance in electron transport in wheat (8.9% for Fv/Fm, 5.1% for ΦPSII and 5.5% for qL) than in maize (0.0% for Fv/Fm, 0.5% for ΦPSII and 0.4% for qL).
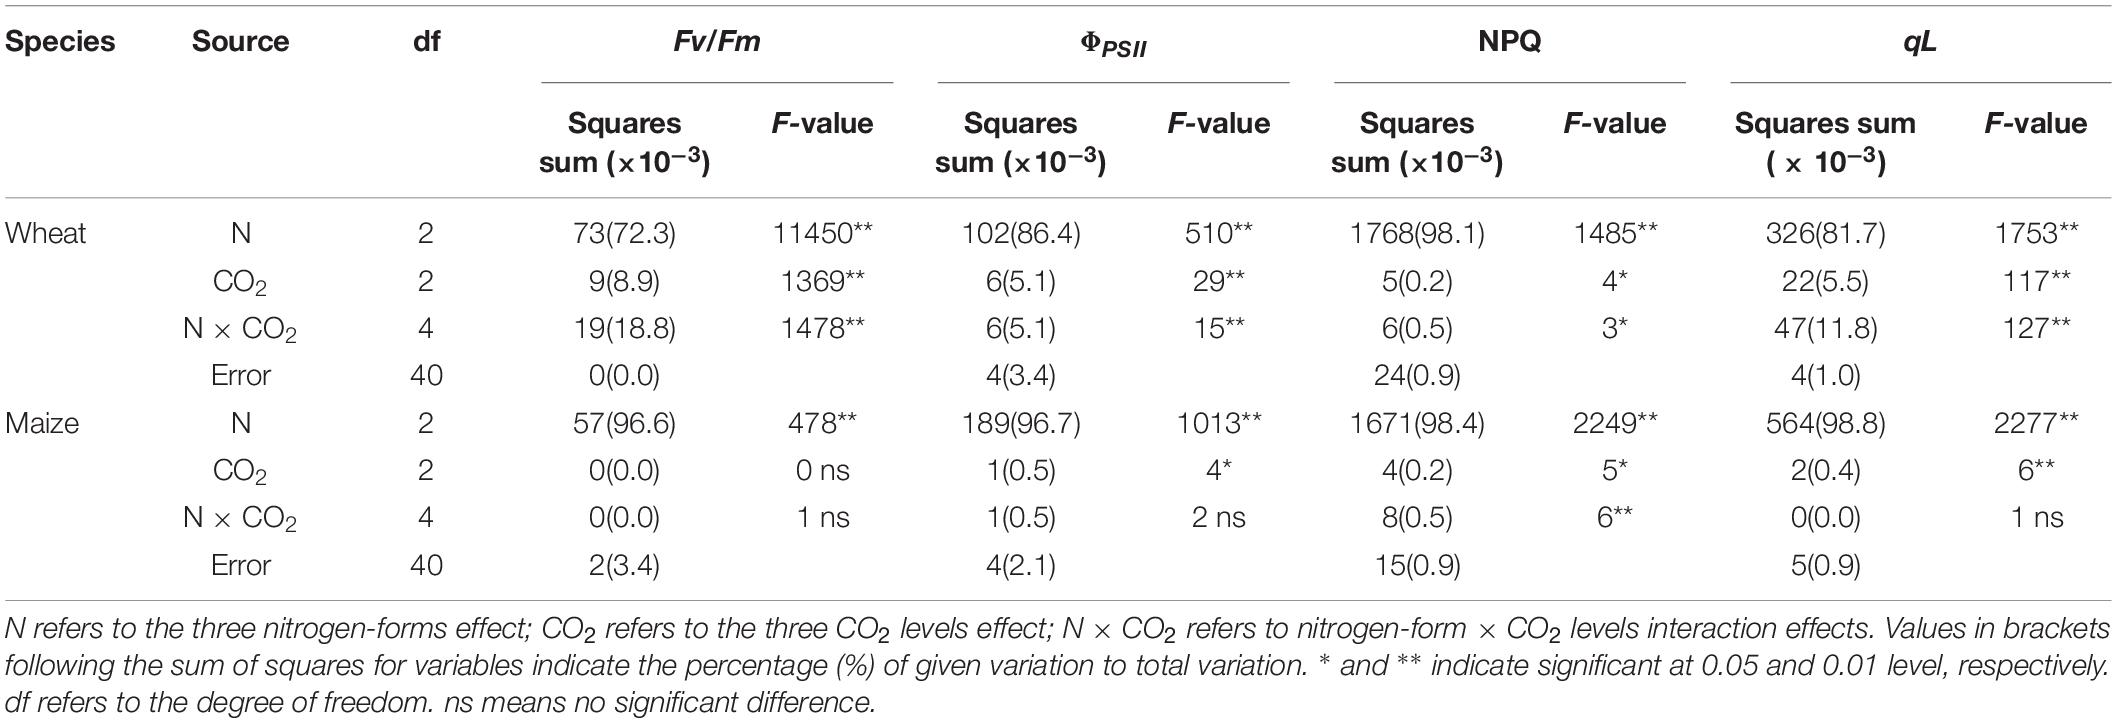
Table 3. F-values in two-way ANOVA analysis of Fv/Fm, ΦPSII, NPQ and qL in newly expanded leaves of C3 wheat and C4 maize seedlings after 21 days of treatment with different N-sources.
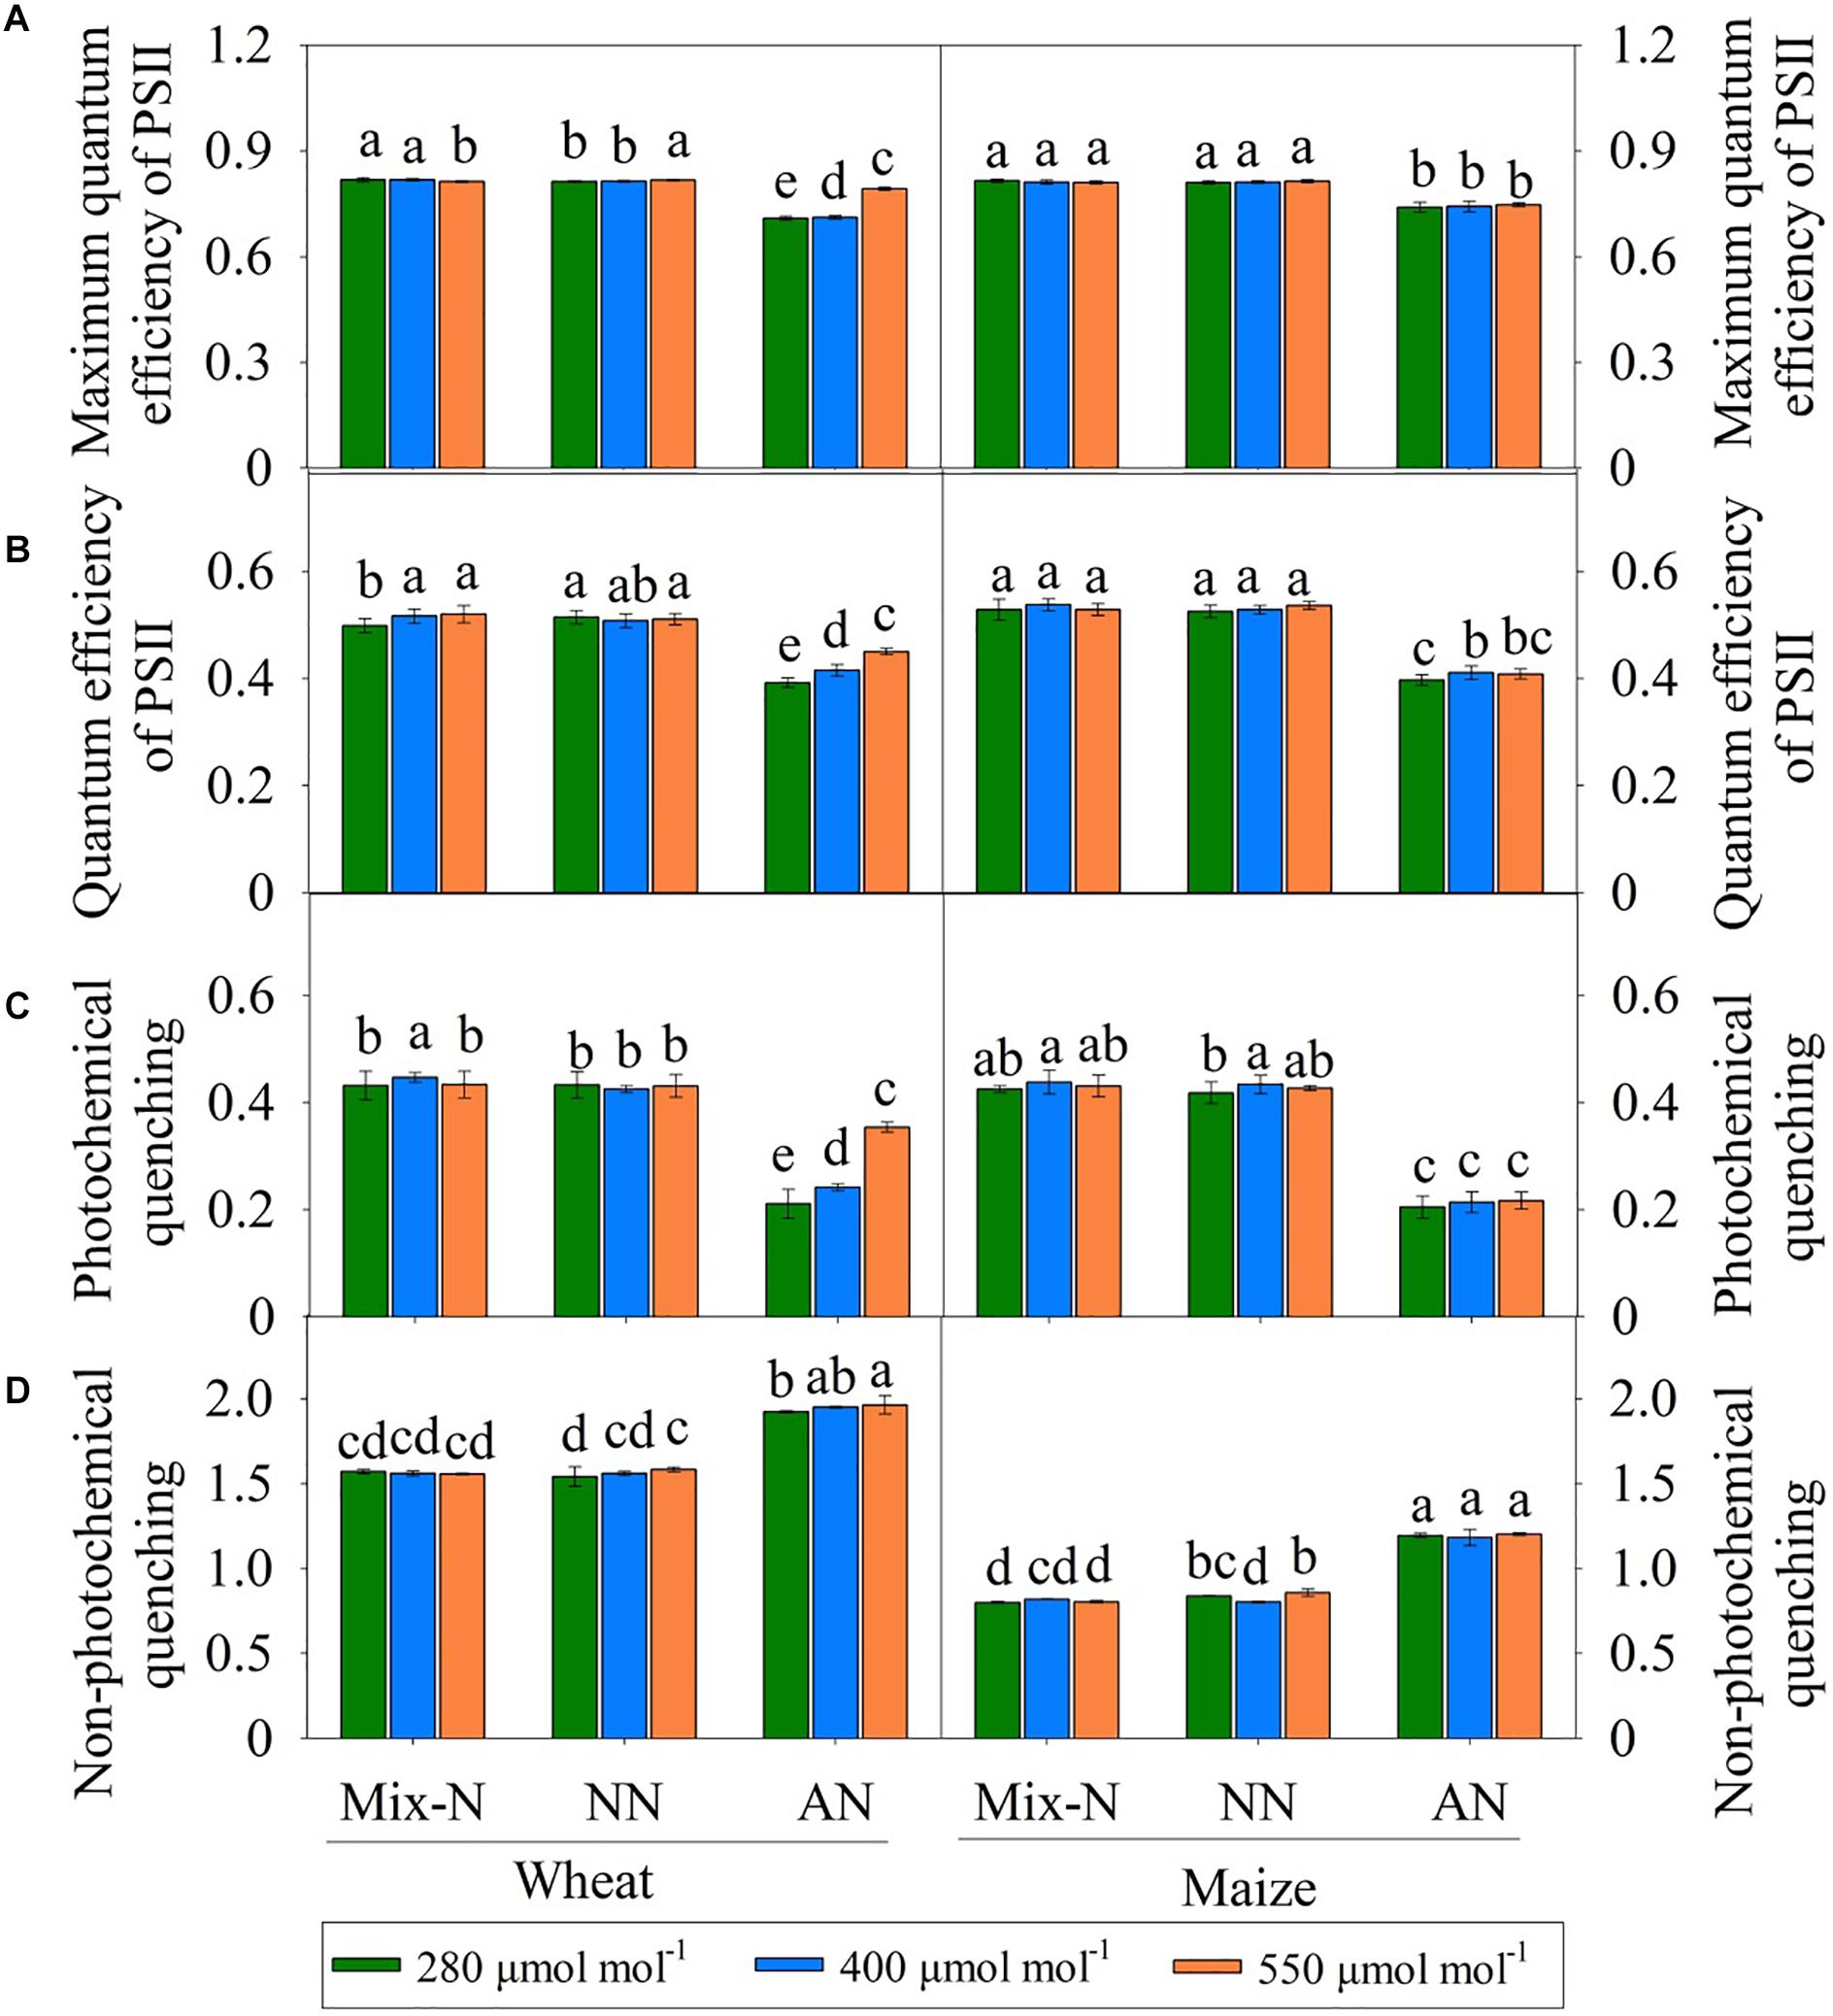
Figure 4. Effects of different CO2 levels on Fv/Fm (A), ΦPSII (B), NPQ (C), and qL (D) in newly expanded leaves of C3 wheat and C4 maize seedlings after 21 days of treatment with different N-sources. Data are means ± SE (n = 3); Lower-case letters indicate a significant difference at p < 0.05.
Under Mix-N and NN, the values of Jt for both species did not differ significantly across different CO2 concentration (Figure 5A). However, while the values of Jt for wheat plants under AN increased significantly with increasing CO2 concentration, this was not the case for maize. On day 21 of the experiment, AN reduced the Jt values to below those of plants under Mix-N, by 31%, 32% and 32% in maize at CO2 concentrations of 280, 400, or 550 μmol mol–1, respectively. The respective reductions in wheat were 38%, 30%, and 21%. The Je(PCR) values of wheat were higher under CO2 concentrations of 400 and 550 μmol mol–1 than under a concentration of 280 μmol mol–1. CO2 level had no significant effect on the Je(PCR) values of maize (Figure 5B). In comparison with the other treatments, AN significantly reduced Je(PCR) in both species. Under AN, the Je(PCR) values of wheat increased significantly with increasing CO2 concentration, but this was not the case for maize. When compared to other N form treatments, AN significantly reduced Je(PCO) in both species (Figure 5C) on day 21 of the experiment. The Je(PCR)/Je(PCO) ratio increased significantly with increasing CO2 concentration in wheat. The ratio in maize was unaffected by either CO2 level or N form (Figure 5D).
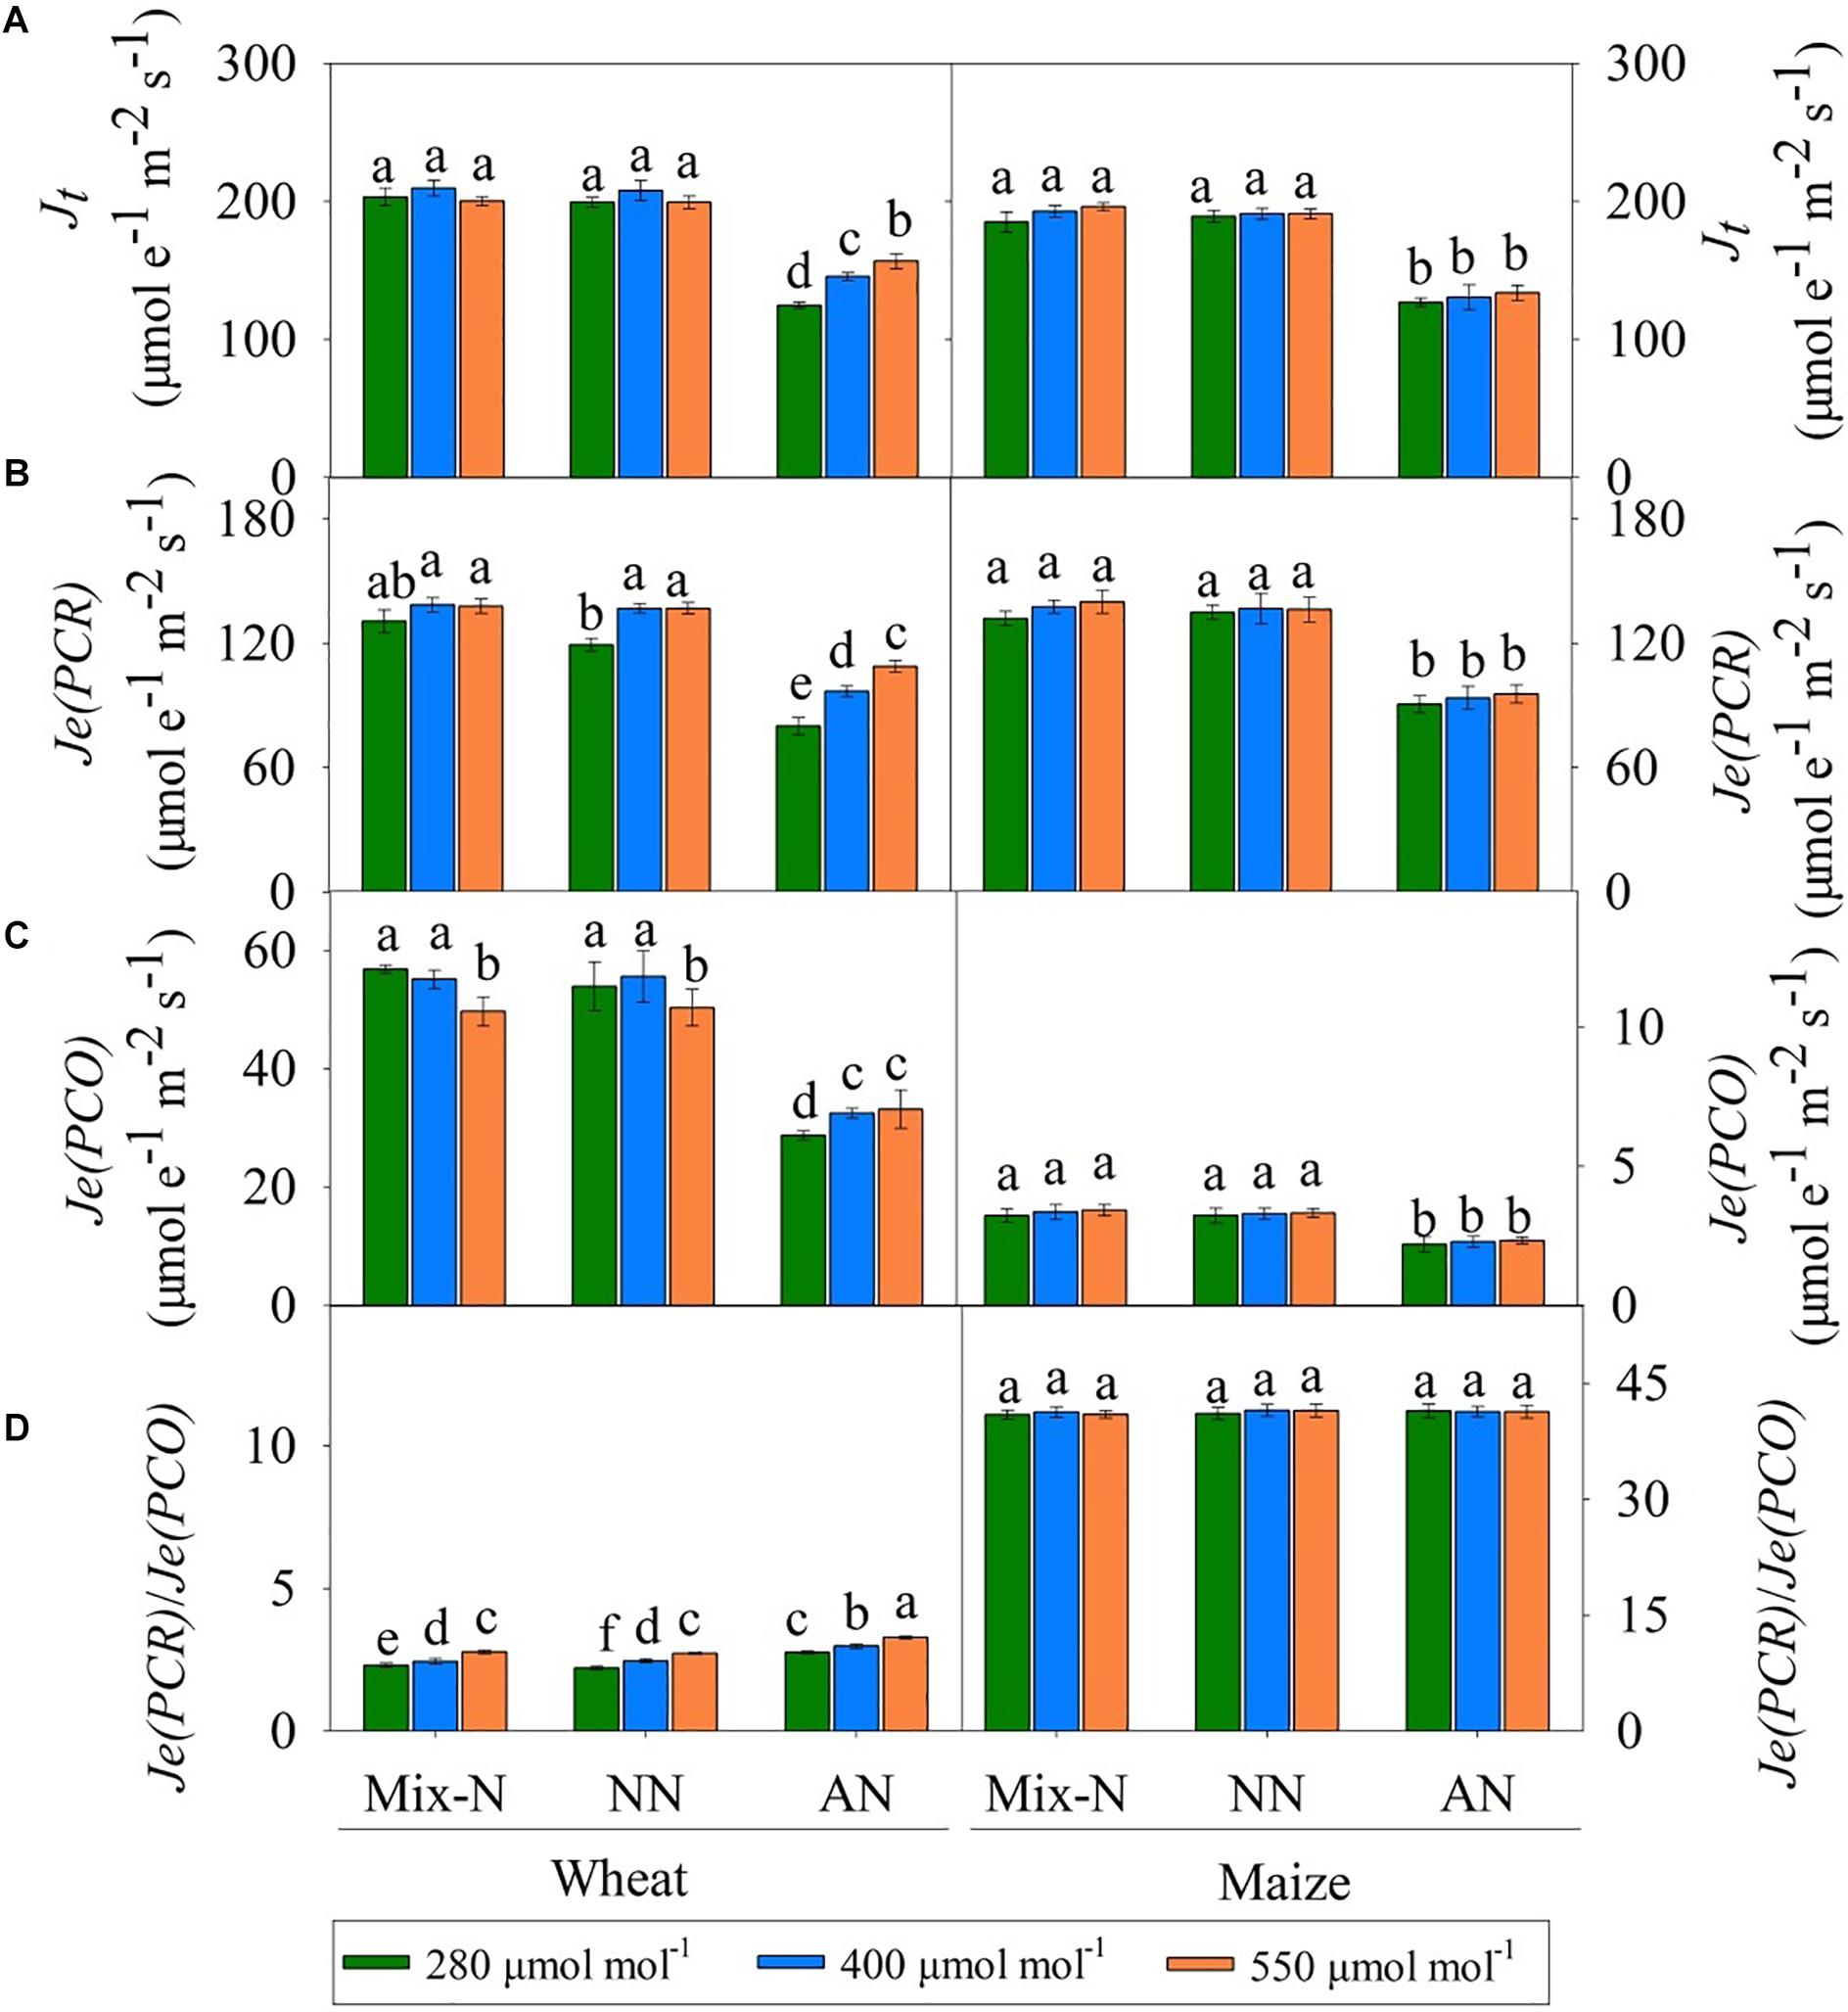
Figure 5. Effects of different CO2 levels on Jt (A), Je(PCR) (B), Je(PCO) (C), and ratio of Je(PCR)/ Je(PCO) (D) in newly expanded leaves of C3 wheat and C4 maize seedlings after 21 days of treatment with different N-sources. Data are means ± SE (n = 3); Lower-case letters indicate a significant difference at p < 0.05.
Jt, Je(PCR) Je(PCO) and the Je(PCR)/Je(PCO) ratio were significantly affected by N form and CO2 level in both species. N form explained a larger proportion of the variance in these parameters in both species (Table 4). In wheat, 40% of the variance in the Je(PCR)/Je(PCO) ratio could be attributed to CO2 level, but this factor accounted for only 2.9% of the variance in maize (Table 4).
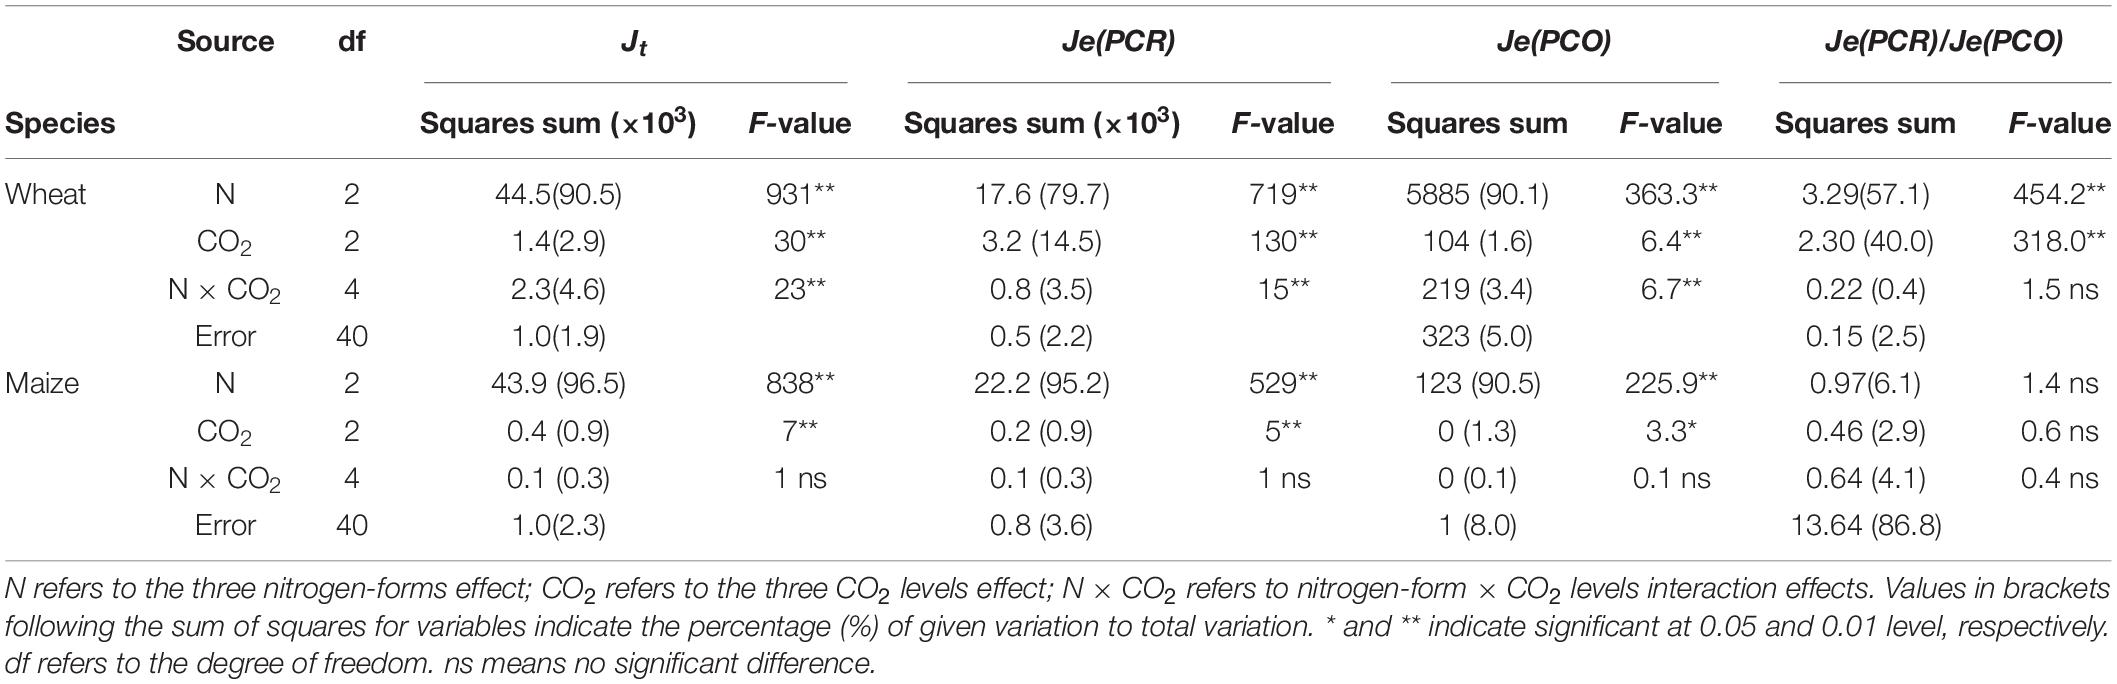
Table 4. F-values in two-way ANOVA analysis of Jt, Je(PCR), Je(PCO), and ratio of Je(PCR)/ Je(PCO) in newly expanded leaves of C3 wheat and C4 maize seedlings after 21 days of treatment with different N-sources.
Soluble Sugars
In comparison with the other N form treatments, AN markedly reduced the soluble sugar concentration in both species. Soluble sugar levels in the shoots and roots of wheat increased with increasing CO2 concentration, but this was not the case in maize (Figure 6).
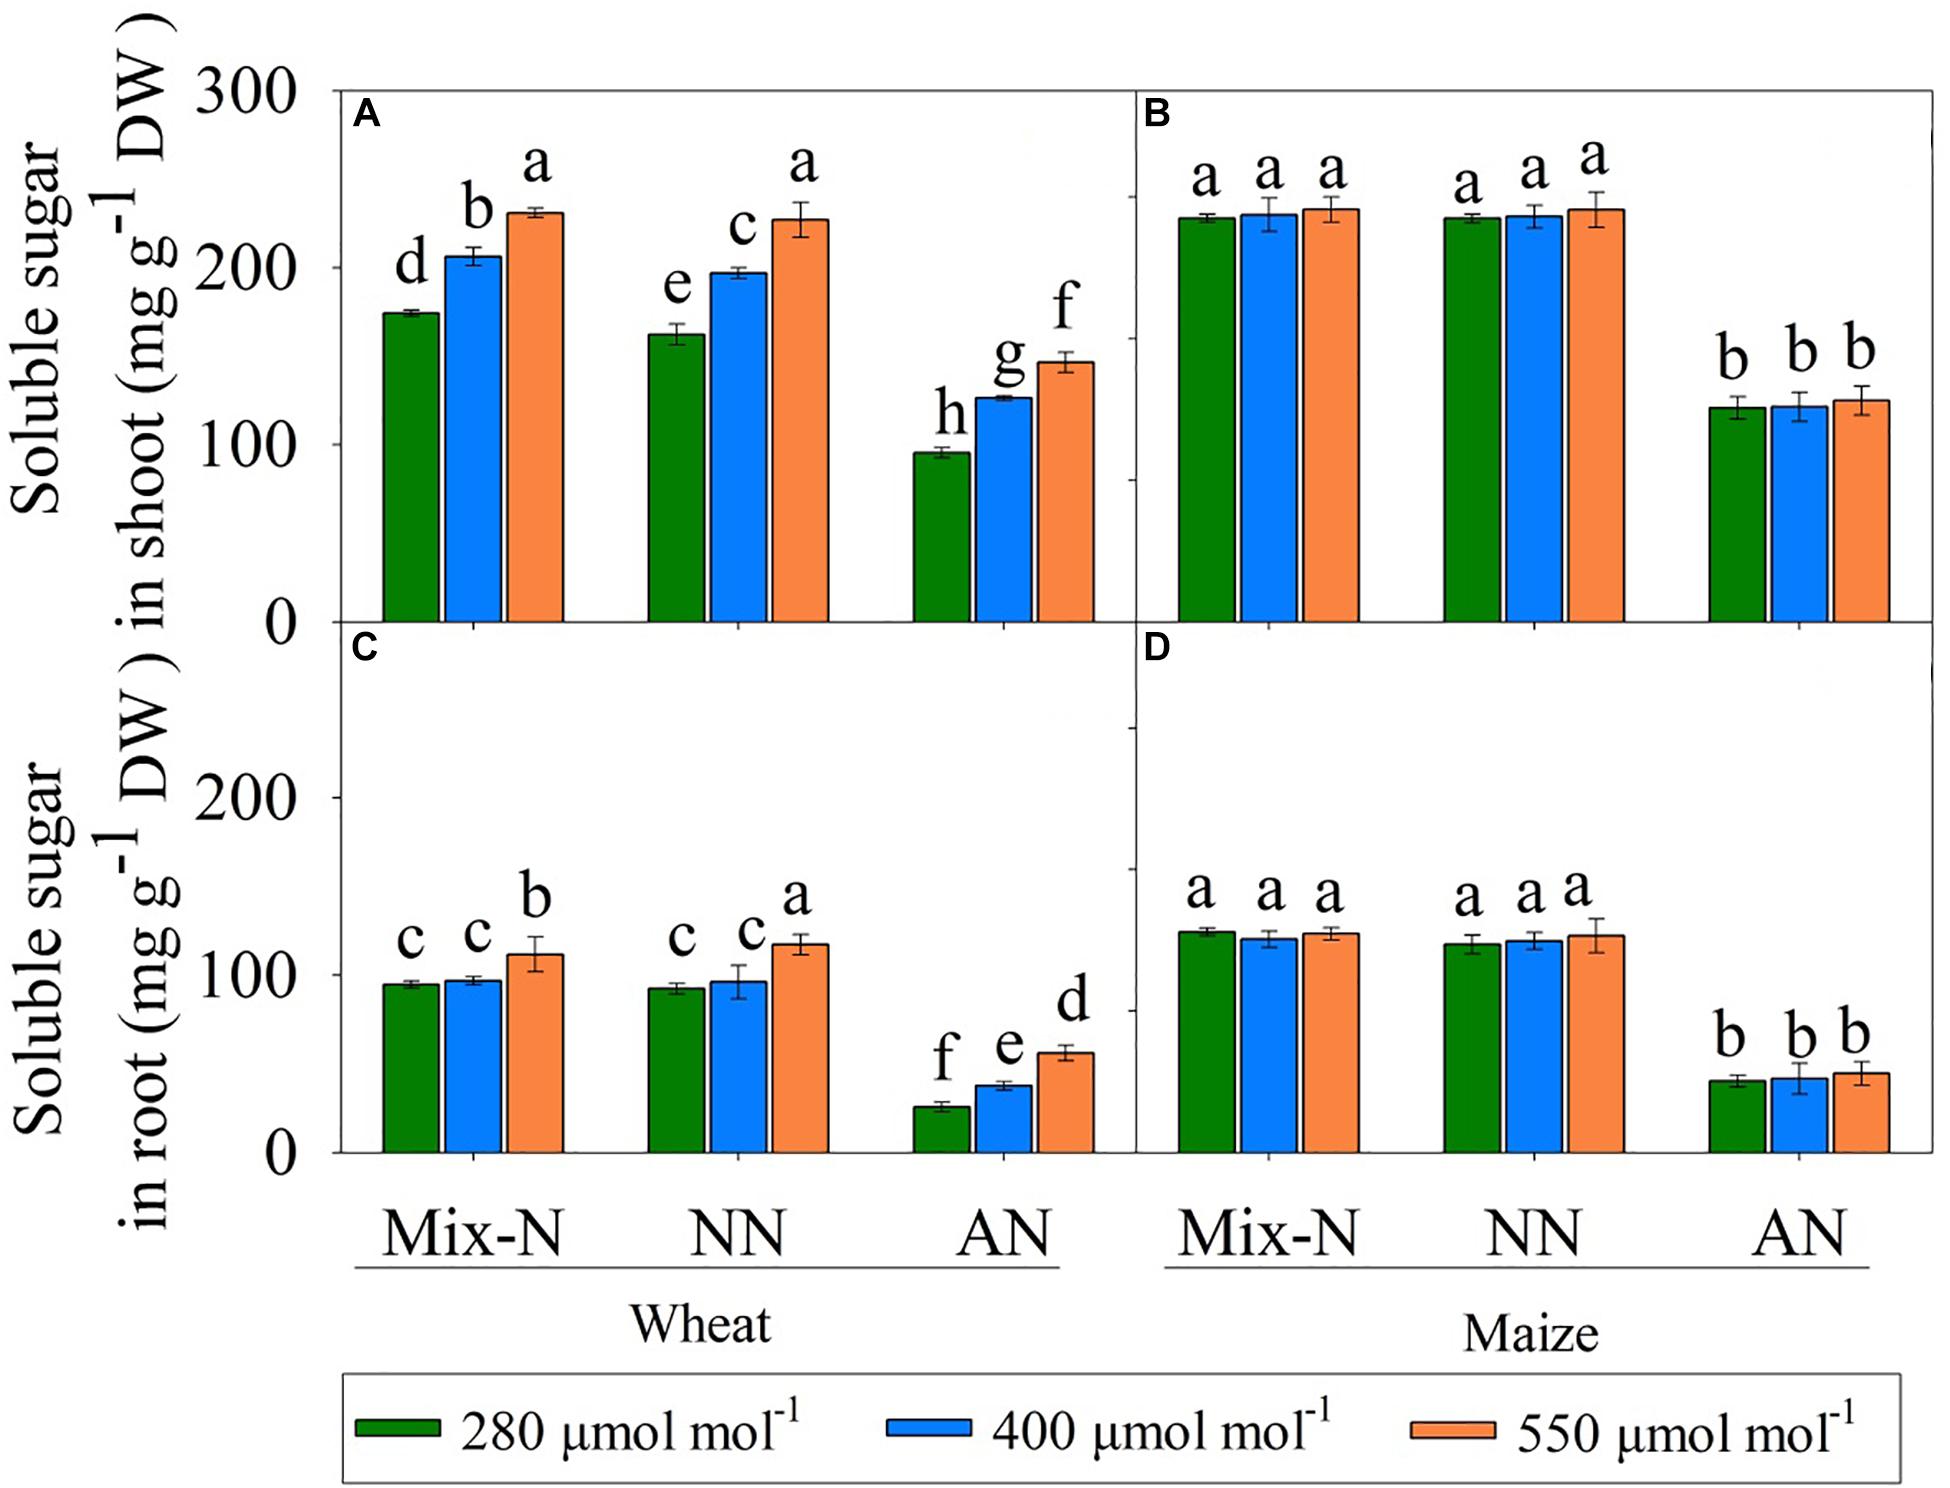
Figure 6. Effects of different CO2 levels on soluble sugar concentrations (mg g–1 DW) in shoots (A,B) and roots (C,D) of C3 wheat and C4 maize seedlings after 21 days of treatment with different N-sources. Data are means ± SE (n = 3); Lower-case letters indicate a significant difference at p < 0.05.
Discussion
Increased Atmospheric CO2 Concentrations Offset NH4+-Linked Stress in C3 Wheat but Not in C4 Maize
Unlike field or pot experiments, hydroponic experiments remove any potential complex interaction between ions and soil particles that might affect nutrient availability, and thus plant growth and development (Conn et al., 2013; Nguyen et al., 2016). We harnessed the hydroponic approach to study the responses of C3 wheat and C4 maize to different N forms and three levels of CO2 concentrations. In previous studies, the most obvious effect of AN was reduced biomass production (Britto and Kronzucker, 2002; Li et al., 2011; Wang et al., 2016b, 2019). In the present study, the Mix-N and NO3–-fed C3 wheat plants produced more dry biomass when the corresponding Ca concentration was increased, but this was not the case for C4 maize, corroborating the findings of Leakey et al. (2006). When Ca was low, the leaf-free NH4+ content was highest in C4 maize with NH4+ as the sole N source (Figure 2); concomitantly under these conditions, we recorded the lowest Pn values for maize (Figure 3).
In C3 wheat, AN-induced photosynthetic inhibition was ameliorated by increasing the Ca concentration, but this effect was insignificant in C4 maize (Figure 3). Franks et al. (2013) found that change in Ca concentration changes the rates of carboxylation by Rubisco (in C3 plants) and PEP carboxylase (in C4 plants); each of these enzymes has a crucial limiting step in the photosynthetic pathway. An initial increase in Pn (less pronounced in C4 plants) at or above the ambient Ca concentration occurs because of the unique CO2-concentrating mechanism associated with C4 photosynthesis (Ghannoum et al., 1997; von Caemmerer and Farquhar, 1999). In our study, we further explored (i) the potential limiting factors of Pn when C3 and C4 plants were grown under condition of NH4+-N nutrition, and (ii) the way in which changes in Ca concentration affected the potential NH4+ tolerance of C3 and C4 plants.
Impaired Electron Transfer Associated With NH4+ Inhibited Photosynthesis
Under atmospheric CO2 conditions, the carboxylation ability of Rubisco is the key factor limiting C3 photosynthesis (Li et al., 2009; Carmo-Silva et al., 2015). Vcmax, which represents the apparent Rubisco activity in vivo (Long and Bernacchi, 2003), increases with increasing CO2 concentration (Jordan and Ogren, 1984). We found that both wheat and maize plants had lower gs and Vcmax values under AN than under the other two N treatments, but Ci values were elevated under AN (Figure 3). Early CO2 enrichment experiments using crops and tree saplings demonstrated that gs was generally reduced by elevated CO2 concentrations; we noted a similar phenomenon in wheat (Figure 3) (Yong et al., 1997; Medlyn et al., 2001). In contrast, the Ci and Cs of maize changed less with increases in Ca, regardless of the type of N nutrition. Li et al. (2015) suggested that the increases in Ci may result from decreases in the rate of the photosynthetic dark CO2 reduction when gs is reduced in C3 plants.
Under ambient conditions, 44% of the absorbed light at peak PPFD was used for photosynthetic electron transport (25% for CO2 fixation, 19% for photorespiration), and the remaining 56% was dissipated by chlorophyll fluorescence and thermal energy generation (Demmig-Adams and Adams, 1992). The balance between photosynthetic electron harvesting and transport within the chloroplasts is important for CO2 assimilation based on the Calvin cycle (Demmig-Adams et al., 1989; Fryer et al., 1998; Shikanai, 2011). We found that Fv/Fm, ΦPSII, qL and Jt were reduced under conditions of NH4+ nutrition (Figures 4A–C, 5A), indicating that the energy available for CO2 assimilation was limited. Similar responses under conditions of NH4+ nutrition were reported by Johnson et al. (2011), where the photosynthetic electron transport chain was interrupted on the PSII side. The oxygen-evolving complex of PSII may be a direct target of NH4+, causing a marked decline in photosynthesis (Drath et al., 2008). We found significant reductions in Jmax, ΦPSII and Jt for both wheat and maize (Figures 3, 4B, 5A); the reductions for maize were especially marked, and led to deficiencies in NADPH and ATP availability for CO2 assimilation (Gao et al., 2018). Cousins and Bloom (2003) suggested that NO3– assimilation increases linear electron transfer and alleviates the photosynthetic ATP limitation in maize. In NH4+-fed plants, the inadequate energy supply for CO2 carboxylation may be a result of interruptions in the electron transport chain (Wang et al., 2019). With an impaired PSII, plants have a reduced capacity to dissipate excitation energy through qL, resulting in a surplus of light energy (Kim and Apel, 2013). We found that NPQ increased in both species (Figure 4D) via a process involving the scavenging of excess light energy through heat dissipation under conditions of NH4+ nutrition. This finding was consistent with a previous report showing that plants can dissipate excess excitation energy in the form of heat through NPQ when they encountered abiotic stresses (Demmig-Adams and Adams, 1992).
Higher Ca Enhanced CO2 Assimilation, Which Provided Additional C Skeletons for NH4+ Assimilation in C3 Plants
Under AN, the Jmax, ΦPSII and Jt values of wheat increased with increasing CO2 concentration (Figures 3, 4B, 5A), indicating that the interruption in electron transport can be offset by higher CO2 concentration; these parameters did not differ significantly for maize grown under different CO2 levels. At low atmospheric CO2 levels, Rubisco utilizes both CO2 and O2 (Edwards et al., 2010). The process of uptaking O2 leads to photorespiration, resulting in net losses of ≤40% of photosynthetic carbon under present day CO2 levels of 400 μmol mol–1 (Andrews and Lorimer, 1978; Sage, 2004; Bloom, 2015). C4 photosynthesis suppresses photorespiration by concentrating CO2 internally (Andrews and Lorimer, 1978; Ehleringer et al., 1991). Conversely, higher Ca increases the CO2 assimilation of C3 plants and thereby inhibiting photorespiration; C4 plants do not respond in this way (Andrews and Lorimer, 1978). We found that the Ci and Cc values of wheat under AN increased significantly with increased Ca, leading to increases in Je(PCR), whereas Je(PCO) did not change significantly (Figure 5D). As a result, the Je(PCR)/Je(PCO) ratio increased with increasing CO2 concentration under AN (Figure 5C). These findings indicated that the electron flux to CO2 assimilation was increased at higher CO2 concentrations, which may compensate for the decrease in electron transport ability seen under AN, thereby sustaining carbon assimilation. In maize, there were no significant differences in Ci, Cs or Je(PCR)/Je(PCO) by CO2 level on day 21 of the experiment (Figures 2, 5D).
Bloom et al. (2010) and Bloom (2015) found that (i) elevated CO2 inhibits nitrite (NO2–) transport into chloroplasts, (ii) the chloroplast stroma compete for reduced ferredoxin (Fdr), and (iii) elevated CO2 levels decrease photorespiration, thereby inhibiting shoot NO3– assimilation in C3 plants under elevated CO2 concentrations. In contrast, the first carboxylation reaction in the C4 carbon fixation pathway generates ample quantities of malate and NADH in the cytoplasm of mesophyll cells. This explains adequately the CO2-independent shoot NO3– assimilation in C4 plants (Bloom et al., 2010). However, since N assimilation occurs rapidly when NH4+ is the sole source of N nutrition, an adequate C skeleton supply for NH4+ assimilation is required to facilitate general physiological homoeostasis under elevated NH4+ concentrations (Ariz et al., 2013). Therefore, the carbohydrate status of plant tissues has an important role in the transition and adaptation to AN nutrition. A shortage of carbon assimilation for NH4+-form has been associated with a reduced level of soluble sugars in NH4+-grown plants (Setien et al., 2013). We found a significant decrease in the soluble sugar concentration in both species, especially in roots, under AN and ambient CO2 conditions (Figure 6). With increasing Ca, an increase in soluble sugar concentration and a decrease in free NH4+ concentration occurred in wheat, possibly because of an increase in CO2 photosynthetic capacity (Ariz et al., 2010, 2013). Therefore, in wheat, an increased Pn under AN, which was driven by elevated Ca levels, increased the supply of carbon skeleton for NH4+ assimilation, which in turn reduced the NH4+ concentrations and thereby ameliorating the NH4+ stress.
Conclusion
In conclusion, under ambient CO2 conditions and AN nutrition, electron transport was reduced in both the C3 wheat and C4 maize plants, leading to a suppression of photosynthetic carbon assimilation. In wheat growing under elevated atmospheric CO2 concentrations (Ca), increased Ci and Cc values improved electron flux to CO2 assimilation rather than to photorespiration, thus sustaining photosynthesis and alleviating NH4+-induced stress. In contrast, elevated Ca had a negligible effect on Ci and Cs in maize and, consequently, minor effects on photosynthesis. Therefore, future increases in atmospheric Ca should provide C3 plants with more opportunities to use NH4+ rather than relying on NO3– as a source of N fertilizers for crop production. Analyses using molecular biology and mutants to explain the possible physiological mechanisms in NH4+ tolerance of crop cultivars.
Data Availability Statement
All datasets generated for this study are included in the manuscript/Supplementary Material.
Author Contributions
FW and XH conceived the original screening and research plans. FW, JG, and XH supervised the experiments. FW performed most of the experiments, conceived the project, and wrote the article with salient contributions from all the authors in specific areas. FW, JG, JY, QW, JM, and XH supervised and completed the writing. All authors contributed to the article and approved the submitted version.
Funding
This work was supported by the 100 Talents Program of Chongqing (20710940) and the World-Class Biological Science Discipline Development Program at the Southwest University, China (100030/2120054019), the Chinese Postdoctoral Science Foundation (2017M622948) and the Chongqing Postdoctoral Science Foundation (Xm2017147), and Key R & D project of Zhejiang Province “R & D and application of green, safe and efficient fertilizers” (2020R20A50B01).
Conflict of Interest
The authors declare that the research was conducted in the absence of any commercial or financial relationships that could be construed as a potential conflict of interest.
Acknowledgments
The authors would like to thank Professor Hans Lambers (School of Biological Sciences, University of Western Australia) for guidance in writing the manuscript.
Supplementary Material
The Supplementary Material for this article can be found online at: https://www.frontiersin.org/articles/10.3389/fpls.2020.537443/full#supplementary-material
Abbreviations
Γ∗, the CO2 compensation point related to Ci; φ, apparent quantum yield; Φ PSII, quantum efficiency of PSII; Ca, atmospheric CO2 concentration; Cc, chloroplastic CO2 concentration; CE, carboxylation efficiency; Ci, intercellular CO2 concentration; Cm, CO2 concentrations in the mesophyll cells; Cs, CO2 concentrations in the bundle sheath; C treatment, the CO2 concentration treatment of each sample; FACE, free-air CO2 enrichment; Fm, the maximum chlorophyll fluorescence with dark-adaptation; Fm’, the maximum fluorescence with light-adaptation; Fo, the minimum chlorophyll fluorescence with dark-adaptation; Fo’, the minimum chlorophyll fluorescence with light-adaptation; Fs, steady state fluorescence with light-adaptation; Fv/Fm, maximum quantum efficiency of PSII; gm, mesophyll conductance; gs, stomatal conductance; Ja, alternative electron flux; Jcmax, maximum carboxylation rates limited by RuBP regeneration; Je(PCO), electron fluxes to photosynthetic carbon oxidation; Je(PCR), electron fluxes to photorespiratory carbon reduction; Jmax, maximum electron transport rates; LHC, light-harvesting complex; Mix-N, a mixture of both NO3– and NH4+ source; NPQ, non-photochemical quenching; NUE, nitrogen use efficiency; OTC, open-top chambers; Pn, net photosynthetic rate; PPFD, photon flux intensity; PSII, photosystem II; PVC, polyvinyl chloride; qL, photochemical quenching; Rd, mitochondrial respiration rate in the light; ROS, reactive oxygen species; Rubisco, ribulose-1,5-bisphosphate carboxylase/oxygenase; vc, the carboxylation rate; Vcmax, maximum carboxylation rate limited by Rubisco; vo, the oxygenation rate; Vpdl, the vapor pressure deficit; Vpmax, the maximal rate of PEP carboxylation; wc, the potential Rubisco carboxylation rate; wj, the potential RuBP regeneration rate; wp, the potential triose-phosphate utilization rate.
References
Anderson, L. J., Maherali, H., Johnson, H. B., Polley, H. W., and Jackson, R. B. (2001). Gas exchange and photosynthetic acclimation over subambient to elevated CO2 in a C3-C4 grassland. Global Change Biol. 7, 693–707. doi: 10.1046/j.1354-1013.2001.00438.x
Andrews, T. J., and Lorimer, G. H. (1978). Photorespiration-still still unavoidable? FEBS Lett. 90, 1–9. doi: 10.1016/0014-5793(78)80286-5
Aranjuelo, I., Pardo, A., Biel, C., Save, R., Azcon-Bieto, J., and Nogues, S. (2009). Leaf carbon management in slow-growing plants exposed to elevated CO2. Global Change Biol. 15, 97–109. doi: 10.1111/j.1365-2486.2008.01829.x
Ariz, I., Artola, E., Asensio, A. C., Cruchaga, S., Aparicio-Tejo, P. M., and Moran, J. F. (2011). High irradiance increases NH4+ tolerance in Pisum sativum: higher carbon and energy availability improve ion balance but not N assimilation. J. Plant Physiol. 168, 1009–1015. doi: 10.1016/j.jplph.2010.11.022
Ariz, I., Asensio, A. C., Zamarreno, A. M., Garcia-Mina, J. M., Aparicio-Tejo, P. M., and Moran, J. F. (2013). Changes in the C/N balance caused by increasing external ammonium concentrations are driven by carbon and energy availabilities during ammonium nutrition in pea plants: the key roles of asparagine synthetase and anaplerotic enzymes. Physiol. Plant. 148, 522–537. doi: 10.1111/j.1399-3054.2012.01712.x
Ariz, I., Esteban, R., García-Plazaola, J. I., Becerril, J. M., Aparicio-Tejo, P. M., and Moran, J. F. (2010). High irradiance induces photoprotective mechanisms and a positive effect on NH4+ stress in Pisum sativum L. J. Plant Physiol. 167, 1038–1045. doi: 10.1016/j.jplph.2010.02.014
Balkos, K. D., Britto, D. T., and Kronzucker, H. J. (2010). Optimization of ammonium acquisition and metabolism by potassium in rice (Oryza sativa L. cv. IR-72). Plant Cell Environ. 33, 23–34.
Bloom, A. J. (2015). Photorespiration and nitrate assimilation: a major intersection between plant carbon and nitrogen. Photosynth. Res. 123, 117–128. doi: 10.1007/s11120-014-0056-y
Bloom, A. J., Burger, M., Asensio, J. S. R., and Cousins, A. B. (2010). Carbon dioxide enrichment inhibits nitrate assimilation in wheat and Arabidopsis. Science 328, 899–903. doi: 10.1126/science.1186440
Bloom, A. J., Burger, M., Kimball, B. A., and Pinter, P. J. (2014). Nitrate assimilation is inhibited by elevated CO2 in field-grown wheat. Nat. Clim. Chang. 4:477. doi: 10.1038/nclimate2183
Bloom, A. J., Smart, D. R., Nguyen, D. T., and Searles, P. S. (2002). Nitrogen assimilation and growth of wheat under elevated carbon dioxide. Proc. Natl. Acad. Sci. U. S. A. 99, 1730–1735. doi: 10.1073/pnas.022627299
Britto, D. T., and Kronzucker, H. J. (2002). NH4+ toxicity in higher plants: a critical review. J. Plant Physiol. 159, 567–584. doi: 10.1078/0176-1617-0774
Carmo-Silva, E., Scales, J. C., Madgwick, P. J., and Parry, M. A. (2015). Optimizing Rubisco and its regulation for greater resource use efficiency. Plant, Cell Environ. 38, 1817–1832. doi: 10.1111/pce.12425
Conn, S. J., Hocking, B., Dayod, M., Xu, B., Athman, A., Henderson, S., et al. (2013). Protocol: optimising hydroponic growth systems for nutritional and physiological analysis of Arabidopsis thaliana and other plants. Plant Methods 9:4. doi: 10.1186/1746-4811-9-4
Coskun, D., Britto, D. T., Shi, W., and Kronzucker, H. J. (2017). Nitrogen transformations in modern agriculture and the role of biological nitrification inhibition. Nat. Plants 3:17074.
Cousins, A. B., and Bloom, A. J. (2003). Influence of elevated CO2 and nitrogen nutrition on photosynthesis and nitrate photossimilation in maize (Zea mays L.). Plant Cell Environ. 26, 1525–1530. doi: 10.1046/j.1365-3040.2003.01075.x
Demmig-Adams, B., and Adams, W. I. I. I. (1992). Photoprotection and other responses of plants to high light stress. Ann. Rev. Plant Biol. 43, 599–626. doi: 10.1146/annurev.pp.43.060192.003123
Demmig-Adams, B., Winter, K., Krüger, A., and Czygan, F. C. (1989). Light response of CO2 assimilation, dissipation of excess excitation energy, and zeaxanthin content of sun and shade leaves. Plant Physiol. 90, 881–886. doi: 10.1104/pp.90.3.881
Dier, M., Meinen, R., Erbs, M., Kollhorst, L., Baillie, C. K., Kaufholdt, D., et al. (2018). Effects of free air carbon dioxide enrichment (FACE) on nitrogen assimilation and growth of winter wheat under nitrate and ammonium fertilization. Global Change Biol. 24, e40–e54.
Drath, M., Kloft, N., Batschauer, A., Marin, K., Novak, J., and Forchhammer, K. (2008). Ammonia triggers photodamage of photosystem II in the cyanobacterium Synechocystis sp. strain PCC 6803. Plant Physiol. 147, 206–215. doi: 10.1104/pp.108.117218
Edwards, E. J., Osborne, C. P., Strömberg, C. A., Smith, S. A., and Consortium, C. G. (2010). The origins of C4 grasslands: integrating evolutionary and ecosystem science. Science 328, 587–591. doi: 10.1126/science.1177216
Ehleringer, J. R., Sage, R. F., Flanagan, L. B., and Pearcy, R. W. (1991). Climate change and the evolution of C4 photosynthesis. Trends Ecol. Evol.. 6:95. doi: 10.1016/0169-5347(91)90183-x
Farquhar, G. D., von Caemmerer, and Berry, J. (1980). A biochemical model of photosynthetic CO2 assimilation in leaves of C3 species. Planta 149, 78–90. doi: 10.1007/bf00386231
Fernández-Crespo, E., Camañes, G., and García-Agustín, P. (2012). Ammonium enhances resistance to salinity stress in citrus plants. J. Plant Physiol. 169, 1183–1191. doi: 10.1016/j.jplph.2012.04.011
Franks, P. J., Adams, M. A., Amthor, J. S., Barbour, M. M., Berry, J. A., Ellsworth, D. S., et al. (2013). Sensitivity of plants to changing atmospheric CO2 concentration: from the geological past to the next century. New Phytol. 197, 1077–1094. doi: 10.1111/nph.12104
Fryer, M. J., Andrews, J. R., Oxborough, K., Blowers, D. A., and Baker, N. R. (1998). Relationship between CO2 assimilation, photosynthetic electron transport, and active O2 metabolism in leaves of maize in the field during periods of low temperature. Plant Physiol. 116, 571–580. doi: 10.1104/pp.116.2.571
Gao, J., Wang, F., Sun, J., Tian, Z., Hu, H., Jiang, S., et al. (2018). Enhanced Rubisco activation associated with maintenance of electron transport alleviates inhibition of photosynthesis under low nitrogen conditions in winter wheat seedlings. J. Exp. Botany 69, 5477–5488.
Genty, B., Briantais, J. M., and Baker, N. R. (1989). The relationship between the quantum yield of photosynthetic electron transport and quenching of chlorophyll fluorescence. Biochim. Biophys. Acta Gen. Subj. 990, 87–92. doi: 10.1016/s0304-4165(89)80016-9
Ghannoum, O., Caemmerer, S., Ziska, L. H., and Conroy, J. P. (2000). The growth response of C4 plants to rising atmospheric CO2 partial pressure: a reassessment. Plant Cell Environ. 23, 931–942. doi: 10.1046/j.1365-3040.2000.00609.x
Ghannoum, O., von Caemmerer, S., Barlow, E. W., and Conroy, J. P. (1997). The effect of CO2 enrichment and irradiance on the growth, morphology and gas exchange of a C3 (Panicum laxum) and a C4 (Panicum antidotale) grass. Funct. Plant Biol. 24, 407–407. doi: 10.1071/pp96077_co
Gong, P., Liang, L., and Zhang, Q. (2011). China must reduce fertilizer use too. Nature 473, 284–285. doi: 10.1038/473284e
Hatch, M. D., and Slack, C. R. (1966). Photosynthesis by sugar-cane leaves: a new carboxylation reaction and the pathway of sugar formation. Biochem. J. 101, 103–111. doi: 10.1042/bj1010103
IPCC (2007). Agriculture: Contribution of Working Group III to the Fourth Assessment Report of the Intergovernmental Panel on Climate Change, eds B. Metz, O. R. Davidson, P. R. Bosch, R. Dave, and L. A. Meyer (Cambridge, New York, NY: Cambridge University Press), 497–540.
IPCC (2013). Climate Change 2013: The Physical Science Basis. Contribution of Working Group I to the Fifth Assessment Report of the Intergovernmental Panel on Climate Change, eds T. F. Stocker, D. Qin, G. K. Plattner, M. Tignor, S. K. Allen, J. Boschung, et al. (Cambridge, New York, NY: Cambridge University Press).
Johnson, M. P., Goral, T. K., Duffy, C. D., Brain, A. P., Mullineaux, C. W., and Ruban, A. V. (2011). Photoprotective energy dissipation involves the reorganization of photosystem II light-harvesting complexes in the grana membranes of spinach chloroplasts. Plant Cell 23, 1468–1479. doi: 10.1105/tpc.110.081646
Jordan, D. B., and Ogren, W. L. (1984). The CO2/O2 specificity of ribulose 1, 5-bisphosphate carboxylase/oxygenase. Planta 161, 308–313.
Kanemoto, K., Yamashita, Y., Ozawa, T., Imanishi, N., Nguyen, N. T., Suwa, R., et al. (2009). Photosynthetic acclimation to elevated CO2 is dependent on N partitioning and transpiration in soybean. Plant Sci. 177, 398–403. doi: 10.1016/j.plantsci.2009.06.017
Kim, C., and Apel, K. (2013). Singlet oxygen-mediated signaling in plants: moving from flu to wild type reveals an increasing complexity. Photosynth. Res. 116, 455–464. doi: 10.1007/s11120-013-9876-4
Kramer, D. M., Johnson, G., Kiirats, O., and Edwards, G. E. (2004). New fluorescence parameters for the determination of QA redox state and excitation energy fluxes. Photosynth. Res. 79:209. doi: 10.1023/b:pres.0000015391.99477.0d
Kühlbrandt, W., Wang, D. N., and Fujiyoshi, Y. (1994). Atomic model of plant light-harvesting complex by electron crystallography. Nature 367, 614–621. doi: 10.1038/367614a0
Leakey, A. D., Uribelarrea, M., Ainsworth, E. A., Naidu, S. L., Rogers, A., Ort, D. R., et al. (2006). Photosynthesis, productivity, and yield of maize are not affected by open-air elevation of CO2 concentration in the absence of drought. Plant Physiol. 140, 779–790. doi: 10.1104/pp.105.073957
Li, B., Shi, W., and Su, Y. (2011). The differing responses of two Arabidopsis ecotypes to ammonium are modulated by the photoperiod regime. Acta Physiol. Plant. 33, 325–334. doi: 10.1007/s11738-010-0551-5
Li, H., Wang, Y., Xiao, J., and Xu, K. (2015). Reduced photosynthetic dark reaction triggered by ABA application increases intercellular CO2 concentration, generates H2O2 and promotes closure of stomata in ginger leaves. Environ. Exp. Bot. 113, 11–17. doi: 10.1016/j.envexpbot.2015.01.002
Li, Y., Gao, Y., Xu, X., Shen, Q., and Guo, S. (2009). Light-saturated photosynthetic rate in high-nitrogen rice (Oryza sativa L.) leaves is related to chloroplastic CO2 concentration. J. Exp. Bot. 60, 2351–2360. doi: 10.1093/jxb/erp127
Lloyd, J., and Farquhar, G. D. (1996). The CO2 dependence of photosynthesis, plant growth responses to elevated atmospheric CO2 concentrations and their interaction with soil nutrient status. I. General principles and forest ecosystems. Funct. Ecol. 10, 4–32. doi: 10.2307/2390258
Long, S. P., and Bernacchi, C. J. (2003). Gas exchange measurements, what can they tell us about the underlying limitations to photosynthesis? Procedures and sources of error. J. Exp. Bot. 54, 2393–2401. doi: 10.1093/jxb/erg262
Medlyn, B., Barton, C. V. M., Broadmeadow, M. S. J., Ceulemans, R., De Angelis, P., Forstreuter, M., et al. (2001). Stomatal conductance of forest species after long-term exposure to elevated CO2 concentration: a synthesis. New Phytol. 149, 247–264. doi: 10.1046/j.1469-8137.2001.00028.x
Mehrer, I., and Mohr, H. (1989). Ammonium toxicity: description of the syndrome in Sinapis alba and the search for its causation. Physiol. Plant. 77, 545–554. doi: 10.1111/j.1399-3054.1989.tb05390.x
Miller, A. J., and Cramer, M. D. (2005). Root nitrogen acquisition and assimilation. Plant Soil 274, 1–36. doi: 10.1007/1-4020-4099-7_1
Nguyen, N. T., McInturf, S. A., and Mendoza-Cózatl, D. G. (2016). Hydroponics: a versatile system to study nutrient allocation and plant responses to nutrient availability and exposure to toxic elements. J. Vis. Exp. 113:e54317.
Onoda, Y., Hikosaka, K., and Hirose, T. (2004). Allocation of nitrogen to cell walls decreases photosynthetic nitrogen-use efficiency. Funct. Ecol. 18, 419–425. doi: 10.1111/j.0269-8463.2004.00847.x
Owensby, C. E., Ham, J. M., Knapp, A. K., and Auen, L. M. (1999). Biomass production and species composition change in a tallgrass prairie ecosystem after long-term exposure to elevated atmospheric CO2. Global Change Biol. 5, 497–506. doi: 10.1046/j.1365-2486.1999.00245.x
Richter, J., and Roelcke, M. (2000). The N-cycle as determined by intensive agriculture–examples from central Europe and China. Nutr. Cycl. Agroecosyst. 57, 33–46.
Robredo, A., Pérez-López, U., Miranda-Apodaca, J., Lacuesta, M., Mena-Petite, A., and Muñoz-Rueda, A. (2011). Elevated CO2 reduces the drought effect on nitrogen metabolism in barley plants during drought and subsequent recovery. Environ. Exp. Bot. 71, 399–408. doi: 10.1016/j.envexpbot.2011.02.011
Setien, I., Fuertes-Mendizabal, T., Gonzalez, A., Aparicio-Tejo, P. M., Gonzalez-Murua, C., Gonzalez-Moro, M. B., et al. (2013). High irradiance improves ammonium tolerance in wheat plants by increasing N assimilation. J. Plant Physiol. 170, 758–771. doi: 10.1016/j.jplph.2012.12.015
Shikanai, T. (2011). Regulation of photosynthetic electron transport. Biochim. Biophys. Acta 1807, 375–383.
von Caemmerer, S., and Farquhar, G. D. (1999). “The modelling of C4 photosynthesis,” in The Biology of C4. Photosynthesis, ed. R. M. Sage (New York, NY: Academic Press)), 173–211.
Wang, F., Gao, J., Liu, Y., Tian, Z., Muhammad, A., Zhang, Y., et al. (2016a). Higher ammonium transamination capacity can alleviate glutamate inhibition on winter wheat (Triticum aestivum L.) root growth under high ammonium stress. PLoS One 11:e0160997. doi: 10.1371/journal.pone.0160997
Wang, F., Gao, J., Shi, S., He, X., and Dai, T. (2019). Impaired electron transfer accounts for the photosynthesis inhibition in wheat seedlings (Triticum aestivum L.) subjected to ammonium stress. Physiol. Plant. 167, 159–172. doi: 10.1111/ppl.12878
Wang, F., Gao, J., Tian, Z., Liu, Y., Abid, M., Jiang, D., et al. (2016b). Adaptation to rhizosphere acidification is a necessary prerequisite for wheat (Triticum aestivum L.) seedling resistance to ammonium stress. Plant Physiol. Biochem. 108, 447–455. doi: 10.1016/j.plaphy.2016.08.011
Xing, G., and Zhu, Z. (2000). An assessment of N loss from agricultural fields to the environment in China. Nutr. Cycl. Agroecosyst. 57, 67–73.
Xu, G., Fan, X., and Miller, A. J. (2012). Plant nitrogen assimilation and use efficiency. Ann. Rev. Plant Biol. 63, 153–182. doi: 10.1146/annurev-arplant-042811-105532
Yong, J. W. H., Letham, D. S., Wong, S. C., and Farquhar, G. D. (2010). Effects of root restriction on growth and associated cytokinin levels in cotton (Gossypium hirsutum). Funct. Plant Biol. 3, 974–984. doi: 10.1071/fp10009
Yong, J. W. H., Wong, S. C., and Farquhar, G. D. (1997). Stomatal responses to changes in vapour pressure difference between leaf and air. Plant Cell Environ. 20, 1213–1216. doi: 10.1046/j.1365-3040.1997.d01-27.x
Yong, J. W. H., Wong, S. C., Letham, D. S., Hocart, C. H., and Farquhar, G. D. (2000). Effects of elevated CO2 and nitrogen nutrition on cytokinins in the xylem sap and leaves of cotton. Plant Physiol. 124, 767–780. doi: 10.1104/pp.124.2.767
Zhou, Y. H., Yu, J. Q., Huang, L. F., and Nogues, S. (2004). The relationship between CO2 assimilation, photosynthetic electron transport and water-water cycle in chill-exposed cucumber leaves under low light and subsequent recovery. Plant Cell Environ. 27, 1503–1514. doi: 10.1111/j.1365-3040.2004.01255.x
Keywords: atmospheric CO2, ecophysiology, electron transport, NH4+ stress, photosynthesis, Triticum aestivum, Zea mays
Citation: Wang F, Gao J, Yong JWH, Wang Q, Ma J and He X (2020) Higher Atmospheric CO2 Levels Favor C3 Plants Over C4 Plants in Utilizing Ammonium as a Nitrogen Source. Front. Plant Sci. 11:537443. doi: 10.3389/fpls.2020.537443
Received: 24 February 2020; Accepted: 05 November 2020;
Published: 02 December 2020.
Edited by:
Fulai Liu, University of Copenhagen, DenmarkReviewed by:
Zhaozhong Feng, Research Center for Eco-environmental Sciences (CAS), ChinaXiancan Zhu, Anhui Normal University, China
Xiangnan Li, Northeast Institute of Geography and Agroecology, Chinese Academy of Sciences, China
Copyright © 2020 Wang, Gao, Yong, Wang, Ma and He. This is an open-access article distributed under the terms of the Creative Commons Attribution License (CC BY). The use, distribution or reproduction in other forums is permitted, provided the original author(s) and the copyright owner(s) are credited and that the original publication in this journal is cited, in accordance with accepted academic practice. No use, distribution or reproduction is permitted which does not comply with these terms.
*Correspondence: Feng Wang, wangfeng@zaas.ac.cn; Junwei Ma, majw@zaas.ac.cn; Xinhua He, xinhua.he@uwa.edu.au