 John D. Goeschl
 Lifeng Han
- 1Department of Industrial and Systems Engineering, College of Engineering, Texas A&M University, College Station, TX, United States
- 2School of Mathematical and Statistical Sciences, Arizona State University, Tempe, AZ, United States
Theoretical and experimental evidence for an effect of sieve tube turgor pressure on the mechanisms of phloem unloading near the root tips during moderate levels of drought stress is reviewed. An additional, simplified equation is proposed relating decreased turgor pressure to decreased rate kinetics of membrane bound transporters. The effect of such a mechanism would be to decrease phloem transport speed, but increase concentration and pressure, and thus prevent or delay negative pressure in the phloem. Experimental evidence shows this mechanism precedes and exceeds a reduction in stomatal conductance.
Review of Theoretical Background
The Münch hypothesis of phloem transport has been expressed mathematically in various model forms by several authors (e.g., Goeschl et al., 1976; Thompson and Holbrook, 2003; Hölttä et al., 2006; Jensen et al., 2010; Payvendi et al., 2014). Mathematically consistent models must include equations for at least five dependent variables, (1) the rates of solute unloading [jUi] in sink areas, (2) osmotic influx and efflux [jWi] of water through the sieve tube membrane, (3) turgor pressure [Pi], (4) transport speed (i.e., velocity along the sieve tube) [vSi], and (5) solute concentration [Ci] along the sieve tube axis. An empirical equation (6) for a sixth variable, (6) viscosity of the phloem sap (ŋi assuming only sucrose at 25°C) was included in the model by Goeschl et al. (1976); from Swindells et al. (1958) to adjust the effective conductance to the phloem sap along the sieve tube [LSi]. The steady-state, algebraic form of these equations for each (ith) sieve element (or computational section) are as follows (see default values of the independent parameters in Table 1):
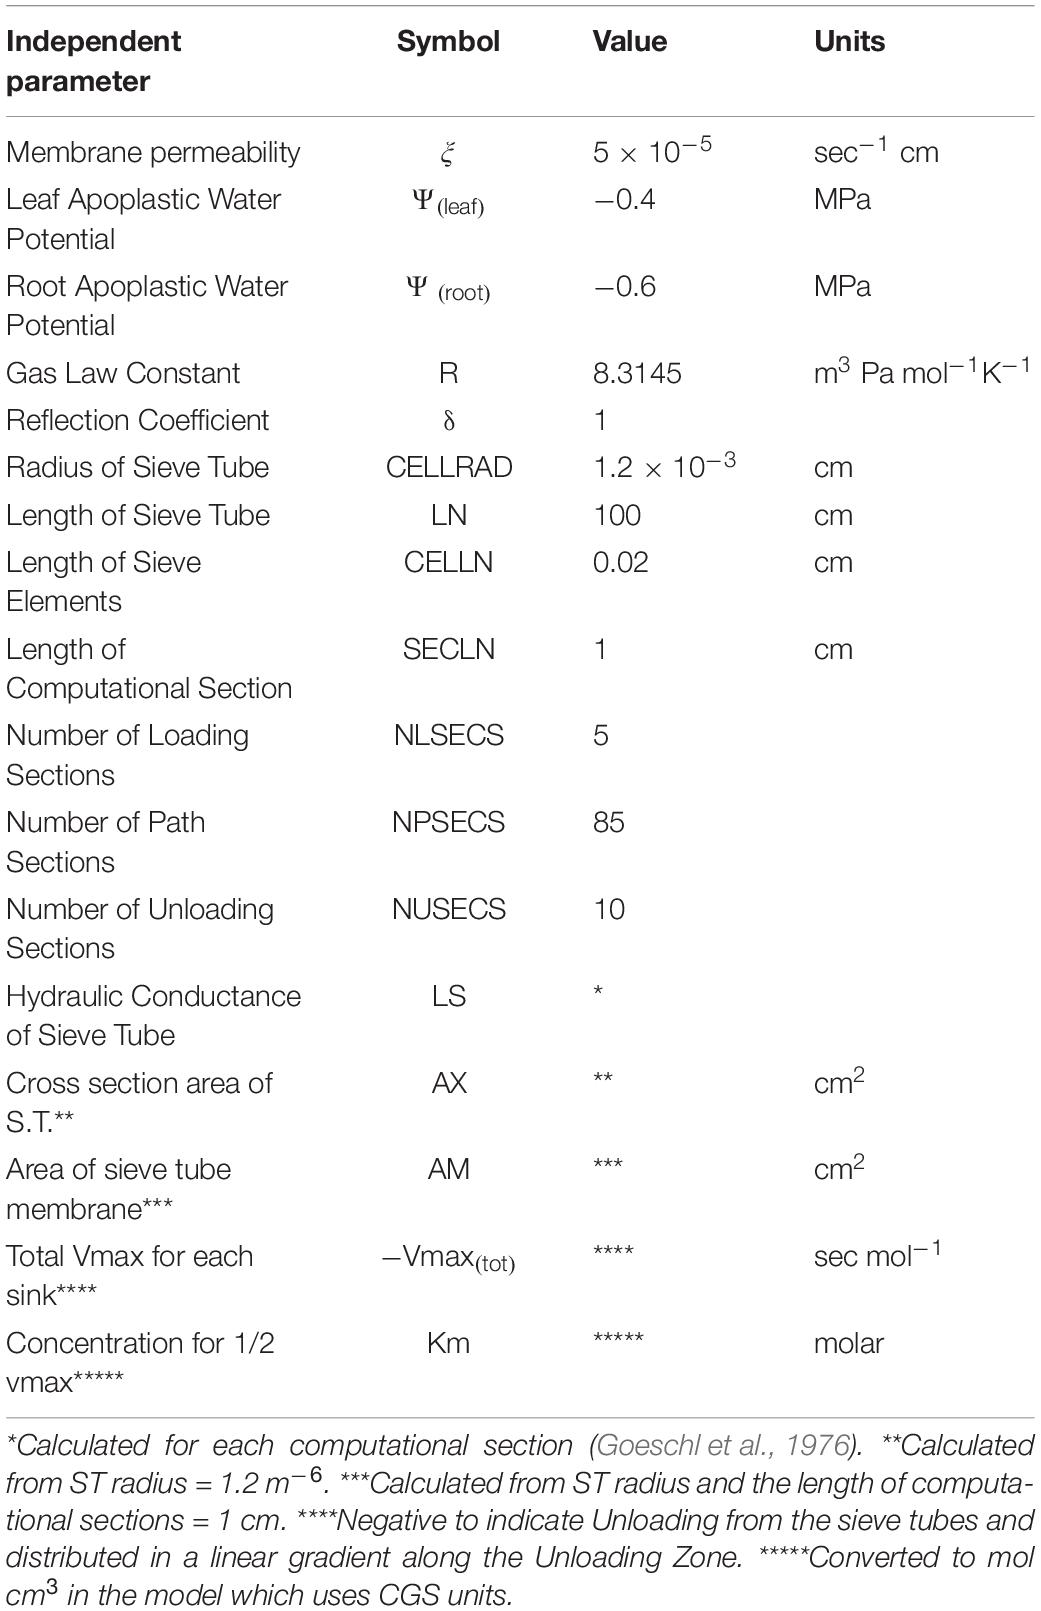
Table 1. Independent and input parameters used in Figure 1.
Where ξ is membrane permeability, Ψi is apoplastic water potential, Pi is turgor pressure, δ is the membrane reflection coefficient, Lsi is the hydraulic conductance of the Sieve Tube, Ax is the cross section area of the sieve tube, jLi is the phloem loading rate, is the partial molar volume of sucrose, AMi is the surface area of the sieve element, and Vmaxi and Km are the rate constants of the unloading transporter.
In the course of expressing various predictions of this steady-state model (Figure 1), it was observed that uniformly decreasing the value of apoplastic water potential (Ψi) along the axis of a modeled sieve tube (i.e., maintaining the same slope or gradient of water potential) had no effect on the values or patterns of OSMOSIS (i.e., osmotic influxes and effluxes along the phloem axis), SPEED, or CONCENTRATION, but uniformly lowered the absolute value of PRESSURE (replotted using data from Goeschl, 2019).
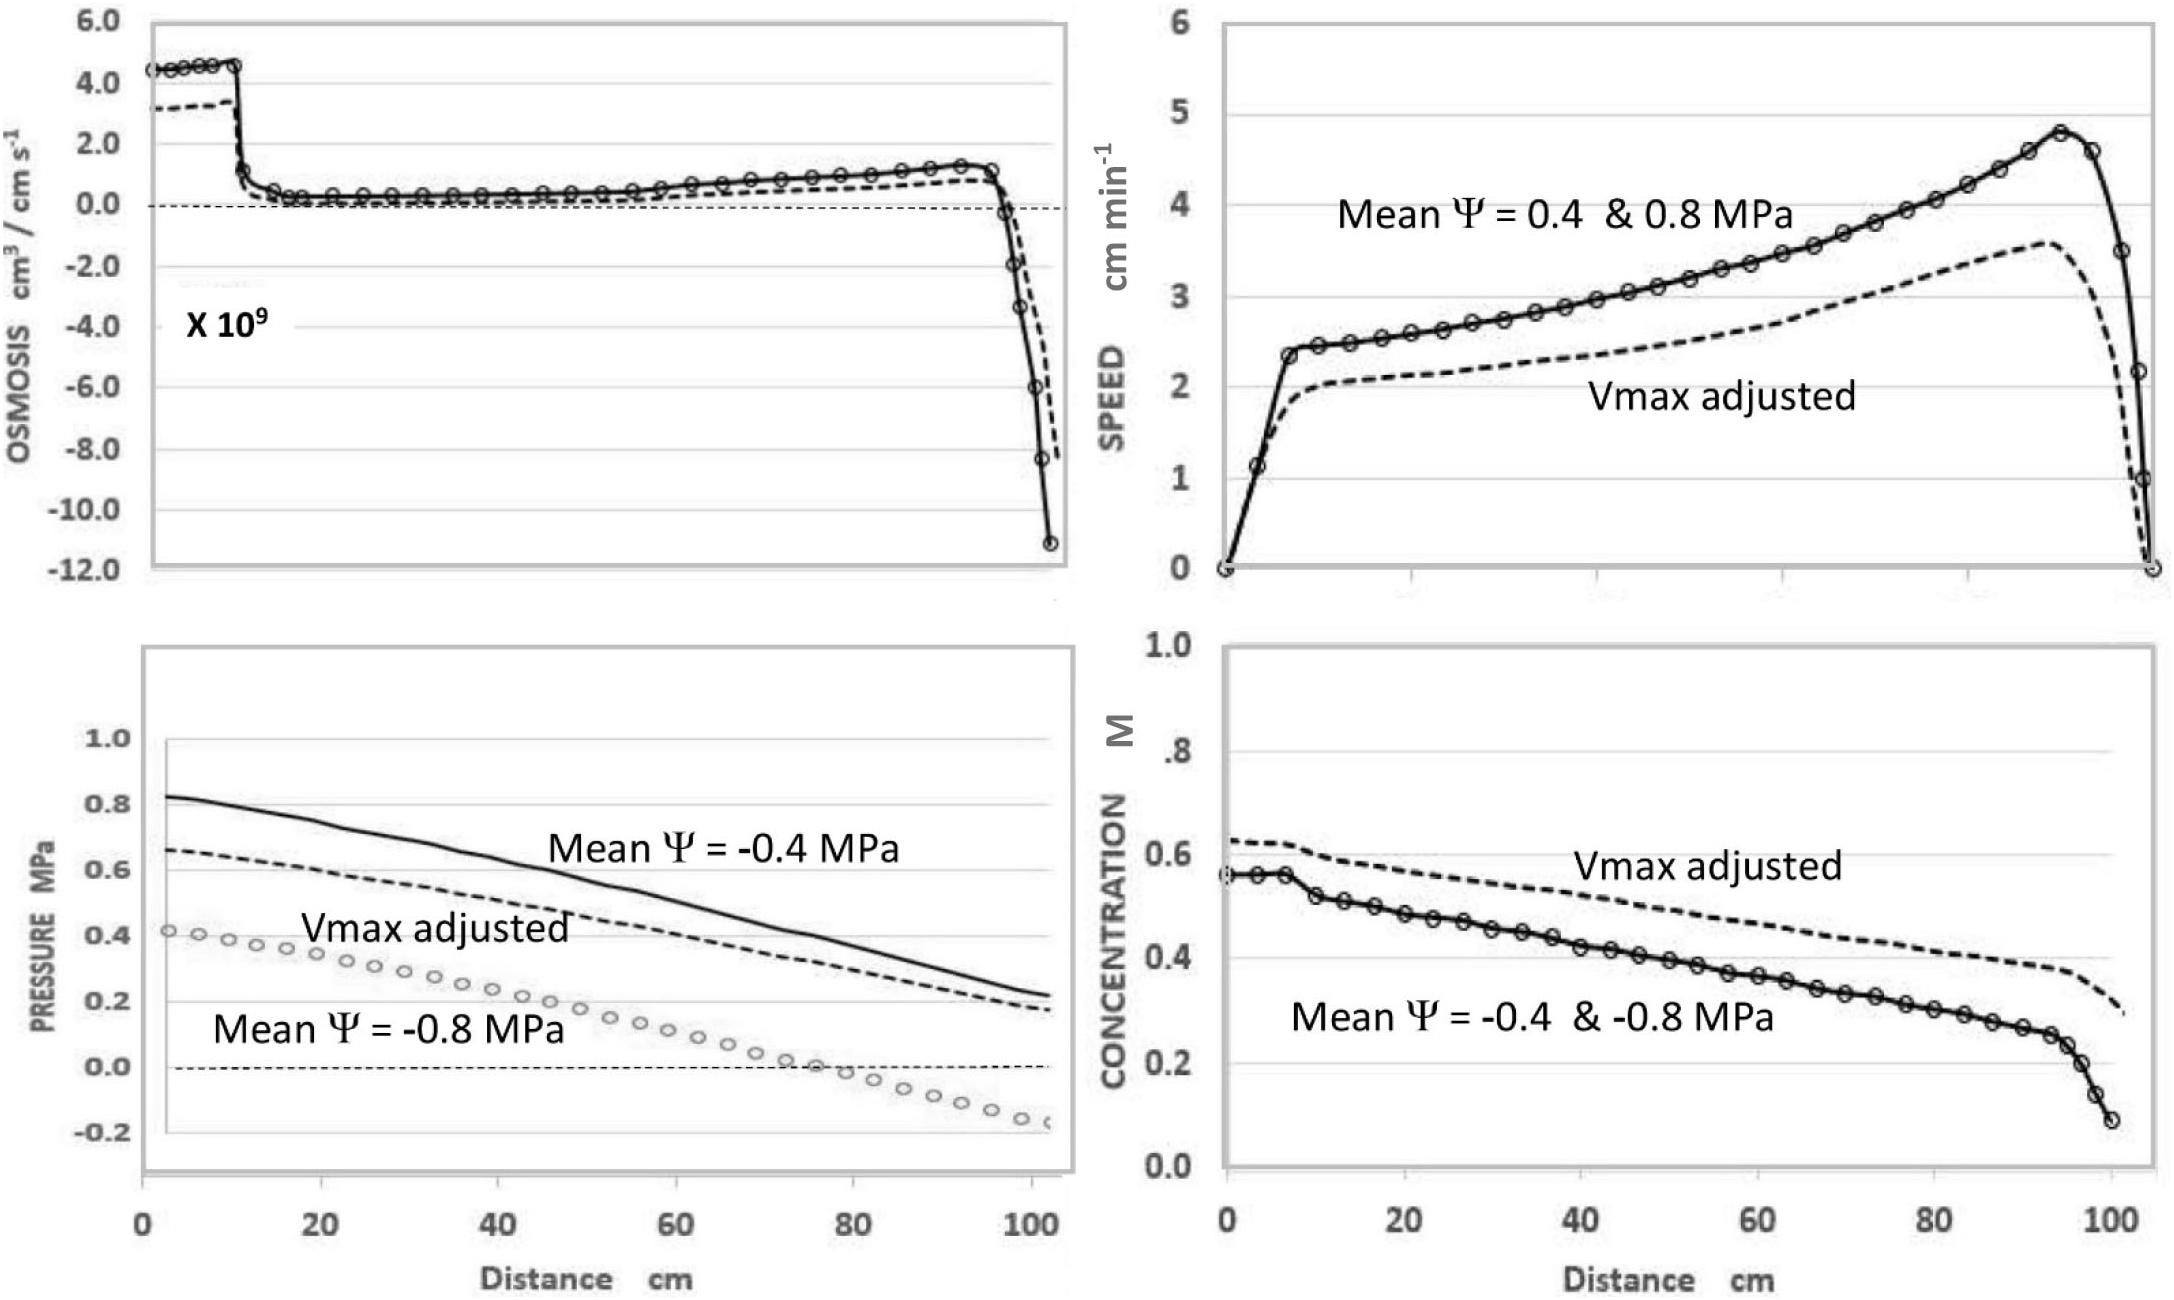
Figure 1. Effects of apoplastic water potential (Ψ) and effective unloading conductance (i.e., EUC assigned as Vmax of the Unloading enzyme system). Solid Traces MeanΨ = −0.4 MPa with Vmax = −1.72 ×10⁻¹⁰ mol sec–1. Open Circles MeanΨ = −0.8 MPa with Vmax = −1.72×10⁻¹⁰ mol sec –1. Dashed Traces MeanΨ = −0.8 MPa with Vmax = −1.35 ×10⁻¹⁰ mol sec–1. Plotted from same data as Goeschl (2019, Figures 7–5) where the term mPa should have been MPa.
As seen in Figure 1, and expected from the Münch hypothesis, the predicted turgor pressure always slopes downward from the loading zone to the unloading zone (in this case assumed to be along the root tips). At the chosen values of the independent parameters (Table 1) with a mean water potential of −0.4 MPa the predicted value of Turgor pressure is positive at all points (Figure 1, solid traces). If the mean water potential is lowered to −0.8 MPa, the predicted values of OSMOSIS, SPEED, and CONCENTRATION do not change (Figure 1, open circles, superimposed on solid traces). However, PRESSURE decreases uniformly along the axis (open circles) and reaches negative values approaching the terminal end of the sieve tube. Indeed, one could assign even lower mean values of water potential and the Pressure curve would reach negative values along the entire length of the sieve tube, but the other variables would be unaffected (i.e., open circles superimposed on the solid traces of Figure 1), so long as the slope of the pressure curve remained the same.
The question of whether phloem transport in real plants would continue to operate normally with negative pressures was raised by Lang (1974). Among the considerations is that the thin-walled sieve elements in the growing zone of roots are surrounded by newly formed parenchyma and other cells, known to maintain turgor pressures high enough to continue growth in moderate drought stress conditions (Hsiao and Acevedo, 1974; Sharp and Davies, 1985; Sharp et al., 1988; Hsiao and Xu, 2000; Hummel et al., 2010). It is likely that the sieve elements (possibly including the sieve plate pores) near the root tips would be compressed to smaller diameters, thus restricting the flow of phloem sap. There is also a possibility of plasmolysis under these conditions. The question then is whether plants have some mechanism to prevent or minimize the likelihood of negative pressures in the sieve tubes.
One hypothetical mechanism is a reduction in the Effective Unloading Conductance (EUC) of the sieve tubes in the root sinks, e.g., by virtue of a reduction of Vmax (Goeschl, 2019). This could occur in real plants as the sieve tube membranes are compressed, which may alter solute transporter and/or aquaporin protein configurations or expression levels, or membrane electro-potentials, and thus decrease the rate parameters of these mechanisms. This would be consistent with the known effects of turgor pressure on membrane transport kinetics (e.g., Hans et al., 1976; Patrick, 1994; Bell and Leigh, 1996; Geiger, 2011), on the distribution of photosynthates to various plant organs, especially roots (e.g., Hummel et al., 2010; Lemoine et al., 2013), and on related metabolism (Guo et al., 2018). Related changes in the xylem-phloem transport systems under reduced apoplastic water potential was predicted by the model of Hölttä et al. (2009). Reducing the EUC of the root sinks in a plant with more than one competitive sink would not necessarily decrease the amount of photosynthates unloaded into the growing roots, so long as the loading rate remained the same. In fact, phloem unloading in the root sinks could increase relative to other sinks (Hummel et al., 2010) since the relative change in sieve tube turgor would be greater in the roots, and total reduced EUC in all sinks would increase solute Concentration throughout the phloem network.
Using the model to predict the effect of reduced EUC in a plant with one hypothetical sink was accomplished by decreasing the collective Vmax(tot) of the hypothetical Unloading Transporters from 1.72 × 10⁻¹⁰ mol sec–1 to 1.35 × 10⁻¹⁰ mol sec–1, while maintaining all other input parameters constant. As seen in Figure 1 (dashed traces), this resulted in a decrease in transport SPEED, an increase in CONCENTRATION (i.e., reciprocal effects), and substantially increased PRESSURE to be positive at all points. The relative change in pressure (along with Concentration) was proportionately greater near the root tips. In real plants this would presumably occur gradually and prevent pressure from becoming negative.
Summary of Experimental Tests
Experimental measurements were conducted using the Extended Square Wave Carbon-11 Tracer method (11C ESW, Fares et al., 1983; Goeschl et al., 1988) in individual, live, uninjured, undisturbed Cotton and Corn plants as they were subjected to decreasing water potentials over a period of 4 days (Figure 2, also see Goeschl, 2019, Figures 8-1 and 8-2). The importance of test plants being fully recovered from disturbance (in our case at least 48 h; Goeschl et al., 1988) or injury (in our case at least 72 h; Goeschl, 2019) is supported by similar comments by Patrick (1994). The results showed gradual decreases in transport speed and increased concentration, preceding by one or 2 days, and exceeding the amplitude of decreases in transpiration (TRANS) and Carbon Exchange Rate (CER, i.e., photosynthesis) by reduced stomatal conductance.
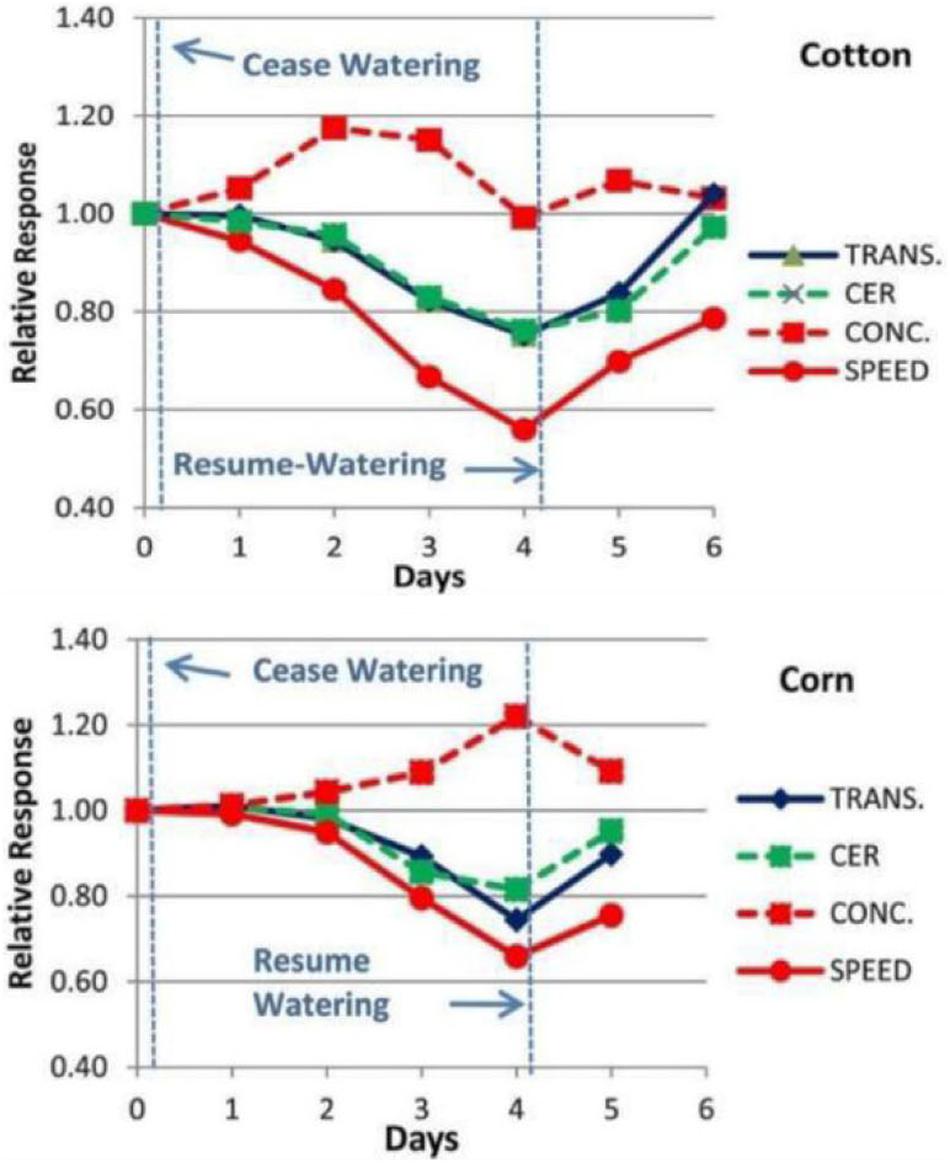
Figure 2. Example of the changes in Phloem Transport Speed and Concentration (measured experimentally by Carbor-11 Traces kinetic analysis, Goeschl et al., 1988; Goeschl, 2019) along with changes in CER and Transpiration of a Cotton and Corn plant during a 4 days “drydown” and re-watering experiment of the type conducted by Boyer (1970).
The short-term effects of re-watering (i.e., 4 min trickle irrigation of water at soil temperature) and the presumed restoration of high EUC on transport was seen on a minute-by-minute basis (Figure 3 Left). Since 11CO2 and 12CO2 were maintained at steady state equilibrium for 300 min, the downward trend is interpreted as simultaneous decreases in the concentrations of both tracer and trace. As illustrated in Figure 1, this results from the decreased EUC, not from dilution by increased apoplastic water potential. The 40 min decline reflects the capacitance effect of phloem volume. This was followed by an increase in photosynthesis, which led to an increase in both transport speed and concentration. Initial transport speed was measured by passage of the tracer front [at the beginning of the 120 min buildup phase (not shown)], by passage of the tracer trailing edge after 420 min, and by estimation from propagation velocity of the auto-induced wave near 260 min. The approximate 0.5x relation between wave velocity and transport speed is based on data from Goeschl et al. (1984), That wave, and the “noise” seen in these traces results from brief stoppages of phloem transport typical of Cotton (Goeschl et al., 1984).
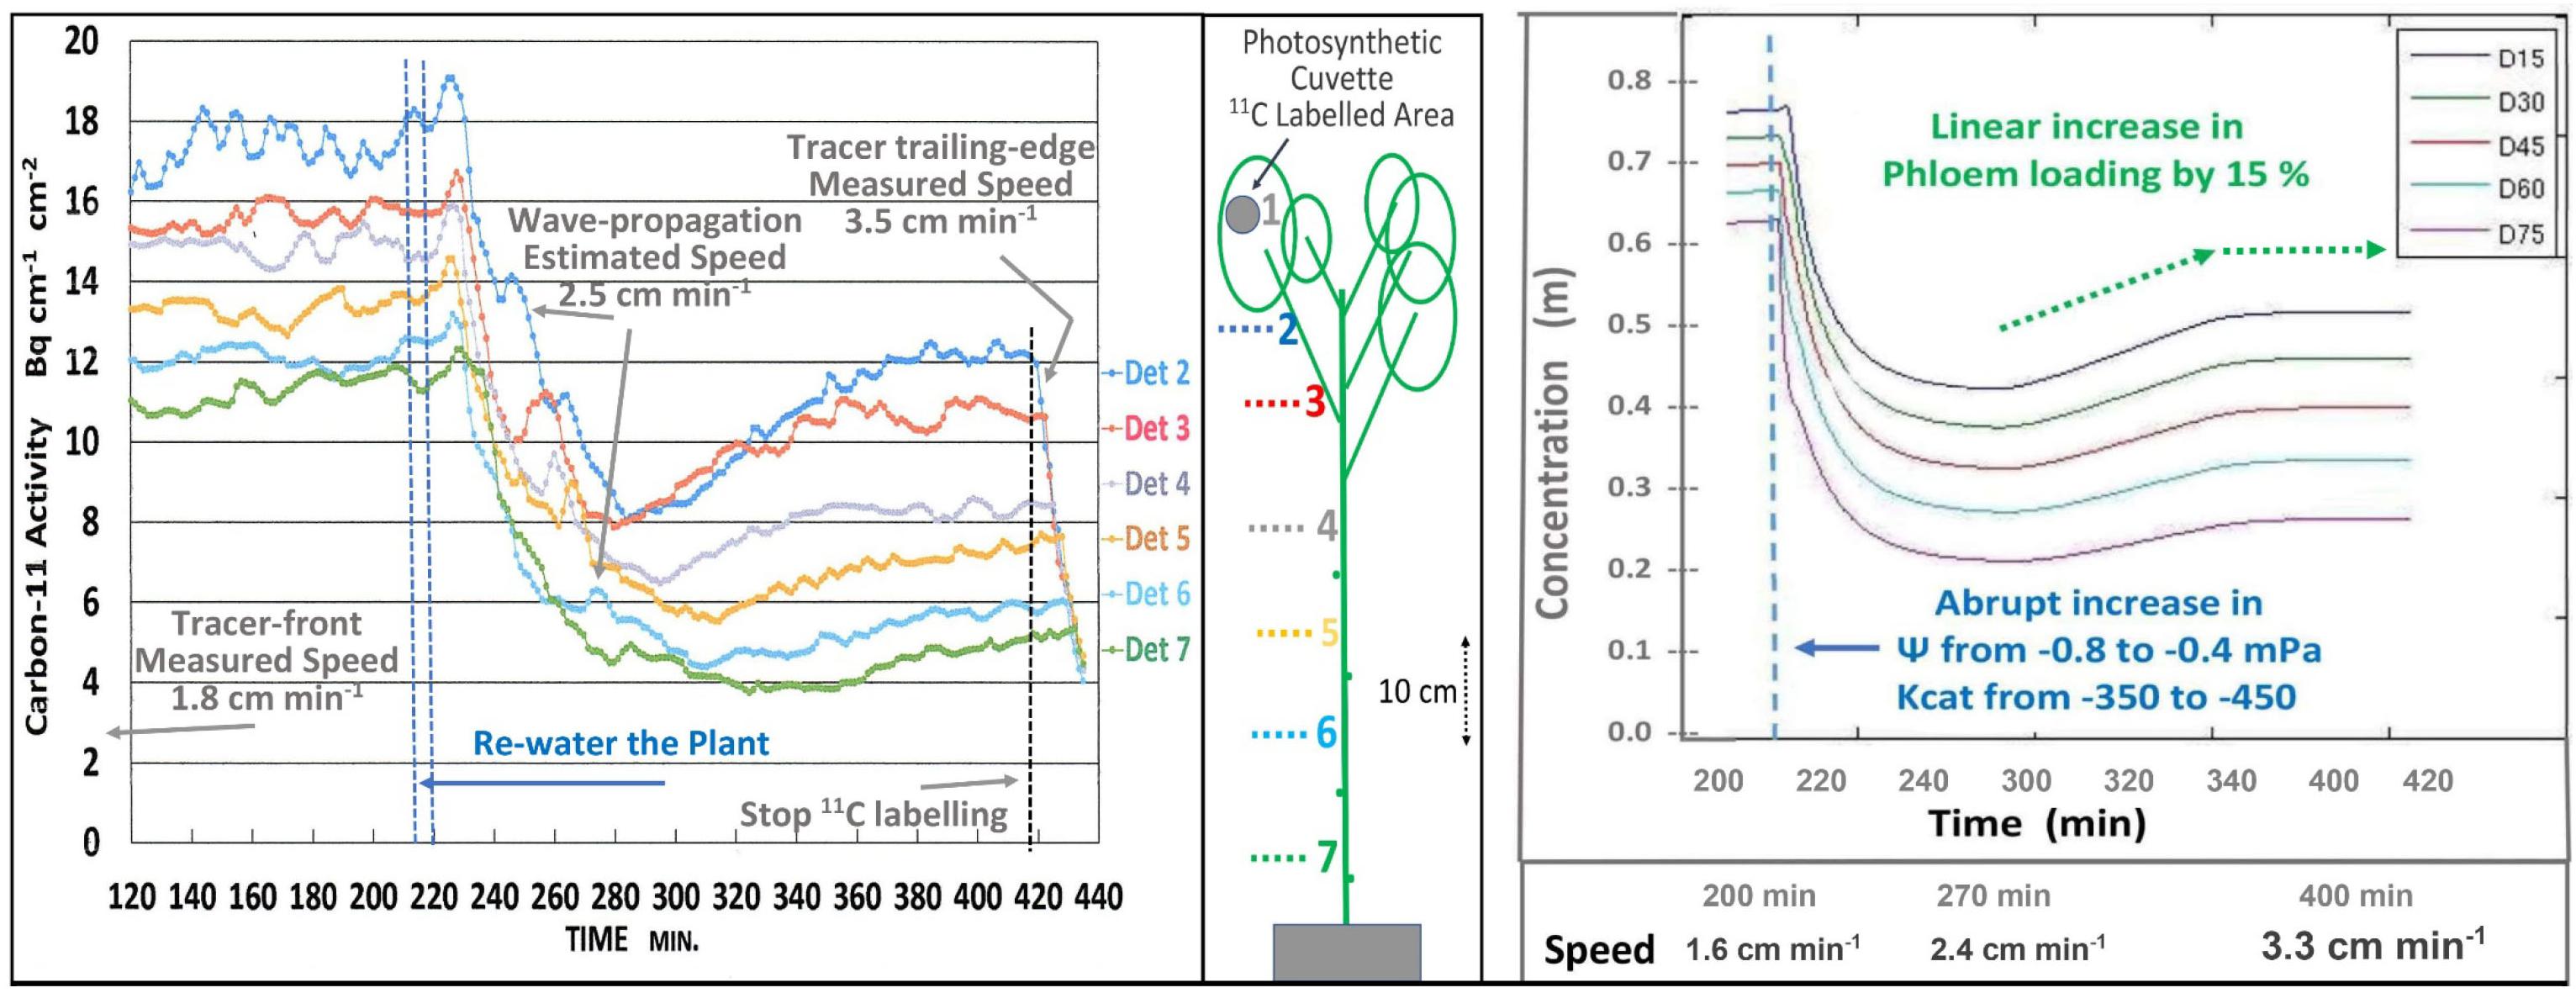
Figure 3. Left; Minute-by-minute 11C activities at numbered detector positions along a moderately drought-stressed Cotton plant during the steady state (final 300 min) of a 420 min Extended Square Wave input of 11CO2, before, during, and after re-watering of the plant. Right; Output of a time-dependent version of the Münch-Horwitz model of a phloem sieve tube subjected to the same set of input conditions and changes believed to have occurred in the experimental plant.
The output of a time-dependent version of the phloem model (Figure 3, Right) programmed in MATLAB by LH based on Smith et al. (1980, see also Goeschl, 2019) closely matched the experimental results of Figure 3 Left.
An Added Equation
Mathematical models at the beginning of their development, generally represent the simplest set of assumptions [Equations (1)–(6)]. Such a simple model may adequate to predict the results of the initial assumed circumstances. However, experimental tests may show it to be inadequate to express the effects of additional or changing circumstances. This appears to be the case for the Münch-Horwitz Theory under moderate drought stress conditions where the rate kinetics of the unloading mechanism decrease when the apoplastic water potential decreases (Figure 3).
If this proposed mechanism is true, and the rate kinetics of the unloading process are altered by the local turgor pressure at appropriate points along the sieve tubes, then the values of one or more of the Independent Parameters of the equation(s) representing the unloading mechanisms [in this hypothetical case the Michaelis–Menten Equation (5)] would become dependent variables as a function of pressure.
Again, starting with the simplest concepts and mathematics one can suggest the following added equation [Equation (7)] where the sum of the kinetic parameter Vmax(i) of the membrane bound transporter in the root sink, or a system of enzyme activities, in the sinks (at the highest likely value of sieve tube turgor pressure of plants in a growth medium at Field Capacity moisture level) is altered as function of changing pressures. Note that this maximum value in some sinks may be set by a turgor homeostat mechanism as described by Hölttä et al., 2006, 2009). As a starting point, the following proposed formulation is based on the rationale that the transporter would be most sensitive as turgor pressure approached zero during moderate drought stress levels, and less sensitive as turgor pressure approached the levels of relatively unstressed plants. It would likely experience the greatest change near the root tips where the apoplastic water potential would undergo the greatest relative change. The term Kp is the pressure causing Vmax(tot)i (in the ith computational section) to be 1/2 of its value at maximal apoplastic water potential and sieve tube pressure. A resulting plot is illustrated in Figure 4.
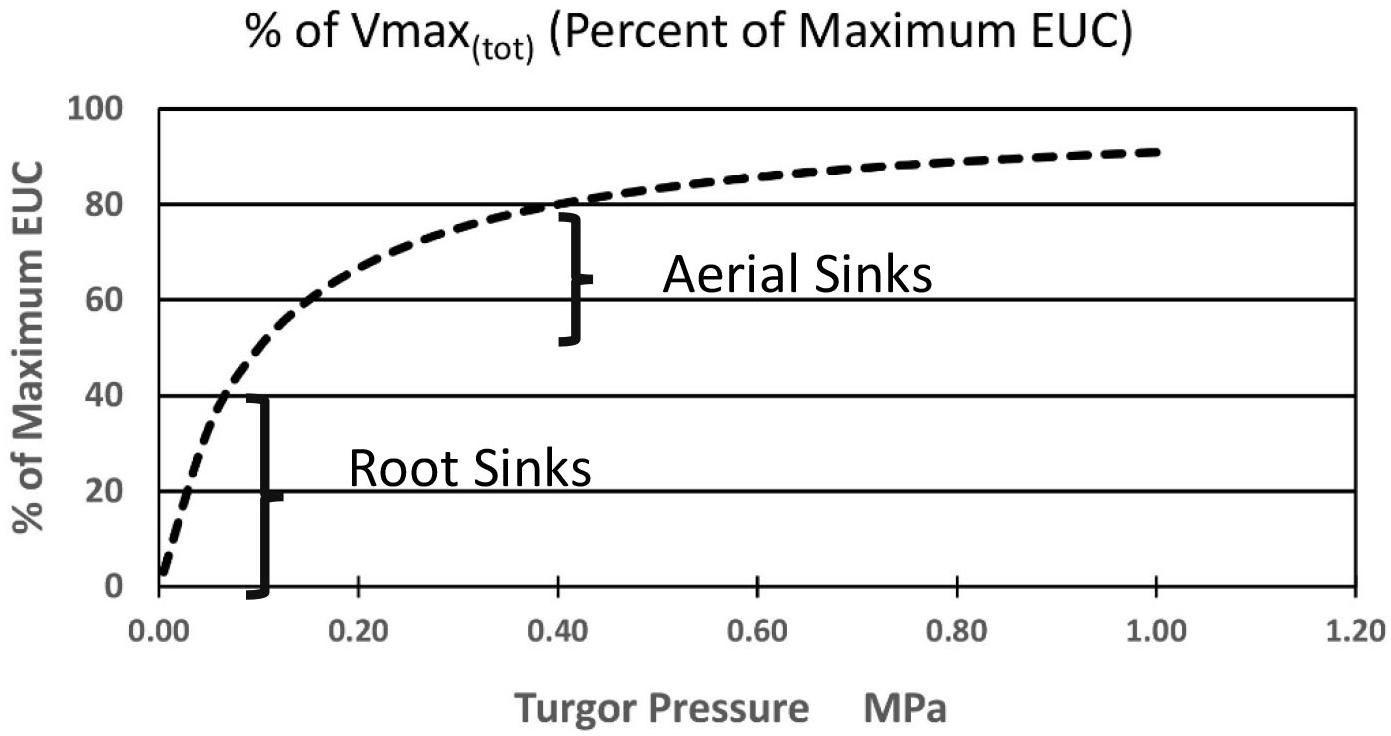
Figure 4. Hypothetical effect of turgor pressure on the value of Vmax(tot) of the membrane-bound unloading enzyme system (i.e., transporters) in various metabolic sinks.
Obtaining realistic values for the parameters of any such equation would not be easy. Again, as a starting point, empirical measurements of values for phloem sap concentration and unloading rate in the root zone of real plants, needed to calculate EUC, could be accomplished by combining the 11C ESW tracer method (Fares et al., 1983; Goeschl et al., 1988) with recently developed “Micro-PET” imaging systems (e.g., Cherry et al., 1997; Beer et al., 2010; Weisenburger et al., 2012; Wang et al., 2014, and others). This could be performed by quantitative imaging of the final two or three cm length of a growing root, including the root tip as illustrated in Figure 11-4 of Goeschl (2019). Pressure could be measured by probes or estimated on the basis of sieve tube solute Concentration (calculated from measurements of 11C activity during last few minutes of an 11C ESW) and the measured values of plant apoplastic water potentials.
Relationships between other independent parameters, such as phloem loading rate, membrane permeability, and sieve tube diameter, in relation to dependent variables such as concentration and pressure may also exist in real plants and could result in additional equations.
Finally, progress toward a model of carbon flow through the entire plant might be approached by coupling a Phloem Transport model with mechanistic models of Photosynthesis (e.g., Zhu et al., 2007) and sink metabolism (e.g., Keener et al., 1979) to achieve the goals put forward by Demichele et al. (1978).
Author Contributions
JG: models and experiments. LH: development of models. Both authors contributed to the article and approved the submitted version.
Conflict of Interest
The authors declare that the research was conducted in the absence of any commercial or financial relationships that could be construed as a potential conflict of interest.
References
Beer, S., Struen, M., Hombach, T., Buehler, J., Jahnke, S., Khodaverdi, M., et al. (2010). Design and initial performance of PlanTIS: a high resolution positron emission tomograph for plants. Phys. Med. Biol. 55, 635–646. doi: 10.1088/0031-9155/55/3/006
Bell, C. L., and Leigh, R. A. (1996). Differential effects of turgor on sucrose and potassium transport at the tonoplast and plasma membrane of sugar beet storage root tissue. Plant Cell Environ. 19, 191–200. doi: 10.1111/j.1365-3040.1996.tb00240.x
Boyer, J. S. (1970). Differing sensitivity of photosynthesis to low water potentials in corn and soybean. Plant Physiol. 46, 236–239. doi: 10.1104/pp.46.2.236
Cherry, S. R., Shao, Y., Silverman, R. W., Medors, K., Siegel, S., Chatziiaonnou, A., et al. (1997). MicroPET: a high resolution PET scanner for imaging small animals. IEEE Trans. Nucl. Sci. 44, 1161–1166. doi: 10.1109/23.596981
Demichele, D. W., Sharpe, P. J. H., and Goeschl, J. D. (1978). Toward the engineering of photosynthetic productivity. CRC Crit. Rev. Bioeng. 3, 23–91.
Fares, Y., Goeschl, J. D., Magnuson, C. E., Nelson, C. E., Strain, B. R., Jaeger, C. H., et al. (1983). A system for studying carbon allocation in plants using 11C-labeled carbon dioxide. Radiocarbon 25, 429–439. doi: 10.1017/s0033822200005725
Geiger, D. (2011). Plant sucrose transporters from a biophysical point of view. Mol. Plant 4, 395–406. doi: 10.1093/mp/ssr029
Goeschl, J. D. (2019). Physiological Roles of Phloem Transport: Source-Sink Interactions, Drought Stress Responses, Flowering in Plants. Denver, CO: Outskirts Press, 153.
Goeschl, J. D., Fares, Y., Magnuson, C. E., Scheld, H. W., Strain, B. R., Jaeger, C. H., et al. (1988). “Short-lived isotope kinetics: a window to the inside,” in Beltsville Symposium in Agricultural Research (11) Research Instrumentation for the 21st Century, ed. F. R. Beecher (Leiden: Martinus Nijhoff Publishers), 21–53. doi: 10.1007/978-94-009-2748-3_2
Goeschl, J. D., Magnuson, C. E., DeMichele, D. W., and Sharpe, P. J. H. (1976). Concentration-dependent unloading as a necessary assumption for a closed form mathematical model of osmotically driven pressure flow in phloem. Plant Physiol 58, 556–562. doi: 10.1104/pp.58.4.556
Goeschl, J. D., Magnuson, C. E., Fares, Y., Jaeger, C. H., Nelson, C. E., and Strain, B. R. (1984). Spontaneous and induced blocking and unblocking of phloem transport. Plant Cell Environ. 7, 89–100.
Guo, R., Shi, L. X., Jiao, Y., Li, M. X., Zhong, X. L., Gu, F. X., et al. (2018). Metabolic responses to drought stress in the tissues of drought-tolerant and drought-sensitive wheat genotype seedlings. AoB Plants 10:ly016. doi: 10.1093/aobpla/ply016
Hans, G., Coster, L., Steudle, E., and Zimmermann, U. (1976). Turgor pressure sensing in plant cell membranes. Plant Physiol. 58, 636–643. doi: 10.1104/pp.58.5.636
Hölttä, T., Mencuccini, M., and Nikinmaa, E. (2009). Linking phloem function to structure. Analysis with a xylem-phloem transport model. J. Theor. Biol. 259, 325–337. doi: 10.1016/j.jtbi.2009.03.039
Hölttä, T., Vesala, T., Sevanto, S., Perämäki, M., and Nikinmaa, E. (2006). Modeling xylem and phloem water flows in trees according to cohesion theory and Münch hypothesis. Trees 20, 67–78. doi: 10.1007/s00468-005-0014-6
Hsiao, T. C., and Acevedo, E. (1974). Plant responses to water deficits, water-use efficiency, and drought resistance. Agric. Meterol. 14, 59–84. doi: 10.1016/b978-0-444-41273-7.50012-x
Hsiao, T. C., and Xu, L. K. (2000). Sensitivity of growth of roots versus leaves to water stress: biophysical analysis and relation to water transport. J. Exp. Bot. 51, 1595–1616. doi: 10.1093/jexbot/51.350.1595
Hummel, I., Pantin, F., Sulpice, R., Piques, M., Rolland, G., Dauzat, M., et al. (2010). Arabidopsis plants acclimate to water deficit at low cost through changes of carbon usage: an integrated perspective using growth, metabolite, enzyme, and gene expression analysis. Plant Physiol. 154, 357–372. doi: 10.1104/pp.110.157008
Jensen, K. H., Lee, J., Bohr, T., Holbrook, N. M., and Zwienicki, M. A. (2010). Optimality of the Münch mechanism for translocation of sugars in plants. J. R. Soc. Interface 8, 1155–1165. doi: 10.1098/rsif.2010.0578
Keener, M. E., Demichele, D. W., and Sharpe, P. J. H. (1979). Sink metabolism: a conceptual framework for analysis. Ann. Bot. 44, 659–669. doi: 10.1093/oxfordjournals.aob.a085780
Lemoine, R., La Camera, S., Atanassova, R., Dédaldéchamp, F., Allario, T., Pourtau, N., et al. (2013). Source-to-sink transport of sugar and regulation by environmental factors. Front. Plant Sci. 4:272. doi: 10.3389/fpls.2013.00272
Patrick, J. W. (1994). Turgor-dependent unloading of assimilates from coats of developing legume seed. Assessment of the significance of the phenomenon in the whole plant. Physiol. Plant. 90, 645–654. doi: 10.1034/j.1399-3054.1994.900404.x
Payvendi, S., Daly, K. R., Zygalakis, K. C., and Roose, T. (2014). Mathematical modelling of the phloem: the importance of diffusion on sugar transport at osmotic equilibrium. Bull. Math. Biol. 76, 2834–2865. doi: 10.1007/s11538-014-0035-7
Sharp, R. E., and Davies, W. J. (1985). Root growth and water uptake by Maize plants in drying soil. J. Exp. Bot. 36, 1441–1456. doi: 10.1093/jxb/36.9.1441
Sharp, R. E., Silk, W. K., and Hsiao, T. H. (1988). Growth of the Maize primary root at low water potential: I. Spatial distribution of expansive growth. Plant Physiol. 87, 50–57. doi: 10.1104/pp.87.1.50
Smith, K. C., Magnuson, C. E., Goeschl, J. D., and DeMichele, D. W. (1980). A time-dependent mathematical expression of the münch hypothesis of phloem transport. J. Theor. Biol. 86, 493–505. doi: 10.1016/0022-5193(80)90348-3
Swindells, J. F., Snyder, C. F., Hardy, R. C., and Golden, P. E. (1958). Viscosities of Sucrose Solutions at Various Temperatures: Tables of Recalculated Values. National Bureau of Standards Circular. Washington, DC: United States Department of Commerce.
Thompson, M. V., and Holbrook, N. M. (2003). Application of a single-solute non-steady-state phloem model to the study of long-distance assimilate transport. J. Theor. Biol. 220, 419–455. doi: 10.1006/jtbi.2003.3115
Wang, Q., Komarov, S., Mathews, A. W., Li, K., Topp, C., O’Sullivan, J. A., et al. (2014). A dedicated high resolution imager for plant sciences. Phys. Med. Biol. 59, 59–69.
Weisenburger, A. G., Kross, B., Lee, S., McKisson, J., McKisson, J. E., Xi, W., et al. (2012). PhytoBeta imager: at positron imager for plant biology. Phys. Med. Biol. 57, 4195–4210. doi: 10.1088/0031-9155/57/13/4195
Keywords: phloem transport, turgor pressure, drought stress, transport speed, concentration
Citation: Goeschl JD and Han L (2020) A Proposed Drought Response Equation Added to the Münch-Horwitz Theory of Phloem Transport. Front. Plant Sci. 11:505153. doi: 10.3389/fpls.2020.505153
Received: 15 October 2019; Accepted: 14 September 2020;
Published: 04 November 2020.
Edited by:
Sanna Sevanto, Los Alamos National Laboratory (DOE), United StatesReviewed by:
Teemu Hölttä, University of Helsinki, FinlandSusanne Hoffmann-Benning, Michigan State University, United States
Copyright © 2020 Goeschl and Han. This is an open-access article distributed under the terms of the Creative Commons Attribution License (CC BY). The use, distribution or reproduction in other forums is permitted, provided the original author(s) and the copyright owner(s) are credited and that the original publication in this journal is cited, in accordance with accepted academic practice. No use, distribution or reproduction is permitted which does not comply with these terms.
*Correspondence: John D. Goeschl, jdgoeschl@Yahoo.com