 Jorge Carlos Berny Mier y Teran
 Enéas R. Konzen
 Antonia Palkovic1
 Siu M. Tsai
 Paul Gepts
- 1Department of Plant Sciences, University of California, Davis, Davis, CA, United States
- 2Cell and Molecular Biology Laboratory, Centro de Energia Nuclear na Agricultura, Universidade de São Paulo, Piracicaba, Brazil
Genetic analyses and utilization of wild genetic variation for crop improvement in common bean (Phaseolus vulgaris L.) have been hampered by yield evaluation difficulties, identification of advantageous variation, and linkage drag. The lack of adaptation to cultivation conditions and the existence of highly structured populations make association mapping of diversity panels not optimal. Joint linkage mapping of nested populations avoids the later constraint, while populations crossed with a common domesticated parent allow the evaluation of wild variation within a more adapted background. Three domesticated by wild backcrossed-inbred-line populations (BC1S4) were developed using three wild accessions representing the full range of rainfall of the Mesoamerican wild bean distribution crossed to the elite drought tolerant domesticated parent SEA 5. These populations were evaluated under field conditions in three environments, two fully irrigated trials in two seasons and a simulated terminal drought in the second season. The goal was to test if these populations responded differently to drought stress and contained progenies with higher yield than SEA 5, not only under drought but also under water-watered conditions. Results revealed that the two populations derived from wild parents of the lower rainfall regions produced lines with higher yield compared to the domesticated parent in the three environments, i.e., both in the drought-stressed environment and in the well-watered treatments. Several progeny lines produced yields, which on average over the three environments were 20% higher than the SEA 5 yield. Twenty QTLs for yield were identified in 13 unique regions on eight of the 11 chromosomes of common bean. Five of these regions showed at least one wild allele that increased yield over the domesticated parent. The variation explained by these QTLs ranged from 0.6 to 5.4% of the total variation and the additive effects ranged from −164 to 277 kg ha–1, with evidence suggesting allelic series for some QTLs. Our results underscore the potential of wild variation, especially from drought-stressed regions, for bean crop improvement as well the identification of regions for efficient marker-assisted introgression.
Introduction
Among pulses, common bean (Phaseolus vulgaris L.; 2n = 2x = 22) plays an important nutritional and economical role (Broughton et al., 2003; Gepts et al., 2008). The yields of pulses are usually lower than those of cereals, mainly because their production is located in more marginal cultivation niches, produce more energy-dense seeds and the cost of association with nitrogen fixing rhizobia (Sinclair and Vadez, 2012). Production is also constrained by biotic and abiotic factors, drought being one of the main causes of yield reduction and crop failure in beans (Singh, 2001; Beebe et al., 2013; Ramirez-Cabral et al., 2016). Furthermore, drought severity is likely to increase due to the effects of climate change (Prudhomme et al., 2014). Increasing crop yield and resilience is an essential goal of crop breeding and cultivar development, as well as a direct advantage to farmers and, ultimately, to consumers (Kissoudis et al., 2016). Several strategies to improve yield include maximizing nitrogen fixation, photosynthesis and partitioning to grain, as well as minimizing water deficit impacts (Monteith and Moss, 2006; Zhu et al., 2010; Sinclair and Vadez, 2012).
Common bean is one of the five domesticated species among ∼80 wild Phaseolus species, all originating in the American continent (Freytag and Debouck, 2002; Delgado-Salinas et al., 2006). Wild common bean originated in Mexico and was dispersed by at least two long-distance movements to Ecuador and northern Peru (some 500,000 years ago) and the southern Andes (southern Peru, Bolivia, and northwestern Argentina; some 100,000 years ago) leading to two additional gene pools in the Andes (Bitocchi et al., 2012; Rendón-Anaya et al., 2017; Ariani et al., 2018; Gepts, 2019). Common bean was domesticated independently within two of the three gene pools (Southern Andes and Mesoamerica), followed by divergence into six genetically distinct races (Kwak and Gepts, 2009). Mesoamerican beans were presumably domesticated in Western Mexico while Andean beans were domesticated in northern Argentina and southern Bolivia (Kwak et al., 2009; Rodriguez et al., 2016). Within the domesticated Mesoamerican gene pool, the larger-seeded races ‘Jalisco’ and ‘Durango’ are distributed in the sub-humid and semi-arid highlands, respectively, in Central and Northern Mexico, while the small-seeded race Mesoamerica is distributed in the lowlands from southern Mexico to northeast Brazil (Singh et al., 1991). Within each race, there are thousands of landrace types, as well as fewer, but established, commercial market classes (Gentry, 1969; Singh et al., 1991; Moghaddam et al., 2016). In common bean breeding, the variation included in the breeding programs is mostly constrained within market classes and within races, as the inheritance of color, size, and shape of seeds and plant architecture are highly polygenic and dispersed throughout the genome (Park et al., 2000; McClean et al., 2002; Checa and Blair, 2008; Schmutz et al., 2014). Introgressions between market classes or gene pools have focused mostly on transferring disease resistance, modifying growth habit, and introducing drought resistance (Kelly, 2001; Acosta-Gallegos et al., 2007; Beebe, 2012; Porch et al., 2013; Dohle et al., 2019).
The use of wild variation has been even more limited. Wild variation has been identified as a source of resistance to bruchids (Kornegay et al., 1993; Osborn et al., 2003, 2006), common bacterial blight (Beaver et al., 2012), web blight (Beaver et al., 2012) and white mold (Mkwaila et al., 2011). However, it is possible that beneficial wild variation for highly quantitative important traits, like grain yield and drought adaptation, is not present the domesticated forms due to early genetic bottlenecks (Gepts et al., 1986; Tanksley and McCouch, 1997; Acosta-Gallegos et al., 2007). For example, within the Mesoamerican gene pool, a single domestication event originated in only one of the three genetically and geographically distinct groups of wild common beans (Kwak et al., 2009; Ariani et al., 2018). Although domesticated forms expanded to areas of those non-domesticated, wild groups, and can outcross with the wild relatives, gene flow has been found highly asymmetrical, introgressing more regions from the domesticated to the wild types (Papa and Gepts, 2003). Therefore, diversity unique to the non-domesticated groups might not be present in the domesticates. This is supported by a strong genetic diversity bottleneck, especially during the Mesoamerican bean domestication (Gepts et al., 1986; Sonnante et al., 1994; Schmutz et al., 2014). Previous efforts in genetic analyses in common bean using wild by domesticated crosses include: (a) two populations with the same Andean domesticated cultivar (ICA Cerinza) crossed to a wild type from Colombia (Blair et al., 2006) and to one from northern Mexico (Blair and Izquierdo, 2012); (b) a population resulting from a cross of Midas (an Andean snap bean), and a wild type from central Mexico G12873 (Koinange et al., 1996); and (c) a population involving Peruvian accessions both originating in the Andean gene pool (Singh et al., 2019). In the first two efforts, genomic regions carrying a positive-effect allele for yield from the wild parent were detected in the wild accession from a high rainfall area in Colombia (Blair et al., 2006), but not in the accession from a low rainfall region in northern Mexico (Blair and Izquierdo, 2012).
In the present investigation, the development of three backcrossed-inbred-line populations in a nested design is described, as is their evaluation under drought pressure in field conditions followed by a QTL analysis of grain yield. The populations result from the cross between three wild Mesoamerican accessions originating from areas with different levels of precipitation/evapotranspiration to the same elite breeding line, also of Mesoamerican origin. The nested design allows the sampling of more diversity than single biparental populations, increases the power and mapping resolution, but most importantly allows the testing of genetic effects among accessions in similar genetic backgrounds (Yu et al., 2008; Garin et al., 2017). Our two-fold hypothesis is that: (1) The three wild accessions have different adaptations to rainfall/evapotranspiration regimes; and (2) Some of these contrasting adaptation mechanisms were not included into the domesticated gene pool during domestication.
Materials and Methods
Parental Materials and Population Development
Three populations were established, which resulted from a cross of the Mesoamerican elite breeding line SEA 5 with three wild accessions from the Mesoamerican gene pool. SEA 5 (PI 613166; Number and DOI of the CIAT gene bank: G51502, doi: 10.18730/PHA81) was obtained at the International Center for Tropical Agriculture (CIAT, Cali, Colombia) from an interracial (Durango × Mesoamerica) double cross (BAT 477/San Cristobal 83//Guanajuato 31/Rio Tibagi) within the Mesoamerican gene pool (Singh et al., 2001). SEA 5 was selected for high productivity under drought, has an indeterminate inclined growth habit IIb, photoperiod neutrality, resistance to Fusarium root rot and Bean Common Mosaic Virus (I gene), but shows susceptibility to anthracnose, common bacterial blight and rust (Singh et al., 2001; Terán and Singh, 2002). SEA 5 develops a vigorous and deep root system (Polania et al., 2017), has a high capacity of photoassimilate remobilization (Polania et al., 2016; Rao et al., 2017), and a high capacity for nitrogen fixation under drought (Devi et al., 2012).
Three wild accessions within the Mesoamerican wild gene pool (Ariani et al., 2018; Berny Mier y Teran et al., 2019a) were chosen to maximize genetic variation and annual precipitation of their collection site. From North to South and along a gradient of increasing temperature and rainfall, the wild accessions included PI 319441 (G10022, DOI: 10.18730/JRH59), collected in the state of Durango, Mexico (104.47°N, 24.24°W, mean annual temperature: 18°C, mean annual precipitation: 588 mm), PI 417653 (G12910, DOI: 10.18730/PGEK4) from Guanajuato, Mexico (101.72°W, 20.62°N, 19.4°C, 733 mm) and PI 343950 from Huehuetenango, Guatemala (91.82°N, 15.68°W, 23.5°C, 1600 mm). The seeds were obtained from the National Plant Germplasm System (NPGS) of the USDA at the Western Regional Plant Introduction Station in Pullman, WA, United States. Climatic conditions of each collection site were extracted from the WorldClim database1 (Hijmans et al., 2005).
The three populations (henceforth called dw319441, dw417653, and dw343950) were developed in an identical way as follows: (1) SEA 5 was crossed to the wild accession using SEA 5 as the male parent; (2) The F1 plant was then used as the male parent crossed back to SEA 5 plants to obtain at least 250 BC1 seeds; (3) Each BC1 seed was scarified before planting and allowed to self in the greenhouse; (4) BC1S1:2 families were grown in the field in the summer months (June–September, short night/long day photoperiod) planting ∼50 seeds per family, to allow selection against photoperiod sensitivity. Seeds from a randomly chosen plant from each family were harvested; (5) The plants were grown in the greenhouse for two more cycles using single-seed-descent to obtain 220, 237, and 238 BC1S4 plants from the dw319441, dw417653, and dw343950 populations, respectively.
Trial Design and Phenotyping
The populations were evaluated under field conditions in 2014 and 2015 at the Plant Sciences Field Facility on the University of California, Davis, campus (38.53°N, 121.78°W). The soil type of the site belongs to the Yolo series, a member of fine-silty loam, mixed, non-acid, thermic Mollic Xerofluvents, considered well-drained, with slow to medium runoff and moderate permeability2. The seeding was carried out on the 8th of June in 2014 and on the 9th of June in 2015. The plants were harvested on the 22–26th of September in 2014 and the 14–25th of September in 2015. In 2014, the populations were evaluated only under full irrigation, using furrow water delivery as needed, in four irrigations. In 2015, a terminal drought water regime was added. Terminal drought was simulated by withdrawing irrigation in the last two of the four irrigations of the full irrigated treatment. Plants received water only from irrigations as there were no rain events during the experiments. The agricultural management was according to standard practices in California (Long et al., 2010).
In both years, the RILs were planted in un-replicated fashion and SEA 5 in replicated fashion (eight replicates) according to a modified augmented design (Lin and Poushinsky, 1985). The field was divided in blocks and planted with a main check in the middle of each block, as well as two to three secondary checks randomly distributed within each block. In 2014, 30 blocks of 3 plots × 9 plots were used and, in 2015, 21 blocks of 5 plots × 5 plots per treatment were used. UCD 9634, a pink-seeded breeding line, was included in both years as the main check due its high yield and stability. In 2014, Tio Canela 75 (Rosas et al., 2010), Matterhorn (Kelly et al., 1999), and Flor de Mayo Eugenia (Acosta Gallegos et al., 2010) were included as secondary checks. In 2015, a small, black-seeded line L88-63 (Frahm et al., 2004) was added as a check. The experimental unit was a plot of 60 plants grown in a row of 6 m-long rows and 0.76 m between rows (density of 131,578 plants per hectare). In 2014, 230, 238, and 237 progeny lines of the dw319441, dw417653, and dw343950 populations, respectively, were grown.
There was a bimodal distribution in days to flowering (Figure 1) with a smaller set of lines that showed late flowering. These later genotypes were not used for further evaluation and genotyping, as a wide variation in phenology can be a confounding effect (Pinto et al., 2010), especially in the case of late flowering and maturity, which are negatively correlated with yield in beans (Klaedtke et al., 2012; Berny Mier y Teran et al., 2019b). The final analyses used 171, 170, and 165 lines from the dw319441, dw417653, and dw343950 populations, respectively.
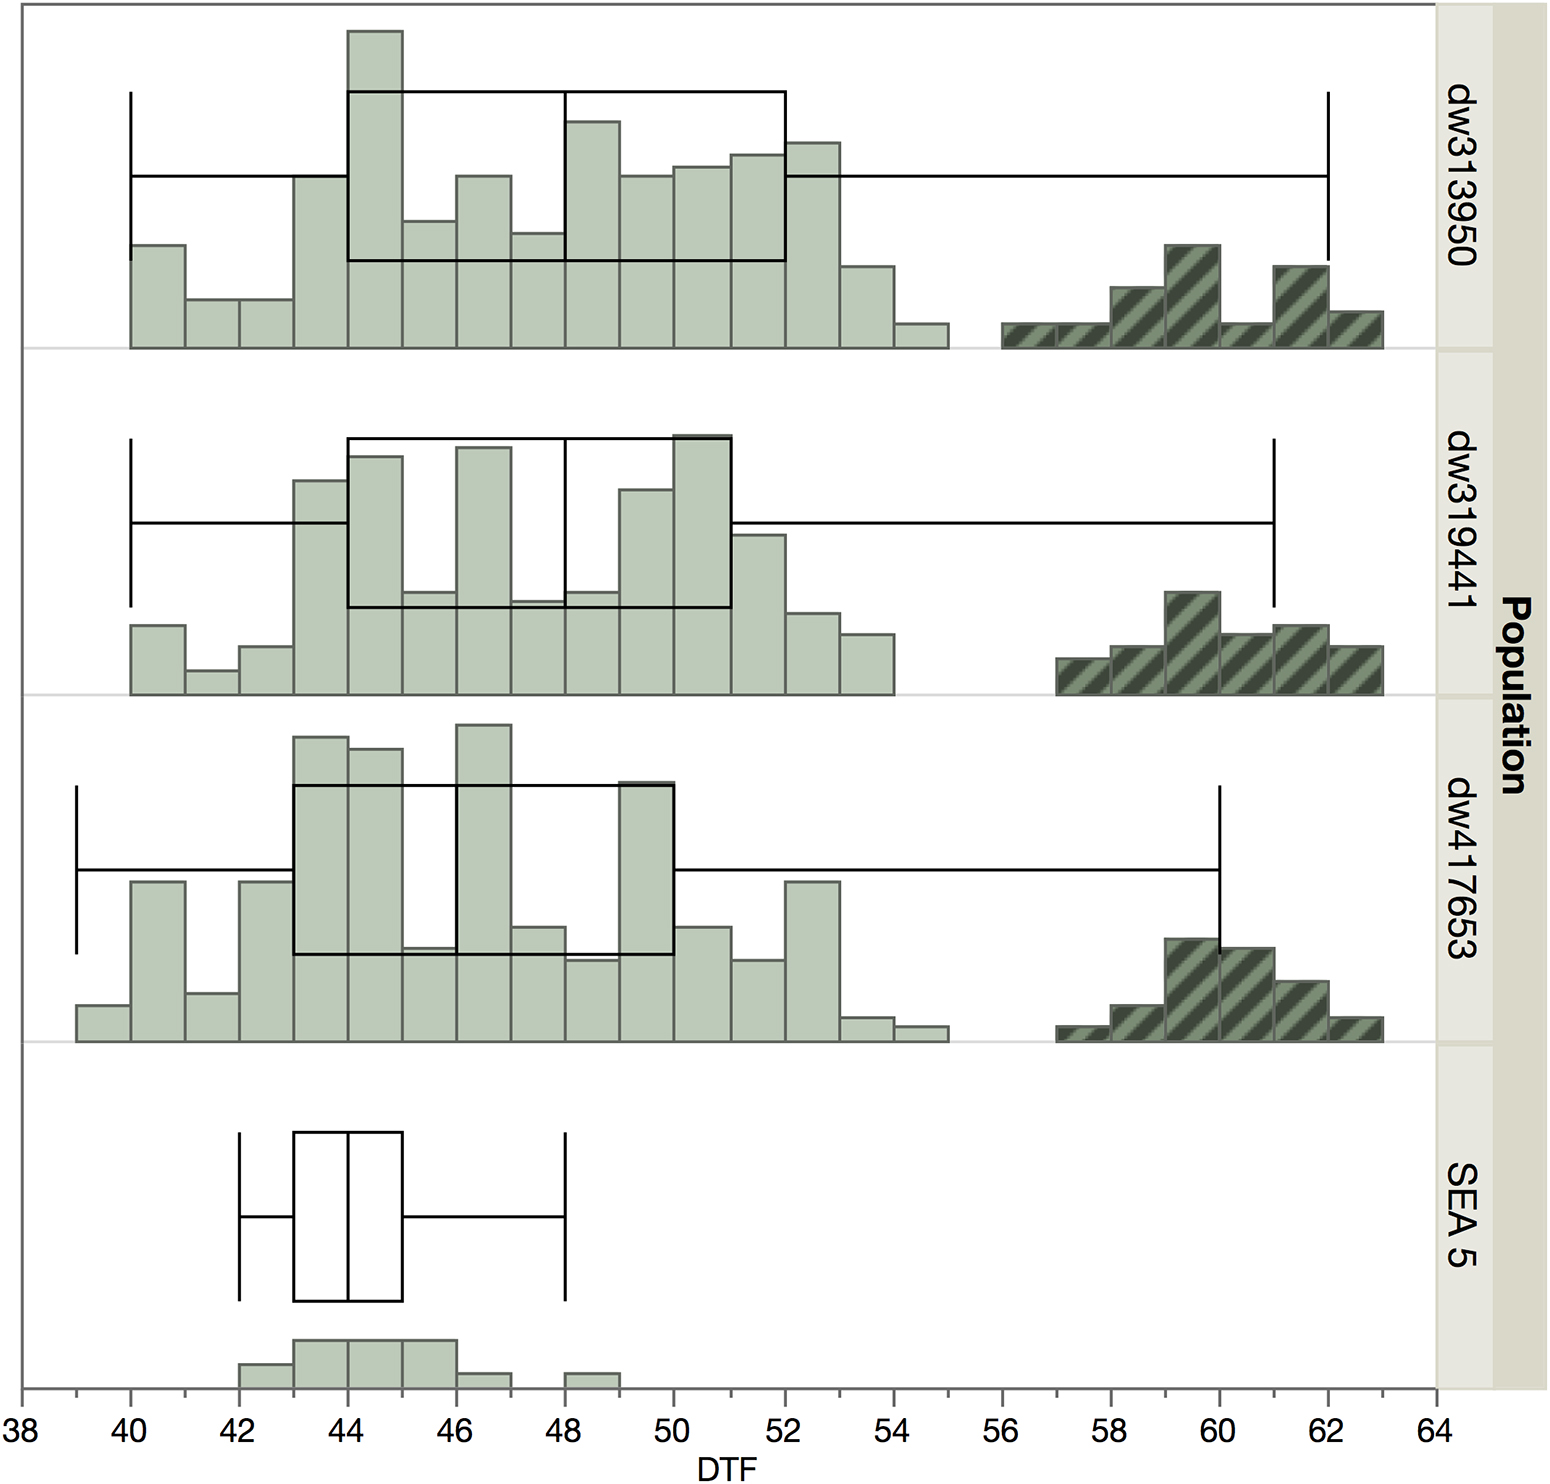
Figure 1. Distribution of flowering time among populations and SEA 5 in 2014. The highlighted accessions in the later part of the distribution were not planted in 2015 to minimize the effect of phenology.
Grain yield was measured per experimental plot and extrapolated to kilograms per hectare. Flowering time was taken when at least 50% of the plot had an open flower. Seed weight was evaluated in random subsample of 100 seeds.
Statistical Analyses
To adjust for within-field spatial variation, a two-dimensional tensor product was used, i.e., the penalized splines (P-splines) method with the package SpATS (Rodríguez-Álvarez et al., 2018) in R (R Development Core Team, 2018). Briefly, the method fits the mixed model y = Xβ+Xsβs+Zss+Zuu+Zgg+e, where β and βS are vectors that include the intercept and check cultivar effect as fixed term, XSis the design matrix, Xsβs and Zss are fixed and random components of the mixed model, respectively, s is the vector of random spatial effects, u is a random row and column effect sub-vector accounting for discontinuous variation, and g is the random genotypic effect (Malosetti et al., 2017; Rodríguez-Álvarez et al., 2018). The genotype was considered as a random effect in both years and irrigation treatment as a fixed effect in the second year. An analysis of variance was carried out as a linear mixed model using population, environment, and their interaction as fixed effects, and genotype within population as random effects. The evaluations in 2014 under full irrigation, in 2015 under terminal drought and full irrigation were considered as separate environments. The statistical analyses were performed with JMP (SAS Institute Inc., 2016). The Drought Susceptibility Index (DSI) calculated from the two irrigation treatments in 2015 as (1 – Yds/Yns)/1 – (Xds/Xns), where Yds and Yns are yields in drought stress and no stress environments, respectively, and Xds and Xns are the overall yield under drought stress and no stress treatments, respectively (Fischer and Maurer, 1978; Beebe et al., 2013).
Genotyping
The BC-RILs, parents, and F1 hybrids were genotyped with the BARCBean6K_3 BeadChip platform of 5,398 SNP markers (Song et al., 2015) at the Genome Center at the University of California-Davis. After filtering in GenomeStudio Module v1.8.4 (Illumina Inc., San Diego, CA, United States), SNP calling was performed with the software’s cluster algorithm, with subsequent manual adjustments and a quality control with a 0.15 Gencall score cutoff. The markers were filtered for less than 10% missing data and polymorphism between parents, verified with the F1 hybrids.
Map Construction
Linkage maps were constructed for each population in R (R Development Core Team, 2018) using the package asMAP (Taylor and Butler, 2017). Genetic distances were determined using the Kosambi function (Kosambi, 1944). The recombination fraction was estimated with qtl (Wu et al., 2003). A consensus map, combining results for the three individual maps, was developed with LPmerge (Endelman and Plomion, 2014), with the linkage maps of the three populations constructed without first filtering for co-located markers, to maximize the markers shared among populations. LPMerge uses linear modeling to keep the maximum interval with the lowest root mean squared error applying weights to population size (Endelman and Plomion, 2014). When there were co-localized markers in the consensus map, only one marker per bin was kept. Chromosomes were numbered Pv01 to Pv11 matching the standard numbering in P. vulgaris (Pedrosa-Harand et al., 2008).
QTL Mapping
The QTL analysis was performed with the NAM function of QTL IciMapping version 4.1 (Meng et al., 2015). The NAM module implements joint inclusive composite interval mapping (JICIM), uses generalized linear models with population and marker by population interaction as fixed effects through stepwise regression for marker selection and subsequent interval mapping with adjusted phenotypes from the selected markers outside the current marker interval (Li et al., 2007, 2011; Wang et al., 2016). A probability of 0.01 and a step of 1 cM was used for the stepwise regression and the significance. The LOD threshold was calculated by 2,000 permutations in each environment at a significance level of 0.05. Furthermore, a QTL analysis was also conducted for the average yield across the three environments in 2014 and 2015 and the drought susceptibility index (DSI).
Data Availability
The marker segregation and phenotypic evaluation data have been deposited in the Dryad public database: https://datadryad.org/stash/dataset/doi:10.25338/B8FW3M.
Results
Sources of Variation
The effects of population, environment, and their interaction were highly significant (Table 1). Nevertheless, the environmental effect was larger (F = 1,672, P < 0.001) than both population and their interaction (F = 5.7 and 3.6, at P < 0.01, respectively). Across environments, the yield of the dw417653 population was the highest, being significantly higher (113 kg, +11%) than the yield of the dw343950 population, whereas the dw319441 population was not statistically different from other two populations. Across populations, the yield in 2014 was significantly lower than both water regimes in 2015, with a reduction of 56 and 47%, relative to drought and well-watered treatments, respectively. There was a significant yield reduction in 2015 because of terminal drought, with 17% lower yield relative to the irrigated treatment.
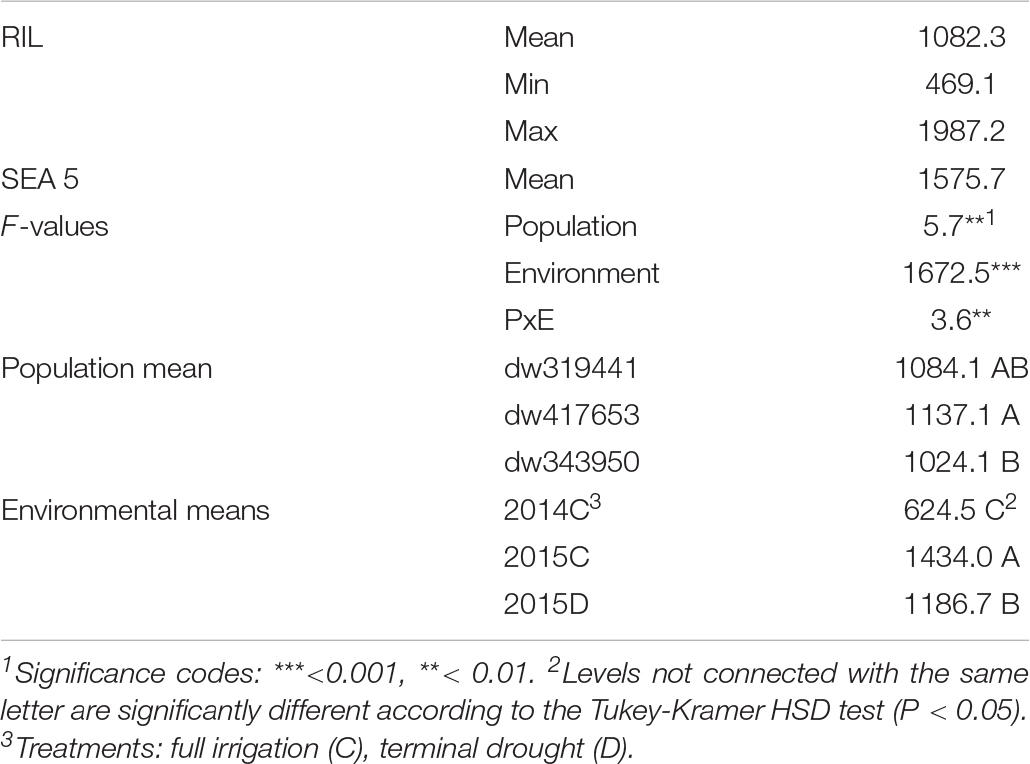
Table 1. Descriptive statistics and analysis of variance for yield (kg ha–1) for three backcrossed inbred lines and the recurrent parent evaluated in three environments.
Comparison of Populations Across Environments
Although the population by environment effect was significant (Table 1), the ranks of the performance of the populations were similar between environments. Across environments, the dw417653 population produced higher yield than the dw319441 population, which, in turn, was higher than the dw343950 population. However, population dw417653 was significantly different from population dw343950 only in 2015 (Figure 2). In all environments, the average of the population yields was lower than that of SEA 5. Across environments, SEA 5 produced 45% more yield than the average of the RILs (Table 1).
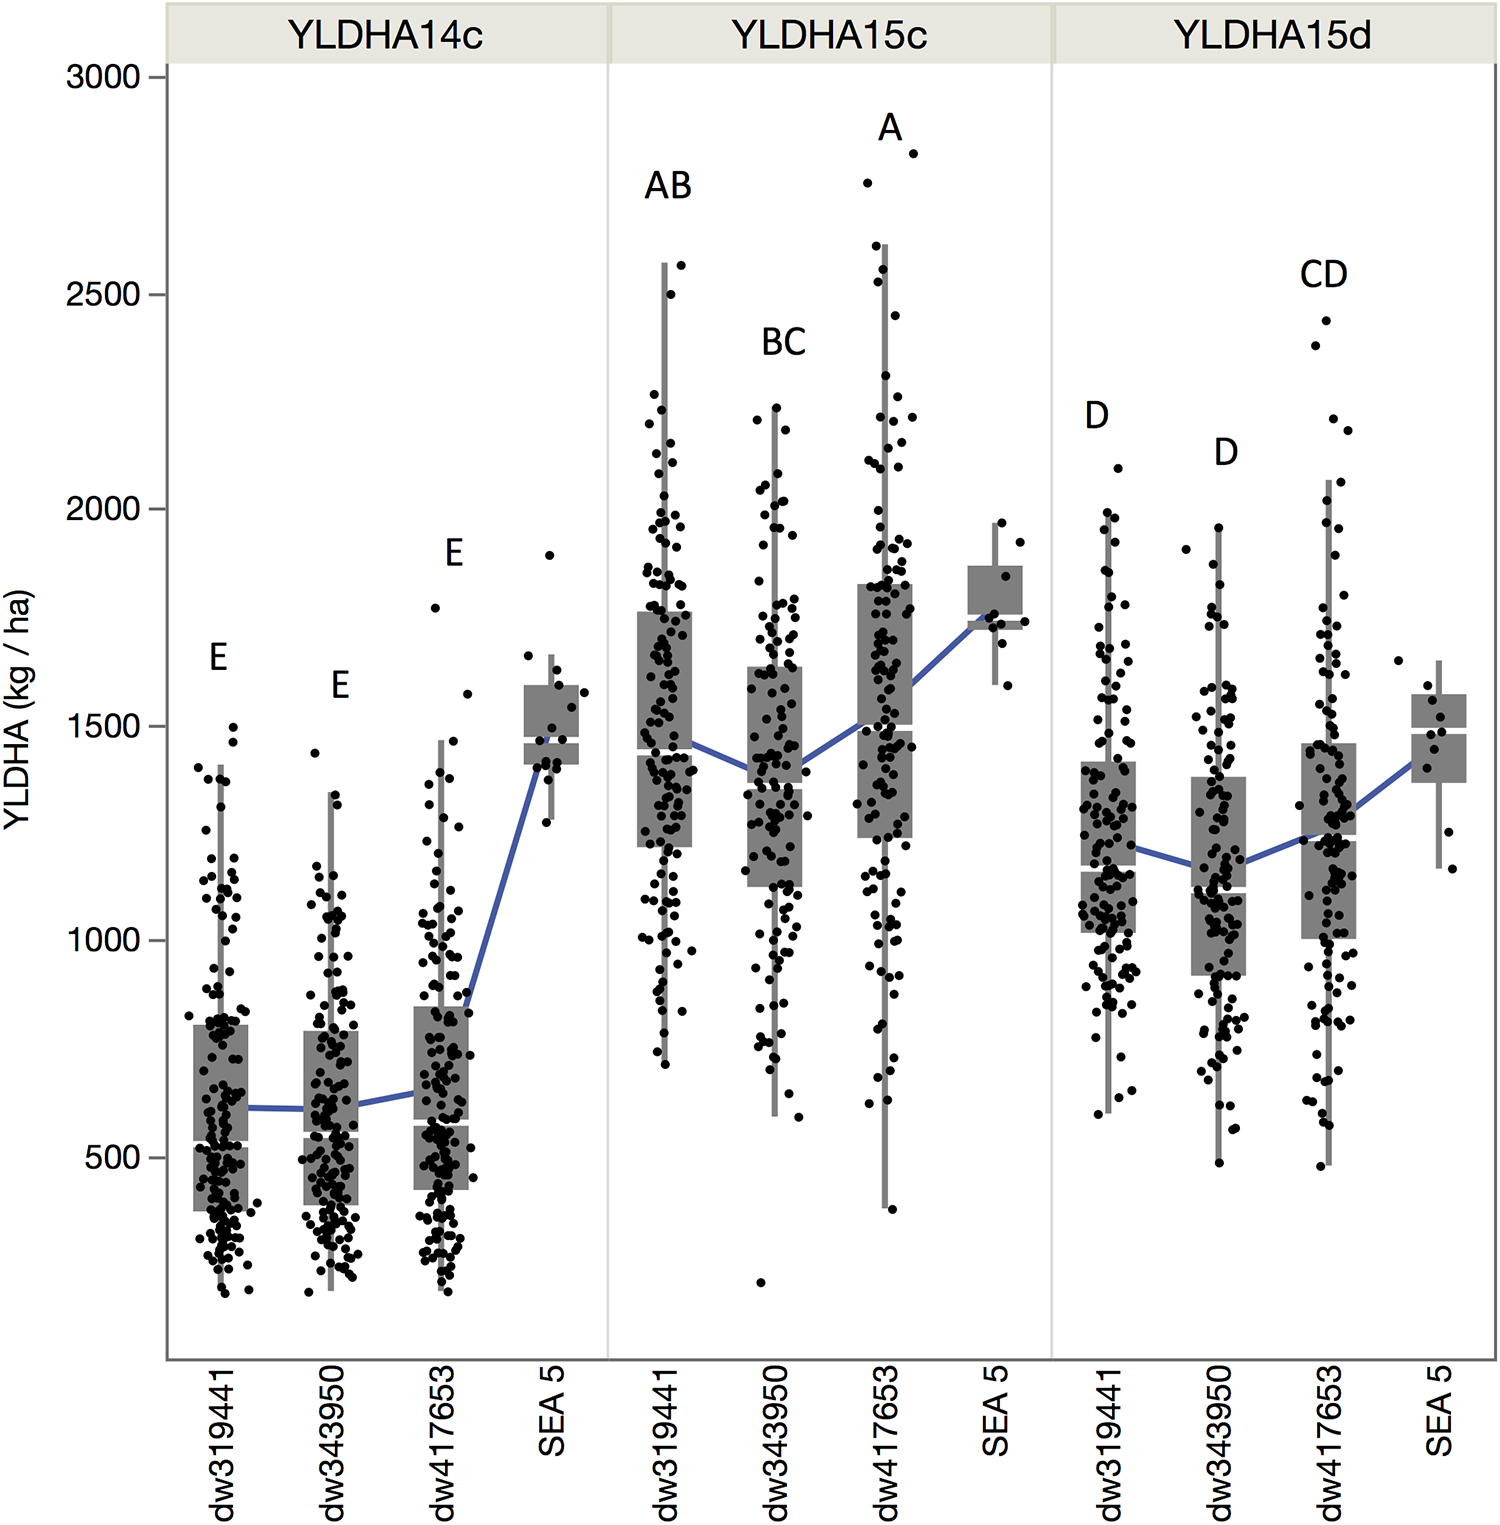
Figure 2. Quantile boxplot and overall mean (green line) of the yield of the three populations and recurrent parent for the three environments: fully irrigated in 2014 (YLDHA14c), fully irrigated in 2015 (YLDHA15c), and terminal drought in 2015 (YLDHA15c). Averages not connected with the same letter are significantly different according to the Tukey-Kramer HSD test (P < 0.05).
For breeding purposes, some RILs showed transgressive segregation for higher yield compared to the average of SEA 5 plots in 2015, although none were higher than the highest yielding SEA 5 plot in 2014 (Figure 2). However, in 2015 in both treatments, some RILs yielded more than the highest plot of SEA 5. Furthermore, there were high-performing RILs from each population in both years and treatments (Figure 2). Two populations, dw417653 and dw319441, included progeny lines with yields that were significantly higher (+20% on average) – across the three environments – than that of the domesticated control SEA 5 (Table 2). These lines, nevertheless, had similar number of days to flowering (42 to 54 days vs. 47 for SEA 5) and only slightly smaller seeds than SEA 5) (15–20 g/100 seeds vs. 24 g/100 seeds for SEA 5; Table 2).
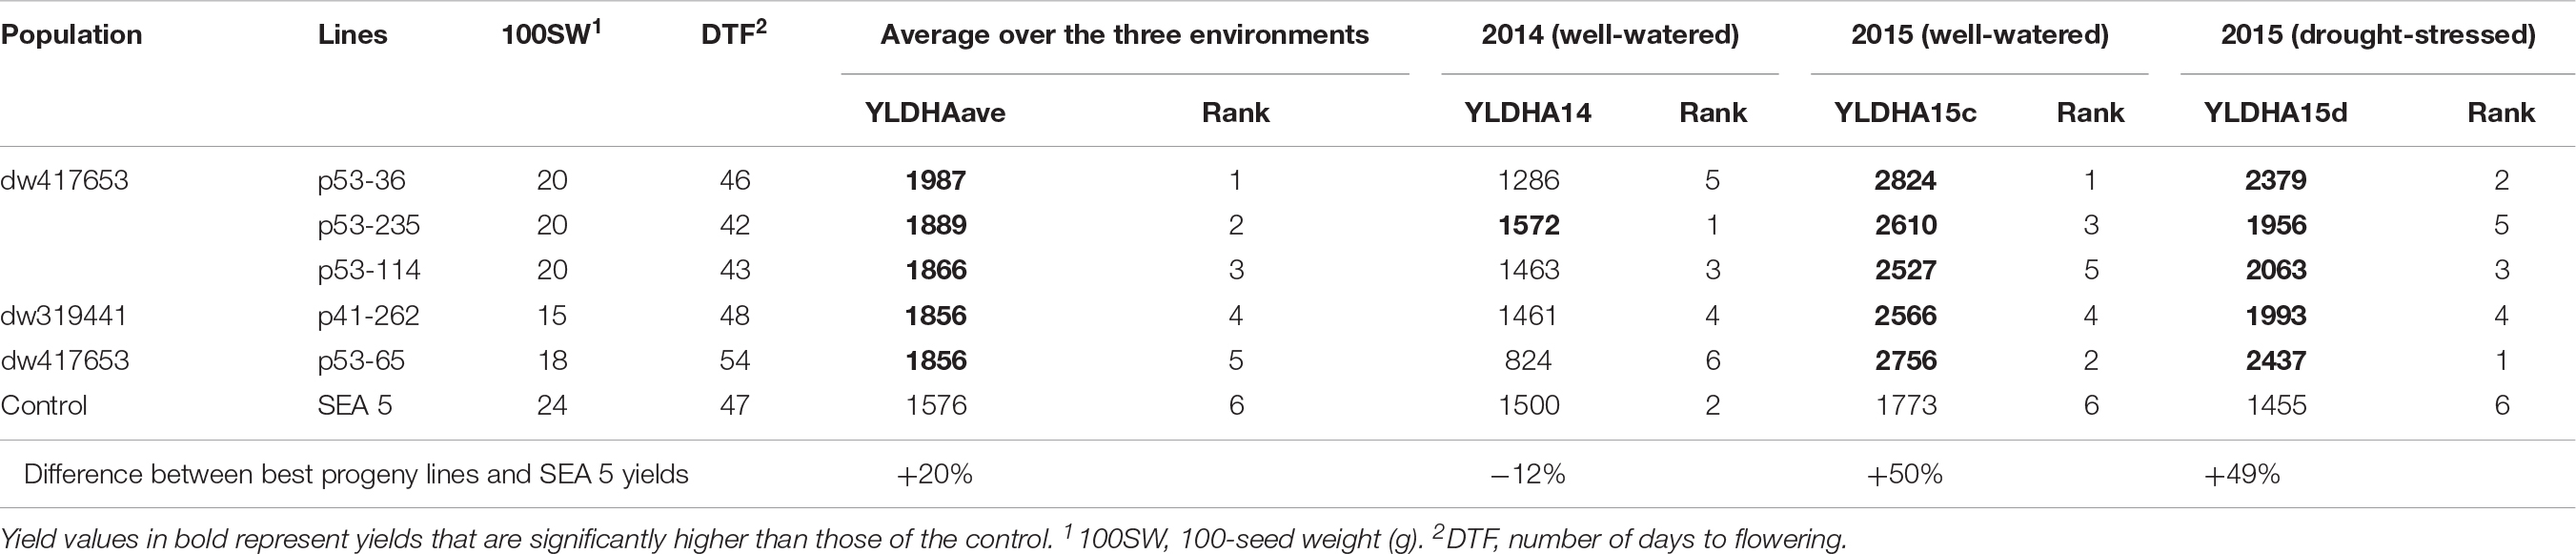
Table 2. Progeny, backcross-inbred lines with highest yields (kg ha–1) across the three environments [fully irrigated in 2014 (YLDHA14), fully irrigated in 2015 (YLDHA15c), and terminal drought in 2015 (YLDHA15d)].
Correlations Among Traits and Distribution
The correlation of yield between the 2014 and 2015 well-watered treatments and the 2015 terminal drought treatment was relatively low, with an R of 0.51 and 0.5, respectively (Figure 3), but the correlation between drought and well-watered conditions in 2015 was higher (R = 0.88). The overall distributions of yield among the RILs in the first year and in 2015 under drought were not normally distributed (P < 0.001, Shapiro–Wilks test) but were skewed toward the low- yielding side of the distribution, while the distribution of yield in well-watered plots in 2015 was normally distributed (P = 0.17).
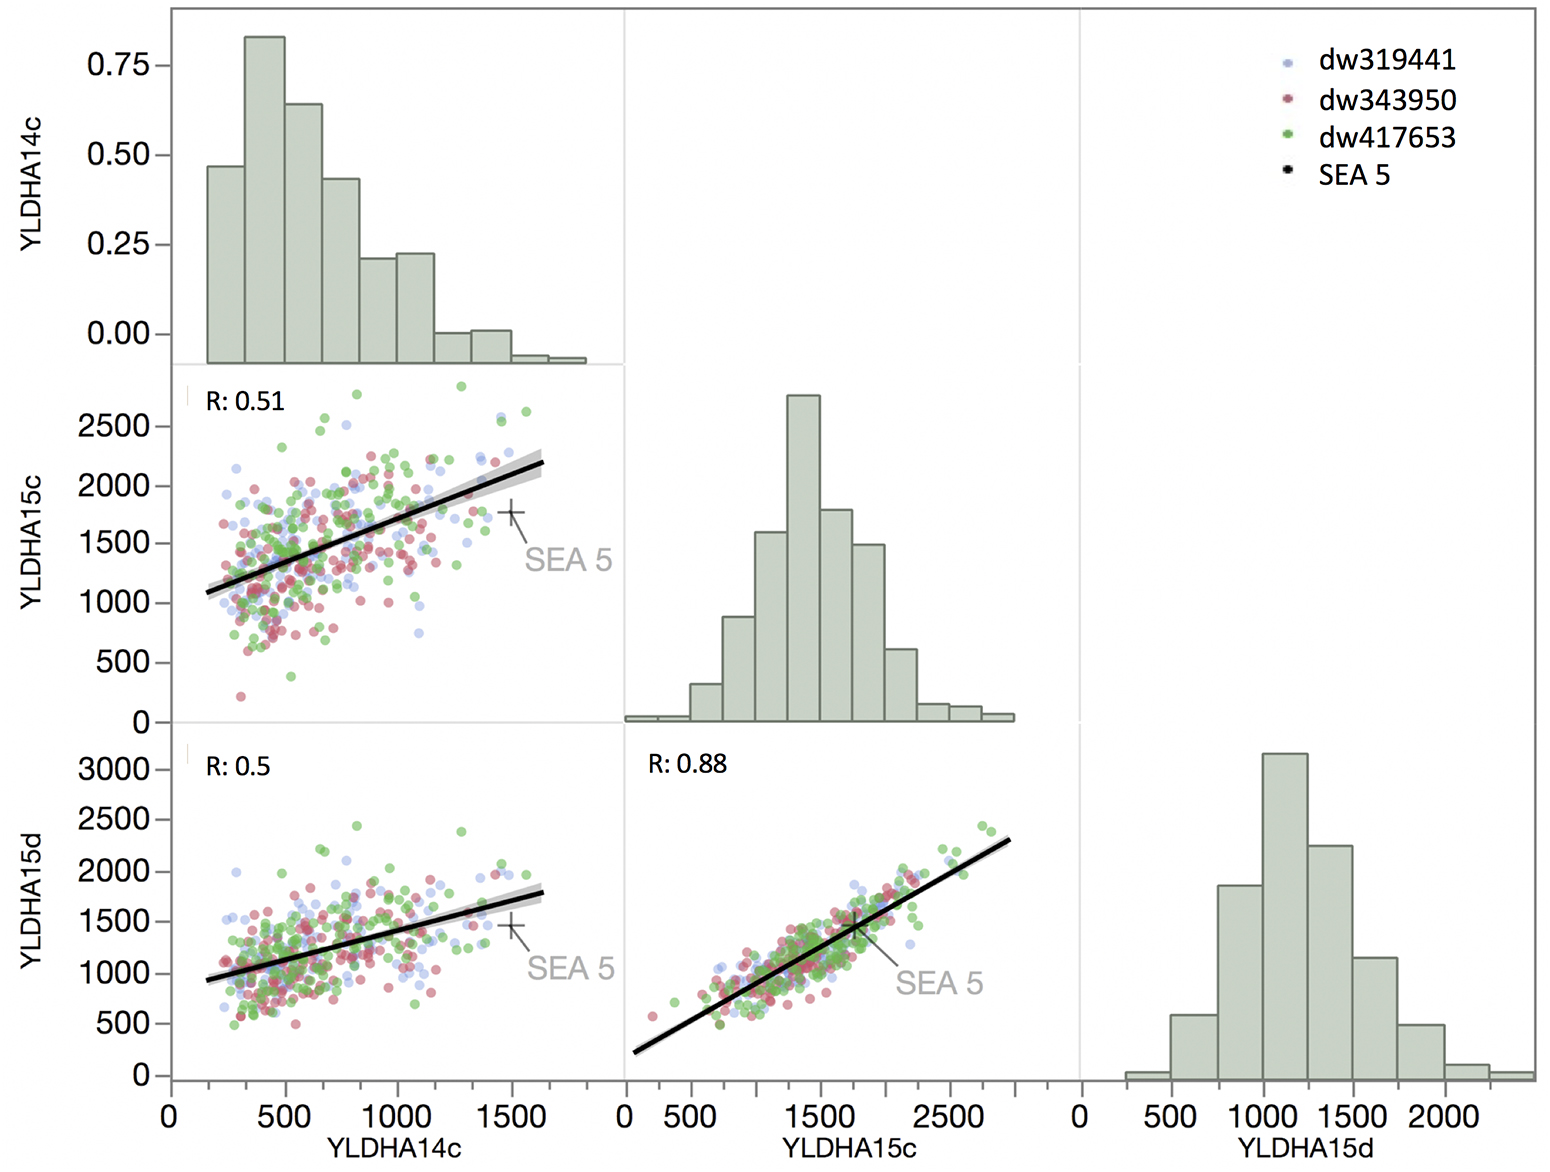
Figure 3. Matrix of trait frequency distribution (diagonal), joint distribution and correlation coefficient (lower triangle) of yield evaluated in 2014 under full irrigation (YLDAH14c) and in 2015 under full irrigation and terminal drought (YLDAH15c and YLDAH15d, respectively). Traits. The mean of SEA 5 is showed as plus (+) sign.
Molecular Linkage Map and QTL Analyses
Polymorphism, Recombination Rate and Allele Frequency
There were 1554, 1404, and 1499 polymorphic markers between SEA 5 and PI 343950, PI 417563, and PI 419441, respectively. Jointly, there were 2,201 polymorphic markers between the wild accessions and SEA 5 and 1,858 markers shared among the three wild accessions. The trends in recombination rate were similar across populations. Higher recombination rates were observed in the distal parts of all the chromosomes, except on chromosome Pv06 where higher recombination was observed from the middle to the distal portion and chromosome Pv09 where higher recombination was located in the second and fourth quarter of the chromosome (Figure 4).
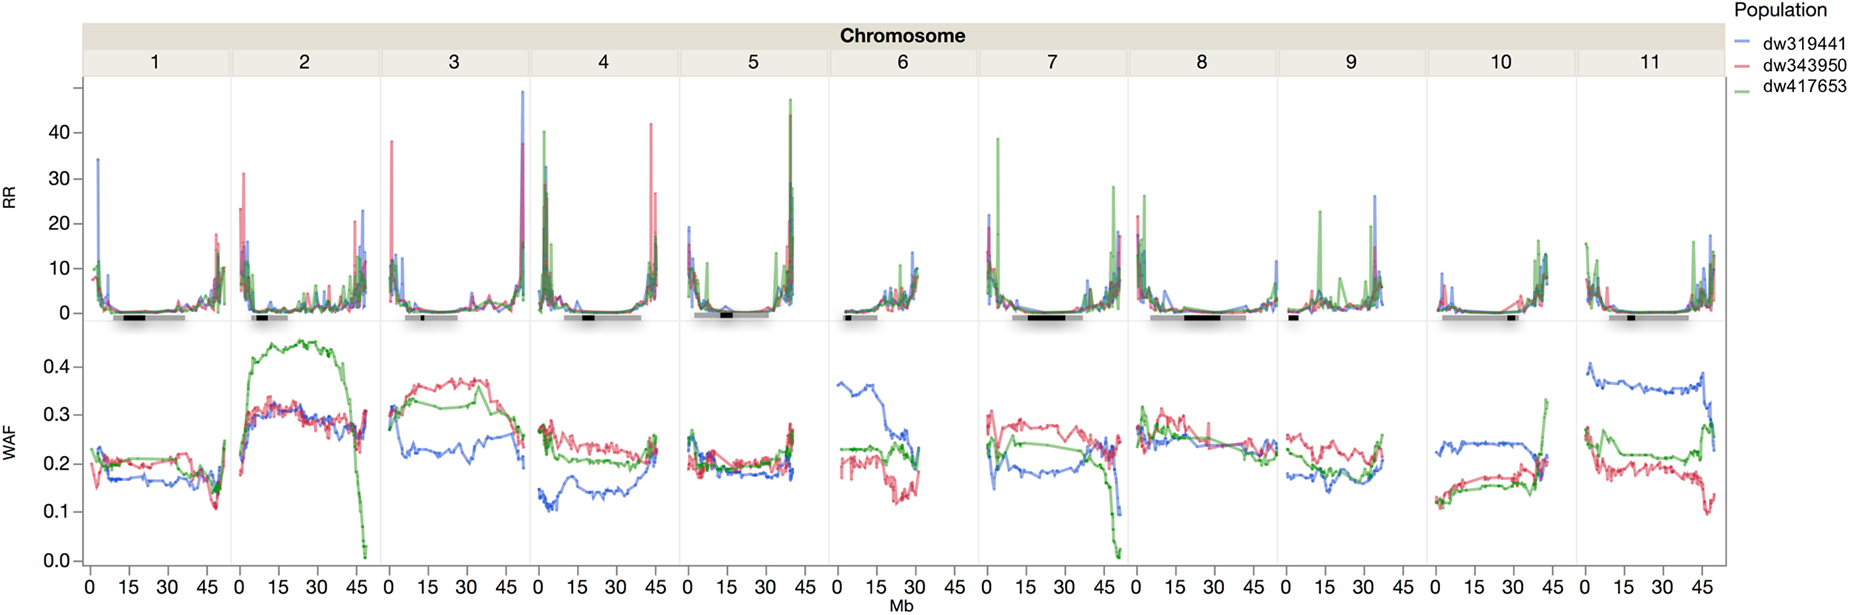
Figure 4. Recombination rate (RR, cM Mb–1) and wild allele frequency (WAF) of the three wild by domesticated populations. The horizontal lines represent the approximate location of the pericentromere (gray) and centromere (black) according to Schmutz et al. (2014).
The wild allele frequency was variable between and within chromosomes. After one backcross to the domesticated parent, one would expect an average frequency of 0.25 of the wild parent. The average frequency was 0.23 across chromosomes, with a range of 0.17 to 0.4, in Pv01 and Pv02, respectively. The populations had similar frequencies across chromosomes; however, within chromosomes there were differences among populations. For example, in Pv02, compared to the other two populations, the dw417653 population showed higher wild allele frequency in the central region but very low frequencies at the chromosomal ends. In Pv10, the P319441 population had higher wild allele frequency than the other populations. In some chromosome regions, all three populations showed a lower than expected wild allele frequency, like in the distal region of Pv01. There were two regions with markedly low wild allele frequency, the region mentioned before in Pv02 and another region in Pv07, both at the end of the chromosomes.
Consensus Molecular Linkage Map
The consensus map was built with 721 markers and had a genetic length of 925 cM (Table 3). Per chromosome, there were on average 66 markers, an average length of 84 cM, and an average spacing of 1.3 cM. The average maximum spacing was 9 cM, while the largest interval was 14 cM in Pv01. Through a comparison of the range of the markers on each chromosome and their physical position according to the G19833 reference genome version 2.1 (Schmutz et al., 2014), the genetic map spanned 510,318,067 bp, which represents 99% of the sequenced genome. The coverage ranged from 96.5% of Pv06 to 99.7% of Pv08.
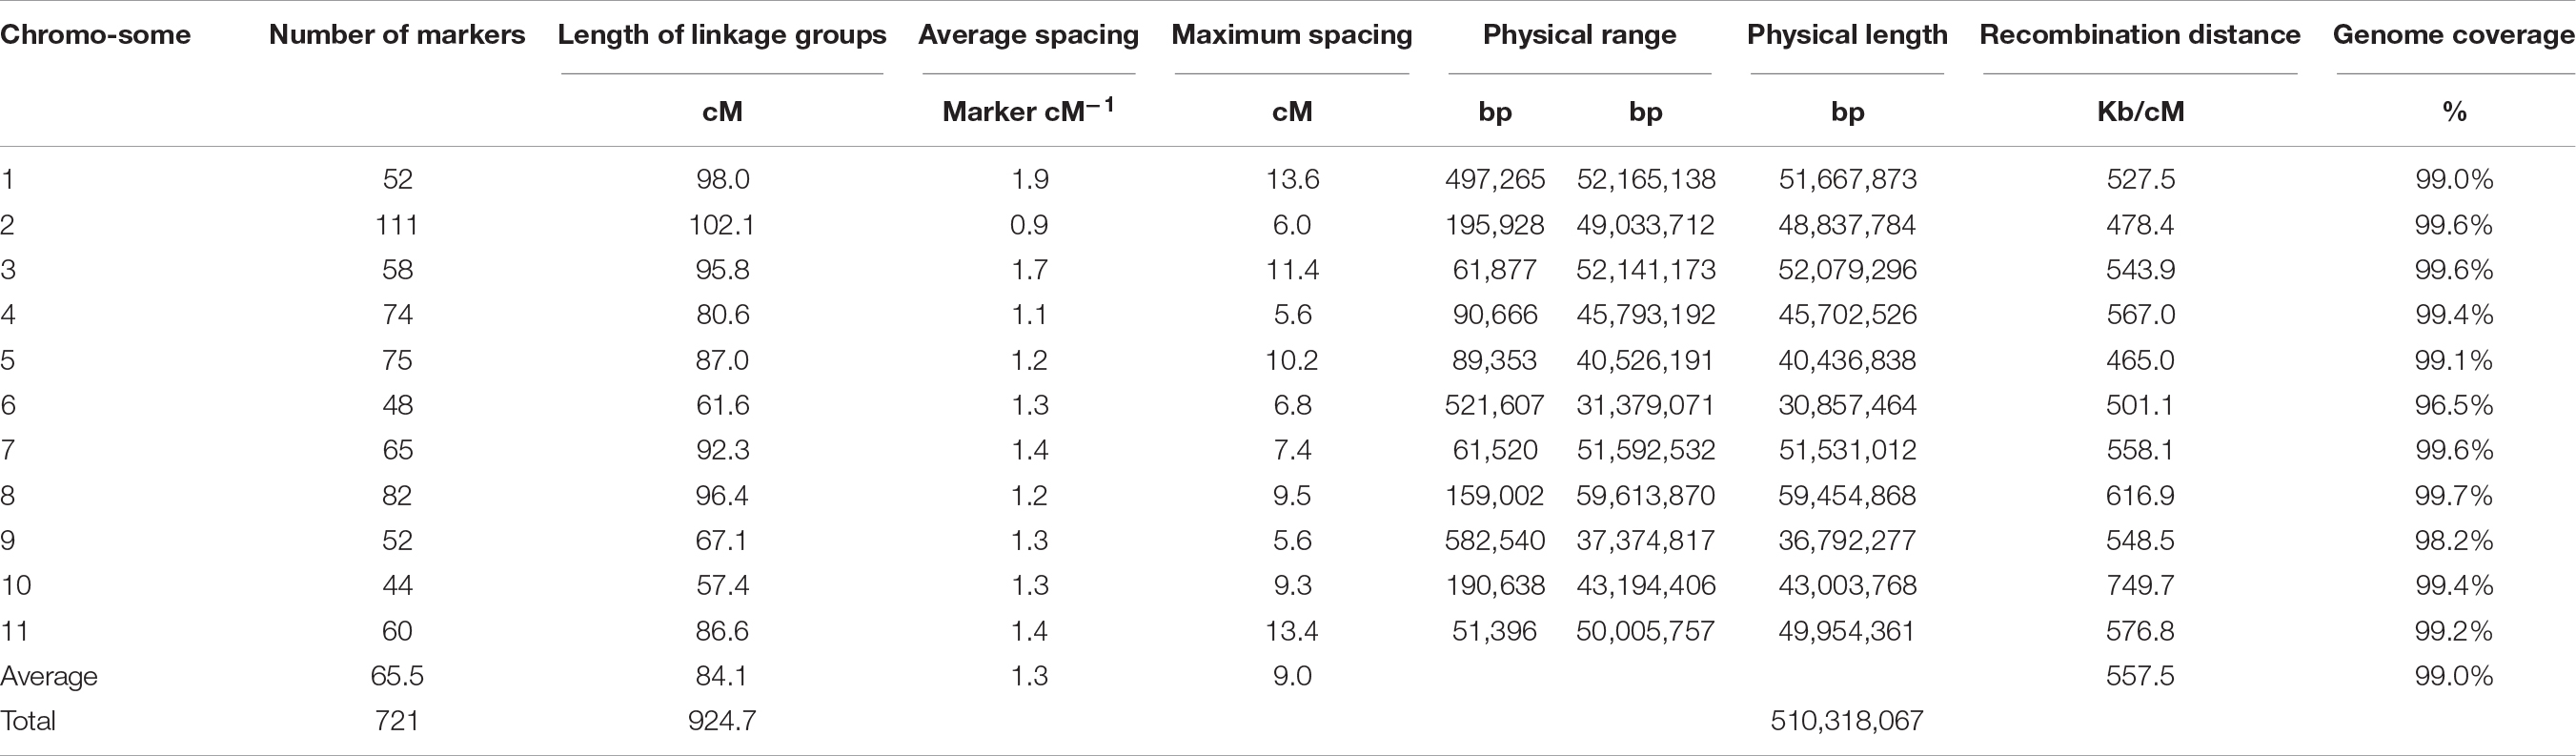
Table 3. SNP distribution among the linkage groups/chromosomes of the consensus map.
Identification of Additive QTLs and Their Distribution on the Molecular Linkage Map
QTL analyses were performed for grain yield in each environment, consisting of 2 years grown in full irrigation, terminal drought in the second year, and the average yield across environments. The same analysis was conducted for the DSI calculated from the drought and well-watered conditions in 2015 (Table 4 and Figure 5). Significance thresholds for LOD scores, calculated by permutations for each environment, were 3.7 (environment 2014), 3.6 (2015c), and 3.6 (2015d). LOD scores for averages across environments had a threshold of 4.7. The threshold LOD score for DSI was 12.1. Twenty QTLs had LOD scores about the respective thresholds. They were distributed on eight chromosomes. These included three QTLs in 2014, five in 2015c, six in 2015d, five for the average across environments, and one for DSI.
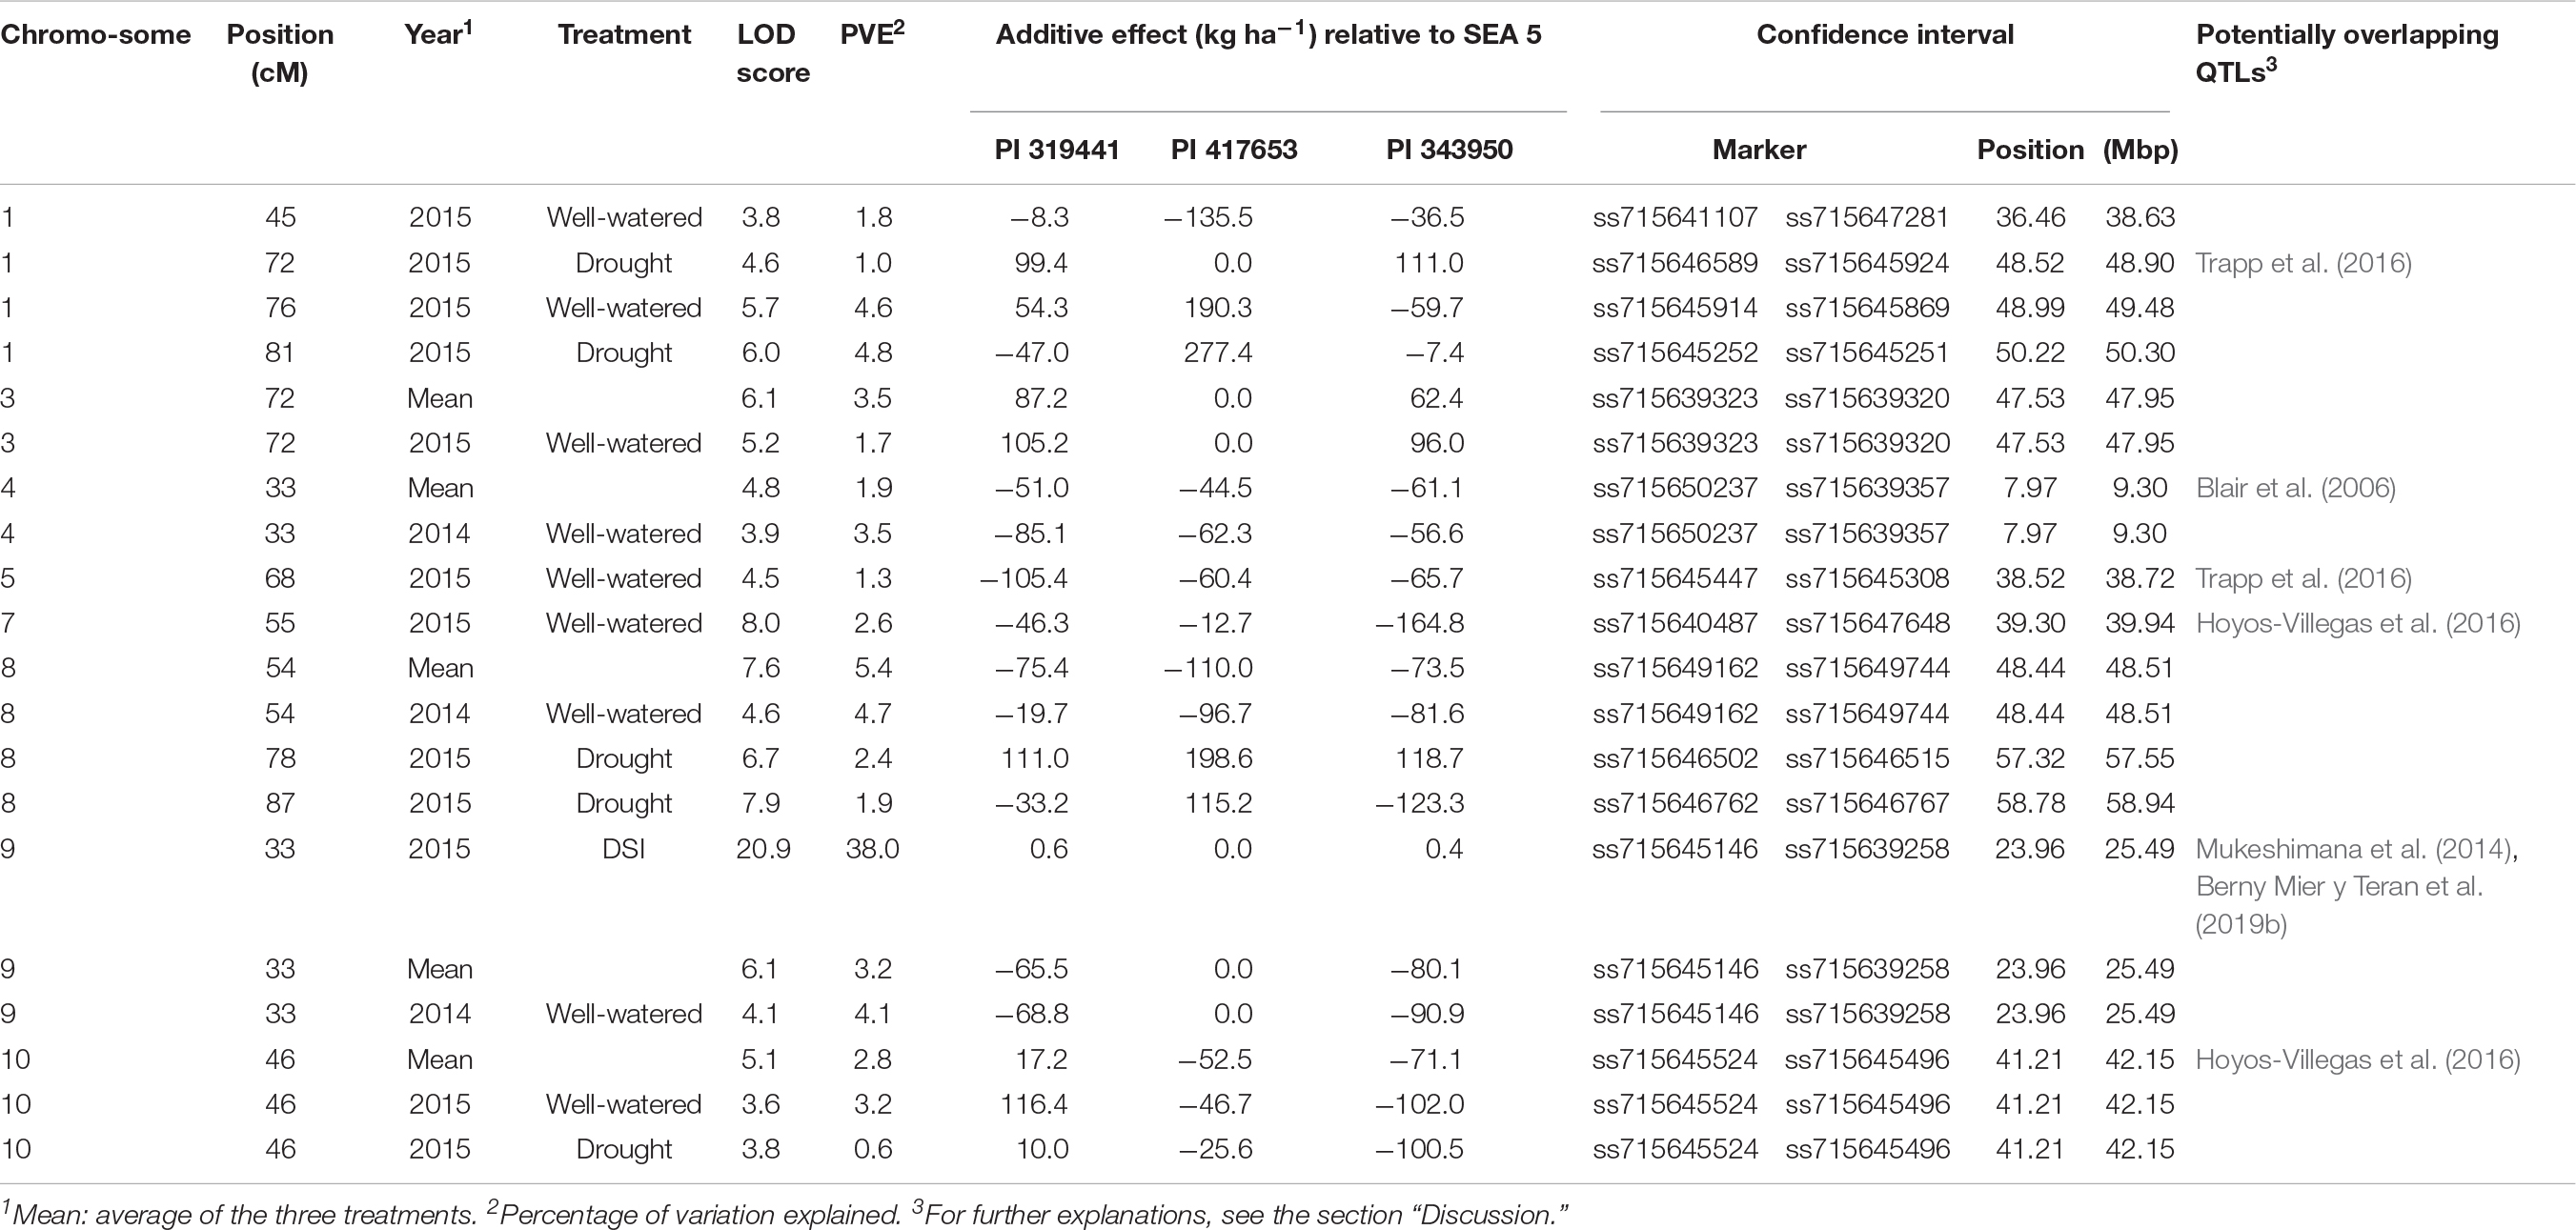
Table 4. Summary of the QTL analysis for yield (kg ha–1) and drought susceptibility index (DSI) evaluated in three environments (2014 and 2015 under full irrigation, and 2015 under terminal drought).
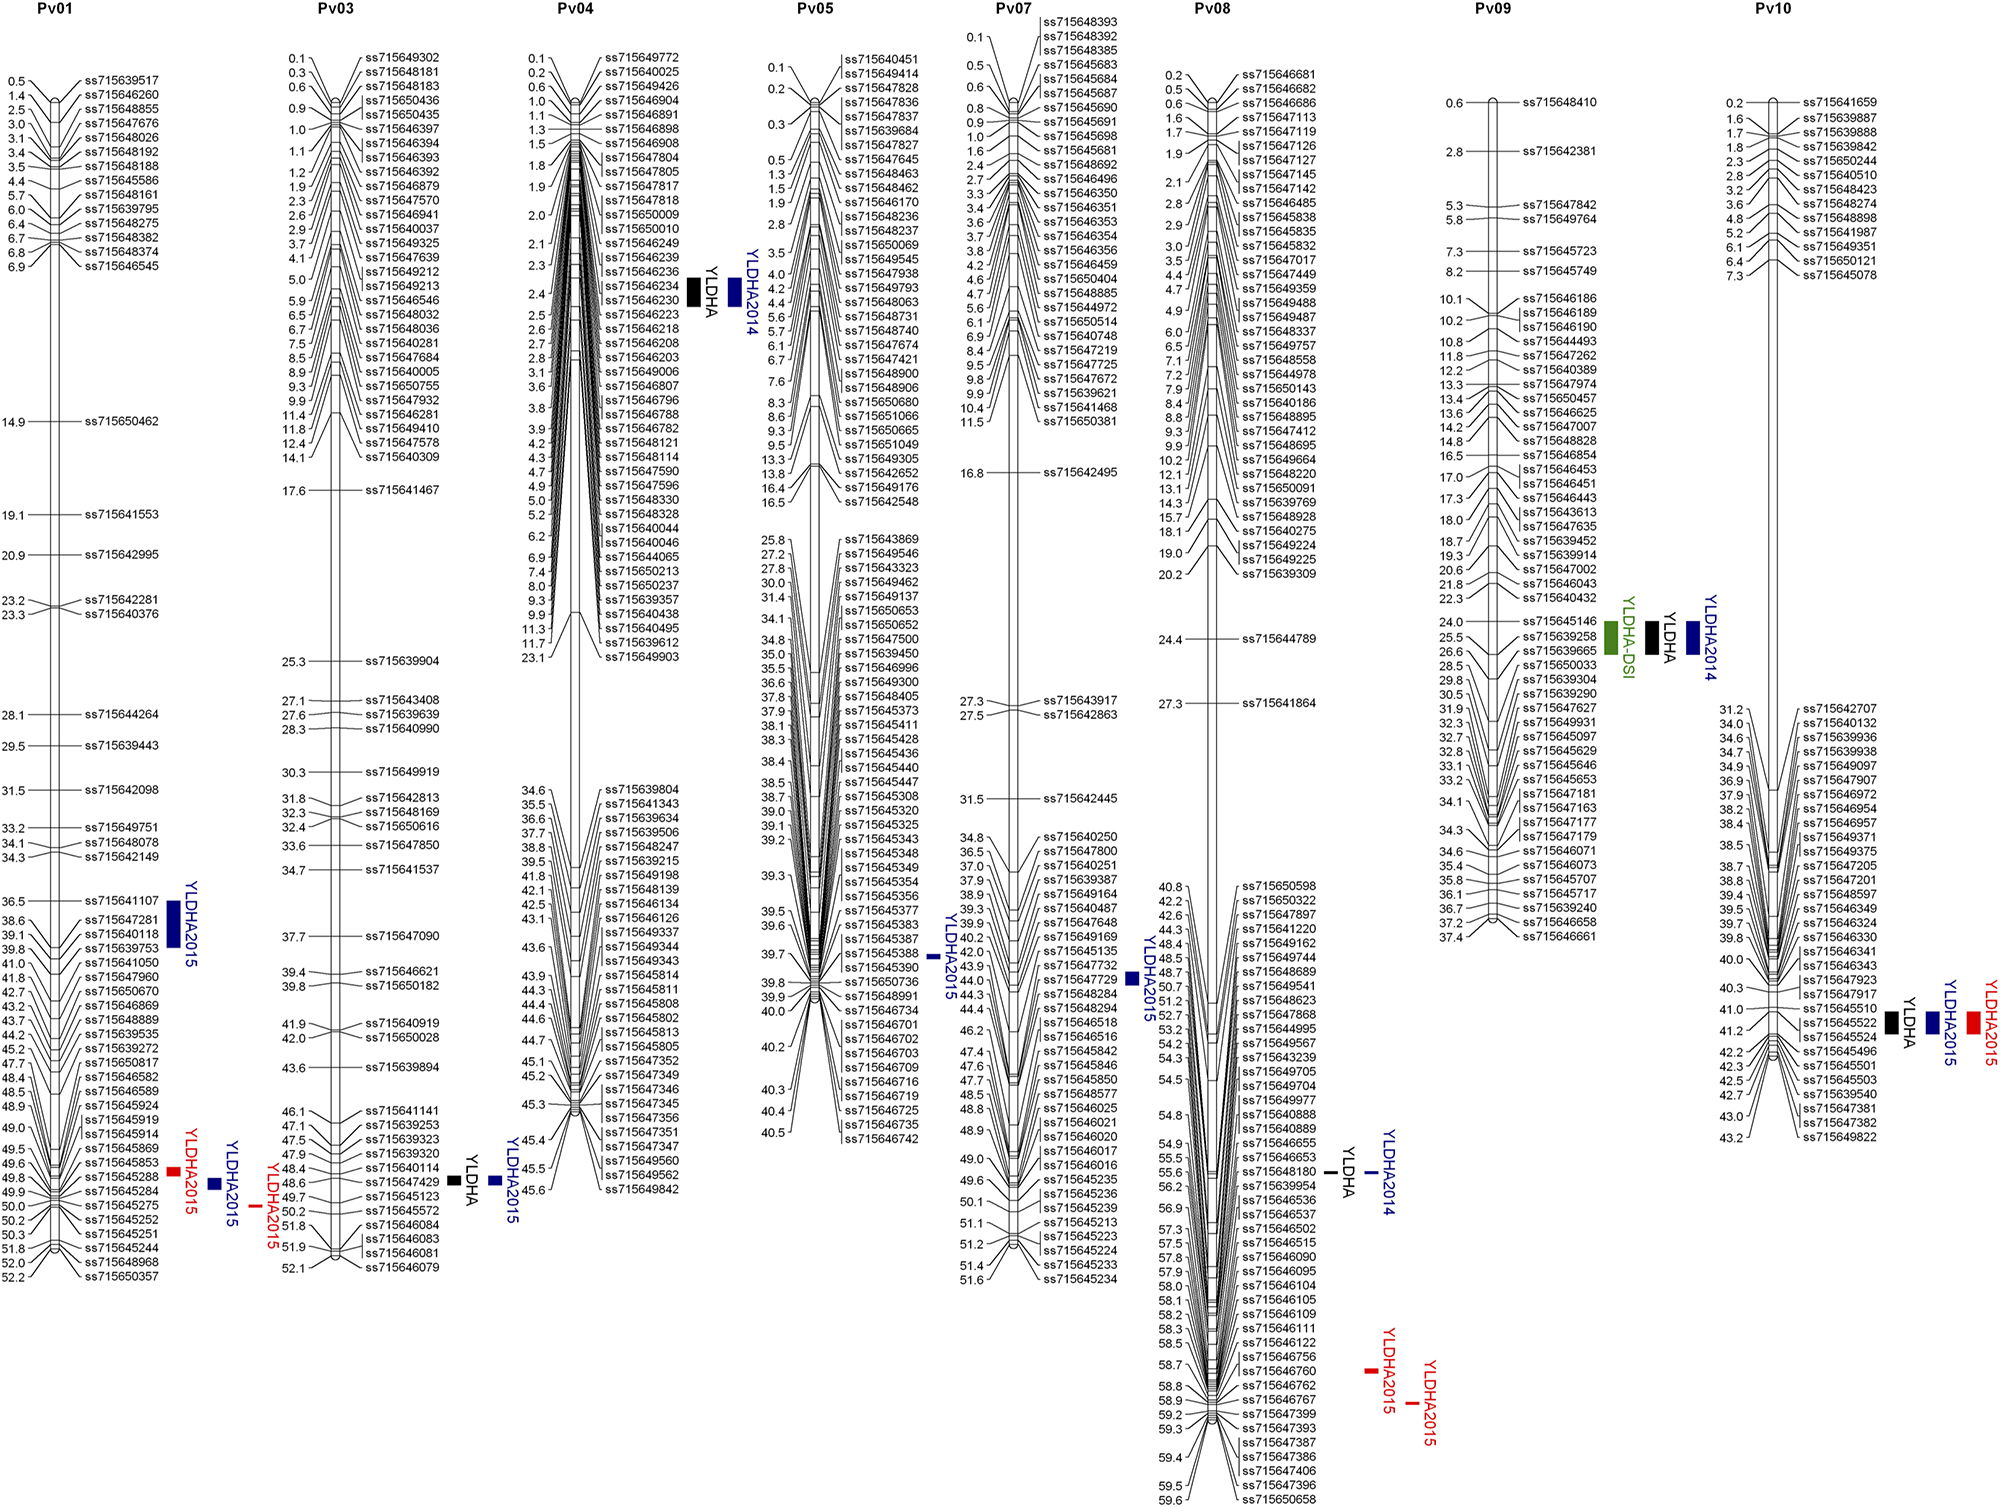
Figure 5. Joint chromosomal linkage map and QTLs for grain yield (YLDHA, kg ha– 1) and drought susceptibility index (DSI). The bars in blue represent the environments under full irrigation, red for terminal drought, black for the mean yield, and green for DSI. The position in the chromosome are the physical positions of the markers in Mbp and plotted with MapChart (Voorrips, 2002).
The magnitude of these QTLs ranged from 0.6% to 5.4% with an outlier at 38% (for DSI on chromosome 9, observed in the dw319441 and dw343950 populations). The allelic effects of the chromosome regions marked by these QTLs varied considerably among the three accessions between negative and positive values. The most negative value (−164.8 kg ha–1) was for yield QTL Pv07.55 in 2015, inherited from PI 343950. The largest positive allelic effect (277.4 kg ha–1) was observed in well-watered 2015 conditions and was inherited from PI 417653. Overall, the average allele effect of PI 343950 was the lowest in all environments and in the mean across environment (Figure 6 and Table 4). In contrast, the allele effect of PI 319441 was higher than that of PI 417653 in 2014 and 2015, both under full irrigation, while the average allele effect of PI 417653 was higher than that of PI 319441 under drought in 2015. In addition, the allele effects across genotypes were relatively higher under drought than under full irrigation in 2015. The average QTL significance interval was about 0.8 Mbp, ranging between 0.07 Mbp (on Pv08) and 2.18 Mbp (on Pv01). Many but not all QTL intervals appeared to be located toward the extremities of the chromosomes (Table 4).
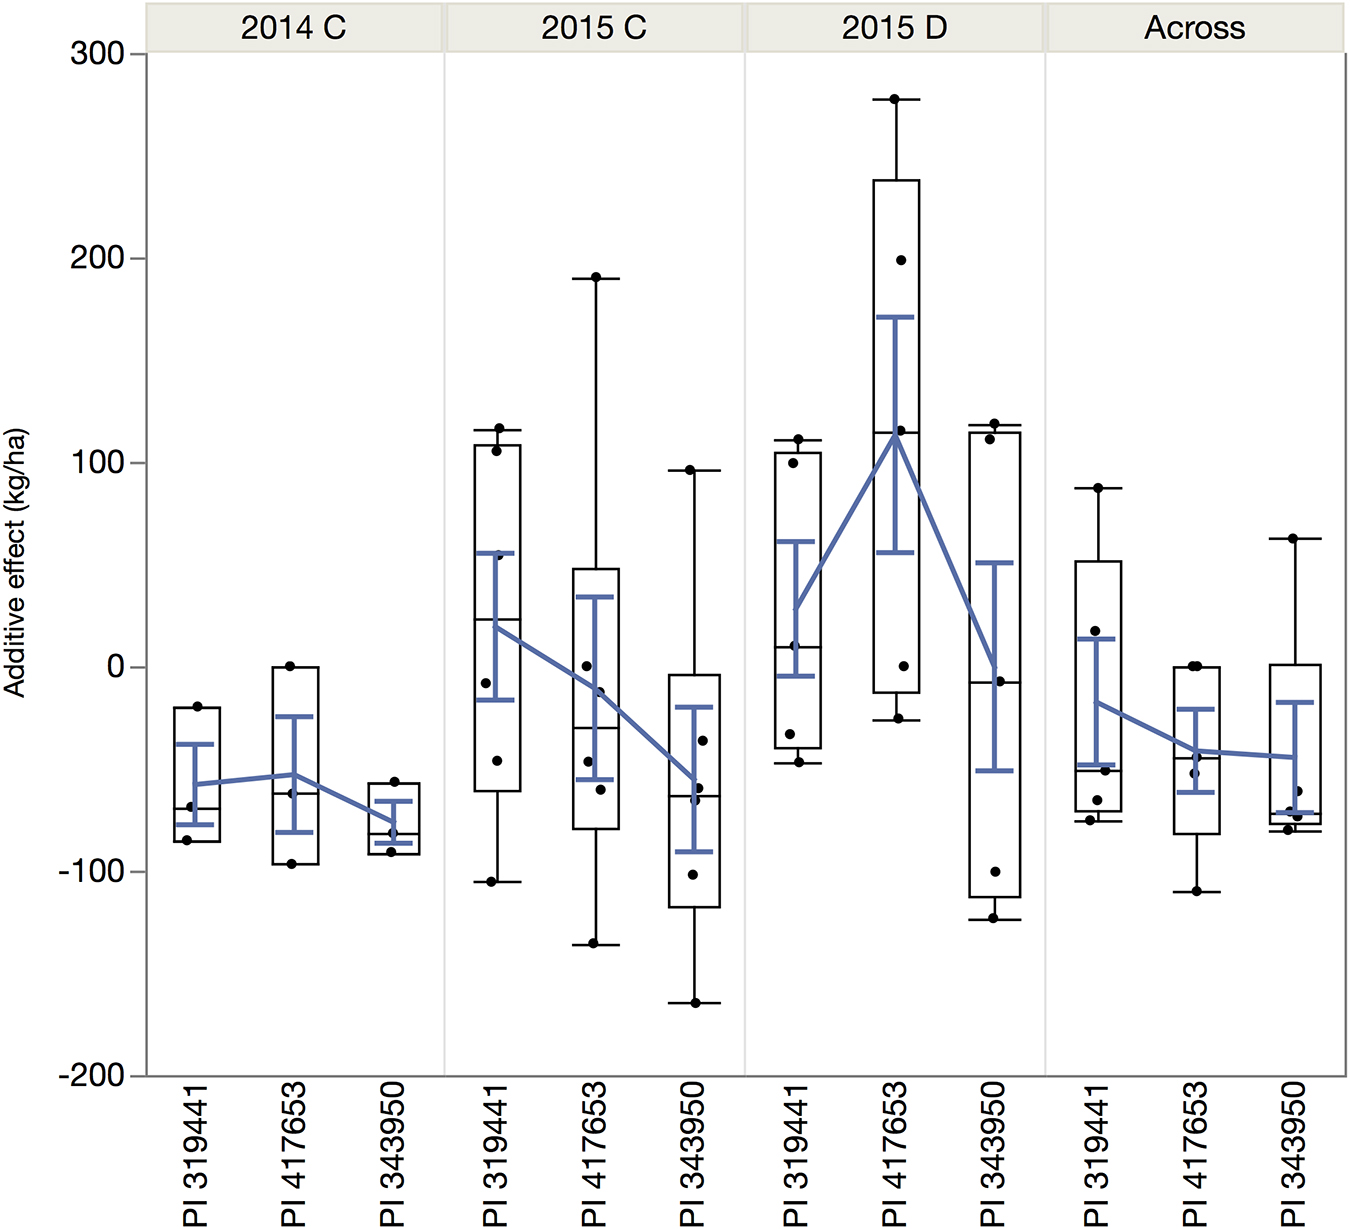
Figure 6. Quantile boxplot and overall mean (blue line) of the additive effect of the alleles of the wild accessions in comparison to the reference allele from SEA 5, the shared domesticated parent.
Discussion
Population Development and Segregation Distortion
The main objective of the investigation was to survey eco-geographic adaptive variation in wild beans as a source of novel alleles to increase productivity, as well as to test if these alleles have differential expression under drought constraints. A resource commonly used for genetic studies are diversity panels, which allow a large sample of the variation to be tested and higher genetic resolution to be obtained. Prior to this study, a panel of wild accessions of the Mesoamerican gene pool was evaluated in a greenhouse setting revealing phenotypic variation in root and shoot traits, as well as genomic regions controlling these traits (Berny Mier y Teran et al., 2019a). However, these studies are limited by the confounding effects of population structure and relatedness, as well as low power of detection of rare alleles (Anderson et al., 2011; Bazakos et al., 2017). Population structure is even more geographically constrained in wild bean populations than in its domesticated forms, as dispersal and intercrossing between wild populations are limited compared with domesticated populations (Papa and Gepts, 2003; Zizumbo-Villarreal et al., 2005). In addition, some wild forms, including in common bean, are not adapted to cultivated conditions, due to their profuse and extended climbing growth habit and photoperiod sensitivity (Acosta-Gallegos et al., 2007).
Multiparent populations have several advantages over biparental populations for genetic studies: an increase in allelic diversity, sample size at a specific locus (increasing the power of detection), and mapping resolution (Garin et al., 2017; Holland, 2015). Various schemes for multiparent populations have been proposed; they are mostly divided into two groups: intermating of many parental lines and interconnected biparental populations (Fouilloux and Bannerot, 1988; Cavanagh et al., 2008; Buckler et al., 2009; Holland, 2015). Here, three populations were developed from domesticated by wild crosses using an elite domesticated breeding parent, selected for drought tolerance, as the common parent and three wild accessions from a range of rainfall conditions from the driest part of the distribution in Durango, northern Mexico, to a high-rainfall region in highland Guatemala. A domesticated genotype as the common parent allows for comparison of QTLs contributed by the different wild genotype relative to each other and to those of the domesticated parent. Domesticated × wild nested populations have been developed in maize (Liu et al., 2016) and barley (Schnaithmann et al., 2014; Maurer et al., 2015; Nice et al., 2016). In all cases, the populations were developed after one to four backcrosses to the domesticated parent.
Inbred-backcrossed lines facilitate QTL detection (Kaeppler, 1997) as the lines are more homogeneous and their interaction with other traits can be defined more precisely. For example, the benefit of earliness as an escape for terminal drought can be better assessed in this type of population after measuring earliness and yield under different irrigation regimes (Beebe et al., 2014; Polania et al., 2017). In addition, if superior lines are identified in domesticated × wild inbred backcross populations, few or no additional backcrosses are needed for breeding use (Tanksley and Nelson, 1996). However, if a trait is controlled epistatically by one or more loci without independent additive effect in the wild, it will be more difficult to identify such epistatic interactions in backcross populations (Tanksley and Nelson, 1996; Kaeppler, 1997; Johnson and Gepts, 2002). Only one backcross generation was used to limit the loss of detection power of the effect of wild alleles as every added backcross decreases the number of alleles from the wild parent and, hence, the power of QTL detection (Kaeppler, 1997).
Nested populations have been developed and used to study an array of traits in maize (Buckler et al., 2009; Wu et al., 2016; Xiao et al., 2016), soybean (Song et al., 2017), rice (Fragoso et al., 2017), barley (Saade et al., 2016), wheat (Bajgain et al., 2016), and common bean (Hoyos-Villegas et al., 2016), among others. While wild by domesticated nested populations exist in maize (Liu et al., 2016) and barley (Schnaithmann et al., 2014; Maurer et al., 2015; Nice et al., 2017), ours is the first domesticated by wild nested population in common bean. Besides the beneficial alleles for yield, these three populations could be of great use as breeding material and for future evaluations as the domesticated parent and the wild accessions can be polymorphic for other potentially useful traits. In evaluations of wild germplasm, PI 319441 was found to have high sulfur amino acid content in the seed and a high degree of protein hydrolysis after cooking (Montoya et al., 2008), a high content in polyphenols (Espinosa-Alonso et al., 2006), a high iron concentration (Blair et al., 2013) and, thus, could be used as a source for improved nutrition. PI 417653 had a high root efficiency ratio (total P content: root area) in low nitrogen conditions (Araújo et al., 1998), a high level of resistance to cucumber mosaic virus (Griffiths, 2002), and medium tolerance to salinity during early vegetative growth (Bayuelo-Jiménez et al., 2002).
The average wild allele frequency in our populations was 0.23, very close to the expected frequency of 0.25 in a biparental population with a single backcross. Allele frequencies significantly different from the expected frequency can be due to genetic mechanisms of segregation distortion, selection against photoperiod sensitivity and late flowering, or unintended selection. Processes that lead to segregation distortion include gametic incompatibility, genetic load, and asymmetric allelic inheritance in heterozygotes (Bodénès et al., 2016; Lyttle, 1991) besides the selection applied to the populations during their development. Genomic regions of low wild allele frequency were found in various chromosomes. In Pv01, an area of low frequency in all three populations was found around the 48 Mb position. The low frequency of wild alleles is likely due to the presence of a photoperiod sensitivity gene, Ppd, identified in this region (Koinange et al., 1996; Kwak et al., 2008; Weller et al., 2019) and selected against during population development (Figure 1). Segregation distortion in this region has also been found in two biparental wild by domesticated common bean populations (Blair et al., 2006; Blair and Izquierdo, 2012).
At least two other photoperiod loci have been identified, but have not been mapped as yet: the locus Hr, which is recessive and hypostatic to Ppd (Gu et al., 1998; Kwak et al., 2008) and the locus Tip, which is also recessive and increases earliness at cooler temperatures in long daylength (White et al., 1996). Tip might be allelic to either Ppd or Hr (White et al., 1996). Other regions controlling quantitatively photoperiod sensitivity have been located on Pv03 and Pv04 (Wallach et al., 2018).
There were other regions almost devoid of wild alleles at the end of chromosome Pv02 in one population (dw417653) and at the end of Pv07 in two populations (dw319441 and dw417653). Distortion in the latter region was also observed by Blair et al. (2006). In contrast, some regions in Pv02 and Pv11 showed a wild allele frequency of 0.4, that is, higher than the expected wild allele frequency after a single backcross. Nevertheless, although QTL analyses assume low segregation distortion, including distorted markers does not necessarily increase false positives or bias the effect and position, especially in large populations (Xu, 2008).
Field Evaluation
The three populations were evaluated under field conditions in 2 years under optimal irrigation conditions. In the second year, a terminal drought stress was imposed by withdrawing the final two irrigations. Thus, the three populations were tested in a total of three environments. The analysis of variance showed a significant effect of population, environment, and their interaction, for yield production. The environmental effect was larger than the population and interaction effects. The overall yield in 2014 was almost half that of 2015 and the correlation between treatments was higher between drought and full irrigation in 2015, than between full irrigation in 2014 and full irrigation in 2015 and drought in 2015. This might be explained by the effect of hot weather experienced during flowering in 2014. In addition, terminal drought resulted in a marked 17% yield reduction relative to the irrigated treatment. Nevertheless, the ranks of the populations within environments were similar. The dw417653 population was higher-yielding than the dw319441 populations, which, in turn, was higher-yielding than the dw343950 population.
The wild parent of the latter population originated in the warmest and wettest climate (23.5°C, 1600 mm) of the three wild parental lines, suggesting that variation for increased productivity can be found in drier and cooler areas. However, the wild parent of population dw417653, which had the highest yield, originated in a slightly warmer (19.4°C vs. 18°C) and wetter (733 mm vs. 588 mm) environment as the second-ranked population (PI 319441). Thus, there may not be a linear relationship between the aridity of the environment of origin and the ability to increase yields in domesticated × wild crosses. Other factors may play a role in addition to aridity adaptation, such genetic distance between the wild accession and the domesticated gene pool. PI 417653 (G12910) has been implicated in the Mesoamerican domestication of common bean (Kwak et al., 2009).
Map Development and Joint Linkage QTL Analysis
A consensus map from the three populations was built, which was adequately dense for joint linkage analysis and subsequent QTL mapping (Table 3). Furthermore, the map covered 99% of the G19833 reference genome (Schmutz et al., 2014). Through joint linkage mapping, 20 QTLs for grain yield were identified in the individual environments (year and irrigation regime), the overall grain yield across environments, and the drought susceptibility index calculated from the drought effect in the second year. Among the 20 QTLs, there were 13 non-overlapping QTLs. Two QTLs on chromosome Pv01 at 76 and 81 cM were tightly linked genetically and physically and had similar additive effect patterns among wild alleles. It is possible, therefore, that they are the same QTL. On the same chromosome, a QTL was mapped at the 72 cM position; however, the pattern of additive effects was reversed from that at the 76 and 81 cM positions, suggesting a different QTL. On Pv07, QTLs at the 78 and 87 cM positions had different additive effect patterns for two of three parental loci suggesting these two QTLs are distinct.
From the 20 QTLs, three were detected in 2014, five in 2015 under full irrigation, six in 2015 under terminal drought, five in the overall average across environments and one for DSI. From these, four QTLs were unique to 2015C and three to 2015D. The variation explained by the QTLs ranged from 0.6 to 5.4%, expected for a highly polygenic trait such as yield (Johnson and Gepts, 2002; Blair et al., 2006). For all QTLs that were expressed in different environments, the additive effects were of similar sign, suggesting that there were no tradeoffs between years or treatments. Although for most QTLs the effect of the wild alleles showed the same sign, for some, e.g., Pv08.87, the allele of PI 417653 had a positive effect (115 kg ha–1) while the alleles of PI 343950 and PI 319441 had a negative effect (−123 kg ha–1 and −33 kg ha–1, respectively). This observation suggests that this QTL consists of an allelic series at one locus or represents several, linked loci (Buckler et al., 2009). The detection of allelic series is one of the advantages of nested populations compared with bi-allelic variation in genome-wide association of diversity panels or other multiparent populations (Brachi et al., 2011).
Furthermore, within and across environments, the alleles of PI 343950, the wild population from the wettest location, had the lowest average additive effect. Conversely, the average allelic effects of the accessions from the drier habitats were higher: PI 319441 alleles in both 2014 and 2015, both under full irrigation, whereas PI 417653 alleles were higher under drought in 2015. The overall allele effect of PI 319441 was higher than that of PI 417653 in 2014 and 2015, both under full irrigation, while the average allele effect of PI 417653 was higher than that of PI 319441 under drought in 2015. This suggest that drought tolerance could be a driver of local adaptation. Some traits, like deeper rooting, water use efficiency, earliness in flowering and maturity (Berny Mier y Teran et al., 2019a), might be also beneficial under cultivation if growing seasons are shorter. Berny Mier y Teran et al. (2019a) observed that PI 417653, the wild accession with the strongest allelic effects under drought, has deeper roots and the fastest early growth (Days to the V3 stage) compared to the other two wild accessions. On the contrary, high rainfall conditions could increase selection pressure toward more vigorous vegetative growth and higher disease resistance.
There are two previously published wild by domesticated yield QTL analyses. Blair et al. (2006) evaluated a cross between a domesticated Andean cultivar (ICA Cerinza) and a wild type from Guatemala (G24404). They found nine QTLs for grain yield, with four of them having the wild allele increasing the trait. A QTL on Pv04 overlapped with our findings, which was detected in 2014 and as average across the three environments (Table 4). Their confidence interval was 0.4 to 9.5 Mbp while the QTL identified in this study was located within a 7.9 to 9.3 Mbp interval (Table 4). However, the additive effect of the G24404 accession was positive while the alleles from the three wild sources in our study had a negative effect. It is possible that the allele from the Andean gene pool in ICA Cerinza had a relatively smaller effect than that of SEA 5 and the wild accessions. Blair and Izquierdo (2012) evaluated a population of the same domesticated cultivar (ICA Cerinza) crossed to G10022 (PI 319441), one of the parents of the nested populations studied here. They found one QTL on Pv05, with the domesticated allele having the positive effect. This QTL did not overlap with Pv05.68 of the current investigation. By comparing the current results with our previous evaluation of a panel of wild germplasm (Berny Mier y Teran et al., 2019a), the QTL in Pv10 located in the interval of 41.2 to 42.1 Mb was situated near a SNP at 38.3 Mb associated with total biomass in the wild panel. This QTL showed a positive additive effect on yield resulting from one parental allele (PI 417653) but a negative effect from the other two parents, suggesting that this genomic location might be involved in local adaptation within the wild germplasm.
Two domesticated by domesticated mapping populations have been developed using SEA 5 (Briñez et al., 2017; Mukeshimana et al., 2014). The latter found three QTLs for yield, with one QTL at Pv09 (SY9.1, confidence interval of 25.1–27.1 Mb) overlapping with our findings (Mukeshimana et al., 2014). The allele of SEA 5 had a negative effect compared to a parental line of the Andean gene pool, while SEA 5 had a positive effect when compared to the wild types in the present study. Briñez et al. (2017) developed a population based on SEA 5 crossed to an Andean accession. They found two QTLs for grain yield, which did not overlap with our findings. Within other published QTL analyses for yield, our findings overlapped with QTLs found by Trapp et al. (2016) in Pv01 (SY1.1) and Pv05 (SY5.1), by Hoyos-Villegas et al. (2016) in Pv07 (SY7.4) and Pv10 (SY10.1), and by Berny Mier y Teran et al. (2019b) in Pv09. The latter QTL also overlapped with the SY9.1 QTL found by Mukeshimana et al. (2014).
From the 13 non-overlapping QTLs in this study, five had at least one wild allele with a significant positive additive effect. The allele of PI 417653 at Pv01.81 had the largest effect (277 kg ha–1), detected under drought in 2015. PI 417653 was the only parent that had effects close to zero, in three of the 13 QTLs. This wild parent is part of the putative Mesoamerican domestication center of common bean in west-central Mexico and is, therefore, the closest genetically to the domesticated parent of the three wild populations used in this study (Kwak et al., 2009). This observation suggests that the ancestor of this wild population contributed yield alleles to the Mesoamerican domesticated gene pool or that it could harbor an introgression from the domesticated gene pool (Papa and Gepts, 2003; Papa et al., 2005).
Putative Candidate Genes for QTLs
The QTLs detected in this study encompass genomic regions with high number of genes, in general. For example, the statistical significance region of the QTL at Pv09.33, which was detected in the 2014 well-watered treatment and for DSI, ranges from 24.43 to 25.98 Mb in version 2.1 of the common bean reference genome deposited in Phytozome3. Within this region, 105 distinct gene models have been identified. Their annotation (obtained from PFAM4 and PANTHER5; see Supplementary Table S1) reveals genes implicated in a variety of cellular processes and molecular functions, such as response to stress, oxidative response, signal transduction, protein ubiquitination, chromosome modification, histone modification, metal ion binding, and RNA processing. For example, within this QTL region, Phvul.009G164600.1 was annotated as a serine carboxypeptidase, which was described as involved in oxidative stress in rice (Liu et al., 2008). Phvul.009G169400.2 is related to callose synthase, involved in callose deposition, a functional category that was also described by Recchia et al. (2018), in an experiment with BAT477 under drought and well-watered conditions, in the presence or absence of arbuscular mycorrhizal fungi. Moreover, this QTL region also contained members of a leucin-rich repeat family. This group of genes belongs a larger protein family of receptor-like kinases, playing important roles in stress resistance (Ye et al., 2017), a category also found by Recchia et al. (2018) in common bean. However, because the genomic significance region of a low-heritability trait like yield is so large, an exhaustive list of gene models for each QTL identified in this study becomes quite long as illustrated in Supplementary Table S1. It is difficult to focus on likely candidate gene models without further experimentation, which falls beyond the scope of this work.
An alternative approach is to map genes with a putative role in drought-tolerance and examine to what extent they co-segregate with QTLs. Genome-wide categorizations have been published for a few families in common bean, such as aquaporins (AQP) (Ariani and Gepts, 2015) and Dehydration Responsive Element-Binding (DREB) genes (Cortés et al., 2012; Konzen et al., 2019). AQPs play important roles as water channel proteins in plants. The AQP gene PvPIP1;1 is located near a QTL detected under drought in 2015 on chromosome Pv01, with a distance of approximately 120 Kbp from marker ss715645251. Two transcription factors belonging to the DREB gene family, traditionally characterized as involved in abiotic stress responses such as drought, were located within a specific QTL. Phvul.001G136100 is located within the QTL at Pv01.45, a QTL detected in the 2015 well-watered treatment and Phvul.003G241700 is located at Pv03.72, a QTL detected in the well-watered treatment in 2015. Both genes were previously categorized as DREB2 genes, which are normally involved in responses to abiotic stresses such as caused by water deficit (Konzen et al., 2019).
Conclusion
Our original hypothesis was that wild P. vulgaris populations from drier areas would be better sources of yield-enhancing genes in a domesticated line than those from more humid areas. We showed here that this is indeed the case. However, we also showed that these same wild populations from drier areas also increased yields under well-watered conditions. On average, the superior progeny lines from arid wild beans increased yield by around 20%. Taken together, various wild genomic regions were identified that had positive effects on yield under well-watered and drought-stress conditions. Our results have the potential to make future introgressions assisted with markers faster and more efficient. The alleles with positive (and negative) effects help explain the transgressive segregation found in this study and underscore the potential of wild variation to improve the productivity of domesticated beans. Future work is needed to validate the QTLs with a positive effect on yield introgressed in different domesticated genetic (Des Marais et al., 2013; Shen et al., 2018). Variation within some QTLs in the magnitude of the effect or sign of the effect suggest allelic series associated with a range of phenotypic variation. This variation could be the basis to local adaptation (Buckler et al., 2009; Kronholm et al., 2012). In addition, further sampling of the wild variation is warranted (Stich, 2009), as well as evaluation in wetter and more humid conditions than in the field site in California.
Data Availability Statement
The datasets generated for this study can be found in Dryad https://doi.org/10.25338/B8FW3M.
Author Contributions
JB and PG designed the experiments. JB, AP, and EK carried out the field trial and genotyping. JB analyzed the data and drafted the manuscript. JB, EK, AP, ST, and PG contributed to and edited the manuscript.
Funding
Funding was provided by the Agriculture and Food Research Initiative (AFRI) Competitive Grant (2013-67013-21224) from the USDA National Institute of Food and Agriculture (NIFA).
Conflict of Interest
The authors declare that the research was conducted in the absence of any commercial or financial relationships that could be construed as a potential conflict of interest.
Acknowledgments
We would like to thank the crew at the Plant Sciences Field Facility for assistance in the field experiments. Thanks to Laura Gaminño, Jamily Ramos de Lima, Arthur Martins Almeida Bernardeli, Poliana Silva Rezende, Bruno Lima Martins, Guilherme Coelho Portilho, Higor Da Costa Ximenes de Souza, Mayara Rocha, Adam Yang, Ninh Khuu and the rest of the Gepts Lab for the help during planting, harvest, and sample processing.
Supplementary Material
The Supplementary Material for this article can be found online at: https://www.frontiersin.org/articles/10.3389/fpls.2020.00346/full#supplementary-material
Footnotes
- ^ www.worldclim.org
- ^ https://soilseries.sc.egov.usda.gov
- ^ https://phytozome.jgi.doe.gov/pz/portal.html
- ^ https://pfam.xfam.org/
- ^ http://pantherdb.org/
References
Acosta Gallegos, J. A., Jiménez Hernández, Y., Sánchez García, B. M., Mendoza Hernández, F. M., Herrera Hernández, M. G., Salinas Pérez, R. A., et al. (2010). Flor de Mayo Eugenia, nueva variedad de frijol para riego y temporal en el centro de México. Rev. Mex. Ciencias Agrícolas 1, 751–757.
Acosta-Gallegos, J. A., Kelly, J. D., and Gepts, P. (2007). Prebreeding in common bean and use of genetic diversity from wild germplasm. Crop Sci. 47, S–44. doi: 10.2135/cropsci2007.04.0008IPBS
Anderson, J. T., Willis, J. H., and Mitchell-Olds, T. (2011). Evolutionary genetics of plant adaptation. Trends Genet. 27, 258–266. doi: 10.1016/j.tig.2011.04.001
Araújo, A. P., Teixeira, M. G., and de Almeida, D. L. (1998). Variability of traits associated with phosphorus efficiency in wild and cultivated genotypes of common bean. Plant Soil 203, 173–182. doi: 10.1023/A:1004398930218
Ariani, A., and Gepts, P. (2015). Genome-wide identification and characterization of aquaporin gene family in common bean (Phaseolus vulgaris L.). Mol. Genet. Genomics 290, 1771–1785. doi: 10.1007/s00438-015-1038-2
Ariani, A., Berny Mier Teran, J. C., and Gepts, P. (2018). Spatial and temporal scales of range expansion in wild Phaseolus vulgaris. Mol. Biol. Evol. 35, 119–131. doi: 10.1093/molbev/msx273
Bajgain, P., Rouse, M. N., Tsilo, T. J., Macharia, G. K., Bhavani, S., Jin, Y., et al. (2016). Nested association mapping of stem rust resistance in wheat using genotyping by sequencing. PLoS ONE 11:e0155760. doi: 10.1371/journal.pone.0155760
Bayuelo-Jiménez, J. S., Debouck, D. G., and Lynch, J. P. (2002). Salinity tolerance in Phaseolus species during early vegetative growth. Crop Sci. 42, 2184–2192. doi: 10.2135/cropsci2002.2184
Bazakos, C., Hanemian, M., Trontin, C., Jiménez-Gómez, J. M., and Loudet, O. (2017). New strategies and tools in quantitative genetics: how to go from the phenotype to the genotype. Annu. Rev. Plant Biol. 68, 435–455. doi: 10.1146/annurev-arplant-042916-040820
Beaver, J. S., Zapata, M., Alameda, M., Porch, T. G., and Rosas, J. C. (2012). Registration of PR0401-259 and PR0650-31 dry bean germplasm lines. J. Plant Regist. 6, 81. doi: 10.3198/jpr2011.05.0283crg
Beebe, S. (2012). Common bean breeding in the tropics. Plant Breed. Rev. Vol. 36, 357–426. doi: 10.1002/9781118358566
Beebe, S. E., Rao, I. M., Blair, M. W., and Acosta-Gallegos, J. A. (2013). Phenotyping common beans for adaptation to drought. Front. Physiol. 4:35. doi: 10.3389/fphys.2013.00035
Beebe, S. E., Rao, I. M., Devi, M. J., and Polania, J. (2014). Common beans, biodiversity, and multiple stresses: challenges of drought resistance in tropical soils. Crop Pasture Sci. 65:667. doi: 10.1071/CP13303
Berny Mier y Teran, J. C., Konzen, E. R., Medina, V., Palkovic, A., Ariani, A., Tsai, S. M., et al. (2019a). Root and shoot variation in relation to potential intermittent drought adaptation of Mesoamerican wild common bean (Phaseolus vulgaris L.). Ann. Bot. 124, 917–932. doi: 10.1093/aob/mcy221
Berny Mier y Teran, J. C., Konzen, E. R., Palkovic, A., Tsai, S. M., Rao, I. M., Beebe, S., et al. (2019b). Effect of drought stress on the genetic architecture of photosynthate allocation and remobilization in pods of common bean (Phaseolus vulgaris L.), a key species for food security. BMC Plant Biol. 19:171. doi: 10.1186/s12870-019-1774-2
Bitocchi, E., Nanni, L., Bellucci, E., Rossi, M., Giardini, A., Zeuli, P. S., et al. (2012). Mesoamerican origin of the common bean (Phaseolus vulgaris L.) is revealed by sequence data. Proc. Natl. Acad. Sci. U.S.A. 109, E788–E796. doi: 10.1073/pnas.1108973109
Blair, M. W., Iriarte, G., and Beebe, S. (2006). QTL analysis of yield traits in an advanced backcross population derived from a cultivated Andean x wild common bean (Phaseolus vulgaris L.) cross. Theor. Appl. Genet. 112, 1149–1163. doi: 10.1007/s00122-006-0217-2
Blair, M. W., and Izquierdo, P. (2012). Use of the advanced backcross-QTL method to transfer seed mineral accumulation nutrition traits from wild to Andean cultivated common beans. Theor. Appl. Genet. 125, 1015–1031. doi: 10.1007/s00122-012-1891-x
Blair, M. W., Izquierdo, P., Astudillo, C., and Grusak, M. A. (2013). A legume biofortification quandary: variability and genetic control of seed coat micronutrient accumulation in common beans. Front. Plant Sci. 4:275. doi: 10.3389/fpls.2013.00275
Bodénès, C., Chancerel, E., Ehrenmann, F., Kremer, A., and Plomion, C. (2016). High-density linkage mapping and distribution of segregation distortion regions in the oak genome. DNA Res. 23, 115–124. doi: 10.1093/dnares/dsw001
Brachi, B., Morris, G. P., and Borevitz, J. O. (2011). Genome-wide association studies in plants: the missing heritability is in the field. Genome Biol. 12:232. doi: 10.1186/gb-2011-12-10-232
Briñez, B., Perseguini, J. M. K. C., Rosa, J. S., Bassi, D., Gonçalves, J. G. R., Almeida, C., et al. (2017). Mapping QTLs for drought tolerance in a SEA 5 x AND 277 common bean cross with SSRs and SNP markers. Genet. Mol. Biol. 40, 813–823. doi: 10.1590/1678-4685-gmb-2016-0222
Broughton, W. J., Hernández, G., Blair, M., Beebe, S., Gepts, P., and Vanderleyden, J. (2003). Beans (Phaseolus spp.) – model food legumes. Plant Soil 252, 55–128. doi: 10.1023/A:1024146710611
Buckler, E. S., Holland, J. B., Bradbury, P. J., Acharya, C. B., Brown, P. J., Browne, C., et al. (2009). The genetic architecture of maize flowering time. Science (80-.) 325, 714–718. doi: 10.1126/science.1174276
Cavanagh, C., Morell, M., Mackay, I., and Powell, W. (2008). From mutations to MAGIC: resources for gene discovery, validation and delivery in crop plants. Curr. Opin. Plant Biol. 11, 215–221. doi: 10.1016/j.pbi.2008.01.002
Checa, O. E., and Blair, M. W. (2008). Mapping QTL for climbing ability and component traits in common bean (Phaseolus vulgaris L.). Mol. Breed. 22, 201–215. doi: 10.1007/s11032-008-9167-5
Cortés, A. J., This, D., Chavarro, C., Madriñán, S., and Blair, M. W. (2012). Nucleotide diversity patterns at the drought-related DREB2 encoding genes in wild and cultivated common bean (Phaseolus vulgaris L.). Theor. Appl. Genet. 125, 1069–1085. doi: 10.1007/s00122-012-1896-5
Delgado-Salinas, A., Bibler, R., and Lavin, M. (2006). Phylogeny of the genus Phaseolus (Leguminosae): a recent diversification in an ancient landscape. Syst. Bot. 31, 779–791. doi: 10.1600/036364406779695960
Des Marais, D. L., Hernandez, K. M., and Juenger, T. E. (2013). Genotype-by-environment interaction and plasticity: exploring genomic responses of plants to the abiotic environment. Annu. Rev. Ecol. Evol. Syst. 44, 5–29. doi: 10.1146/annurev-ecolsys-110512-135806
Devi, M. J., Sinclair, T. R., Beebe, S. E., and Rao, I. M. (2012). Comparison of common bean (Phaseolus vulgaris L.) genotypes for nitrogen fixation tolerance to soil drying. Plant Soil 364, 29–37. doi: 10.1007/s11104-012-1330-4
Dohle, S., Berny Mier y Teran, J. C., Egan, A., Kisha, T., and Khoury, C. K. (2019). “Wild beans (Phaseolus L.) of North America,” in North American Crop Wild Relatives: Important Species, Vol. 2, eds S. L. Greene, K. A. Williams, C. K. Khoury, M. B. Kantar, and L. F. Marek (Cham: Springer International Publishing), 99–127. doi: 10.1007/978-3-319-97121-6_4
Endelman, J. B., and Plomion, C. (2014). LPmerge: an R package for merging genetic maps by linear programming. Bioinformatics 30, 1623–1624. doi: 10.1093/bioinformatics/btu091
Espinosa-Alonso, L. G., Lygin, A., Widholm, J. M., Valverde, M. E., and Paredes-Lopez, O. (2006). Polyphenols in wild and weedy Mexican common beans (Phaseolus vulgaris L.). J. Agric. Food Chem. 54, 4436–4444. doi: 10.1021/jf060185e
Fischer, R., and Maurer, R. (1978). Drought resistance in spring wheat cultivars. I. Grain yield responses. Aust. J. Agric. Res. 29:897. doi: 10.1071/AR9780897
Fouilloux, G., and Bannerot, H. (1988). “Selection methods in the common bean (Phaseolus vulgaris),” in Genetic Resources of Phaseolus Beans: Their Maintenance, Domestication, Evolution and Utilization, ed. P. L. Gepts (Berlin: Springer), 503–542. doi: 10.1007/978-94-009-2786-5_21
Fragoso, C. A., Moreno, M., Wang, Z., Heffelfinger, C., Arbelaez, L. J., Aguirre, J. A., et al. (2017). Genetic architecture of a rice nested association mapping population. G3 7, 1913–1926. doi: 10.1534/g3.117.041608
Frahm, M., Rosas, J., Mayek-Pérez, N., López-Salinas, E., Acosta-Gallegos, J., and Kelly, J. (2004). Breeding beans for resistance to terminal drought in the Lowland tropics. Euphytica 136, 223–232. doi: 10.1023/B:euph.0000030671.03694.bb
Freytag, G. F., and Debouck, D. G. (2002). Taxonomy, Distribution, and Ecology of the Genus Phaseolus (Leguminosae-Papilionodeae) in North America, Mexico and Central America. Taxonomía, distribución y ecología del género Phaseolus (Leguminosae-Papilionodeae) en Norteamérica, México y Centroaméric. Dalles, TX: SIDA, Bot. Misc.
Garin, V., Wimmer, V., Mezmouk, S., Malosetti, M., and van Eeuwijk, F. (2017). How do the type of QTL effect and the form of the residual term influence QTL detection in multi-parent populations? A case study in the maize EU-NAM population. Theor. Appl. Genet. 130, 1753–1764. doi: 10.1007/s00122-017-2923-3
Gentry, H. S. (1969). Origin of the common bean, Phaseolus vulgaris. Econ. Bot. 23, 55–69. doi: 10.1007/BF02862972
Gepts, P. (2019). Origin and evolution of common bean: past events and recent trends. HortScience 33, 1124–1130. doi: 10.21273/hortsci.33.7.1124
Gepts, P., Aragão, F. J. L., Barros, E., de Blair, M. W., Brondani, R., Broughton, W., et al. (2008). “Genomics of phaseolus beans, a major source of dietary protein and micronutrients in the tropics,” in Genomics of Tropical Crop Plants, eds P.H. Moore and R. Ming (New York, NY: Springer New York), 113–143. doi: 10.1007/978-0-387-71219-2_5
Gepts, P., Osborn, T. C., Rashka, K., and Bliss, F. A. (1986). Phaseolin-protein variability in wild forms and landraces of the common bean (Phaseolus vulgaris): evidence for multiple centers of domestication. Econ Bot. 40, 451–458. doi: 10.1007/BF02859659
Griffiths, P. D. (2002). Evaluation of Phaseolus germplasm to Identify Resistance to Cucumber Mosaic Virus. New York State IPM Progr. Available at: https://hdl.handle.net/1813/45914.
Gu, W., Zhu, J., Wallace, D. H., Singh, S. P., and Weeden, N. F. (1998). Analysis of genes controlling photoperiod sensitivity in common bean using DNA markers. Euphytica 102, 125–132. doi: 10.1023/A:1018340514388
Hijmans, R. J., Cameron, S. E., Parra, J. L., Jones, P. G., and Jarvis, A. (2005). Very high resolution interpolated climate surfaces for global land areas. Int. J. Climatol. 25, 1965–1978. doi: 10.1002/joc.1276
Holland, J. B. (2015). MAGIC maize: a new resource for plant genetics. Genome Biol. 16:163. doi: 10.1186/s13059-015-0713-2
Hoyos-Villegas, V., Song, Q., Wright, E. M., Beebe, S. E., and Kelly, J. D. (2016). Joint linkage QTL mapping for yield and agronomic traits in a composite map of three common bean RIL populations. Crop Sci. 56, 2546–2563. doi: 10.2135/cropsci2016.01.0063
Johnson, W. C., and Gepts, P. (2002). The role of epistasis in controlling seed yield and other agronomic traits in an Andean× Mesoamerican cross of common bean (Phaseolus vulgaris L.). Euphytica 125, 69–79.
Kaeppler, S. M. (1997). Power analysis for quantitative trait locus mapping in populations derived by multiple backcrosses. Theor. Appl. Genet. 95, 618–621. doi: 10.1007/s001220050603
Kelly, J. D. (2001). “Remaking bean plant architecture for efficient production,” in Advances in Agronomy, ed. D. L. Sparks (Amsterdam: Elsevier), 109–143. doi: 10.1016/S0065-2113(01)71013-9
Kelly, J. D., Hosfield, G. L., Varner, G. V., Uebersax, M. A., and Taylor, J. (1999). Registration of ‘Matterhorn’ great northern bean. Crop Sci. 39:589. doi: 10.2135/cropsci1999.0011183X003900020058x
Kissoudis, C., Sunarti, S., van de Wiel, C., Visser, R. G. F., van der Linden, C. G., and Bai, Y. (2016). Responses to combined abiotic and biotic stress in tomato are governed by stress intensity and resistance mechanism. J. Exp. Bot. 67, 5119–5132. doi: 10.1093/jxb/erw285
Klaedtke, S. M., Cajiao, C., Grajales, M., Polania, J., Borrero, G., Guerrero, A., et al. (2012). Photosynthate remobilization capacity from drought-adapted common bean (Phaseolus vulgaris L.) lines can improve yield potential of interspecific populations within the secondary gene pool. J. Plant Breed. Crop Sci. 4, 49–61. doi: 10.5897/JPBCS11.087
Koinange, E. M. K., Singh, S. P., and Gepts, P. (1996). Genetic control of the domestication syndrome in common bean. Crop Sci. 36, 1037–1045. doi: 10.2135/cropsci1996.0011183X003600040037x
Konzen, E. R., Recchia, G. H., Cassieri, F., Caldas, D. G. G., Berny Mier y Teran, J. C., Gepts, P., et al. (2019). DREB genes from common bean (Phaseolus vulgaris L.) show broad to specific abiotic stress responses and distinct levels of nucleotide diversity. Int. J. Genomics 2019, 28.
Kornegay, J., Cardona, C., and Posso, C. E. (1993). Inheritance of resistance to Mexican bean weevil in common bean, determined by bioassay and biochemical tests. Crop Sci. 33:589. doi: 10.2135/cropsci1993.0011183x003300030034x
Kosambi, D. (1944). The estimation of map distances from recombination values. Ann Eugen 12, 125–130. doi: 10.1111/j.1469-1809.1943.tb02321.x
Kronholm, I., Picó, F. X., Alonso-Blanco, C., Goudet, J., and de Meaux, J. (2012). Genetic basis of adaptation in Arabidopsis thaliana: local adaptation at the seed dormancy QTL DOG1. Evolution (N.Y.) 66, 2287–2302. doi: 10.1111/j.1558-5646.2012.01590.x
Kwak, M., and Gepts, P. (2009). Structure of genetic diversity in the two major gene pools of common bean (Phaseolus vulgaris L., Fabaceae). Theor. Appl. Genet. 118, 979–992. doi: 10.1007/s00122-008-0955-4
Kwak, M., Kami, J. A., and Gepts, P. (2009). The putative mesoamerican domestication center of Phaseolus vulgaris is located in the lerma-santiago basin of Mexico. Crop Sci. 49, 554–563. doi: 10.2135/cropsci2008.07.0421
Kwak, M., Velasco, D., and Gepts, P. (2008). Mapping homologous sequences for determinacy and photoperiod sensitivity in common bean (Phaseolus vulgaris). J. Hered. 99, 283–291. doi: 10.1093/jhered/esn005
Li, H., Bradbury, P., Ersoz, E., Buckler, E. S., and Wang, J. (2011). Joint QTL linkage mapping for multiple-cross mating design sharing one common parent. PLoS ONE 6:e17573. doi: 10.1371/journal.pone.0017573
Li, H., Ye, G., and Wang, J. (2007). A modified algorithm for the improvement of composite interval mapping. Genetics 175, 361–374. doi: 10.1534/genetics.106.066811
Lin, C. S., and Poushinsky, G. (1985). A modified augmented design (Type 2) for rectangular plots. Can. J. Plant Sci. 65, 743–749. doi: 10.4141/cjps85-094
Liu, H., Wang, X., Zhang, H., Yang, Y., Ge, X., and Song, F. (2008). A rice serine carboxypeptidase-like gene OsBISCPL1 is involved in regulation of defense responses against biotic and oxidative stress. Gene 420, 57–65. doi: 10.1016/j.gene.2008.05.006
Liu, Z., Cook, J., Melia-Hancock, S., Guill, K., Bottoms, C., Garcia, A., et al. (2016). Expanding maize genetic resources with predomestication alleles: maize–teosinte introgression populations. Plant Genome 9. doi: 10.3835/plantgenome2015.07.0053
Long, R., Temple, S., Schmiere, J., Canevari, M., and Meyers, R. D. (2010). Common dry Bean Production in California, Davis. Available at: https://anrcatalog.ucanr.edu/pdf/8402.pdf
Lyttle, T. (1991). Segregation distorters. Annu. Rev. Genet. 25, 511–557. doi: 10.1146/annurev.genet.25.1.511
Malosetti, M., van Eeuwijk, F. A., Jordan, D. R., Velazco, J. G., Eilers, P. H. C., Boer, M. P., et al. (2017). Modelling spatial trends in sorghum breeding field trials using a two-dimensional P-spline mixed model. Theor. Appl. Genet. 130, 1375–1392. doi: 10.1007/s00122-017-2894-4
Maurer, A., Draba, V., Jiang, Y., Schnaithmann, F., Sharma, R., Schumann, E., et al. (2015). Modelling the genetic architecture of flowering time control in barley through nested association mapping. BMC Genomics 16:290. doi: 10.1186/s12864-015-1459-7
McClean, P. E., Lee, R. K., Otto, C., Gepts, P., and Bassett, M. J. (2002). Molecular and phenotypic mapping of genes controlling seed coat pattern and color in common bean (Phaseolus vulgaris L.). J. Hered. 93, 148–152. doi: 10.1093/jhered/93.2.148
Meng, L., Li, H., Zhang, L., and Wang, J. (2015). QTL IciMapping: integrated software for genetic linkage map construction and quantitative trait locus mapping in biparental populations. Crop J. 3, 269–283. doi: 10.1016/j.cj.2015.01.001
Mkwaila, W., Terpstra, K. A., Ender, M., and Kelly, J. D. (2011). Identification of QTL for agronomic traits and resistance to white mold in wild and landrace germplasm of common bean. Plant Breed. 130, 665–672. doi: 10.1111/j.1439-0523.2011.01876.x
Moghaddam, S. M., Mamidi, S., Osorno, J. M., Lee, R., Brick, M., Kelly, J., et al. (2016). Genome-wide association study identifies candidate loci underlying agronomic traits in a Middle American diversity panel of common bean. Plant Genome 9. doi: 10.3835/plantgenome2016.02.0012
Monteith, J. L., and Moss, C. J. (2006). Climate and the efficiency of crop production in Britain. Philos. Trans. R. Soc. B Biol. Sci. 281, 277–294. doi: 10.1098/rstb.1977.0140
Montoya, C. A., Leterme, P., Victoria, N. F., Toro, O., Souffrant, W. B., Beebe, S., et al. (2008). Susceptibility of phaseolin to in vitro proteolysis is highly variable across common bean varieties (Phaseolus vulgaris). J. Agric. Food Chem. 56, 2183–2191. doi: 10.1021/jf072576e
Mukeshimana, G., Butare, L., Cregan, P. B., Blair, M. W., and Kelly, J. D. (2014). Quantitative trait loci associated with drought tolerance in common bean. Crop Sci. 54, 923–938. doi: 10.2135/cropsci2013.06.0427
Nice, L. M., Steffenson, B. J., Blake, T. K., Horsley, R. D., Smith, K. P., and Muehlbauer, G. J. (2017). Mapping agronomic traits in a wild barley advanced backcross–nested association mapping population. Crop Sci. 57, 1199–1210. doi: 10.2135/cropsci2016.10.0850
Nice, L. M., Steffenson, B. J., Brown-Guedira, G. L., Akhunov, E. D., Liu, C., Kono, T. J. Y., et al. (2016). Development and genetic characterization of an advanced backcross-nested association mapping (AB-NAM) population of wild × cultivated barley. Genetics 203, 1453–1467. doi: 10.1534/genetics.116.190736
Osborn, T. C., Alexander, D. C., Sun, S. S. M., Cardona, C., and Bliss, F. A. (2006). Insecticidal activity and lectin homology of arcelin seed protein. Science 240, 207–210. doi: 10.1126/science.240.4849.207
Osborn, T. C., Hartweck, L. M., Harmsen, R. H., Vogelzang, R. D., Kmiecik, K. A., and Bliss, F. A. (2003). Registration of genetic stocks with altered seed protein compositions. Crop Sci. 43, 1570. doi: 10.2135/cropsci2003.1570
Papa, R., Acosta-Gallegos, J. A., Delgado-Salinas, A., and Gepts, P. (2005). A genome-wide analysis of differentiation between wild and domesticated Phaseolus vulgaris from Mesoamerica. Theor. Appl. Genet. 111, 1147–1158. doi: 10.1007/s00122-005-0045-9
Papa, R., and Gepts, P. (2003). Asymmetry of gene flow and differential geographical structure of molecular diversity in wild and domesticated common bean (Phaseolus vulgaris L.) from Mesoamerica. Theor. Appl. Genet. 106, 239–250. doi: 10.1007/s00122-002-1085-z
Park, S. O., Coyne, D. P., Jung, G., Skroch, P. W., Arnaud-Santana, E., Steadman, J. R., et al. (2000). Mapping of QTL for seed size and shape traits in common bean. J. Am. Soc. Hort. Sci. 125, 466–475. doi: 10.21273/JASHS.125.4.466
Pedrosa-Harand, A., Porch, T., and Gepts, P. (2008). Standard nomenclature for common bean chromosomes and linkage groups. Annu. Rep. Bean Improv. Coop. 51:106.
Pinto, R. S., Reynolds, M. P., Mathews, K. L., McIntyre, C. L., Olivares-Villegas, J.-J., and Chapman, S. C. (2010). Heat and drought adaptive QTL in a wheat population designed to minimize confounding agronomic effects. Theor. Appl. Genet. 121, 1001–1021. doi: 10.1007/s00122-010-1351-4
Polania, J., Rao, I., Cajiao, C., Grajales, M., Rivera, M., Velasquez, C., et al. (2017). Shoot and root traits contribute to drought resistance in recombinant inbred lines of MD 23-24 x SEA 5 of common bean. Front. Plant Sci. 8:296. doi: 10.3389/fpls.2017.00296
Polania, J., Rao, I. M., Cajiao, C., Rivera, M., Raatz, B., and Beebe, S. (2016). Physiological traits associated with drought resistance in Andean and Mesoamerican genotypes of common bean (Phaseolus vulgaris L.). Euphytica 210, 17–29. doi: 10.1007/s10681-016-1691-5
Porch, T., Beaver, J., Debouck, D., Jackson, S., Kelly, J., and Dempewolf, H. (2013). Use of wild relatives and closely related species to adapt common bean to climate change. Agronomy 3, 433–461. doi: 10.3390/agronomy3020433
Prudhomme, C., Giuntoli, I., Robinson, E. L., Clark, D. B., Arnell, N. W., Dankers, R., et al. (2014). Hydrological droughts in the 21st century, hotspots and uncertainties from a global multimodel ensemble experiment. Proc. Natl. Acad. Sci. U.S.A. 111, 3262–3267. doi: 10.1073/pnas.1222473110
R Development Core Team (2018). R: A Language and Environment for Statistical Computing. Vienna: R Development Core Team. doi: 10.1007/978-3-540-74686-7
Ramirez-Cabral, N. Y. Z., Kumar, L., and Taylor, S. (2016). Crop niche modeling projects major shifts in common bean growing areas. Agric. For. Meteorol. 21, 102–113. doi: 10.1016/j.agrformet.2015.12.002
Rao, I. M., Beebe, S. E., Polania, J., Grajales, M., Cajiao, C., Ricaurte, J., et al. (2017). Evidence for genotypic differences among elite lines of common bean in the ability to remobilize photosynthate to increase yield under drought. J. Agric. Sci. 155, 857–875. doi: 10.1017/S0021859616000915
Recchia, G. H., Konzen, E. R., Cassieri, F., Caldas, D. G., and Tsai, S. M. (2018). Arbuscular mycorrhizal symbiosis leads to differential regulation of drought-responsive genes in tissue-specific root cells of common bean. Front. Microbiol. 9:1339. doi: 10.3389/fmicb.2018.01339
Rendón-Anaya, M., Montero-Vargas, J. M., Saburido-Álvarez, S., Vlasova, A., Capella-Gutierrez, S., Ordaz-Ortiz, J. J., et al. (2017). Genomic history of the origin and domestication of common bean unveils its closest sister species. Genome Biol. 18:60. doi: 10.1186/s13059-017-1190-6
Rodriguez, M., Rau, D., Bitocchi, E., Bellucci, E., Biagetti, E., Carboni, A., et al. (2016). Landscape genetics, adaptive diversity and population structure in Phaseolus vulgaris. New Phytol. 209, 1781–1794. doi: 10.1111/nph.13713
Rodríguez-Álvarez, M. X., Boer, M. P., van Eeuwijk, F. A., and Eilers, P. H. C. (2018). Correcting for spatial heterogeneity in plant breeding experiments with P-splines. Spat. Stat. 23, 52–71. doi: 10.1016/j.spasta.2017.10.003
Rosas, J. C., Varela, O. I., and Beaver, J. S. (2010). Registration of ‘Tío Canela-75’ small red bean (race Mesoamerica). Crop Sci. 37:1391. doi: 10.2135/cropsci1997.0011183x003700040080x
Saade, S., Maurer, A., Shahid, M., Oakey, H., Schmöckel, S. M., Negrão, S., et al. (2016). Yield-related salinity tolerance traits identified in a nested association mapping (NAM) population of wild barley. Sci. Rep. 6:32586.
Sas Institute Inc (2016). JMP®. Available at: https://www.jmp.com/en_us/home.html.
Schmutz, J., McClean, P. E., Mamidi, S., Wu, G. A., Cannon, S. B., Grimwood, J., et al. (2014). A reference genome for common bean and genome-wide analysis of dual domestications. Nat. Genet. 46, 707–713. doi: 10.1038/ng.3008
Schnaithmann, F., Kopahnke, D., and Pillen, K. (2014). A first step toward the development of a barley NAM population and its utilization to detect QTLs conferring leaf rust seedling resistance. Theor. Appl. Genet. 127, 1513–1525. doi: 10.1007/s00122-014-2315-x
Shen, L., Wang, C., Fu, Y., Wang, J., Liu, Q., Zhang, X., et al. (2018). QTL editing confers opposing yield performance in different rice varieties. J. Integr. Plant Biol. 60, 89–93. doi: 10.1111/jipb.12501
Sinclair, T. R., and Vadez, V. (2012). The future of grain legumes in cropping systems. Crop Pasture Sci. 63, 501–512.
Singh, J., Gezan, S., and Vallejos, C. E. (2019). Developmental pleiotropy shaped the roots of the domesticated common bean Phaseolus vulgaris L. Plant Physiol. 180, 1467–1479. doi: 10.1104/pp.18.01509
Singh, S. P. (2001). Broadening the genetic base of common bean cultivars: a review. Crop Sci. 41, 1659–1675. doi: 10.2135/cropsci2001.1659
Singh, S. P., Gepts, P., and Debouck, D. G. (1991). Races of common bean (Phaseolus vulgaris, Fabaceae). Econ. Bot. 45, 379–396. doi: 10.1007/BF02887079
Singh, S. P., Terán, H., and Gutiérrez, J. A. (2001). Registration of SEA 5 and SEA 13 drought tolerant dry bean germplasm. Crop Sci. 41, 276–277. doi: 10.2135/cropsci2001.411276x
Song, Q., Jia, G., Hyten, D. L., Jenkins, J., Hwang, E.-Y., Schroeder, S. G., et al. (2015). SNP assay development for linkage map construction, anchoring whole-genome sequence, and other genetic and genomic applications in common bean. G3 5, 2285–2290. doi: 10.1534/g3.115.020594
Song, Q., Yan, L., Quigley, C., Jordan, B. D., Fickus, E., Schroeder, S., et al. (2017). Genetic characterization of the soybean nested association mapping population. Plant Genome 10. doi: 10.3835/plantgenome2016.10.0109
Sonnante, G., Stockton, T., Nodari, R. O., Becerra Velásquez, V. L., and Gepts, P. (1994). Evolution of genetic diversity during the domestication of common-bean (Phaseolus vulgaris L.). Theor. Appl. Genet. 89, 629–635. doi: 10.1007/BF00222458
Stich, B. (2009). Comparison of mating designs for establishing nested association mapping populations in maize and Arabidopsis thaliana. Genetics 183, 1525–1534. doi: 10.1534/genetics.109.108449
Tanksley, S. D., and McCouch, S. R. (1997). Seed banks and molecular maps: unlocking genetic potential from the wild. Science 277, 1063–1066. doi: 10.1126/science.277.5329.1063
Tanksley, S. D., and Nelson, J. C. (1996). Advanced backcross QTL analysis: a method for the simultaneous discovery and transfer of valuable QTLs from unadapted germplasm into elite breeding lines. Theor. Appl. Genet. 92, 191–203. doi: 10.1007/BF00223376
Taylor, J., and Butler, D. (2017). R Package ASMap: efficient genetic linkage map construction and diagnosis. J. Stat. Softw. 79. doi: 10.18637/jss.v079.i06
Terán, H., and Singh, S. P. (2002). Selection for drought resistance in early generations of common bean populations. Can. J. Plant Sci. 82, 491–497. doi: 10.4141/P01-134
Trapp, J. J., Urrea, C. A., Zhou, J., Khot, L. R., Sankaran, S., and Miklas, P. N. (2016). Selective phenotyping traits related to multiple stress and drought response in dry bean. Crop Sci. 56, 1460–1472. doi: 10.2135/cropsci2015.05.0281
Voorrips, R. E. (2002). MapChart: software for the graphical presentation of linkage maps and QTL. J. Hered. 93, 77–78. doi: 10.1093/jhered/93.1.77
Wallach, D., Hwang, C., Correll, M. J., Jones, J. W., Boote, K., Hoogenboom, G., et al. (2018). A dynamic model with QTL covariables for predicting flowering time of common bean (Phaseolus vulgaris) genotypes. Eur. J. Agron. 101, 200–209. doi: 10.1016/j.eja.2018.10.003
Wang, J., Li, H., Zhang, L., Li, C., and Meng, L. (2016). Users Manual of QTL IciMapping. Beijing, China: Institute of Crop Science, Chinese Academy of Agricultural Sciences; Crop Research Iinformatics Lab and International Maize and Wheat Improvement Center (CIMMYT). Available at: http://www.isbreeding.net.
Weller, J. L., Vander Schoor, J. K., Perez-Wright, E. C., Hecht, V., González, A. M., Capel, C., et al. (2019). Parallel origins of photoperiod adaptation following dual domestications of common bean. J. Exp. Bot. 70, 1209–1219. doi: 10.1093/jxb/ery455
White, J. W., Kornegay, J., and Cajiao, C. (1996). Inheritance of temperature sensitivity of the photoperiod response in common bean (Phaseolus vulgaris L.). Euphytica 91, 5–8. doi: 10.1007/BF00035270
Wu, H., Churchill, G. A., Broman, K. W., and Sen, S. (2003). R/qtl: QTL mapping in experimental crosses. Bioinformatics 19, 889–890. doi: 10.1093/bioinformatics/btg112
Wu, X., Li, Y., Shi, Y., Song, Y., Zhang, D., Li, C., et al. (2016). Joint-linkage mapping and GWAS reveal extensive genetic loci that regulate male inflorescence size in maize. Plant Biotechnol. J. 14, 1551–1562. doi: 10.1111/pbi.12519
Xiao, Y., Tong, H., Yang, X., Xu, S., Pan, Q., Qiao, F., et al. (2016). Genome-wide dissection of the maize ear genetic architecture using multiple populations. New Phytol. 210, 1095–1106. doi: 10.1111/nph.13814
Xu, S. (2008). Quantitative trait locus mapping can benefit from segregation distortion. Genetics 180, 2201–2208. doi: 10.1534/genetics.108.090688
Ye, Y., Ding, Y., Jiang, Q., Wang, F. J., Sun, J. W., and Zhu, C. (2017). The role of receptor-like protein kinases (RLKs) in abiotic stress response in plants. Plant Cell Rep. 36, 1–8. doi: 10.1007/s00299-016-2084-x
Yu, J., Holland, J. B., McMullen, M. D., and Buckler, E. S. (2008). Genetic design and statistical power of nested association mapping in maize. Genetics 178, 539–551. doi: 10.1534/genetics.107.074245
Zhu, X.-G., Long, S. P., and Ort, D. R. (2010). Improving photosynthetic efficiency for greater yield. Annu. Rev. Plant Biol. 61, 235–261. doi: 10.1146/annurev-arplant-042809-112206
Keywords: common bean, crop wild relative, eco-geographic adaptation, nested backcrossed inbred populations, quantitative trait loci, yield
Citation: Berny Mier y Teran JC, Konzen ER, Palkovic A, Tsai SM and Gepts P (2020) Exploration of the Yield Potential of Mesoamerican Wild Common Beans From Contrasting Eco-Geographic Regions by Nested Recombinant Inbred Populations. Front. Plant Sci. 11:346. doi: 10.3389/fpls.2020.00346
Received: 31 October 2019; Accepted: 09 March 2020;
Published: 03 April 2020.
Edited by:
Petr Smı kal, Palackı University, CzechiaReviewed by:
Kirstin E. Bett, University of Saskatchewan, CanadaJuan M. Osorno, North Dakota State University, United States
Copyright © 2020 Berny Mier y Teran, Konzen, Palkovic, Tsai and Gepts. This is an open-access article distributed under the terms of the Creative Commons Attribution License (CC BY). The use, distribution or reproduction in other forums is permitted, provided the original author(s) and the copyright owner(s) are credited and that the original publication in this journal is cited, in accordance with accepted academic practice. No use, distribution or reproduction is permitted which does not comply with these terms.
*Correspondence: Paul Gepts, plgepts@ucdavis.edu
†ORCID: Jorge Carlos Berny Mier y Teran, orcid.org/0000-0003-3709-9131, Enéas R. Konzen, orcid.org/0000-0001-5176-7410, Paul Gepts, orcid.org/0000-0002-1056-4665
‡Present address: Enéas R. Konzen, Universidade Federal do Rio Grande do Sul, Campus Litoral Norte, Imbeì, Brazil