 Thamiris G. Deo1
 Rebecca C. U. Ferreira1
 Letícia A. C. Lara2
 Aline C. L. Moraes3
 Alessandro Alves-Pereira1Fernanda A. de Oliveira1
 Antonio A. F. Garcia2
 Mateus F. Santos4Liana Jank4
 Anete P. de Souza1,3*
- 1Center for Molecular Biology and Genetic Engineering, University of Campinas, Campinas, Brazil
- 2Genetics Department, Escola Superior de Agricultura “Luiz de Queiroz,” University of São Paulo, Piracicaba, Brazil
- 3Plant Biology Department, Biology Institute, University of Campinas, Campinas, Brazil
- 4Embrapa Beef Cattle, Brazilian Agricultural Research Corporation, Campo Grande, Brazil
Forage grasses are mainly used in animal feed to fatten cattle and dairy herds, and guinea grass (Megathyrsus maximus) is considered one of the most productive of the tropical forage crops that reproduce by seeds. Due to the recent process of domestication, this species has several genomic complexities, such as autotetraploidy and aposporous apomixis. Consequently, approaches that relate phenotypic and genotypic data are incipient. In this context, we built a linkage map with allele dosage and generated novel information of the genetic architecture of traits that are important for the breeding of M. maximus. From a full-sib progeny, a linkage map containing 858 single nucleotide polymorphism (SNP) markers with allele dosage information expected for an autotetraploid was obtained. The high genetic variability of the progeny allowed us to map 10 quantitative trait loci (QTLs) related to agronomic traits, such as regrowth capacity and total dry matter, and 36 QTLs related to nutritional quality, which were distributed among all homology groups (HGs). Various overlapping regions associated with the quantitative traits suggested QTL hotspots. In addition, we were able to map one locus that controls apospory (apo-locus) in HG II. A total of 55 different gene families involved in cellular metabolism and plant growth were identified from markers adjacent to the QTLs and APOSPORY locus using the Panicum virgatum genome as a reference in comparisons with the genomes of Arabidopsis thaliana and Oryza sativa. Our results provide a better understanding of the genetic basis of reproduction by apomixis and traits important for breeding programs that considerably influence animal productivity as well as the quality of meat and milk.
Introduction
Forage grasses play a fundamental role in the global beef production chain. Brazil is the country with the greatest emphasis on this sector, being the main exporter of beef and having the largest commercial herd of beef cattle in the world, with approximately 215 million heads distributed in 162 million hectares of pasture (ABIEC, 2019). The main factor that led to this scenario was the beginning of tropical forage breeding in the 1980s in Brazil, which although recent, permitted the country to become the world's largest exporter of tropical forage seeds (ITC, 2018).
The African forage grass species Megathyrsus maximus (Jacq.) B. K. Simon & S. W. L. Jacobs (syn. Panicum maximum Jacq.), also known as guinea grass, is one of the most productive forage grasses reproduced by seeds in the Brazilian market and is also grown in other Latin American countries (Jank et al., 2011). It has been used mainly in intensive systems with high-fertility soils (Valle et al., 2009). Moreover, this forage has a high biomass potential and is promising as a biofuel feedstock (Odorico et al., 2018). The polyploidy and domestication process of this forage grass ensure high genetic variability to be explored (Jank et al., 2011); however, a lack of knowledge of the biology and genetics of the species, including its autotetraploidy and facultative apomictic mode of reproduction (Warmke, 1954), may make breeding more difficult and thus stimulate a need to invest in genetic studies.
The polysomic inheritance in autopolyploids makes genetic research difficult because several types of segregation may be involved (Field et al., 2017) and complexity increases as ploidy increases. Thus, in a segregating population, genetic complexity may influence the segregation and the frequencies of expected genotypes (Field et al., 2017), even causing distortions such as double reduction (DR), which is a type of meiosis in which the sister chromatids are duplicated, forming an unexpected combination of gametes. For example, an autotetraploid genotype with the “abcd” alleles at a locus that can form six expected combinations of gametes, namely, “ab”, “ac”, “ad”, “bc”, “bd”, and “cd”, but a homozygous gamete can be generated, e.g., “aa”, “bb”, “cc”, or “dd” (Haldane, 1930; Mather, 1935; Haynes and Douches, 1993). How to accommodate DR and its implications in a breeding program as well as the use of these marker loci in linkage mapping has been discussed for a long time (Butruille and Boiteux, 2000; Luo et al., 2000; Xu et al., 2013; Layman and Busch, 2018; Bourke et al., 2019) for some economically important species, such as potato (Bradshaw, 2007; Bourke et al., 2015) and alfalfa (Julier et al., 2003), but has not yet been reported in guinea grass.
Linkage maps have been used as the primary source of genetic information for nonmodel species that do not have their genome sequenced, such as M. maximus. The construction of dense linkage maps allows the identification of the structure and evolution of the genome by mapping traits with polygenic and monogenic inheritance and may even contribute to the assembly of the genome of a species (Doerge, 2002; Flint-Garcia et al., 2003; Luo et al., 2004). The majority of linkage maps available for autotetraploids are based on single-dose segregating markers for a parent (Aaaa x aaaa) or a single dose for both parents (Aaaa x Aaaa). Despite the use of complex statistical methods to obtain integrated maps that combine information from both marker patterns, these maps cover only part of the genome because higher-dose markers (AAaa, AAAa, and AAAA) are not included. This limitation results in a considerable loss of genetic information. To overcome this limitation, a new approach allows the assignment of allele dosage information for single nucleotide polymorphism (SNP) markers through exact allele sequencing depth, which generates linkage maps from markers in multiple doses with higher quality, more information and greater applicability, including more efficient detection of loci related to traits of economic importance (Serang et al., 2012; Hackett et al., 2014; Pereira et al., 2018; Mollinari and Garcia, 2019).
Mapping of the aposporous apomixis region is extremely important for the genetic breeding of M. maximus and other forage grasses, such as Urochloa spp., Paspalum spp., and Cenchrus ciliaris. These species undergo asexual propagation by seeds (Nogler, 1984), which allows the fixation of hybrid vigor in apomictic individuals and their use in the creation of uniform pastures (Jank et al., 2011). Experimental field data showed that aposporous apomixis in tropical forage grasses follows 1:1 Mendelian segregation, indicating monogenic inheritance (Savidan, 1981; Valle et al., 1994; Chen et al., 2000; Savidan, 2000), although a recent study suggests that this reproductive mode should be treated as a quantitative trait (Marcón et al., 2019), and provide evidence of the uncoupling of apomixis in neo-apomictic species, such as guinea grass (Kaushal et al., 2008; Kaushal et al., 2019). Molecularly, the apospory-specific genomic region (ASGR), which is responsible for apospory, is highly conserved among apomictic species (Gualtieri et al., 2006). The influence of some factors, such as epigenetics (Kumar, 2017), the presence of retrotransposons (Akiyama et al., 2011), and gene duplication (Conner et al., 2008), in this region has been reported for other species. Due to the laborious and time-consuming methods required to phenotype apomixis, several studies on forage grasses have searched for markers intrinsically linked to the chromosomal region for this trait (Pessino et al., 1998; Ebina et al., 2005; Bluma-Marques et al., 2014; Thaikua et al., 2016; Vigna et al., 2016; Worthington et al., 2016; Worthington et al., 2019); however, a 100% efficient marker for use in M. maximus breeding programs has not yet been identified.
In guinea grass there are no mapping studies of loci related to complex traits, such as those involved in forage yield and nutritional quality. Forage yield results from the continuous emission of leaves and tillers, ensuring the restoration of the leaf area after grazing in perennial pastures. Additionally, the nutritional value of a forage is directly related to animal performance and is measured by the crude protein, in vitro digestibility, neutral and acid detergent fiber, and lignin percentages (Jank et al., 2011). Thus, the mapping of these and other important quantitative trait loci (QTLs) may provide information about the genetic architecture of traits and assist in new strategies for breeding programs of M. maximus.
In this context, given the importance of new genomic studies in guinea grass for both biological knowledge and support for breeding programs, our goals were to (i) construct an integrated consensus linkage map from a full-sib progeny of M. maximus using allele dosage information, (ii) detect QTLs related to important agronomic and nutritional traits in this progeny, (iii) map the apo-locus, and (iv) search for similarity in regions of the markers adjacent to the QTLs and APOSPORY locus in Arabidopsis thaliana, Panicum virgatum and Oryza sativa.
Material and Methods
Plant Material
A full-sib progeny of 136 F1 hybrids was obtained from a cross between a facultative apomictic genotype of M. maximus cv. Mombaça and an obligate sexual genotype, S10. For the crosses, 100 m2 of cv. Mombaça was sown in lines with a space of 1 m between the lines. One plant of S10 was planted in each 5 m x 5 m grid. The sexual plants were monitored to ensure the synchronization of flowering with the cv. Mombaça, and the inflorescences that flowered before cv. Mombaça were cut. According to Savidan (1982), 25 m2 of the apomictic parent is sufficient to pollinate one sexual plant and to impede contamination from neighboring plants. The S10 plants are wind-pollinated, and the S10 seeds were harvested as they matured.
The sexual parent was derived from sexual x apomictic crosses of an original diploid sexual plant that was duplicated with colchicine (Savidan and Pernès, 1982); thus, both parents were autotetraploid (2n = 4x = 32) (Savidan et al., 1989). In addition to the reproductive mode, the parents have contrasting agronomic and nutritional quality traits (Braz et al., 2017). S10 is a medium sized plant (1.4 m tall) with medium width leaves (2.4 cm wide). Both its leaves and stems are glabrous, and its inflorescences consist of a panicle with short primary ramifications and long secondary ramifications throughout. Its spikelets are glabrous and purplish. The cv. Mombaça is a tall plant (1.7 m tall) with wide leaves (3 cm). Its leaves have small amount of hairs, and its stems are glabrous. Its inflorescences comprise a panicle with short primary ramifications and long secondary ramifications only on the inferior ramifications, and its spikelets are glabrous and light purple.
DNA extraction followed the protocol described by Doyle and Doyle (1987), with modifications. DNA samples were visualized on 2% agarose gels to check their quality and integrity, and their concentrations were estimated using a Qubit 3.0 fluorometer (Thermo Scientific, Wilmington, USA).
To retain only true full-sibs, all possible hybrids were previously genotyped with microsatellite markers. This analysis revealed 24 false hybrids, which were excluded at the construction stage of the GBS library.
Experimental Design
A field experiment following an augmented block design (ABD) with 160 regular treatments (full-sib progeny) and two checks (the parents ‘Mombaça’ and S10) distributed in eight blocks with two whole replicates was performed at Embrapa Beef Cattle (Brazilian Agricultural Research Corporation), in Campo Grande city, Mato Grosso do Sul state, Brazil (20°27ʹS, 54°37ʹW, 530 m). Each block consisted of a total of 22 plots (20 individuals and two checks).
Each plant was evaluated for agronomic and nutritional quality traits, totaling 22 traits: i) agronomic traits: green matter (GM—g/plant), total dry matter (TDM—g/plant), leaf dry matter (LDM—g/plant), stem dry matter (SDM—g/plant), regrowth capacity (RC), and percentage of leaf blade (PLB—%) and ii) nutritional quality traits for the leaf and stem: organic matter (OM_L and OM_S, respectively—%), crude protein (CP_L and CP_S—%), in vitro digestibility of organic matter (IVD_L and IVD_S—%), neutral detergent fiber (NDF_L and NDF_S—%), acid detergent fiber (ADF_L and ADF_S—%), cellulose (CEL_L and CEL_S—%), silica (SIL_L and SIL_S—%), and permanganate lignin (PL_L and PL_S—%). The agronomic traits were evaluated for six harvests (three harvests in 2013 and three harvests in 2014), but RC was evaluated for only three harvests (one harvest in 2013 and two harvests in 2014). The nutritional quality traits were evaluated for only one harvest in 2014.
Statistical Analysis of Phenotypic Data
Descriptive analyses were performed, and the Box-Cox transformation (Box and Cox, 1964) was applied to correct for nonnormality of the residuals. For traits with multiple harvests (agronomic traits), we fitted the following longitudinal linear mixed model:
where yijkl was the phenotypic value of the ith treatment in the jth block and kth replicate at the lth harvest; µ was the fixed overall mean; hl was the fixed effect of the lth harvest (l = 1, ..., L, with L = 3 for RC and L = 6 for the other traits); rk(l) was the fixed effect of the kth replicate (k = 1, ..., K, with K = 2) at harvest l; bj(l) was the random effect of the jth block (j = 1, ..., J, with J = 8) at harvest l, with bj(l) ~ N(0,); rbkj(l) was the random interaction effect of replication k and block j at harvest l, with rbkj(l) ~ N(0,); ti(l) was the effect of the ith treatment (i = 1, ..., I, with I = 162) at harvest l; and εijkl was the random environmental error. The treatment effects (ti(l)) were separated into two groups: gi(l) was the random effect of the ith individual genotype (i = 1, ..., Ig, with Ig = 160) at harvest l, and ci(l) was the fixed effect of the ith check (i = 1, ..., Ic, with Ic = 2) at harvest l. For genotype effects, the vector g = (g11, ..., gIgL)` was assumed to follow a multivariate normal distribution with a mean of zero and genetic variance-covariance (VCOV) matrix G = GL Ⓧ IIg, i.e., g ~ N(0, G). For residual effects, the vector ε = (ε1111, ..., εIJKL)` followed a multivariate normal distribution with a mean of zero and residual VCOV matrix R = RL Ⓧ II.J.K, i.e., ε ~ MVN(0, R).
The VCOV matrices GL and RL were analyzed considering seven different structures: identity (ID), diagonal (DIAG), compound symmetry (CS), heterogeneous compound symmetry (CSHet), first-order autoregressive (AR1), heterogeneous first-order autoregressive (AR1Het), first-order factor analytic (FA1), and unstructured (US). First, the genetic VCOV matrix (GL) was analyzed considering the ID for the residual matrix (RL), and posteriorly, the residual matrix (RL) was analyzed considering the selected VCOV matrix for genetic effects. Model selection was performed based on the Akaike information criterion (AIC) (Akaike, 1974) and Schwarz information criterion (SIC) (Schwarz, 1978).
For the nutritional quality traits, we fitted the following linear mixed model:
where yijk was the phenotypic value of the ith treatment in the jth block and kth replication; µ, rk, bj, rbkj, ti, and εijk were as described above but not nested within harvest and with εijk ~ N(0,). The treatment effects (ti) were separated into two groups: gi as a random effect, g ~ N(0,), and ci as a fixed effect. All analyses were performed with the R package ASReml-R (Butler et al., 2009).
The heritability of each trait was calculated using the same model as previously mentioned but considering the GL and RL matrices as the ID. The equation was
where is the genetic variance and is the phenotypic variance. The network analysis was carried out using the R package ‘qgraph' (Epskamp et al., 2012).
Identification of the Reproductive Mode
The aposporic or sexual reproductive mode was determined for 106 hybrids of the progeny (Supplementary Table 1). From the flowers collected during anthesis, we performed an analysis of 30 ovules per hybrid using the clarified ovary method described by Young et al. (1979). Nomarski differential interference contrast microscopy was used to view the ovaries. A chi-square test was performed to verify the Mendelian segregation of this trait according to the expected model of monogenic inheritance in the base package of R (version 3.5.0) (R Core Team, 2018).
GBS Library Preparation and Sequencing
From the extracted DNA, genotyping-by-sequencing (GBS) libraries were built according to Poland et al. (2012), containing 12 replicates for each parent. A total of 200 ng of genomic DNA per sample was digested with a combination of a rare-cutting enzyme (PstI) and a frequently cutting enzyme (MspI). DNA fragments were ligated to the common and barcode adapters, and the libraries were sequenced as 150-bp single-end reads using the High Output v2 Kit (Illumina, San Diego, CA, USA) for the NextSeq 500 platform (Illumina, San Diego, CA, USA).
SNP Calling and Allele Dosage Analysis
First, raw data were checked for quality using NGS QC Toolkit (Patel and Jain, 2012). SNP calling analysis was performed using the TASSEL-GBS v.4 pipeline (Glaubitz et al., 2014) modified for polyploids (Pereira et al., 2018) that use exact read depths. The default parameters were changed as follows: the minimum number of times a GBS tag must be present was changed to 5, and the minimum count of reads for a GBS tag was changed to 2. This pipeline requires a genome as a reference for SNP calling, but no genome sequence of M. maximus is available. To overcome this limitation, the switchgrass genome (P. virgatum v1.0, produced by the US Department of Energy Joint Genome Institute) available in the Phytozome database (http://phytozome.jgi.doe.gov/) (Goodstein et al., 2012) was chosen because this species is phylogenetically closely related to M. maximus (Burke et al., 2016). GBS tags were aligned to the reference genome with Bowtie2 2.3.1 (Langmead et al., 2009) using the following settings: very-sensitive-local, a limit of 20 dynamic programming problems (D) and a maximum of 4 times to align a read (R). Subsequently, only tags that aligned exactly one time were processed. Then, SNP calling was performed under the conditions that the minor allele frequency was greater than 0.05 and the minor allele count was greater than 1,000. Mismatches of duplicated SNPs greater than 0.2 were not merged. Then, in R software (version 3.5.0) (R Core Team, 2018), we selected only the SNPs with a minimum average allele depth equal to or greater than 60 reads. The updog package (Gerard et al., 2018) was used to estimate the allele dosage of these markers, with a fixed ploidy parameter of 4 and the flexdog function considering the F1 population model. SNPs with less than 0.15 of the posterior proportion of individuals incorrectly genotyped were selected. GBS sequences of each individual were deposited in the NCBI database under number PRJNA563938.
Quality Filtering of SNPs
We removed markers with more than 25% missing data and monomorphic markers manually in R software (version 3.5.0) (R Core Team, 2018). Subsequently, we followed Bourke et al. (2018a) to ensure the retention of reliable markers. We first verified the shifted markers for the polysomic inheritance model from which SNP markers that did not correspond to an expected segregation type were removed. A threshold of 5% was used for missing values per marker and per individual. Duplicated markers, which provided no extra information about a locus, were also removed in this step. Finally, a principal component analysis (PCA) was performed to identify individuals who deviated from the progeny as well as possible clones.
Linkage Map Construction
A linkage map was constructed using TetraploidSNPMap version 3.0 (Hackett et al., 2017), which allows the use of SNP markers with allele dosage data for autotetraploid species. SNP markers were checked with a chi-square test for goodness of fit, and only markers with a simplex configuration value greater than 0.001 and a segregation value greater than 0.01 for higher dosage were selected for mapping. Some unselected markers were classified as having segregation distortion (SD), being incompatible with the parental dosages (NP) and having DR. To order the selected markers, two-point analysis and multidimensional scaling analysis (MDS) were used to calculate recombination fractions and logarithm of odds (LOD) scores. Outlier markers were removed in this step. Some phases of the linked SNPs were inferred by TetraploidSNPMap software, and other phases were determined manually. The integrated consensus map represented by homology groups (HGs) was plotted using MapChart 2.32 (Voorrips, 2002), in which SNP configurations were identified with different colors.
Monogenic and Polygenic Trait Analysis
QTL mapping of six agronomic traits and sixteen nutritional quality traits was performed with TetraploidSNPMap, applying an interval mapping model (Hackett et al., 2014; Hackett et al., 2017). Analyses were conducted for each HG separately using three data files: phenotypic trait data, genotypic data and map data with phase information. The phenotypic data for the reproductive mode, i.e., aposporic or sexual, were considered qualitative due to the evaluation method applied; i.e., apomictic individuals were coded as one, and sexual individuals, as zero. The other phenotypic traits were analyzed as quantitative. QTL positions and significance were evaluated with a 1,000 permutation test. A QTL was declared significant if its LOD score was above the 90% threshold. Simple models were tested for each significant QTL to verify the best QTL model. The lowest SIC (Schwarz, 1978) was the criterion used to define the best model. Using TetraploidSNPMap software, if two or more significant QTLs were identified on the same chromosome, only the one with the greatest effect was considered.
Search for Similarity in Aposporic and QTL Regions
We performed a search for similarity of candidate genes located close to the detected QTL/apospory locus regions. Using the switchgrass genome as a reference and based on chromosomal locations of the markers adjacent to the detected QTLs and apospory locus, we aligned the sequences found in 100-kb regions with Basic Local Alignment Search Tool (BLAST) (e-value cutoff of 1e-0.5) against the A. thaliana and O. sativa genomes through the JBrowse tool in Phytozome (http://phytozome.jgi.doe.gov/) (Goodstein et al., 2012).
Results
Phenotypic Data
Different VCOV matrices were selected for the agronomic and nutritional traits (Supplementary Tables 2 and 3). When the AIC and SIC were not in agreement, we selected the matrices based on the largest difference between the models. For example, considering the GM trait and the GL matrix, US was selected based on the AIC, and CS was selected based on the SIC (US had 567.32 for the AIC and 702.21 for the SIC, and CS had 581.66 for the AIC and 598.53 for the SIC). The differences between these two selected models were 14.34 for the AIC (581.66-567.32) and 103.68 for the SIC (702.21-598.53). As the SIC produced the largest difference, this criterion was used, and the CS matrix was selected for the GL matrix of the GM trait. The heritabilities ranged from 0.19 (PLB) to 0.64 (GM) for the agronomic traits and from 0.06 (SIL_S) to 0.31 (OM_L and CEL_S) for the nutritional quality traits (Table 1). Box-Cox transformation was performed for agronomic traits (GM, TDM, LDM, SDM, RC, PLB) and nutritional traits of the leaves and stems (OM_L, OM_S, CP_S, IVD_L, IVD_S, NDF_S, ADF_L, CEL_L, SIL_L, SIL_S, PL_L, and PL_S).
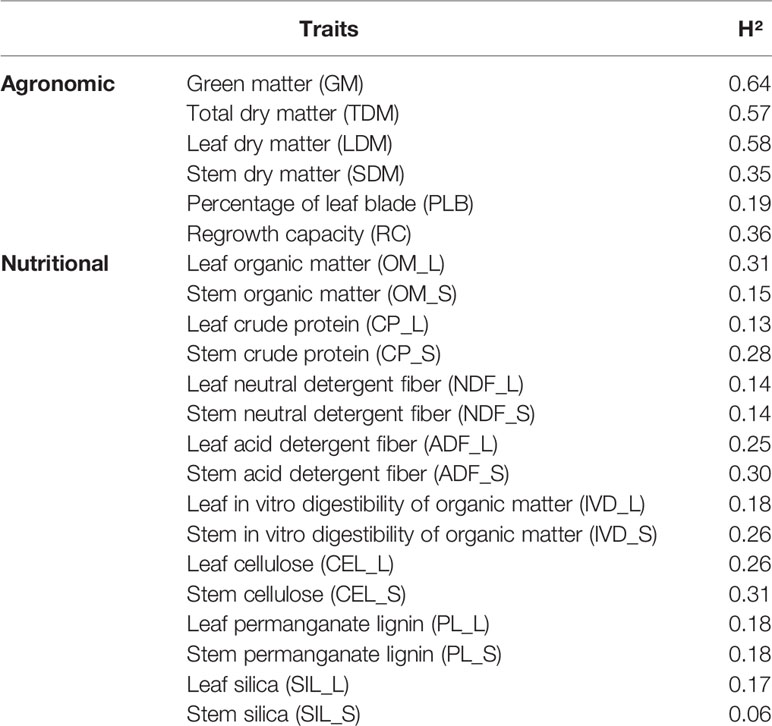
Table 1 Broad-sense heritability obtained for the agronomic and nutritional traits for the F1 mapping population of guinea grass (Megathyrsus maximus) evaluated in this study.
The correlations between the agronomic and nutritional traits are presented in Figure 1. Significant and positive correlations were observed among GM, TDM, SDM, LDM, and RC.
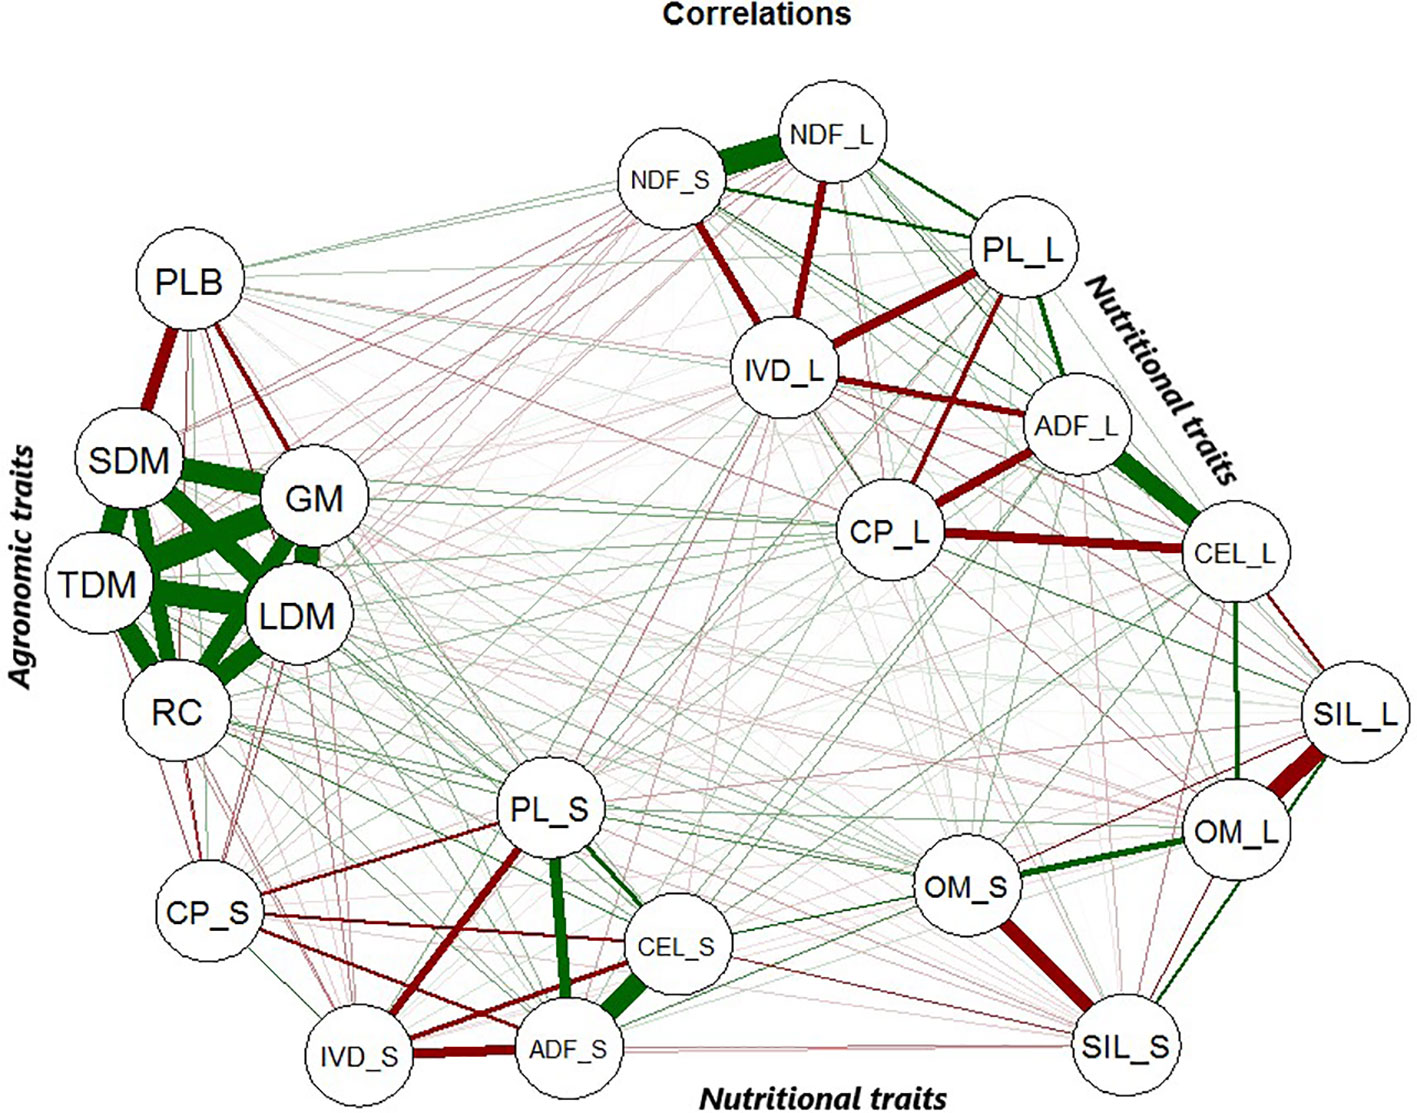
Figure 1 Correlations among all phenotypic traits from the guinea grass mapping population. The green lines correspond to positive correlations between the traits, and the red lines correspond to negative correlations between the traits. The agronomic traits were green matter (GM), total dry matter (TDM), leaf dry matter (LDM), stem dry matter (SDM), percentage of leaf blade (PLB), and regrowth capacity (RC). The leaf and stem nutritional quality traits were the following: organic matter (OM_L and OM_S), crude protein (CP_L and CP_S), neutral detergent fiber (NDF_L and NDF_S), acid detergent fiber (ADF_L and ADF_S), in vitro digestibility of organic matter (IVD_L and IVD_S), cellulose (CEL_L and CEL_S), permanganate lignin (PL_L and PL_S), and silica (SIL_L and SIL_S).
PLB presented a negative correlation with other agronomic traits and a positive correlation with NDF, but these correlations were weaker than those found for the other pairs of traits. Complex correlations between nutritional traits were obtained. In particular, stem-related traits were most tightly correlated with leaf-related traits, and NDF_L and NDF_S were closely correlated. The ADF, CEL and PL traits exhibited a significant and positive correlation. The same pattern was observed for the leaf and stem nutritional traits: CP and IVD exhibited a strong negative correlation with PL, ADF, CEL and NDF.
Genotyping and Linkage Analysis
A total of 23,619 SNPs were identified through alignment using the P. virgatum genome as the reference, and these presented a mean depth per individual of 247.8 (SD ± 121.7). After the genotypic analysis, 2,804 SNPs with an average allele depth greater than 60 were selected for further filtering. After allele dosage estimation, 275 SNPs were discarded, in addition to 15 monomorphic markers and four markers with missing data identified manually in R software. Using the updog package, we obtained the allele dosage information for 2,510 SNPs, considering an autotetraploid species (Table 2). Simplex (AAAA × AAAB, ABBB × BBBB) was the most commonly found configuration, with 1,654 markers, followed by the duplex (AAAA × AABB, AABB × BBBB) and double-simplex (AAAB × AAAB, ABBB × ABBB) configurations, with 334 and 226 SNPs, respectively. The simplex-duplex (AAAB × AABB) configuration was the most represented among the higher dosages, with 155 markers, and the duplex-simplex (AABB × ABBB) configuration was the least represented, with only six SNPs. Analysis with the polymapR package revealed that all offspring were 95% compatible with the parents. Two individuals (B107 and C39) were very genetically similar to the parent cv. Mombaça and were removed, one clone (C49) of individual C44 was also removed, and another clone (B127) similar to B126 was also excluded (Figure 2). We subsequently discarded another 37 SNPs with missing values and 1,151 duplicated SNPs. This filtering resulted in 132 genotyped offspring with 1,322 markers that were used at the beginning of the linkage analysis in TetraploidSNPMap software. In this step, incompatible markers with the parental allele dosages, SNPs with DR and markers showing SD were not considered. In addition, two-point analysis identified 149 SNPs as duplicated, and MDS analysis identified 27 outliers, which were then excluded. In total, 858 reliable SNPs were included in the linkage map. The apomictic parent, cv. Mombaça, presented 368 exclusive alleles; the sexual parent, S10, presented 275 exclusive alleles; and the two parents shared 215 alleles. TetraploidSNPMap software was used again to rank the 2,510 SNPs based on their expected segregation. The analysis resulted in a total of 114 SNPs with SD, 183 with NP and 243 with DR (Table 2).
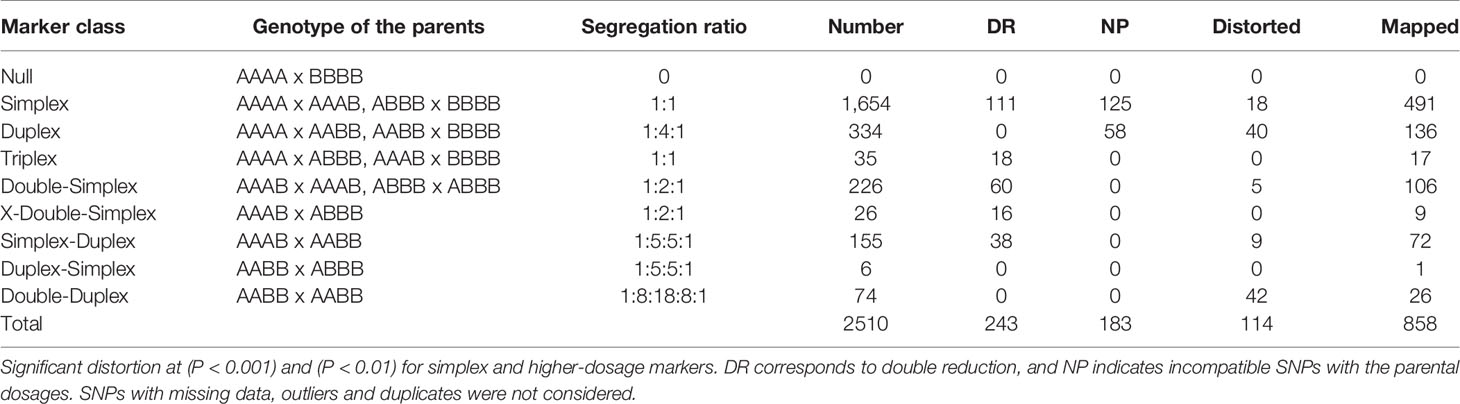
Table 2 Distribution of SNP markers among genotype classes for a mapping population of guinea grass (Megathyrsus maximus).
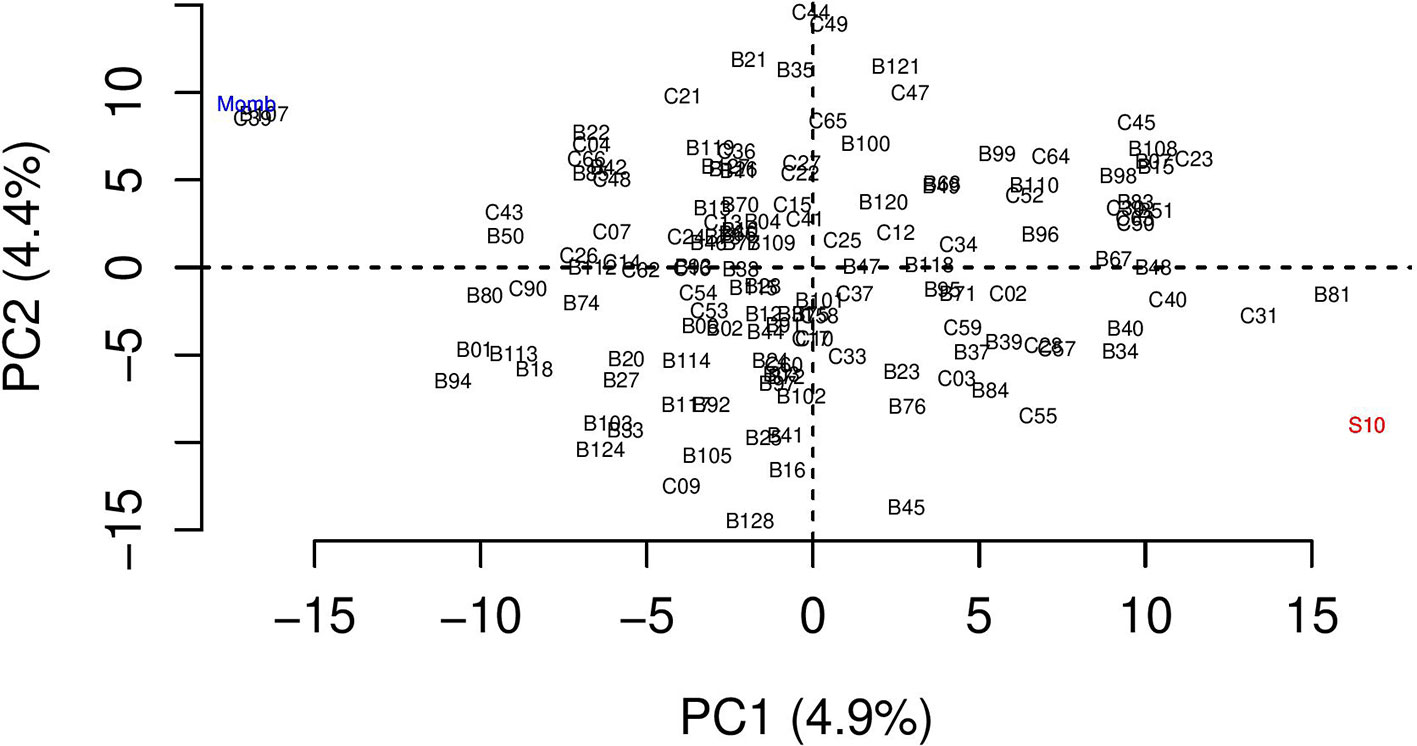
Figure 2 Principal component analysis representing the genetic diversity among the progeny and the parents of the mapping population of guinea grass (Megathyrsus maximus). The parents are highlighted in red (S10) and blue (cv. Mombaça).
Linkage Map
We constructed an integrated consensus linkage map consisting of 858 SNP markers distributed over 756.69 cM in eight HGs, with all possible allele dosage configurations for an autotetraploid species. (Table 2, Figure 3 and Supplementary Table 4). Considering all integrated consensus HGs, an average density of ~1.13 SNPs/cM was obtained. The largest HG was VII, with 159 SNPs distributed over 108.573 cM, and the smallest HG was VIII, with 49 SNPs present over 70.05 cM. The interlocus intervals were relatively small, with a minimum value of 0.003 cM for the majority of the HGs (I, II, IV, VI and VII) and a maximum of 8.65 cM and 7.24 cM on HG V and HG I, respectively (Table 3). Among the markers, we identified approximately 30 double-duplex markers (AABB x AABB), which contained all types of doses for autotetraploid progenies (Table 2, Figure 3 and Supplementary Table 4) (Hackett et al., 2014).
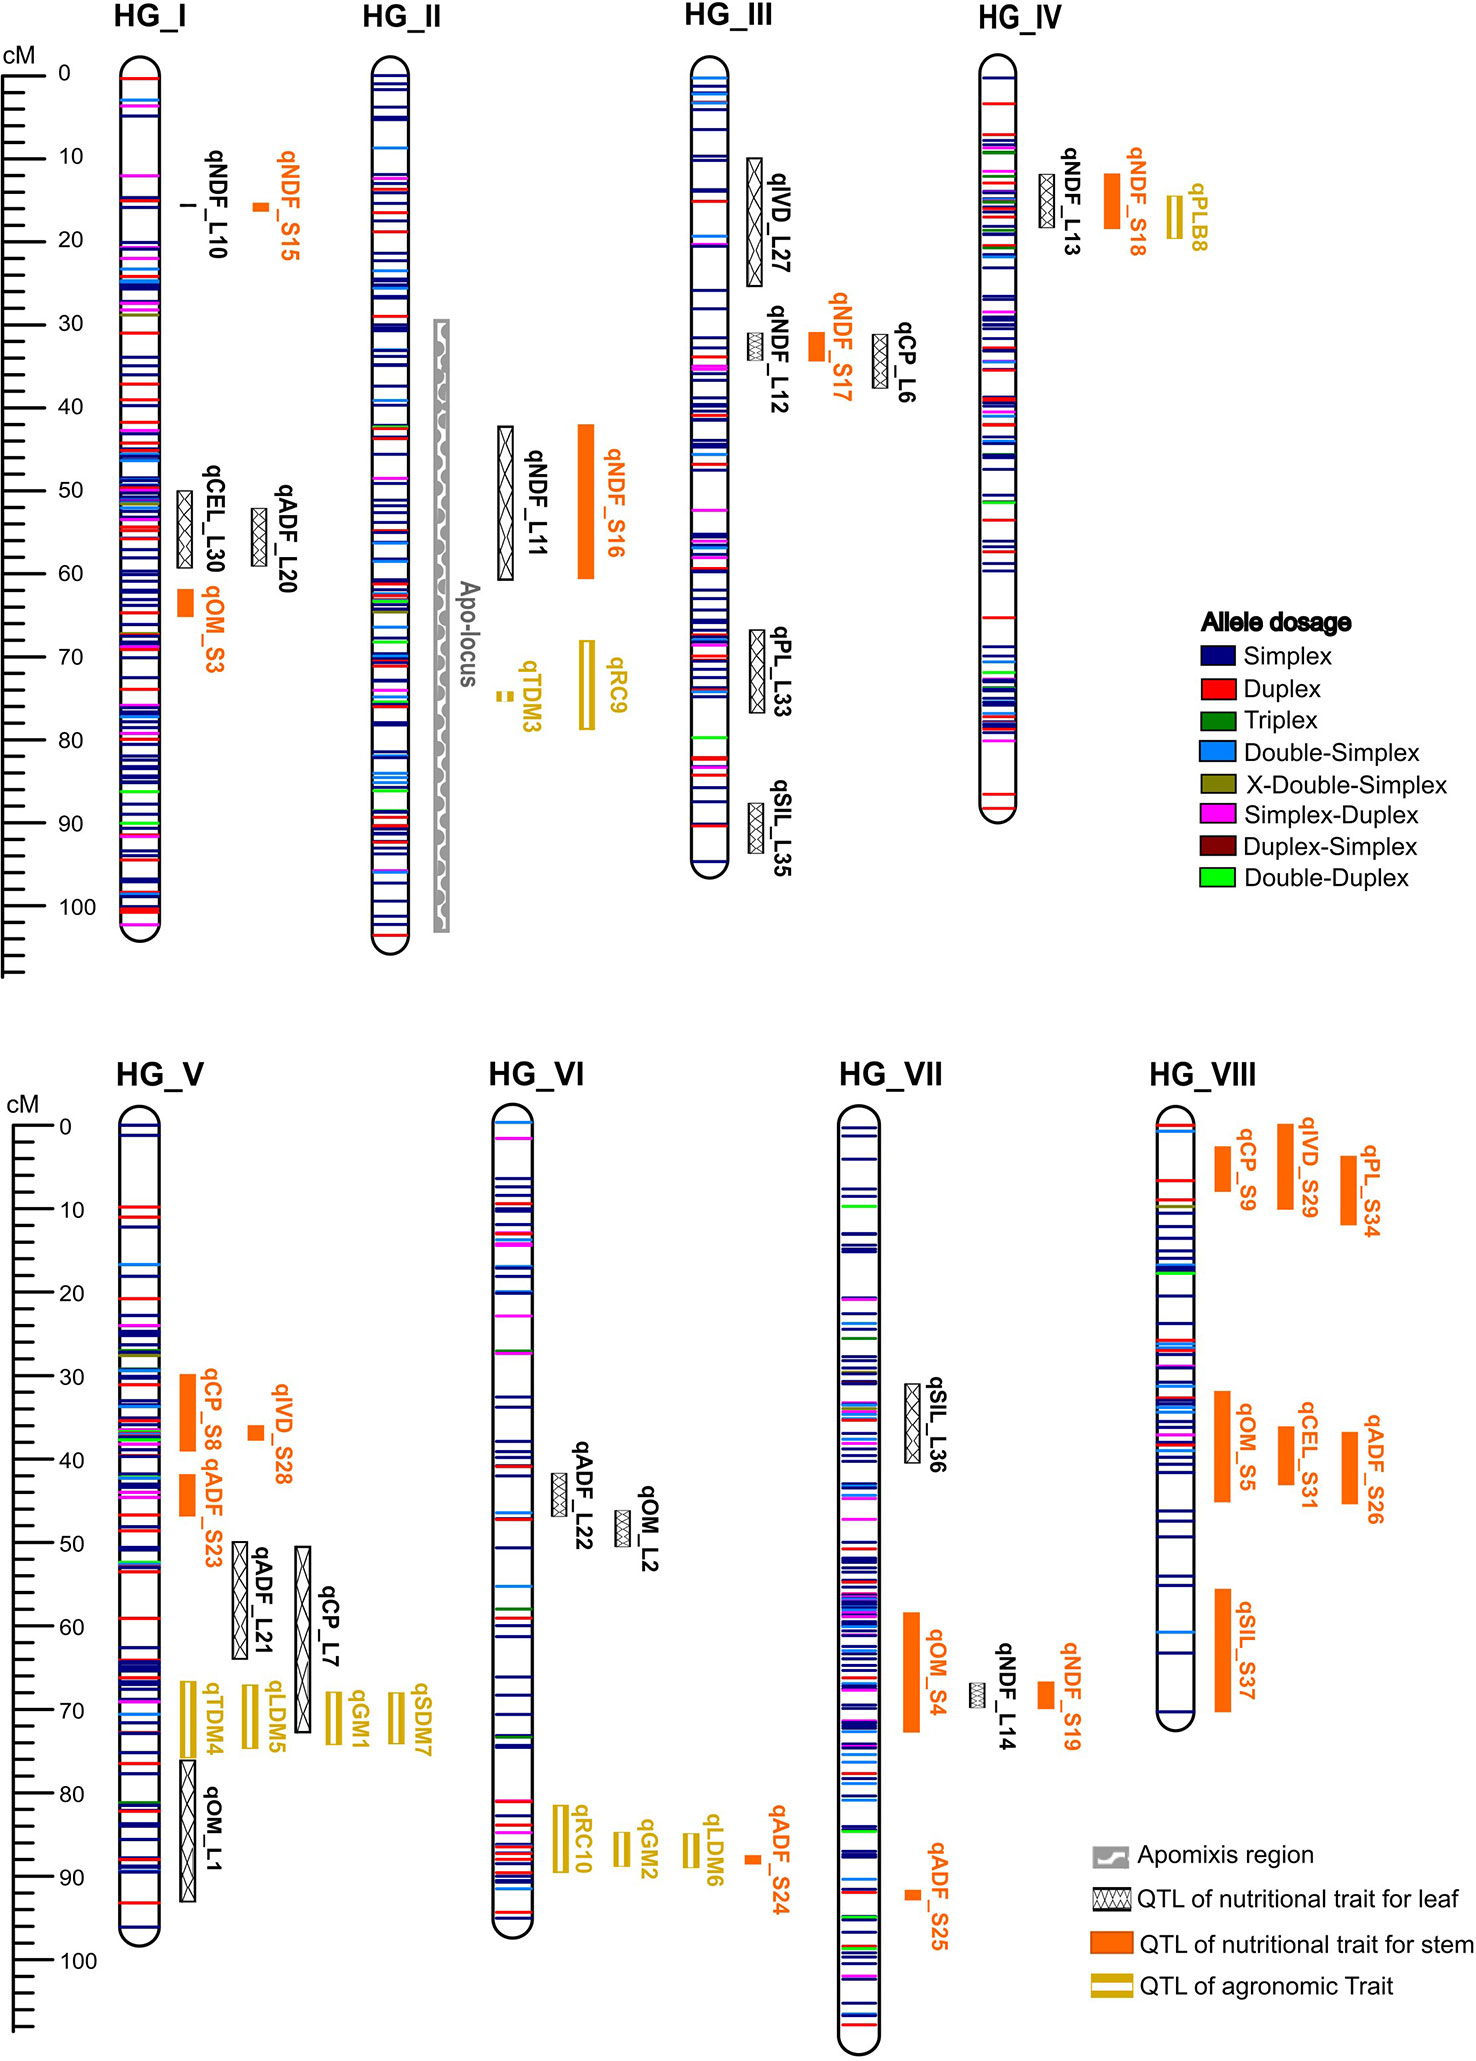
Figure 3 Linkage map constructed for guinea grass (Megathyrsus maximus) using SNPs with allele dosage information, including representation of intervals of the highest peaks of QTLs.
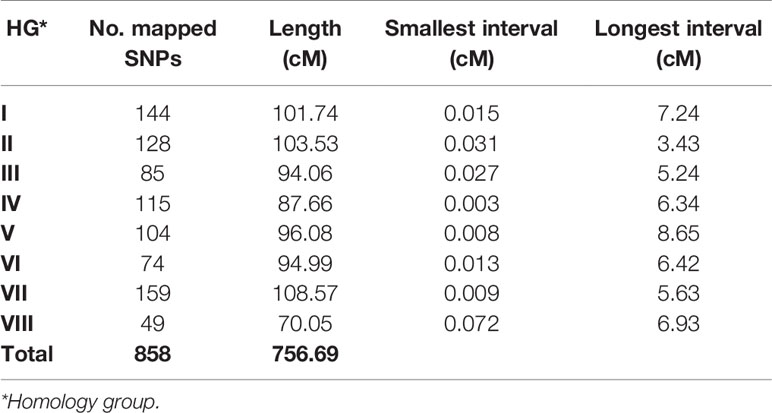
Table 3 Summary of the linkage map of guinea grass (Megathyrsus maximus) obtained with the S10 × cv. Mombaça population.
Apospory Mapping
The mode of reproduction of 106 hybrids in the mapping population was determined and indicated that apospory had a segregation ratio of 1:1 based on a chi-square test (X² = 5.43, p ≥ 0.01), consistent with the model expected for monogenic inheritance. The apo-locus was mapped in the HG II at a peak position of 65 cM, with a high LOD score of 50.06 (Supplementary Figure 1). More than 80% of the phenotypic variation in the apomictic reproductive mode was explained, and the simple models best classified the apo-locus as a simplex genotype (BBBB x ABBB). As expected, this locus was linked to the apomictic parent, cv. Mombaça. Two SNP markers exclusive to this parent, namely, S_14_29023868 and S_10_48091934, were linked to the apo-locus at 0.8 cM (Figure 3).
Agronomic Trait Mapping
Ten significant QTLs were mapped for GM, TDM, LDM, SDM, PLB, and RC, which were distributed in HGs II, IV, V and VI (Table 4 and Supplementary Figure 2). Here, we will report the QTLs that were identified for the main traits targeted in the M. maximus breeding program. TDM was associated with two QTLs in HGs II (qTDM3) and V (qTDM4) with LOD scores of 3.4 and 4.4 and that explained 5.8 and 9.4% of the phenotypic variation, respectively. For LDM, we detected two QTLs in HGs V (qLDM5) and VI (qLDM6) with LOD scores of 3.9 and 3.0 and that explained 7.9 and 4.5% of the phenotypic variation, respectively. PLB was associated with one QTL in HG IV (qPLB8) with LOD score of 3.8 and that explained 6.8% of the phenotypic variation. We identified two QTLs for RC in HGs II (qRC9) and VI (qRC10) with LOD scores of 4.7 and 3.8 and that explained 10.4% and 6.3% of the phenotypic variation, respectively.
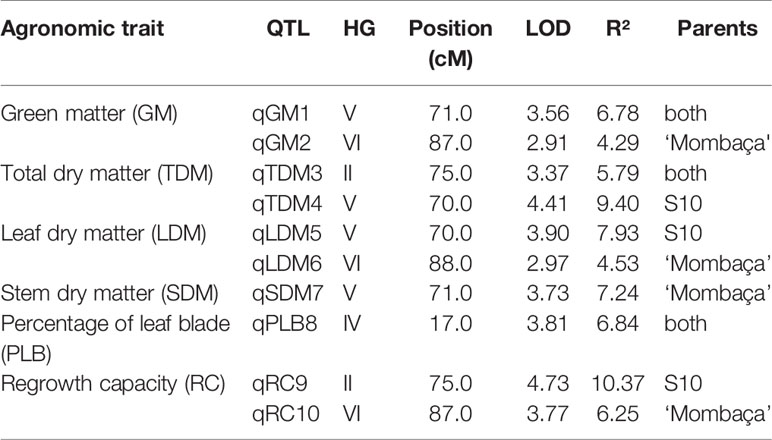
Table 4 QTLs identified for agronomic traits from the sexual genotype S10 and apomictic cv. Mombaça of guinea grass (Megathyrsus maximus).
The simple models that best represented the QTLs for each agronomic trait were identified based on the lowest SIC values. The QTL with the greatest effect on TDM, which was present in HG VI, followed a duplex model (AAaa x aaaa) with an additive effect of the A allele from the S10 parent. The same model was verified for LDM with qLDM5, a QTL associated with the S10 parent, and qLDM6, a QTL associated with the cv. Mombaça parent. The QTL with the smallest effect for TDM and the single QTL for PLB followed the double-simplex model (Aaaa x Aaaa) with an additive effect of both parents. The two QTLs detected for RC followed the simplex model, with the S10 parent contributing the allele for qRC9 and the ‘Mombaça' parent contributing the allele for qRC10.
Nutritional Trait Mapping
Thirty-six significant preliminary QTLs were identified for OM, CP, NDF, ADF, IVD, PL, CEL, and SIL for the leaf and stem. These QTLs were distributed in all HGs (Table 5 and Supplementary Figures 3, 4). For CP_L, two QTLs were detected in HGs III (qCP_L6) and V (qCP_L7) with LOD scores of 3.4 and 4.3 and that explained 5.1% and 9.7% of the phenotypic variation, respectively. For CP_S, two QTLs were detected in HGs V (qCP_S8) and VIII (qCP_S9) with LOD scores of 3.8 and 2.8 and that explained 8.4% and 3.2% of the phenotypic variation, respectively. For NDF_L and NDF_S, we detected five QTLs each, all at the same positions in HGs I (qNDF_L10/qNDF_S15), II (qNDF_L11/qNDF_S16), III (qNDF_L12/qNDF_S17), IV (qNDF_L13/qNDF_S18), and VII (qNDF_L14/qNDF_S19). The QTLs with the largest effect on NDF were found in HGs II and IV and were identified with LOD scores of 5.5 and 4.3, respectively; qNDF_L11/qNDF_S16 in HG II explained more phenotypic variation (12%). For the IVD_L trait, only one QTL was found in HG III (qIVD_L27) with LOD score of 3.8 and that explained 5.9% of the phenotypic variation. For IVD_S, two QTLs were obtained in HGs V (qIVD_S28) and VIII (qIVD_S29) with LOD scores of 3.6 and 3.9 and explaining 7.3 and 5.8% of the phenotypic variation, respectively. We detected a single QTL for PL_L located in HG III (qPL_L33) with LOD score of 3.9, and it explained 6.2% of the phenotypic variation. Additionally, PL_S was associated with only one QTL, which was identified in HG VIII (qPL_S34) with LOD score of 2.7 and explained 2.8% of the variation in the trait.
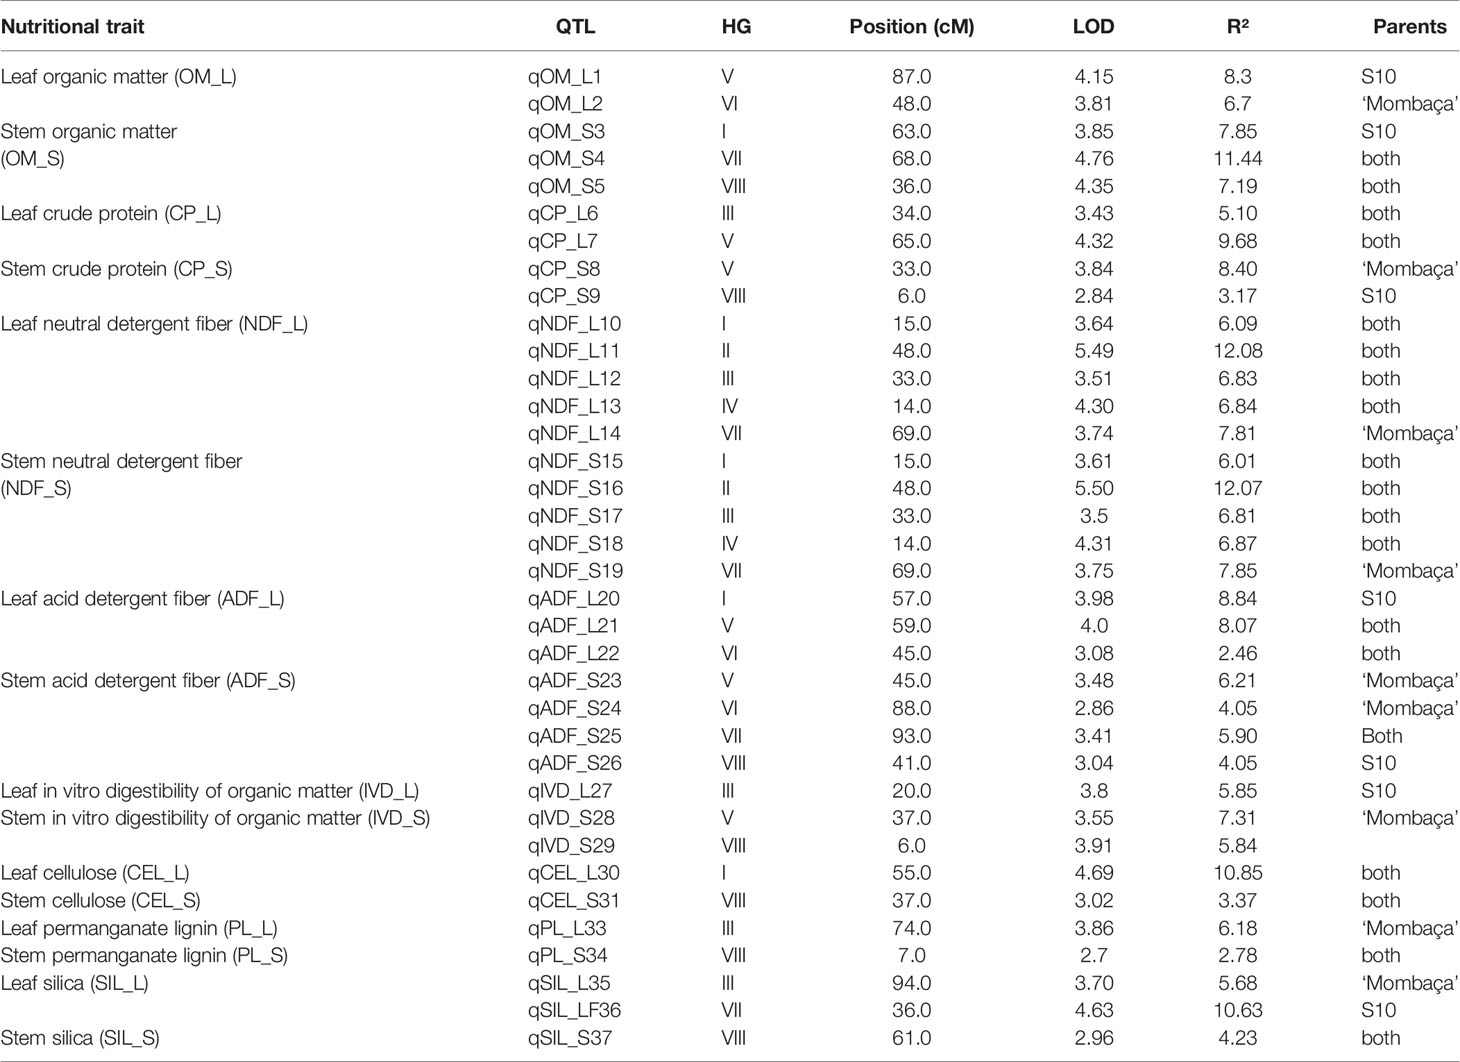
Table 5 QTLs identified for traits related to nutritional quality from the sexual genotype “S10” and apomictic cv. ‘Mombaça’ of guinea grass (Megathyrsus maximus).
According to the simple model analysis, the best model for the two QTLs of CP_L was the double-simplex model (Aaaa x Aaaa) with an additive effect of both parents. In contrast, qCP_S8 was best represented by a duplex model (AAaa x aaaa) with a dominant effect of cv. Mombaça. The CP_S9 QTL was represented by a double-simplex model with an additive effect of the S10 parent. The QTL with the greatest effect on NDF was best represented by the double-simplex model with an additive effect from both parents. For IVD_L, a simplex allele was verified in the sexual parent (Aaaa x aaaa). The same model was also observed for IVD_S and PL_L, with the A allele from the apomictic parent associated with the trait. The single QTL for PL_S was explained by a double-simplex model with a dominant effect from both parents.
Search for Similarity in Aposporic and QTL Regions
Some genes that contain conserved protein domains were found in regions flanking the apo-locus located in HG II, such as the Spc97/Spc98 family of spindle pole body (SBP) components, whose proteins assist in the control of the microtubule network (Lin et al., 2015), and the inner centromere protein (ARK-binding region). These two genes play an important role in the segregation of chromosomes during cell division (Kirioukhova et al., 2011; Lin et al., 2015). In addition, a gene possibly involved in the aposporic reproductive mode was similar to somatic embryogenesis receptor-like kinase 1 (SERK1), which is part of a complex associated with the induction of embryo development (Albrecht et al., 2008).
A total of 23 regions were found due to the overlap of QTLs in common regions in the linkage map. In these regions, 55 different gene families from P. virgatum, A. thaliana and O. sativa were identified. Most of these genes may play important roles in cellular metabolism and may be associated with plant growth and development (Table 6). Further details about the locations of the candidate genes in their respective QTL regions are provided in Supplementary Table 5.
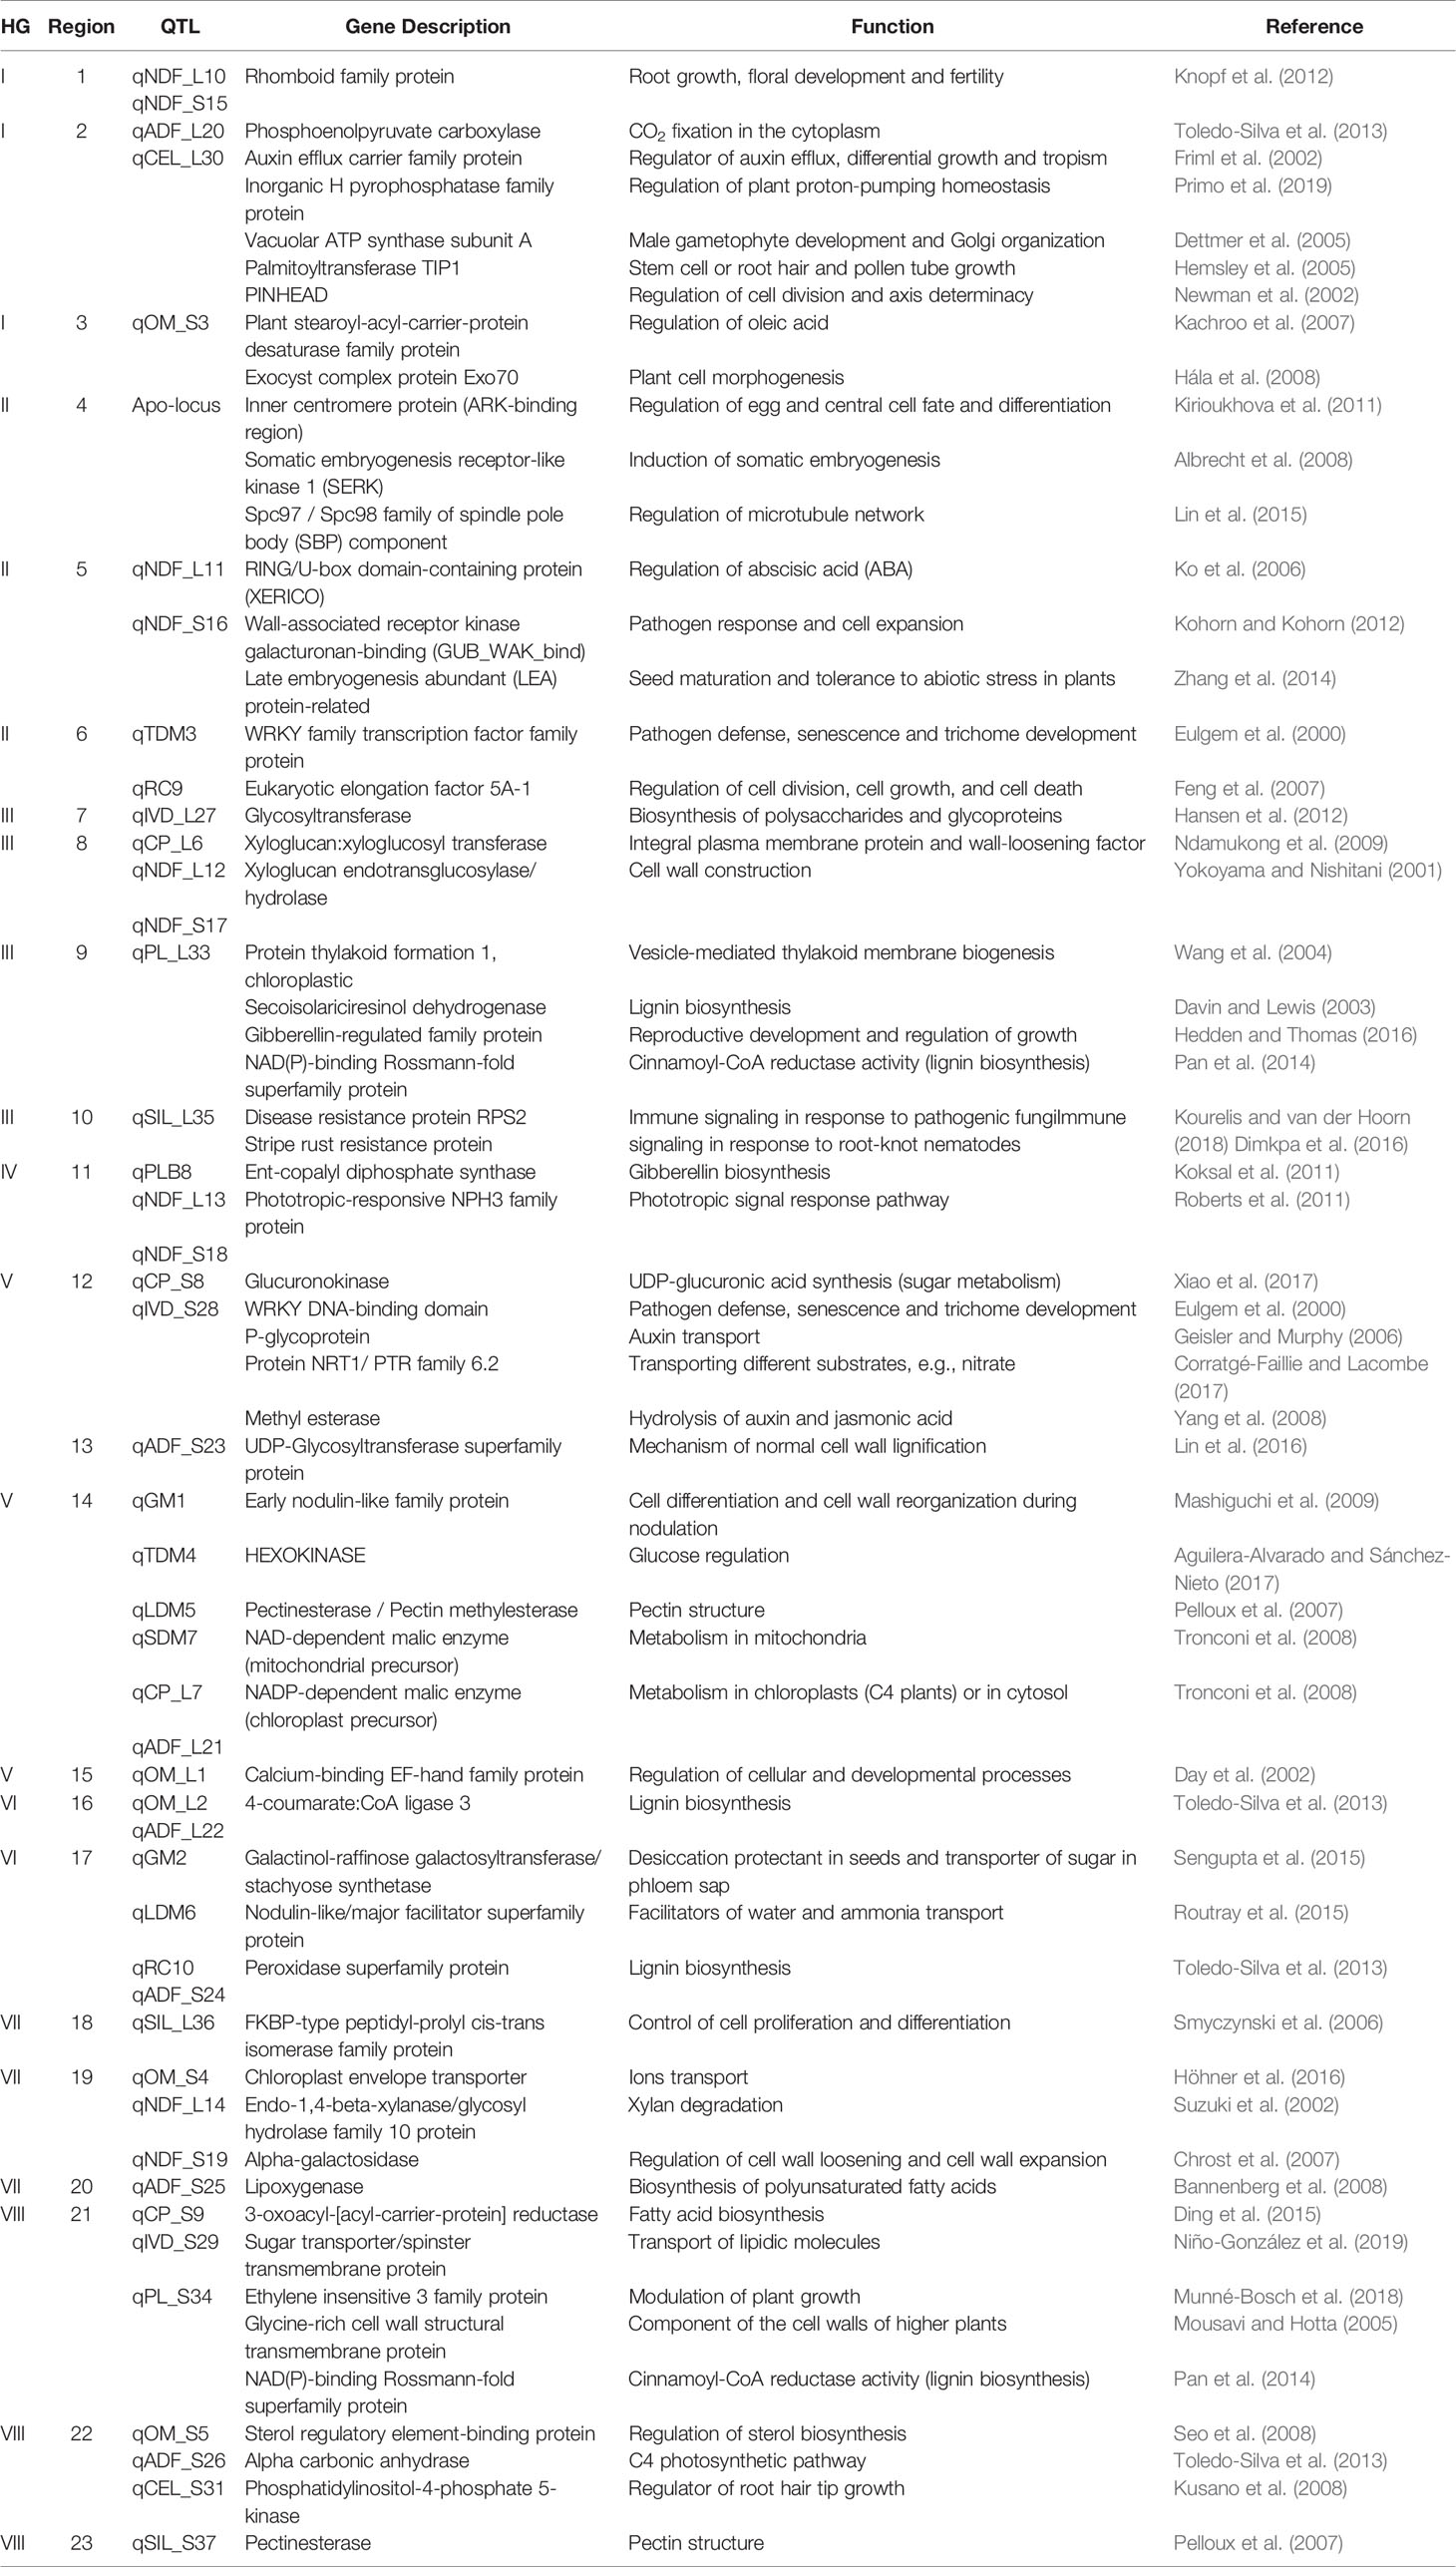
Table 6 Description and function of the genes identified in APOSPORY and QTL regions from linkage map of guinea grass.
Among the putative genes, many participate in hormonal signaling pathways, such as auxin efflux carrier component in HG I region 2 (qADF_L20/qCEL_L30), which is related to the intercellular directionality of auxin (Friml et al., 2002); RING/U-box (XERICO) in HG II region 5 (qNDF_L11/ qNDF_S16), which is involved in the regulation of abscisic acid (ABA) (Ko et al., 2006); gibberellin-regulated family members (GAST1, GASR2, GASR3, and GASR9) in HG III region 9 (qPL_L33), which are associated with the regulation of gibberellic acid (GA) and ABA (Hedden and Thomas, 2016); ent-copalyl diphosphate synthase in HG IV region 11 (qNDF_L13/qNDF_S18/qPLB8), which plays a role in GA biosynthesis (Koksal et al., 2011); and ethylene insensitive 3 (EIN3) in HG VIII region 21 (qCP_S9/qIVD_S29/ qPL_S34), which is associated with cell growth and senescence processes (Munné-Bosch et al., 2018) (Table 6 and Supplementary Table 5).
In addition, other genes with a role in plant physiology were also identified, such as the gene encoding the enzyme phosphoenolpyruvate carboxylase (PEPC) in HG I region 2 (qADF_L20/qCEL_L30), whose function is the catalysis of primary metabolic reactions in plants (Toledo-Silva et al., 2013). Glycosyltransferase was found in HG III region 7 (qIVD_L27) and is associated with the biosynthesis of polysaccharides and glycoproteins (Hansen et al., 2012). Pectinesterase/pectin methylesterase, which was detected in HG V region 14 (qGM1/qTDM4/qLDM5/qSDM7/qADF_L21/qCP_L7) and HG VIII region 23 (qSIL_S37) is related to cellular adhesion and stem elongation (Damm et al., 2016). In addition to these genes, we found a chloroplast envelope transporter in HG 7 region 19 (qOM_S4/qNDF_L14/qNDF_S19). Phosphatidylinositol-4-phosphate 5-kinase, which was present in HG VIII region 22 (qOM_S5/qADF_S26/qCEL_S31), is involved in coordinating plant growth (Kusano et al., 2008).
Many putative candidate genes present in lignan biosynthesis pathways were verified in some regions of QTLs. Glycosyl hydrolase family 16 was located in HG III region 8 (qCP_L6/qNDF_L12/qNDF_S17), and the genes associated with secoisolariciresinol dehydrogenase and the NAD(P)-binding Rossmann-fold superfamily were located in region 9 (qPL_L33). UDP-Glycosyltransferase superfamily protein was present in HG V region 13 (qADF_S23). The 4-coumarate:CoA ligase 3 gene was obtained in HG VI region 16 (qOM_L2/qADF_L22). The gene encoding NAD(P)-binding Rossmann-fold superfamily was also detected in HG VIII region 21 (qCP_S9/qIVD_S29/ qPL_S34).
Discussion
Linkage Map
We obtained a satisfactory representative linkage map for M. maximus, with a large genetic distance observed between the parents, namely, cv. Mombaça. (Figure 2, quadrant I) and S10 (Figure 2, quadrant IV). This genetic distance and the distribution of hybrids can be visualized in the PCA performed with the allele dosage information of all individuals (Figure 2). The crossing of contrasting parents makes it possible to check the recombination frequency between loci, which is a fundamental principle for observing the segregation of traits in hybrids and promoting the detection of QTLs (Luo et al., 2000).
Because M. maximus does not yet have a sequenced genome, we aligned our GBS reads to the allotetraploid genome of P. virgatum, which is a species closely phylogenetically related to M. maximus (Burke et al., 2016), since M. maximus previously belonged to the Panicum genus. This genetic proximity was confirmed based on the consistent distribution of the markers in the genetic map (Figure 3 and Supplementary Table 4). In addition, considering our tetraploid mapping population, the use of a tetraploid genome as reference might be more informative than the use of diploid genomes because there is a greater possibility of similar chromosomal rearrangements between these species (Daverdin et al., 2015). However, the possibility of using the genome of P. virgatum as reference does not preclude the need for a sequenced genome of M. maximus, mainly due to the possibility of identifying exclusive markers of the species, and our linkage map can contribute to the assembly of this reference genome.
After allele depth estimation, only 10% of markers were retained for the next analysis, in which we prioritized a minimum average allele depth of 60 reads to suppress the probable overestimation of allele bias due to our population size. Gerard et al. (2018) recommend that more than 25 reads be used to obtain a strong correlation of true genotypes under high levels of bias and overdispersion, emphasizing that read depth requirements should be based on how many individuals are included in the study. Of the genetic mapping studies involving tropical forage grasses, only one reported the use of SNP markers with allele dosage, and in the study, a minimum overall depth of 25 reads was considered in a biparental progeny of U. decumbens containing 217 F1 hybrids (Ferreira et al., 2019).
Updated statistical models and the recent genome sequencing technologies promoted advances in the knowledge of the genetics of polyploid organisms, as demonstrated by the comparison of our genetic map for M. maximus with the first map for this species published over ten years ago by Ebina et al. (2005). The first map contained 360 dominant markers obtained with amplified fragment length polymorphism (AFLP) and random amplified polymorphic DNA (RAPD) techniques that segregated at a 1:1 ratio and was obtained from an apomictic cultivar used for genetic breeding in Japan. These markers were distributed in 39 linkage groups, which is greater than the number expected for this species (2n = 4x = 32). In this context, the use of SNPs as codominant markers and their quantitative analysis allowed many gains in our map, such as coverage of many regions of quantitative traits important to breeders and the genetic effects that influence these traits, as well as alleles of the parents that were determinant of the characters of the hybrid.
In addition, the strategy of greater refinement of SNPs adopted after estimating allele dosage using two programs of mapping prevented overinflation among loci. We detected some markers with SD (Table 2), but we chose not to use them, aiming to increase the probability of obtaining an exact distance between markers in the HGs. Since genotyping errors are probable, a large amount of missing data and a large number of distorted loci may promote the expansion of linkage maps as well as overestimate the recombination fractions and limit the accuracy of the mapping (Cartwright et al., 2007; Gerard et al., 2018). However, SD is a phenomenon commonly found in the genome, and some linkage maps contain distorted markers, including those of grasses such as pearl millet (Sehgal et al., 2012) and napiergrass (Paudel et al., 2018). Therefore, greater knowledge of the occurrence and genetic causes of SD in plants is important for inferring which genes are kept together or separated by SD (Zhu et al., 2006; Anhalt et al., 2008). Thus, future studies might aggregate information on the structure of loci with SD in the genome of M. maximus.
Most linkage maps in grasses include only single-dose markers with segregation ratios of 1:1 and 3:1; thus, the heterozygous classes were grouped with one of the homozygous classes, resulting in a loss of information (Bourke et al., 2018b). The use of linkage maps with simplex SNPs for most linkage groups and a high density of higher-dosage markers provides greater confidence in the modeling of allelic effects of QTLs (Hackett et al., 2014). The markers present in our map were mostly simplex, while higher-dosage markers comprised approximately 28.4% of the map, as shown in Table 2. Similar values were also verified in the genetic map of U. decumbens (Ferreira et al., 2019), probably due to the complexity of scoring and analyzing these types of markers. Our map presented a greater number of alleles exclusive to the apomictic parent than sexual parent, as observed in the previous map of M. maximus (Ebina et al., 2005) and in the genetic maps of other forage grasses (Worthington et al., 2016; Ferreira et al., 2019). This difference is likely due to the origin of the genotypes: "Mombaça" and S10 have natural tetraploid genomes, but S10 was obtained from a sexual x apomictic cross of an original diploid sexual plant that was duplicated with colchicine.
Our linkage map was sufficient for the identification of an oligogenic trait with a genomic region responsible for 80% of the phenotypic variance and polygenic traits. Therefore, our map will also be useful for the detection of other important characteristics in M. maximus and can contribute to the assembly of the genome of this species, as well as to studies about the biology and evolution of other phylogenetically closely related tropical forage grasses, such as those in the Urochloa and Paspalum genera.
Double Reduction in Guinea Grass
We reported for the first time the occurrence of DR in M. maximus. Autotetraploids may undergo this type of segregation when in multivalent pairing, two pairs of chromatids pass to the same pole in anaphase I of meiosis (Haynes and Douches, 1993). In guinea grass, irregular chromosome segregation has already been verified in cytogenetic analysis in hybrids and parents from the breeding program of the Embrapa Beef Cattle (Pessim et al., 2010; Pessim et al., 2015). The distribution of the markers with DR between the dosage types was proportional to the number of SNPs with each configuration. DR has been extensively studied using SNPs with dosage data in autotetraploid linkage maps in potato (Hackett et al., 2017; Bourke et al., 2018a). Approximately 6% of markers in potato have DR (Bourke et al., 2015), corroborating our results (9.68%). Despite some studies suggesting that DR should be included in genetic map construction and in QTL analysis (Li et al., 2010), other studies verified that such markers exert only minor positive effects on the power and accuracy of mapping analysis using single-dose markers (Bourke et al., 2015) and higher-dose markers (Bourke et al., 2016). In addition, statistical models have been created to include DR in linkage mapping (Huang et al., 2019), but no software currently implements them.
The occurrence of DR in M. maximus has many implications for breeding programs, being that the effects of DR and how to handle them have been the targets of several studies (Luo et al., 2000; Xu et al., 2013; Layman and Busch, 2018). This type of segregation exposes alleles located in distal regions of the chromosomes to homozygosis and thus is effective in eliminating the lethal alleles in a population (Butruille and Boiteux, 2000). A low rate of DR is sufficient to considerably reduce the equilibrium frequency of a deleterious allele at one locus (Luo et al., 2006). As an alternative, DR could be used to accelerate the accumulation of favorable rare alleles through marker-assisted selection (MAS) (Bourke et al., 2015). In addition, it is possible to obtain genotypes with loci having a higher homozygosis rate for use in specific crosses (Bourke et al., 2015). In this context, more detailed molecular study could elucidate the influence of DR on the phenotypes of hybrids of our study species.
Apospory Mapping and the Search for Gene Similarity
A chi-square test (X² = 5.43, p ≥ 0.01) performed for qualitative analysis of the reproductive mode of the 106 hybrids followed the Mendelian inheritance model, corroborating the results obtained with progeny tests in guinea grass performed by Savidan (1980) and Savidan (1981), in which sexual x apomictic progenies exhibited a 1:1 ratio that could be explained by an Aaaa genotype for apomictic because the aposporous apomixis of M. maximus is dominant over sexuality. We also proved this finding through SNP markers. Other studies of grasses such as Pennisetum (Akiyama et al., 2011), Paspalum (Martínez et al., 2003) and Urochloa (Valle et al., 1994; Vigna et al., 2016) also verified this segregation for the reproductive mode. Evidence suggests that this locus is present in a conserved region of the plant genome; however, further molecular genomic studies on aposporous apomixis in forage grasses are needed because the recent studies have led to other hypotheses, such as a possible influence of epigenetics (Kumar, 2017). Interestingly, more advanced studies on apomixis in M. maximus genotypes from a germplasm bank of India reported the decoupling of apomixis into three components, namely, apospory, parthenogenesis and pseudogamous-endosperm. These components are three distinct genetic determinants that determine an individual as apomictic, and recombination might occur among these components, supporting the hypothesis that more major genes are involved in apomixis control (Kaushal et al., 2008; Kaushal et al., 2019). This decoupling in neo-apomictics might be the target of an adaptive mechanism to maintain variability through hybridization and could be beneficial to the breeding program (Kaushal et al., 2019).
The aposporous region in M. maximus was previously mapped (Ebina et al., 2005; Bluma-Marques et al., 2014), and similar to our results, no markers were in perfect linkage with the region. Nonetheless, we mapped markers at a shorter distance (0.8 cM) from the apo-locus (Figure 3). Genetic markers linked to apomixis have been sought in other tropical forage grasses (Vigna et al., 2016; Worthington et al., 2016; Worthington et al., 2019), aiming at the efficient and rapid identification of the reproductive mode of progenies. Once identified, such markers may be transferred among forage grasses, based on evidence of conservation of the ASGR. Thus, markers near the apospory region that were identified in our map may be validated and useful for the breeding program of this species.
In addition, we observed that the markers closer to the peak region of the apo-locus were in a genomic region of P. virgatum similar to a region of the genome of A. thaliana that contains the SERK1 gene. This gene is involved in the signaling pathway active during zygotic and somatic embryogenesis in A. thaliana, and its overexpression increases the efficiency of somatic embryogenesis initiation (Hecht et al., 2001). In nucellar cells of apomictic genotypes of Poa pratensis, the SERK gene is involved in embryo sac development (Albertini et al., 2005). Recently, SERK was reported in Brachypodium distachyon grass as having a domain conserved among monocots and plays a prominent role in apomixis (Oliveira et al., 2017). Scarce studies have investigated the genes involved in the regulation of reproductive events in guinea grass, and these previous studies mainly utilized of transcriptome data (Toledo-Silva et al., 2013; Radhakrishna et al., 2018).
QTLs for Agronomic and Nutritional Traits
A QTL mapping approach is required for the characterization of the genetic architecture of traits. In our study, QTL analysis of autotetraploid progeny was performed using interval mapping (IM) of markers with allele dosage. This same methodology was successfully applied in QTL mapping in signalgrass, another important forage grass (Ferreira et al., 2019). The multiple interval mapping (MIM) method was recently implemented in polyploids and is a new alternative for other mapping studies using data with allele dosage information (Pereira et al., 2019). The mapping method used here considered only the peak with the largest effect as a QTL, but it is worth mentioning that peaks were present near the peak QTL for all agronomic traits (Supplementary Figure 2).
QTLs associated with important agronomic traits were mapped in HGs I, III, VII and VIII, with the phenotypic variation explained ranging from 4.3% to 10.4% (Table 4). Because M. maximus is undergoing a domestication process, the crop can still be greatly improved by the selection of large-effect QTLs. Therefore, QTL qRC9, located at 75 cM in HG II, which explained 10.3% of the phenotypic variation in RC (Supplementary Figure 2, HG_2(B)) and had a predominant additive effect of the female progenitor S10, may be a candidate for the marker-assisted selection program of guinea grass.
We found more than one QTL for TDM, LDM, and RC, again supporting the hypothesis of complex genetic control. Conversely, we found only one QTL for PLB in both parents. TDM and LDM showed high broad-sense heritability (<0.5), followed by RC (0.3) and PLB (0.1), as shown in Table 1. Higher heritability values (<0.85) for LDM and RC and a value for PLB above 0.4 were recently reported in M. maximus (Lara et al., 2019), using the generalized heritability formula (Cullis et al., 2006). For this species, a greater amount (g/plant) of TDM and LDM in the progenies has been associated with considerable heritability from the most productive parents (Braz et al., 2013; Braz et al., 2017). Matias et al. (2019) also verified the same pattern in interspecific hybrids from Urochloa spp., another genus adapted to tropical conditions. The intermediate heritability of RC and the QTLs associated with this trait that were detected in both parents resulted in hybrids with a good capacity for regrowth. This trait is also considered fundamental in forage grasses because it is directly related to the persistence of the forage after defoliation (Jank et al., 2011).
The negative correlation between PLB and SDM was expected (Figure 1), and Braz et al. (2017) verified the higher PLB values in the experiment of this progeny. PLB is related to plant structure, and plants with a high percentage of leaves are desirable because this trait is related to higher forage quality. A higher PLB was observed in the male parent, cv. Mombaça, which is often used as a check in experiments. Since its release in the 1990s, along with cv. Tanzania, cv. Mombaça has promoted pasture intensification in the country due to its very high productivity and forage quality (Jank et al., 2014). Progenies whose female parent is S10 generally also present good yield (Resende et al., 2004). Breeding programs target these traits in search of superior genotypes with greater foliar mass and a higher percentage of leaves due to the higher digestibility of leaves than of stems for animals. Thus, forage breeding is not restricted to the obtaining of more productive plants; it also contributes to greater efficiency in their transformation into animal production (Valle et al., 2009).
Significant and positive correlations among the traits GM, TDM, SDM, LDM, and RC corroborated the positions of QTLs associated with agronomic traits in the linkage map (Figures 1 and 3). The traits GM and LDM exhibited high heritability (Table 1) and strong positive correlation (Figure 1), which suggests that genetic improvements in these traits could be achieved by selective phenotyping for only one of these traits, without the need to do separation of plant part. We detected qTDM3 and qRC9 in a common region in HG II; qGM1, qTDM4, qLDM5, and qSDM7 in the same region in HG V; and qGM2, qLDM6, and qRC10 in part of a common region in HG VI. Each region containing several QTLs for different traits suggests the occurrence of four QTL hotspots. Interestingly, QTLs for PLB were not detected in any region with other agronomic traits, and a negative correlation has also been observed; however, a positive correlation with NDF was verified, and such a QTL was detected in a similar region with qNDF_L13 and qNDF_S18 in HG IV (Figure 3), suggesting a fifth QTL hotspot.
Clustering of QTLs for genetically correlated traits in the same or adjacent regions of HGs in several organisms may be due to physical linkage, pleiotropy or natural selection for coadapted traits (Studer and Doebley, 2011; Wu et al., 2015). We have taken the first step in the identification of loci that lead to these trait correlations and the degree to which these patterns affect productivity in M. maximus. QTLs colocated in the same region of HGs for agronomic traits have also been identified in some grasses (Fang et al., 2016; Sartie et al., 2018).
All HGs contained QTLs related to nutritional traits, with those related to the leaf and stem being found mainly in HG III and HG VIII, respectively. Again, some traits had more than one peak that could not be considered due to the methodology adopted (Supplementary Figures 3, 4). The phenotypic variance explained by these QTLs ranged between 2.5% (qADF_L22) and 12.1% (qNDF_L11 and qNDF_S16). Interestingly, both parents contributed alleles for most of the identified QTLs, providing evidence that the genotypes have high nutritional quality.
The selection of a superior genotype of perennial tropical forages is based on the analysis of traits through repeated measures over a number of harvests, seasons, and years (Fernandes et al., 2017). The nutritional QTLs found in our study need further investigation because only one harvest was analyzed and interactions could not be measured. In a selection study of U. decumbens and U. humidicola, Figueiredo et al. (2019) identified a significant Genotype x Harvest Interaction (GHI) effect (p<0.05) for different agronomic and nutritional traits, which reflect differences in the relative performances of genotypes across harvests. GHI also has been reported as significant in M. maximus, and the average number of harvests needed for a reliable selection of nutritional traits, such as OM and CP, would be 3 and 5 at accuracy levels of 0.80 and 0.85, respectively (Fernandes et al., 2017). Thus, GHI directly affects the selection of the genotypes and further studies with more harvests are needed to consolidate our results about putative QTLs to nutritional traits.
The heritability of the nutritional traits varied from low (0.06), obtained for SIL_S, to moderate (0.32), obtained for OM_L. This result also reinforces the necessity of more harvests for the efficient selection of superior genotypes for nutritional traits (Fernandes et al., 2017). Traits IVD_L and IVD_S presented the same standard as the crude protein, with the H² of the stem being higher than that of the leaf (Table 1). Historically, cv. Mombaça has stood out due to its high productivity, but with slightly lower values for forage quality when compared to ‘Tanzania', and in biparental crosses, the hybrids obtained from “Mombaça” also presented these features (Braz et al., 2017). This finding was corroborated by the heritability verified above in our study of agronomic and nutritional traits.
The nutritional quality of forage grasses is important in several aspects and is directly related to the production of meat and milk. M. maximus shows a high value of CP compared to other tropical forages. However, the values for lignin and fiber are expected to be low because lignin hampers the enzymatic hydrolysis of cellulose and hemicellulose and, thus, the digestion of the cell wall of the leaf tissue and the stem (Jung and Allen, 1995). The relationship between the biomasses of leaves and stems is important due to its effects on nutritional value and voluntary consumption by animals. The NDF is associated with fibrous fractions and with voluntary consumption. The fractions that are not digested by the animal take up space in the digestive tract, impairing the digestion and consumption of dry matter (Euclides et al., 1999).
NDF_L and NDF_S showed a strong positive correlation, and their respective QTLs were in the same regions in the HGs. In the linkage map, qCEL_L30 and qADF_L20 QTLs were in the same region, and qCEL_S31 and qADF_S26 were both located in HG VIII and were significantly correlated (Figure 1). The traits CP and IVD showed a weak positive correlation, but the qCP_S8 and qIVD_S28 QTLs were present in the same region of HG V, and qCP_S9 and qIVD_S29 were identified in the same region of HG VIII. Interestingly, qPL_S34 was verified in HG VIII in the same region as CP and IVD QTLs, and qADF_L21 shared a similar region with qCP_L7 in HG V. In addition, qCP_L7 extended to QTLs related to agronomic traits (qGM1, qTDM4, qLDM5 and qSDM7). A total of 8 probable QTL hotspots have been identified, supporting the need for further studies in search of a specific gene controlling all these traits or several genes acting together.
Notably, in the progenies of M. maximus from lower-yielding parents, the nutritional value is generally higher. With the identified QTLs, more in-depth studies of this correlation will be possible. In addition, QTLs related to forage quality have not been found in other important tropical species, such as Urochloa spp. Therefore, our results can contribute to the search for important genomic regions in other forage species.
Search for Similarity in QTL Regions
The search for putative candidate genes was based on all 23 QTL regions. Generally, the same gene families from A. thaliana, O. sativa, and P. virgatum were identified for a common QTL region. These genes are also found in the literature and are described in Table 6 and Supplementary Table 5.
Exploration of genes involved in plant growth and development, especially those related to hormone regulation, is crucial in forage grass breeding programs. Interestingly, the gibberellin family (GAS) was identified in HG III region 9 (qPL_L33), whose QTL is related to lignin, a complex phenolic polymer deposited in the secondary cell wall of all vascular plants (Zhao, 2016). The interrelations between cell wall components cause cellulose and lignin to be codependent, a normal cellulose deposition pattern may be necessary for lignin assembly, and alterations of lignin content may lead to changes in the cell orientation of cellulose fibrils and, consequently, in digestibility (Anderson et al., 2015; Liu et al., 2016). GAs promote biochemical, physiological and anatomical plant changes (Hedden and Thomas, 2016). The induction of cellulose synthesis by GAs promotes the release of secondary regulators of cell wall proteins and, consequently, can boost lignin deposition and increase lignin content (Zhao, 2016). GAS at increased light levels have been shown to promote cell wall thickness and increase lignin deposition in xylem fibers (Falcioni et al., 2018).
Other important genes identified are associated with pectinesterase/pectin methylesterase and were present in HG V—region 14 (qGM1/qTDM4/qLDM5/qSDM7/qADF_L21/qCP_L7) and HG VIII—region 23 (qSIL_S37), which also contained agronomic QTLs. Pectinesterase is responsible for the hydrolyzation of pectin, the major component of cell walls (Pelloux et al., 2007). In addition, this enzyme is involved in developmental processes such as stem elongation in A. thaliana (Damm et al., 2016) and in B. distachyon grass (Feng et al., 2015). However, more in-depth research should be performed to ensure an understanding of the signaling pathways of these genes and make this understanding applicable to tropical forage breeding programs.
In conclusion, the present study produced a high-resolution linkage map with allele dosage information obtained from a full-sib progeny of M. maximus with high genetic variability. Even without the availability of a sequenced genome for this species, the approach adopted for the construction of our map was sufficient to detect many QTLs associated with agronomic and nutritional traits that are important for forage breeding. Our genetic map also allowed us to map the apo-locus to a single linkage group and provided a more up-to-date study of the mode of reproduction of M. maximus. The knowledge about the genetics of these traits that we obtained is the first step in discovering genes involved in relevant biological processes as well as understanding the genetic architecture of relevant traits in this species.
Data Availability Statement
The datasets generated for this study can be found in the NCBI/PRJNA563938.
Author Contributions
AG, LJ, and AS conceived and designed the experiments. MS and LJ conducted the field experiments. TD, RF, AM, AP, and FO performed the laboratory experiments. TD, RF, LL, AM, AA-P, and FO analyzed the data. TD, RF, and LL wrote the manuscript. All authors read and approved the manuscript.
Funding
This work was supported by grants from the Fundação de Amparo à Pesquisa do Estado de São Paulo (FAPESP 2008/52197-4), the Conselho Nacional de Desenvolvimento Científico e Tecnológico (CNPQ), the Coordenação de Aperfeiçoamento de Pessoal de Nível Superior (CAPES—Computational Biology Program), Embrapa and UNIPASTO. TD received PhD fellowships from the CAPES Computational Biology Program and an MSc fellowship from FAPESP (2017/17969-5) and the CAPES Computational Biology Program. RF, FO, and AP received postdoctoral fellowships from FAPESP (2018/19219-6, 2018/18527-9 and 2018/00036-9, respectively). LL received a postdoctoral fellowship from the CAPES Computational Biology Program. AG and AS were recipients of a Research Fellowship, and LJ was recipient of a Technological Development scholarship, all received from the Conselho Nacional de Desenvolvimento Científico e Tecnológico (CNPq).
Conflict of Interest
The authors declare that the research was conducted in the absence of any commercial or financial relationships that could be construed as a potential conflict of interest.
Acknowledgments
We acknowledge the members of the Brazilian Agricultural Research Corporation (Embrapa Beef Cattle) for making the progeny of this study available and for carrying out all phenotypic evaluations. This manuscript was previously posted to bioRxiv (https://www.biorxiv.org/content/10.1101/801399v1).
Supplementary Material
The Supplementary Material for this article can be found online at: https://www.frontiersin.org/articles/10.3389/fpls.2020.00015/full#supplementary-material
Figure S1 | Identification of the apospory region position (cM) in HG II from guinea grass mapping population. Dotted line indicate the LOD thresholds of 90% and 95% obtained after the permutation tests.
Figure S2 | Interval mapping (IM) for agronomic traits from the guinea grass (Megathyrsus maximus) population in HGs II, IV, V and VI. Agronomic traits: green matter (GM), total dry matter (TDM), leaf dry matter (LDM), stem dry matter (SDM), regrowth capacity (RC) and percentage of leaf blade (PLB). Dotted lines indicate the LOD thresholds of 90% and 95% obtained after the permutation tests.
Figure S3 | Interval mapping (IM) for forage quality from the guinea grass (Megathyrsus maximus) population in HGs I to IV. Nutritional quality traits for the leaf (L) and/or stem (S): organic matter (OM_S), crude protein (CP_L), in vitro digestibility of organic matter (IVD_L), neutral detergent fiber (NDF_L and NDF_S), acid detergent fiber (ADF_L), cellulose (CEL_L), silica (SIL_L), and permanganate lignin (PL_L). Dotted lines indicate the LOD thresholds of 90% and 95% obtained after the permutation tests.
Figure S4 | Interval mapping (IM) for forage quality from the guinea grass (Megathyrsus maximus) population in HGs V to VIII. Nutritional quality traits for the leaf (L) and/or stem (S): organic matter (OM_L and OM_S), crude (CP_L and CP_S), in vitro digestibility of organic matter (IVD_S), neutral detergent fiber (NDF_L and NDF_S), acid detergent fiber (ADF_L and ADF_S), cellulose (CEL_S), silica (SIL_L and SIL_S), and permanganate lignin (PL_S). Dotted lines indicate the LOD thresholds of 90% and 95% obtained after the permutation tests.
References
ABIEC-Associação Brasileira das Indústrias Exportadoras de Carne (2019). Beef Report Perfil da pecuária no Brasil [Online]. Available at: http://www.abiec.com.br/controle/uploads/arquivos/sumario2019portugues.pdf. (Acessed May 30, 2019).
Aguilera-Alvarado, G. P., Sánchez-Nieto, S. (2017). Plant hexokinases are multifaceted proteins. Plant Cell Physiol. 58 (7), 1151–1160. doi: 10.1093/pcp/pcx062
Akaike, H. (1974). A new look at the statistical model identification. IEEE Trans. Autom. Control 19, 716–723. doi: 10.1109/TAC.1974.1100705
Akiyama, Y., Goel, S., Conner, J. A., Hanna, W. W., Yamada-Akiyama, H., Ozias-Akins, P. (2011). Evolution of the apomixis transmitting chromosome in Pennisetum. BMC Evolut. Biol. 11, 289. doi: 10.1186/1471-2148-11-289
Albertini, E., Marconi, G., Reale, L., Barcaccia, G., Porceddu, A., Ferranti, F., et al. (2005). SERK and APOSTART. Candidate Genes Apomixis In Poa pratensis. Plant Physiol. 138 (4), 2185–2199. doi: 10.1104/pp.105.062059
Albrecht, C., Russinova, E., Kemmerling, B., Kwaaitaal, M., de Vries, S. C. (2008). Arabidopsis SOMATIC EMBRYOGENESIS RECEPTOR KINASE proteins serve brassinosteroid-dependent and-independent signaling pathways. Plant Physiol. 148 (1), 611–619. doi: 10.1104/pp.108.123216
Anderson, N. A., Tobimatsu, Y., Ciesielski, P. N., Ximenes, E., Ralph, J., et al. (2015). Manipulation of guaiacyl and syringyl monomer biosynthesis in an Arabidopsis cinnamyl alcohol dehydrogenase mutant results in atypical lignin biosynthesis and modified cell wall structure. Plant Cell. 27 (8), 2195–2209. doi: 10.1105/tpc.15.00373
Anhalt, U. C. M., Heslop-Harrison, P., Byrne, S., Guillard, A., Barth, S. (2008). Segregation distortion in Lolium: evidence for genetic effects. Theor. Appl. Genet. 117, 297–306. doi: 10.1007/s00122-008-0774-7
Bannenberg, G., Martínez, M., Hamberg, M., Castresana, C. (2009). Diversity of the enzymatic activity in the lipoxygenase gene family of Arabidopsis thaliana. Lipids 44 (2), 85. doi: 10.1007/s11745-008-3245-7
Bluma-Marques, A. C., Chiari, L., Agnes, D. C., Jank, L., Pagliarini, M. S. (2014). Molecular markers linked to apomixis in Panicum maximum Jacq. Afr. J. Biotechnol. 13, 2198–2202. doi: 10.5897/AJB2014.13703
Bourke, P. M., Voorrips, R. E., Visser, R. G. F., Maliepaard, C. (2015). The double-reduction landscape in tetraploid potato as revealed by a high-density linkage map. Genetics 201, 853–863. doi: 10.1534/genetics.115.181008
Bourke, P. M., Voorrips, R. E., Kranenburg, T., Jansen, J., Visser, R. G., Maliepaard, C. (2016). Integrating haplotype-specific linkage maps in tetraploid species using SNP markers. Theor. Appl. Genet. 129, 2211–2226. doi: 10.1007/s00122-016-2768-1
Bourke, P. M., van Geest, G., Voorrips, R. E., Jansen, J., Kranenburg, T., Shahin, A., et al. (2018a). polymapR-linkage analysis and genetic map construction from F1 populations of outcrossing polyploids. Bioinformatics 34, 3496–3502. doi: 10.1093/bioinformatics/bty371
Bourke, P. M., Voorrips, R. E., Visser, R. G. F., Maliepaard, C. (2018b). Tools for genetic studies in experimental populations of polyploids. Front. Plant Sci. 9, 1–17. doi: 10.3389/fpls.2018.00513
Bourke, P. M., Hackett, C. A., Voorrips, R. E., Visser, R. G. F., Maliepaard, C. (2019). Quantifying the power and precision of QTL analysis in autopolyploids under bivalent and multivalent genetic models. G3 (Bethesda) 9, 2107–2122. doi: 10.1534/g3.119.400269
Box, G. E. P., Cox, D. R. (1964). An analysis of transformations. J. R. Stat. Soc Ser. B. (Methodol.) 26, 211–252. doi: 10.1111/j.2517-6161.1964.tb00553.x
Bradshaw, J. E. (2007). The canon of potato science: 4. Tetrasomic inheritance. Potato Res. 50, 219–222. doi: 10.1007/s11540-008-9041-1
Braz, T. G. D. S., Fonseca, D. M. D., Jank, L., Resende, M. D. V. D., Martuscello, J. A., Simeão, R. M. (2013). Genetic parameters of agronomic characters in Panicum maximum hybrids. Rev. Bras. Zootec. 42 (4), 231–237. doi: 10.1590/S1516-35982013000400001
Braz, T. G. d. S., Martuscello, J. A., Jank, L., Fonseca, D. M. D., Resende, M. D. V., et al. (2017). Genotypic value in hybrid progenies of Panicum maximum Jacq. Ciênc. Rural 47, e20160599. doi: 10.1590/0103-8478cr20160599
Burke, S. V., Wysocki, W. P., Zuloaga, F. O., Craine, J. M., Pires, J. C., Edger, P. P., et al. (2016). Evolutionary relationships in Panicoid grasses based on plastome phylogenomics (Panicoideae; Poaceae). BMC Plant Biol. 16 (1), 140. doi: 10.1186/s12870-016-0823-3
Butler, D. G., Cullis, B. R., Gilmour, A. R., Gogel, B. J. (2009). ASREML-R Reference Manual. Release 3.0. (Australia: Queensland Department of Primary Industries).
Butruille, D. V., Boiteux, L. S. (2000). Selection-mutation balance in polysomic tetraploids: impact of double reduction and gametophytic selection on the frequency and subchromosomal localization of deleterious mutations. Proc. Natl. Acad. Sci. U.S.A. 97, 6608–6613. doi: 10.1073/pnas.100101097
Cartwright, D. A., Troggio, M., Velasco, R., Gutin, A. (2007). Genetic mapping in the presence of genotyping errors. Genetics 176, 2521–2527. doi: 10.1534/genetics.106.063982
Chen, L., Guan, L., Kojima, A., Adachi, T. (2000). The mechanisms of appearance of aposporous initial cell and apomictic embryo sac formation in Paspalum notatum. Cytologia 65, 333–341. doi: 10.1508/cytologia.65.333
Chrost, B., Kolukisaoglu, U., Schulz, B., Krupinska, K. (2007). An α-galactosidase with an essential function during leaf development. Planta 225 (2), 311–320. doi: 10.1007/s00425-006-0350-9
Conner, J. A., Goel, S., Gunawan, G., Cordonnier-Pratt, M.-M., Johnson, V. E., Liang, C., et al. (2008). Sequence analysis of bacterial artificial chromosome clones from the apospory-specific genomic region of Pennisetum and Cenchrus. Plant Physiol. 147, 1396–1411. doi: 10.1104/pp.108.119081
Corratgé-Faillie, C., Lacombe, B. (2017). Substrate (un) specificity of Arabidopsis NRT1/PTR FAMILY (NPF) proteins. J. Exp. Bot. 68 (12), 3107–3113. doi: 10.1093/jxb/erw499
Cullis, B. R., Smith, A. B., Coombes, N. E. (2006). On the design of early generation variety trials with correlated data. J. Agric. Biol. Environ. Stat 11 (4), 381. doi: 10.1198/108571106X154443
Damm, T., Commandeur, U., Fischer, R., Usadel, B., Klose, H. (2016). Improving the utilization of lignocellulosic biomass by polysaccharide modification. Process Biochem. 51 (2), 288–296. doi: 10.1016/j.procbio.2015.12.003
Daverdin, G., Bahri, B. A., Wu, X., Serba, D. D., Tobias, C., Saha, M. C., et al. (2015). Comparative relationships and chromosome evolution in switchgrass (Panicum virgatum) and its genomic model, foxtail millet (Setaria italica). BioEnerg. Res. 8, 137–151. doi: 10.1007/s12155-014-9508-7
Davin, L. B., Lewis, N. G. (2003). An historical perspective on lignan biosynthesis: monolignol, allylphenol and hydroxycinnamic acid coupling and downstream metabolism. Phytochem. Rev. 2 (3), 257. doi: 10.1023/B:PHYT.0000046175.83729.b5
Day, I. S., Reddy, V. S., Ali, G. S., Reddy, A. S. N. (2002). Analysis of EF-hand-containing proteins in Arabidopsis. Genome Biol. 3 (10), research0056–1. doi: 10.1186/gb-2002-3-10-research0056
Dettmer, J., Schubert, D., Calvo-Weimar, O., Stierhof, Y. D., Schmidt, R., Schumacher, K. (2005). Essential role of the V-ATPase in male gametophyte development. Plant J. 41 (1), 117–124. doi: 10.1111/j.1365-313X.2004.02282.x
Dimkpa, S. O., Lahari, Z., Shrestha, R., Douglas, A., Gheysen, G., Price, A. H. (2015). A genome-wide association study of a global rice panel reveals resistance in Oryza sativa to root-knot nematodes. J. Exp. Bot. 67 (4), 1191–1200. doi: 10.1093/jxb/erv470
Ding, W., Lin, L., Zhang, B., Xiang, X., Wu, J., Pan, Z., et al. (2015). OsKASI, a β-ketoacyl-[acyl carrier protein] synthase I, is involved in root development in rice (Oryza sativa L.). Planta 242 (1), 203–213. doi: 10.1007/s00425-015-2296-2
Doerge, R. W. (2002). Mapping and analysis of quantitative trait loci in experimental populations. Nat. Rev. Genet. 3, 43–52. doi: 10.1038/nrg703
Doyle, J. J., Doyle, J. L. (1987). A rapid DNA isolation procedure for small quantities of fresh leaf tissue. Phytochem. Bull. 19, 11–5.
Ebina, M., Nakagawa, H., Yamamoto, T., Araya, H., Tsuruta, , S. i., Takahara, M., et al. (2005). Co-segregation of AFLP and RAPD markers to apospory in guinea grass (Panicum maximum Jacq.). Grassl. Sci. 51, 71–78. doi: 10.1111/j.1744-697X.2005.00011.x
Epskamp, S., Cramer, A. O. J., Waldorp, L. J., Schmittmann, V. D., Borsboom, D. (2012). qgraph: network visualizations of relationships in psychometric data. J. Stat. Softw. 48, 1–18. doi: 10.18637/jss.v048.i04
Euclides, V. P. B., Thiago, L. R. L. d. S., Macedo, M. C. M., Oliveira, M. P. (1999). dConsumo voluntário de forragem de três cultivares de Panicum maximum sob pastejo. Rev. Bras. Zootec. 28, 1177–1185. doi: 10.1590/S1516-35981999000600002
Eulgem, T., Rushton, P. J., Robatzek, S., Somssich, I. E. (2000). The WRKY superfamily of plant transcription factors. Trends In Plant Sci. 5 (5), 199–206. doi: 10.1016/S1360-1385(00)01600-9
Falcioni, R., Moriwaki, T., Oliveira, D. M. D., Andreotti, G. C., Souza, L. A., et al. (2018). Increased gibberellins and light levels promotes cell wall thickness and enhance lignin deposition in xylem fibers. Front. Plant Sci. 9, 1391. doi: 10.3389/fpls.2018.01391
Fang, X., Dong, K., Wang, X., Liu, T., He, J., Ren, R., et al. (2016). A high density genetic map and QTL for agronomic and yield traits in Foxtail millet [Setaria italica (L.) P. Beauv.]. BMC Genomics 17 (1), 336. doi: 10.1186/s12864-016-2628-z
Feng, H., Chen, Q., Feng, J., Zhang, J., Yang, X., Zuo, J. (2007). Functional characterization of the Arabidopsis eukaryotic translation initiation factor 5A-2 that plays a crucial role in plant growth and development by regulating cell division, cell growth, and cell death. Plant Physiol. 144 (3), 1531–1545. doi: 10.1104/pp.107.098079
Feng, Y., Yin, Y., Fei, S. (2015). Down-regulation of BdBRI1, a putative brassinosteroid receptor gene produces a dwarf phenotype with enhanced drought tolerance in Brachypodium distachyon. Plant Sci. 234, 163–173. doi: 10.1016/j.plantsci.2015.02.015
Fernandes, F. D., Braga, G. J., Ramos, A. K. B., Jank, L., Carvalho, M. A., Maciel, G. A., et al. (2017). Repeatability, number of harvests, and phenotypic stability of dry matter yield and quality traits of Panicum maximum jacq. Acta Sci. Anim. Sci. 39 (2), 149–155. doi: 10.4025/actascianimsci.v39i2.32915
Ferreira, R. C. U., Lara, L. A. d. C., Chiari, L., Barrios, S. C. L., do Valle, C. B., Valério, J. R., et al. (2019). Genetic mapping with allele dosage information in tetraploid Urochloa decumbens (Stapf) R. D. Webster reveals insights into spittlebug (Notozulia entreriana Berg) resistance. Front. Plant Sci. 10, 1–16. doi: 10.3389/fpls.2019.00092
Field, D. L., Broadhurst, L. M., Elliott, C. P., Young, A. G. (2017). Population assignment in autopolyploids. Heredity 119, 389–401. doi: 10.1038/hdy.2017.51
Figueiredo, U. J., de., Berchembrock, Y. V., Valle, C. B., do, Barrios, S. C. L., Quesenberry, K. H., Muñoz, P. R., et al. (2019). Evaluating early selection in perennial tropical forages. Crop Breed. Appl. Biotechnol. 19 (3), 291–299. doi: 10.1590/1984-70332019v19n3a41
Flint-Garcia, S. A., Thornsberry, J. M., Buckler, E. S. (2003). Structure of linkage disequilibriumin plants. Annu. Rev. Plant Biol. 54, 357–374. doi: 10.1146/annurev.arplant.54.031902.134907
Friml, J., Wiśniewska, J., Benková, E., Mendgen, K., Palme, K. (2002). Lateral relocation of auxin efflux regulator PIN3 mediates tropism in Arabidopsis. Nature 415 (6873), 806. doi: 10.1038/415806a
Geisler, M., Murphy, A. S. (2006). The ABC of auxin transport: the role of p-glycoproteins in plant development. FEBS Lett. 580 (4), 1094–1102. doi: 10.1016/j.febslet.2005.11.054
Gerard, D., Ferrão, L. F. V., Garcia, A. A. F., Stephens, M. (2018). Genotyping polyploids from messy sequencing data. Genetics 210, 789–807. doi: 10.1534/genetics.118.301468
Glaubitz, J. C., Casstevens, T. M., Lu, F., Harriman, J., Elshire, R. J., Sun, Q., et al. (2014). TASSEL-GBS: a high capacity genotyping by sequencing analysis pipeline. PloS One 9, e90346. doi: 10.1371/journal.pone.0090346
Goodstein, D. M., Shu, S., Howson, R., Neupane, R., Hayes, R. D., Fazo, J., et al. (2012). Phytozome: a comparative platform for green plant genomics. Nucleic Acids Res. 40, D1178–D1186. doi: 10.1093/nar/gkr944
Gualtieri, G., Conner, J. A., Morishige, D. T., Moore, L. D., Mullet, J. E., Ozias-Akins, P. (2006). A segment of the apospory-specific genomic region is highly microsyntenic not only between the apomicts Pennisetum squamulatum and buffelgrass, but also with a rice chromosome 11 centromeric-proximal genomic region. Plant Physiol. 140, 963–971. doi: 10.1104/pp.105.073809
Hála, M., Cole, R., Synek, L., Drdová, E., Pečenková, T., Nordheim, A., et al. (2008). An exocyst complex functions in plant cell growth in Arabidopsis and tobacco. Plant Cell. 20 (5), 1330–1345. doi: 10.1105/tpc.108.059105
Höhner, R., Aboukila, A., Kunz, H. H., Venema, K. (2016). Proton gradients and proton-dependent transport processes in the chloroplast. Front. Plant Sci. 7, 218. doi: 10.3389/fpls.2016.00218
Hackett, C. A., Bradshaw, J. E., Bryan, G. J. (2014). QTL mapping in autotetraploids using SNP dosage information. Theor. Appl. Genet. 127, 1885–1904. doi: 10.1007/s00122-014-2347-2
Hackett, C. A., Boskamp, B., Vogogias, A., Preedy, K. F., Milne, I. (2017). TetraploidSNPMap: software for linkage analysis and QTL mapping in autotetraploid populations using SNP dosage data. J. Hered. 108, 438–442. doi: 10.1093/jhered/esx022
Haldane, J. B. S. (1930). Theoretical genetics of autopolyploids. J. Genet. 22, 359–372. doi: 10.1007/BF02984197
Hansen, S. F., Harholt, J., Oikawa, A., Scheller, H. V. (2012). Plant glycosyltransferases beyond CAZy: a perspective on DUF families. Front. Plant Sci. 3, 59. doi: 10.3389/fpls.2012.00059
Haynes, K. G., Douches, D. S. (1993). Estimation of the coefficient of double reduction in the cultivated tetraploid potato. Theor. Appl. Genet. 85, 857–862. doi: 10.1007/BF00225029
Hecht, V., Vielle-Calzada, J. P., Hartog, M. V., Schmidt, E. D., Boutilier, K., Grossniklaus, U., et al. (2001). The Arabidopsis SOMATIC EMBRYOGENESIS RECEPTOR KINASE 1 gene is expressed in developing ovules and embryos and enhances embryogenic competence in culture. Plant Physiol. 127 (3), 803–816. doi: 10.1104/pp.010324
Hedden, P., Thomas, S. G. (2016). “Annual Plant Review,” in: The Gibberellins, 1st Edn, Vol. 49 (New York, NY: Wiley Blackwell). doi: 10.1002/9781119210436
Hemsley, P. A., Kemp, A. C., Grierson, C. S. (2005). The TIP GROWTH DEFECTIVE1 S-acyl transferase regulates plant cell growth in Arabidopsis. Plant Cell. 17 (9), 2554–2563. doi: 10.1105/tpc.105.031237
Huang, K., Wang, T., Dunn, D. W., Zhang, P., Cao, X., Liu, R., et al. (2019). Genotypic frequencies at equilibrium for polysomic inheritance under double-reduction. G3 (Bethesda) 9, 1693–1706. doi: 10.1534/g3.119.400132
ITC - International Trade Centre (2018). Trade map - List of exporters for the Seeds of forage plants for sowing. [Online]. Available at: https://www.trademap.org/Country_SelProduct_TS.aspx. (Acessed June 27, 2019).
Jank, L., Valle, C. B., Resende, R. M. S. (2011). Breeding tropical forages. Crop Breed. Appl. Biotechnol. 11, 27–34. doi: 10.1590/S1984-70332011000500005
Jank, L., Barrios, S. C., do Valle, C. B., Simeão, R. M., Alves, G. F. (2014). The value of improved pastures to Brazilian beef production. Crop Pasture Sci. 65 (11), 1132–1137. doi: 10.1071/CP13319
Julier, B., Flajoulot, S., Barre, P., Cardinet, G., Santoni, S., Huguet, T., et al. (2003). Construction of two genetic linkage maps in cultivated tetraploid alfalfa (Medicago sativa) using microsatellite and AFLP markers. BMC Plant Biol. 3, 9. doi: 10.1186/1471-2229-3-9
Jung, H. G., Allen, M. S. (1995). Characteristics of plant cell walls affecting intake and digestibility of forages by ruminants. J. Anim. Sci. 73, 2774–2790. doi: 10.2527/1995.7392774x
Köksal, M., Hu, H., Coates, R. M., Peters, R. J., Christianson, D. W. (2011). Structure and mechanism of the diterpene cyclase ent-copalyl diphosphate synthase. Nat. Chem. Biol. 7 (7), 431. doi: 10.1038/nchembio.578
Kachroo, A., Shanklin, J., Whittle, E., Lapchyk, L., Hildebrand, D., Kachroo, P. (2007). The Arabidopsis stearoyl-acyl carrier protein-desaturase family and the contribution of leaf isoforms to oleic acid synthesis. Plant Mol. Biol. 63 (2), 257–271. doi: 10.1007/s11103-006-9086-y
Kaushal, P., Malaviya, D. R., Roy, A. K., Pathak, S., Agrawal, A., Khare, A., et al. (2008). Reproductive pathways of seed development in apomictic guinea grass (Panicum maximum Jacq.) reveal uncoupling of apomixis components. Euphytica 164, 81–92. doi: 10.1007/s10681-008-9650-4
Kaushal, P., Dwivedi, K. K., Radhakrishna, A., Srivastava, M. K., Kumar, V., Roy, A. K., et al. (2019). Partitioning apomixis components to understand and utilize gametophytic apomixis. Front. Plant Sci. 10, 256. doi: 10.3389/fpls.2019.00256
Kirioukhova, O., Johnston, A. J., Kleen, D., Kägi, C., Baskar, R., Moore, J. M., et al. (2011). Female gametophytic cell specification and seed development require the function of the putative Arabidopsis INCENP ortholog WYRD. Development 138 (16), 3409–3420. doi: 10.1242/dev.060384
Knopf, R. R., Feder, A., Mayer, K., Lin, A., Rozenberg, M., Schaller, A., et al. (2012). Rhomboid proteins in the chloroplast envelope affect the level of allene oxide synthase in Arabidopsis thaliana. Plant J. 72 (4), 559–571. doi: 10.1111/j.1365-313X.2012.05090.x
Ko, J. H., Yang, S. H., Han, K. H. (2006). Upregulation of an Arabidopsis RING-H2 gene, XERICO, confers drought tolerance through increased abscisic acid biosynthesis. Plant J. 47 (3), 343–355. doi: 10.1111/j.1365-313X.2006.02782.x
Kohorn, B. D., Kohorn, S. L. (2012). The cell wall-associated kinases, WAKs, as pectin receptors. Front. Plant Sci. 3, 88. doi: 10.3389/fpls.2012.00088
Kourelis, J., van der Hoorn, R. A. (2018). Defended to the nines: 25 years of resistance gene cloning identifies nine mechanisms for R protein function. Plant Cell. 30 (2), 285–299. doi: 10.1105/tpc.17.00579
Kumar, S. (2017). Epigenetic control of apomixis: a new perspective of an old enigma. Adv. Plants Agric. Res. 7, 00243. doi: 10.15406/apar.2017.07.00243
Kusano, H., Testerink, C., Vermeer, J. E., Tsuge, T., Shimada, H., Oka, A., et al. (2008). The Arabidopsis phosphatidylinositol phosphate 5-kinase PIP5K3 is a key regulator of root hair tip growth. Plant Cell. 20 (2), 367–380. doi: 10.1105/tpc.107.056119
Langmead, B., Trapnell, C., Pop, M., Salzberg, S. L. (2009). Ultrafast and memory-efficient alignment of short DNA sequences to the human genome. Genome Biol. 10 (3), R25. doi: 10.1186/gb-2009-10-3-r25
Lara, L. A., Santos, M. F., Jank, L., Chiari, L., Vilela, M. M., Amadeu, R. R., et al. (2019). Genomic selection with allele dosage in Panicum maximum Jacq. G3 (Bethesda). 9, 2463–2475. doi: 10.1534/g3.118.200986
Layman, N. C., Busch, J. W. (2018). Bottlenecks and inbreeding depression in autotetraploids. Evolution 72, 2025–2037. doi: 10.1111/evo.13587
Li, J., Das, K., Fu, G., Tong, C., Li, Y., Tobias, C., et al. (2010). EM algorithm for mapping quantitative trait loci in multivalent tetraploids. Int. J. Plant Genom. 2010, 1–10. doi: 10.1155/2010/216547
Lin, T. C., Neuner, A., Schiebel, E. (2015). Targeting of g-tubulin complexes to microtubule organizing centers: conservation and divergence. Trends In Cell Biol. 25, 296–307. doi: 10.1016/j.tcb.2014.12.002
Lin, J. S., Huang, X. X., Li, Q., Cao, Y., Bao, Y., Meng, X. F., et al. (2016). UDP-glycosyltransferase 72B1 catalyzes the glucose conjugation of monolignols and is essential for the normal cell wall lignification in Arabidopsis thaliana. Plant J. 88 (1), 26–42. doi: 10.1111/tpj.13229
Liu, J., Im Kim, J., Cusumano, J. C., Chapple, C., Venugopalan, N., Fischetti, R. F., et al. (2016). The impact of alterations in lignin deposition on cellulose organization of the plant cell wall. Biotechnol. Biofuels 9 (1), 126. doi: 10.1186/s13068-016-0540-z
Luo, Z. W., Hackett, C. A., Bradshaw, J. E., McNicol, J. W., Milbourne, D. (2000). Predicting parental genotypes and gene segregation for tetrasomic inheritance. Theor. Appl. Genet. 100, 1067–1073. doi: 10.1007/s001220051388
Luo, Z. W., Zhang, R. M., Kearsey, M. J. (2004). Theoretical basis for genetic linkage analysis in autotetraploid species. Proc. Natl. Acad. Sci. U.S.A. 101, 7040–7045. doi: 10.1073/pnas.0304482101
Luo, Z. W., Zhang, Z., Leach, L., Zhang, R. M., Bradshaw, J. E., Kearsey, M. J. (2006). Constructing genetic linkage maps under a tetrasomic model. Genetics 172, 2635–2645. doi: 10.1534/genetics.105.052449
Marcón, F., Martínez, E. J., Rodríguez, G. R., Zilli, A. L., Brugnoli, E. A., Acuña, C. A. (2019). Genetic distance and the relationship with heterosis and reproductive behavior in tetraploid bahiagrass hybrids. Mol. Breed. 39, 89. doi: 10.1007/s11032-019-0994-3
Martínez, E. J., Hopp, H. E., Stein, J., Ortiz, J. P. A., Quarin, C. L. (2003). Genetic characterization of apospory in tetraploid Paspalum notatum based on the identification of linked molecular markers. Mol. Breed. 12, 319–327. doi: 10.1023/B:MOLB.0000006868.12568.32
Mashiguchi, K., Asami, T., Suzuki, Y. (2009). Genome-wide identification, structure and expression studies, and mutant collection of 22 early nodulin-like protein genes in Arabidopsis. Biosci. Biotechnol. Biochem. 73 (11), 2452–2459. doi: 10.1271/bbb.90407
Mather, K. (1935). Reductional and equational separation of the chromosomes in bivalents and multivalents. J. Genet. 30, 53–78. doi: 10.1007/BF02982205
Matias, F. I., Alves, F. C., Meireles, K. G. X., Barrios, S. C. L., do Valle, C. B., Endelman, J. B.. (2019). On the accuracy of genomic prediction models considering multi-trait and allele dosage in Urochloa spp. interespecific tetraploid hybrids. Mol. Breeding 39 (100). doi: 10.1007/s11032-019-1002-7
Mollinari, M., Garcia, A. A. F. (2019). Linkage analysis and haplotype phasing in experimental autopolyploid populations with high ploidy level using hidden Markov models. G3 9 (10), 3297–3314. doi: 10.1534/g3.119.400378
Mousavi, A., Hotta, Y. (2005). Glycine-rich proteins. Appl. Biochem. Biotechnol. 120 (3), 169–174. doi: 10.1385/ABAB:120:3:169
Munné-Bosch, S., Simancas, B., Müller, M. (2018). Ethylene signaling cross-talk with other hormones in Arabidopsis thaliana exposed to contrasting phosphate availability: differential effects in roots, leaves and fruits. J. Plant Physiol. 226, 114–122. doi: 10.1016/j.jplph.2018.04.017
Ndamukong, I., Chetram, A., Saleh, A., Avramova, Z. (2009). Wall-modifying genes regulated by the Arabidopsis homolog of trithorax, ATX1: repression of the XTH33 gene as a test case. Plant J. 58 (4), 541–553. doi: 10.1111/j.1365-313X.2009.03798.x
Newman, K. L., Fernandez, A. G., Barton, M. K. (2002). Regulation of axis determinacy by the Arabidopsis PINHEAD gene. Plant Cell. 14 (12), 3029–3042. doi: 10.1105/tpc.005132
Niño-González, M., Novo-Uzal, E., Richardson, D. N., Barros, P. M., Duque, P. (2019). More transporters, more substrates: the arabidopsis major facilitator superfamily revisited. Mol. Plant. 12 (9): 1182–1202. doi: 10.1016/j.molp.2019.07.003
Nogler, G. A. (1984). “Gametophytic apomixis,” in Embryology of Angiosperms. Ed. Johri, B. M. (Berlin, Heidelberg: Springer), 475–518. doi: 10.1007/978-3-642-69302-1_10
Odorico, F. H., Morandim-Giannetti, A. d. A., Lucarini, A. C., Torres, R. B. (2018). Pretreatment of guinea grass (Panicum maximum) with the ionic liquid 1-ethyl-3-methyl imidazolium acetate for efficient hydrolysis and bioethanol production. Cellulose 25, 2997–3009. doi: 10.1007/s10570-018-1753-z
Oliveira, E. J., Koehler, A. D., Rocha, D. I., Vieira, L. M., Pinheiro, M. V. M., de Matos, E. M., et al. (2017). Morpho-histological, histochemical, and molecular evidences related to cellular reprogramming during somatic embryogenesis of the model grass Brachypodium distachyon. Protoplasma 254 (5), 2017–2034. doi: 10.1007/s00709-017-1089-9
Pan, H., Zhou, R., Louie, G. V., Mühlemann, J. K., Bomati, E. K., et al. (2014). Structural studies of cinnamoyl-CoA reductase and cinnamyl-alcohol dehydrogenase, key enzymes of monolignol biosynthesis. Plant Cell. 26 (9), 3709–3727. doi: 10.1105/tpc.114.127399
Patel, R. K., Jain, M. (2012). NGS QC toolkit: a toolkit for quality control of next generation sequencing data. PloS One 7, e30619. doi: 10.1371/journal.pone.0030619
Paudel, D., Kannan, B., Yang, X., Harris-Shultz, K., Thudi, M., Varshney, R. K., et al. (2018). Surveying the genome and constructing a high-density genetic map of napiergrass (Cenchrus purpureus Schumach). Sci. Rep. 8, 14419. doi: 10.1038/s41598-018-32674-x
Pelloux, J., Rusterucci, C., Mellerowicz, E. J. (2007). New insights into pectin methylesterase structure and function. Trends In Plant Sci. 12 (6), 267–277. doi: 10.1016/j.tplants.2007.04.001
Pereira, G. S., Garcia, A. A. F., Margarido, G. R. A. (2018). A fully automated pipeline for quantitative genotype calling from next generation sequencing data in autopolyploids. BMC Bioinform. 19, 398. doi: 10.1186/s12859-018-2433-6
Pereira, G. D. S., Gemenet, D. C., Mollinari, M., Olukolu, B. A., Wood, J. C., Diaz, F., et al. (2019). Multiple QTL mapping in autopolyploids: a random-effect model approach with application in a hexaploid sweetpotato full-sib population. bioRxiv. 622951.
Pessim, C., Pagliarini, M. S., Jank, L., Kaneshima, A. M. D. S., Bonato, A. B. M. (2010). Meiotic behavior in Panicum maximum Jacq. (Poaceae: Panicoideae: Paniceae: hybrids and their genitors). Acta Sci. Agron. 32 (3), 417–422. doi: 10.4025/actasciagron.v32i3.6461
Pessim, C., Pagliarini, M. S., Silva, N., Jank, L. (2015). Chromosome stickiness impairs meiosis and influences reproductive success in Panicum maximum (Poaceae) hybrid plants. Genet. Mol. Res. 14 (2), 4195–4202. doi: 10.4238/2015
Pessino, S. C., Evans, C., Ortiz, J. P. A., Armstead, I., Valle, C. B. D., Hayward, M. D. (1998). A genetic map of the apospory-region in Brachiaria hybrids: identification of two markers closely associated with the trait. Hereditas 128, 153–158. doi: 10.1111/j.1601-5223.1998.00153.x
Poland, J. A., Brown, P. J., Sorrells, M. E., Jannink, J. L. (2012). Development of high-density genetic maps for barley and wheat using a novel two-enzyme genotyping-by-sequencing approach. PloS One 7, e32253. doi: 10.1371/journal.pone.0032253
Primo, C., Pizzio, G. A., Yang, J., Gaxiola, R. A., Scholz-Starke, J., Hirschi, K. D. (2019). Plant proton pumping pyrophosphatase: the potential for its pyrophosphate synthesis activity to modulate plant growth. Plant Biol. 21 (6): 989–996. doi: 10.1111/plb.13007
R Core Team. (2018). R: A Language and Environment for Statistical Computing (Vienna: R Foundation for Statistical Computing).
Radhakrishna, A., Dwivedi, K. K., Srivastava, M. K., Roy, A. K., Malaviya, D. R., Kaushal, P. (2018). Transcriptomic data of pre-meiotic stage of floret development in apomictic and sexual types of guinea grass (Panicum maximum Jacq.). Data Brief 18, 590–593. doi: 10.1016/j.dib.2018.03.001
Resende, R. M. S., Jank, L., Valle, C. B. d., Bonato, A. L. V. (2004). Biometrical analysis and selection of tetraploid progenies of Panicum maximum using mixed model methods. Pesq. Agropec Bras. 39, 335–341. doi: 10.1590/S0100-204X2004000400006
Roberts, D., Pedmale, U. V., Morrow, J., Sachdev, S., Lechner, E., Tang, X., et al. (2011). Modulation of phototropic responsiveness in Arabidopsis through ubiquitination of phototropin 1 by the CUL3-Ring E3 ubiquitin ligase CRL3NPH3. Plant Cell. 23 (10), 3627–3640. doi: 10.1105/tpc.111.087999
Routray, P., Masalkar, P. D., Roberts, D. M.. (2015). “Nodulin intrinsic proteins: facilitators of water and ammonia transport across the symbiosome membrane” in Biological Nitrogen Fixation ed. de Brujin, F. J. (John Wiley & Sons, Inc.), 695–704. doi: 10.1002/9781119053095.ch69
Sartie, A. M., Easton, H. S., Matthew, C., Rolston, M. P., Faville, M. J. (2018). Seed yield in perennial ryegrass (Lolium perenne L.): comparative importance of component traits and detection of seed-yield-related QTL. Euphytica 214 (12), 226. doi: 10.1007/s10681-018-2307-z
Savidan, Y., Pernès, J. (1982). Diploid-tetraploid-dihaploid cycles and the evolution of Panicum maximum jacq. Evolution 36, 596–600. doi: 10.1111/j.1558-5646.1982.tb05081.x10.2307/2408104
Savidan, Y. H., Jank, L., Costa, J. C. G., do Valle, C. B. (1989). Breeding Panicum maximum in Brazil. 1. Genetic resources, modes of reproduction and breeding procedures. Euphytica 41, 107–112. doi: 10.1007/BF00022419
Savidan, Y. (1980). Chromosomal and embryological analyses in sexual x apomictic hybrids of Panicum maximum Jacq. Theor. Appl. Genet. 58 (2), 153–156. doi: 10.1007/BF00279706
Savidan, Y. (1981). Genetics and utilization of apomixis for the improvement of guinea grass (Panicum maximum) In: INTERNATIONAL GRASSLAND CONGRESS, 14., 1981, Lexington. Proceedings Boulder : Westview Press, 1983. 182-184.
Savidan, Y. (2000). Apomixis: genetics and breeding. Plant Breed. Rev. 18, 13–86. doi: 10.1002/9780470650158.ch2
Schwarz, G. (1978). Estimating the dimension of a model. Ann. Stat. 6, 461–464. doi: 10.1214/aos/1176344136
Sehgal, D., Rajaram, V., Armstead, I. P., Vadez, V., Yadav, Y. P., Hash, C. T., et al. (2012). Integration of gene-based markers in a pearl millet genetic map for identification of candidate genes underlying drought tolerance quantitative trait loci. BMC Plant Biol. 12 (1), 9. doi: 10.1186/1471-2229-12-9
Sengupta, S., Mukherjee, S., Basak, P., Majumder, A. L. (2015). Significance of galactinol and raffinose family oligosaccharide synthesis in plants. Front. Plant Sci. 6, 656. doi: 10.3389/fpls.2015.00656
Seo, P. J., Kim, S. G., Park, C. M. (2008). Membrane-bound transcription factors in plants. Trends In Plant Sci. 13 (10), 550–556. doi: 10.1016/j.tplants.2008.06.008
Serang, O., Mollinari, M., Garcia, A. A. F. (2012). Efficient exact maximum a posteriori computation for Bayesian SNP genotyping in polyploids. PloS One 7, e30906. doi: 10.1371/journal.pone.0030906
Smyczynski, C., Roudier, F., Gissot, L., Vaillant, E., Grandjean, O., Morin, H., et al. (2006). The C terminus of the immunophilin PASTICCINO1 is required for plant development and for interaction with a NAC-like transcription factor. J. Biol. Chem. 281 (35), 25475–25484. doi: 10.1074/jbc.M601815200
Studer, A. J., Doebley, J. F. (2011). Do large effect QTL fractionate? a case study at the maize domestication QTL teosinte branched1. Genetics 188 (3), 673–681. doi: 10.1534/genetics.111.126508
Suzuki, M., Kato, A., Nagata, N., Komeda, Y. (2002). A xylanase, AtXyn1, is predominantly expressed in vascular bundles, and four putative xylanase genes were identified in the Arabidopsis thaliana genome. Plant Cell Physiol. 43 (7), 759–767. doi: 10.1093/pcp/pcf088
Thaikua, S., Ebina, M., Yamanaka, N., Shimoda, K., Suenaga, K., Kawamoto, Y. (2016). Tightly clustered markers linked to an apospory-related gene region and quantitative trait loci mapping for agronomic traits in Brachiaria hybrids. Grassl. Sci. 62, 69–80. doi: 10.1111/grs.12115
Toledo-Silva, G., Cardoso-Silva, C. B., Jank, L., Souza, A. P. (2013). De novo transcriptome assembly for the tropical grass Panicum maximum Jacq. PloS One 8 (7), 1–10. doi: 10.1371/journal.pone.0070781
Tronconi, M. A., Fahnenstich, H., Weehler, M. C. G., Andreo, C. S., Flügge, U. I., Drincovich, M. F., et al. (2008). Arabidopsis NAD-malic enzyme functions as a homodimer and heterodimer and has a major impact on nocturnal metabolism. Plant Physiol. 146 (4), 1540–1552. doi: 10.1104/pp.107.114975
Valle, C. D., Glienke, C., Leguizamon, G. O. C. (1994). Inheritance of apomixis in Brachiaria, a tropical forage grass. Apomixis Newslett. 7, 42–43.
Valle, C. B., Jank, L., Resende, R. M. S. (2009). O melhoramento de forrageiras tropicais no Brasil. Rev. Ceres 56, 460–472.
Vigna, B. B. Z., Santos, J. C. S., Jungmann, L., do Valle, C. B., Mollinari, M., et al. (2016). Evidence of allopolyploidy in Urochloa humidicola based on cytological analysis and genetic linkage mapping. PloS One 11, e0153764. doi: 10.1371/journal.pone.0153764
Voorrips, R. E. (2002). MapChart: software for the graphical presentation of linkage maps and QTLs. J. Hered. 93, 77–78. doi: 10.1093/jhered/93.1.77
Wang, Q., Sullivan, R. W., Kight, A., Henry, R. L., Huang, J., Jones, A. M., et al. (2004). Deletion of the chloroplast-localized Thylakoid formation1 gene product in Arabidopsis leads to deficient thylakoid formation and variegated leaves. Plant Physiol. 136 (3), 3594–3604. doi: 10.1104/pp.104.049841
Warmke, H. E. (1954). Apomixis in Panicum maximum. Am. J. Bot. 41, 5–11. doi: 10.1002/j.1537-2197.1954.tb14297.x
Worthington, M., Heffelfinger, C., Bernal, D., Quintero, C., Zapata, Y. P., Perez, J. G., et al. (2016). A parthenogenesis gene candidate and evidence for segmental allopolyploidy in apomictic Brachiaria decumbens. Genetics 203, 1117–1132. doi: 10.1534/genetics.116.190314
Worthington, M., Heffelfinger, C., Bernal, D., Quintero, C., Zapata, Y. P., Perez, J. G., et al. (2019). Translocation of a parthenogenesis gene candidate to an alternate carrier chromosome in apomictic Brachiaria humidicola. BMC Genom. 20, 1–18. doi: 10.1186/s12864-018-5392-4
Wu, B., Mao, D., Liu, T., Li, Z., Xing, Y. (2015). Two quantitative trait loci for grain yield and plant height on chromosome 3 are tightly linked in coupling phase in rice. Mol. Breed. 35 (8), 156. doi: 10.1007/s11032-015-0345-y
Xiao, W., Hu, S., Zhou, X., Yao, R., Luo, J., Yuan, C., et al. (2017). A glucuronokinase gene in Arabidopsis, AtGlcAK, is involved in drought tolerance by modulating sugar metabolism. Plant Mol. Biol. Rep. 35 (2), 298–311. doi: 10.1007/s11105-017-1023-5
Xu, F., Lyu, Y., Tong, C., Wu, W., Zhu, X., Yin, D., et al. (2013). A statistical model for QTL mapping in polysomic autotetraploids underlying double reduction. Brief. Bioinform. 15, 1044–1056. doi: 10.1093/bib/bbt073
Yang, Y., Xu, R., Ma, C. J., Vlot, A. C., Klessig, D. F., Pichersky, E. (2008). Inactive methyl indole-3-acetic acid ester can be hydrolyzed and activated by several esterases belonging to the AtMES esterase family of Arabidopsis. Plant Physiol. 147 (3), 1034–1045. doi: 10.1104/pp.108.118224
Yokoyama, R., Nishitani, K. (2001). A comprehensive expression analysis of all members of a gene family encoding cell-wall enzymes allowed us to predict cis-regulatory regions involved in cell-wall construction in specific organs of Arabidopsis. Plant Cell Physiol. 42 (10), 1025–1033. doi: 10.1093/pcp/pce154
Young, B. A., Sherwood, R. T., Bashaw, E. C. (1979). Cleared-pistil and thick-sectioning techniques for detecting aposporous apomixis in grasses. Can. J. Bot. 57, 1668–1672. doi: 10.1139/b79-204
Zhang, X., Lu, S., Jiang, C., Wang, Y., Lv, B., Shen, J., et al. (2014). RcLEA, a late embryogenesis abundant protein gene isolated from Rosa chinensis, confers tolerance to Escherichia coli and Arabidopsis thaliana and stabilizes enzyme activity under diverse stresses. Plant Mol. Biol. 85 (4-5), 333–347. doi: 10.1007/s11103-014-0192-y
Zhao, Q. (2016). Lignification: flexibility, biosynthesis and regulation. Trends Plant Sci. 21 (8), 713–721. doi: 10.1016/j.tplants.2016.04.006
Keywords: apospory, double reduction, forage, polyploidy, quantitative trait locus, single nucleotide polymorphism, trait correlations
Citation: Deo TG, Ferreira RCU, Lara LAC, Moraes ACL, Alves-Pereira A, de Oliveira FA, Garcia AAF, Santos MF, Jank L and de Souza AP (2020) High-Resolution Linkage Map With Allele Dosage Allows the Identification of Regions Governing Complex Traits and Apospory in Guinea Grass (Megathyrsus maximus). Front. Plant Sci. 11:15. doi: 10.3389/fpls.2020.00015
Received: 16 October 2019; Accepted: 08 January 2020;
Published: 26 February 2020.
Edited by:
Marcelino Perez De La Vega, Universidad de León, SpainReviewed by:
Pankaj Kaushal, National Institute of Biotic Stress Management, IndiaJuan Capel, University of Almeria, Spain
Copyright © 2020 Deo, Ferreira, Lara, Moraes, Alves-Pereira, de Oliveira, Garcia, Santos, Jank and de Souza. This is an open-access article distributed under the terms of the Creative Commons Attribution License (CC BY). The use, distribution or reproduction in other forums is permitted, provided the original author(s) and the copyright owner(s) are credited and that the original publication in this journal is cited, in accordance with accepted academic practice. No use, distribution or reproduction is permitted which does not comply with these terms.
*Correspondence: Anete P. Souza, anete@unicamp.br