 Helen M. Cockerton1†
 Bo Li1
 Robert J. Vickerstaff1
 Catherine A. Eyre2Daniel J. Sargent2
 Andrew D. Armitage1Cesar Marina-Montes1Ana Garcia-Cruz1Andrew J. Passey1David W. Simpson1
 Richard Jonathan Harrison1*
- 1NIAB EMR, East Malling, United Kingdom
- 2Driscoll’s Genetics Ltd., East Malling Enterprise Centre, East Malling, United Kingdom
Verticillium dahliae is a highly detrimental pathogen of soil cultivated strawberry (Fragaria x ananassa). Breeding of Verticillium wilt resistance into commercially viable strawberry cultivars can help mitigate the impact of the disease. In this study we describe novel sources of resistance identified in multiple strawberry populations, creating a wealth of data for breeders to exploit. Pathogen-informed experiments have allowed the differentiation of subclade-specific resistance responses, through studying V. dahliae subclade II-1 specific resistance in the cultivar “Redgauntlet” and subclade II-2 specific resistance in “Fenella” and “Chandler.” A large-scale low-cost phenotyping platform was developed utilizing automated unmanned vehicles and near infrared imaging cameras to assess field-based disease trials. The images were used to calculate disease susceptibility for infected plants through the normalized difference vegetation index score. The automated disease scores showed a strong correlation with the manual scores. A co-dominant resistant QTL; FaRVd3D, present in both “Redgauntlet” and “Hapil” cultivars exhibited a major effect of 18.3% when the two resistance alleles were combined. Another allele, FaRVd5D, identified in the “Emily” cultivar was associated with an increase in Verticillium wilt susceptibility of 17.2%, though whether this allele truly represents a susceptibility factor requires further research, due to the nature of the F1 mapping population. Markers identified in populations were validated across a set of 92 accessions to determine whether they remained closely linked to resistance genes in the wider germplasm. The resistant markers FaRVd2B from “Redgauntlet” and FaRVd6D from “Chandler” were associated with resistance across the wider germplasm. Furthermore, comparison of imaging versus manual phenotyping revealed the automated platform could identify three out of four disease resistance markers. As such, this automated wilt disease phenotyping platform is considered to be a good, time saving, substitute for manual assessment.
Introduction
Verticillium dahliae (Kleb.) is a soilborne plant pathogen which has a large detrimental impact on the yield of soil cultivated strawberry (Fragaria x ananassa) (Maas, 1998). This ascomycete fungi is particularly problematic due to the longevity of inoculum in the soil whereby the resting propagules, termed microsclerotia, persist for up to 14 years in the absence of a host plant (Schnathorst, 1981). Low inoculum densities of 2 cfu per gram of soil can result in complete strawberry crop losses (Harris and Yang, 1996), indicating that strawberry exhibits a very high susceptibility to Verticillium alongside the crops cotton (Paplomatas et al., 1992) and olive when artificially inoculated (López-Escudero and Blanco-López, 2007). Verticillium infects over 200 different dicotyledonous plant species including many horticultural crops and weeds (Woolliams, 1966; Bhat and Subbarao, 1999) meaning that crop rotation is an ineffective form of disease control (Atallah et al., 2011). Effective disease control is also hampered by the absence of curative fungicides and restriction of preventative chemical fumigants due to European regulations (e.g., 91/414/EEC; Colla et al., 2012). Disease resistant germplasm is therefore an essential resource required to combat the pathogen, particularly where countries rely predominantly on soil cultivation systems.
A pathogenesis related protein which catalyzes chitinase from wild tomato has been shown to be effective against V. dahliae when transformed into strawberry (Chalavi and Tabaeizadeh, 2003). This mechanism acts before infection therefore indicating very strong resistance as proven by the percentage infection of Verticillium in strawberry crowns. Complete resistance has not been observed in natural populations of octoploid strawberry to date. Tolerance, whereby the host is colonized by the fungus but does not exhibit infection symptoms, is frequently observed in strawberry alongside the crop species olive (López-Escudero et al., 2004) potato (Dan et al., 2001), cultivated tomato (Chen et al., 2004; Fradin et al., 2009) and cotton (Bolek et al., 2005; Zhang et al., 2011).
High variation for V. dahliae resistance has been observed in Californian strawberry germplasm and empirical selection had led to an increase in resistance (Shaw and Gubler, 1996; Shaw et al., 1997). Studies investigating the GCA for V. dahliae resistance in strawberry, found that four out of ten cultivars had a significant GCA indicating a high transmission of resistance or susceptibility status from parent to progeny. This study suggests that Verticillium wilt resistance is controlled by additive quantitative genetic components (Masny et al., 2014). Furthermore, a significant SCA in two crosses indicated that some Verticillium resistance alleles are non-additive (Masny et al., 2014). Previous studies using in vitro strawberry have found Verticillium resistance to be controlled by additive genes and in one case a single partially dominant gene (Zebrowska et al., 2006). The study of the “Redgauntlet” x “Hapil” mapping population revealed that multiple small effect QTL control V. dahliae resistance (Antanaviciute et al., 2015).
Isolate and cultivar specific interactions complicate the description of resistance and must be considered for robust disease resistance breeding. Segregation of V. dahliae into six distinct races has been proposed based on the resistance status of different strawberry varieties (Govorova and Govorov, 1997) indicating a complex series of host-pathogen interactions. By contrast, a simpler dissection of V. dahliae isolate virulence has been proposed: two subclades of V. dahliae have been isolated from United Kingdom strawberry; II-1 and II-2, which exhibit different average levels of virulence on the susceptible strawberry cultivar “Hapil” (Jiménez-Díaz and Olivares-García, 2017; Fan et al., 2018).
Single major gene resistance to V. dahliae has been identified in tomato, lettuce and cotton; the Ve1 host gene, which recognizes the avirulence pathogen effector VdAve1, leads to the separation of V. dahliae isolates into two races; those with and without VdAve1 (Kawchuk et al., 2001; Hayes et al., 2011; Zhang et al., 2011; de Jonge et al., 2012). Fan et al. (2018) conclude that there is an absence of the VdAve1 gene in V. dahliae isolated from United Kingdom strawberry. The exclusive infection of strawberry by “race 2” isolates in the United Kingdom, despite of the presence of “race 1” isolates in other United Kingdom hosts, likely suggests a lack of dispersion of VdAve1 isolates, rather than selection against Ave1, as VdAve1 isolates were also able to infect strawberry. This reduces the relevance of harnessing Ve1 mediated resistance in future strawberry breeding.
Platforms for strawberry genotyping have advanced substantially over the last decade (Bassil et al., 2015; Verma et al., 2017), however, the low throughput capacity of traditional large scale phenotyping is now the limiting factor restricting pre-breeding research (Mahlein, 2016). Currently, many breeders use manual assessments to quantify the disease resistance status of plants, which is subjective and time consuming. Imaging techniques have been successfully applied to high-throughput plant phenotyping for the past decade (Barbedo, 2013) and with the development of lightweight UAV for precision agriculture, imaging techniques can be applied to screen large crop areas with centimeter level spatial resolution and accurate positional information (Candiago et al., 2015). Multispectral cameras are lighter than the majority of imaging sensors that can be attached to UAV (Sugiura et al., 2016) they also provide accurate quantification and are a cost effective strategy for disease severity quantification. The most common vegetation index derived from multispectral sensor is the NDVI where a positive NDVI value indicates healthy green vegetation whilst a negative value indicates the absence of vegetation (Candiago et al., 2015).
In this study, a low-cost UAV with global positioning system and multispectral imaging sensor was implemented as part of a phenotyping platform to measure Verticillium wilt resistance in strawberry.
We also report a reanalysis of historical data using the “Redgauntlet” and Hapil mapping populations infected with a mixed inoculum of V. dahliae, reported by Antanaviciute et al. (2015) using newly generated SNP data and also test additional progeny of “Redgauntlet” and Hapil against a single isolate from subclade II-1. Furthermore, two additional mapping populations are studied to identify putative resistance loci toward a highly virulent subclade II-2 isolate of V. dahliae.
Materials and Methods
Study Area and Experimental Design
Field phenotyping for V. dahliae resistance was conducted on three strawberry mapping populations. Mapping populations were produced through crosses between the cultivars “Emily” x “Fenella” (ExF, 181 genotypes), “Flamenco” x “Chandler” (FxC, 140 genotypes) and “Redgauntlet” x “Hapil” (RxHb, 160 genotypes). The RxHb cross differs from the population described in previous research, as it is a different set of individuals (Sargent et al., 2012; Antanaviciute et al., 2015). The analysis reported in Antanaviciute et al. (2015) used the original “Redgauntlet” x “Hapil” (RxHa) cross and SSR markers. This study integrates the Antanaviciute et al. (2015) phenotypic data where, in contrast to the previous analysis, the AUDPC and Best Linear Unbiased Estimate (BLUE) scores were calculated to represent the disease score of each genotype across 3 years of phenotyping. Use of SNP marker genotyping allowed a more powerful analysis and comparison of resistance markers across populations. The validation experiment utilized 92 accessions selected from across the wider germplasm, where 97.7% of the SNPs were polymorphic in at least one individual out of a total 22,296 SNP’s. Parent and progeny stock plants were maintained in a polytunnel and runners were pinned down into 9 cm pots before planting in “Calves Leys,” Aylesford, Kent United Kingdom field in autumn 2015 (ExF & FxC) or “Rocks Farm,” East Malling, Kent, United Kingdom in 2016 (Validation & RxHb). Plants were arranged East to West with 64 plants per row at 0.6 m intervals in a randomized block design with 5–10 replicate plants per genotype or accession and parental lines. Black MyPex® was used for weed growth suppression and allowed segregation of plant foliage for image analysis. Plants were rainfed with additional overhead irrigation supplied if required. The pre-existing microsclerotia level was quantified using the Harris method (Harris et al., 1993) and found to be 4.2 cfu g–1 soil in “Calves Leys” and 0.9 cfu g–1 in “Rocks Farm.” To ensure robust disease symptom expression, plants were inoculated with 10 ml of 4 x 10⁶ conidia ml–1 into the crown and immediate surrounding soil of each strawberry plant. A single, highly virulent isolate of V. dahliae (12008) was used as inoculum in March 2016 for ExF, FxC and March 2017 for germplasm experiments. The isolate, 12008, has been used extensively in work conducted by Soares (2004) and Fan et al. (2018) and represents an isolate from V. dahliae subclade II-2, the “high virulence subclade” when inoculated onto strawberry. Plants in the RxHb phenotyping event were inoculated with isolate 12158 from subclade II-1. All RxHa phenotyping events were conducted through a trial plot originally inoculated with a large mixture of V. dahliae isolates (Antanaviciute et al., 2015). Weather conditions were 12.2 (±3.7)oC; 76.7 (±8.6) RH% spring 2016, 18.5 (±2.3)oC; 77.4 (±6.3) RH% summer 2016, 13.34 (±0.49)oC; 74.5 (±0.76) RH% spring 2017 and 18.36 (±0.62)oC; 75.76 (±1.12) RH% summer 2017.
Visual Assessment of Verticillium Wilt
Disease scores were recorded five times from June to September at 3-week intervals, plants were scored for percentage wilting disease symptoms on a score of 1–9 depending on severity of leaf wilting where a score of 1 denoted a completely healthy plant; 3 denoted 25% necrotic leaves; 5 denoted 50% necrotic leaves; 7 denoted 75% necrotic leaves and 9 denoted 100% necrosis, a dead plant (Antanaviciute et al., 2015). The AUDPC was calculated across each phenotyping event using the R package “agricolae” (Felipe de, 2017) to predict scores for QTL analysis. AUDPC was calculated as below (Shaner and Finney, 1977).
Where y is the disease score, for score i and X represents time in days and n is the number of scoring events. Relative AUDPC (rAUDPC) was calculated by dividing the AUDPC by the number of days after inoculation.
Image Acquisition and Processing
Arial imaging was conducted, in addition to manual scoring, for 2017 field trials. The 2017 trials were of the RxHb population and the validation set, the experimental field was 45 m x 30 m in size containing approximately 2500 plants (Figure 1A). The UAV platform was a 1.6 kg DJI Flamewheel F450 quadcopter. RGB images were captured using a Canon SX240 HS, 12 MP digital camera. Multi-spectral images with resolution of 1280 × 960 pixels were captured using a MicaSense RedEdge narrow-band multispectral camera (MicaSense, Seattle, DC, United States). Images were captured at altitude of 30 m at 5 bands including Blue (B: 475 nm center wavelength, 20 nm bandwidth), Green (G: 560 nm, 20 nm), Red (R: 668 nm, 10 nm), Red Edge (RE: 717 nm, 10 nm) and Near Infrared (NIR: 840 nm, 40 nm) were captured simultaneously with the format of 16-bit raw GeoTIFF. Ortho-mosaic images were produced by processing UAV images in Pix4Dmapper Pro software (Pix4D SA, 1015 Lausanne, Switzerland). Two surveys were undertaken of the experimental plot on the August 2, 2017 at 11:00 and the September 13, 2017 at 12:00. The final image resolution was 1.27 cm2 pixel–1, the resolution of Figure 1 has been lowered to reduce file size. NDVI was calculated as the normalized ratio between near infrared (NIR) and red (R) bands (Potgieter et al., 2017), which is shown in Eq. (2). The diseased:healthy leaf area was calculated based on the green and total plant pixels, which is shown in Eq. (3).
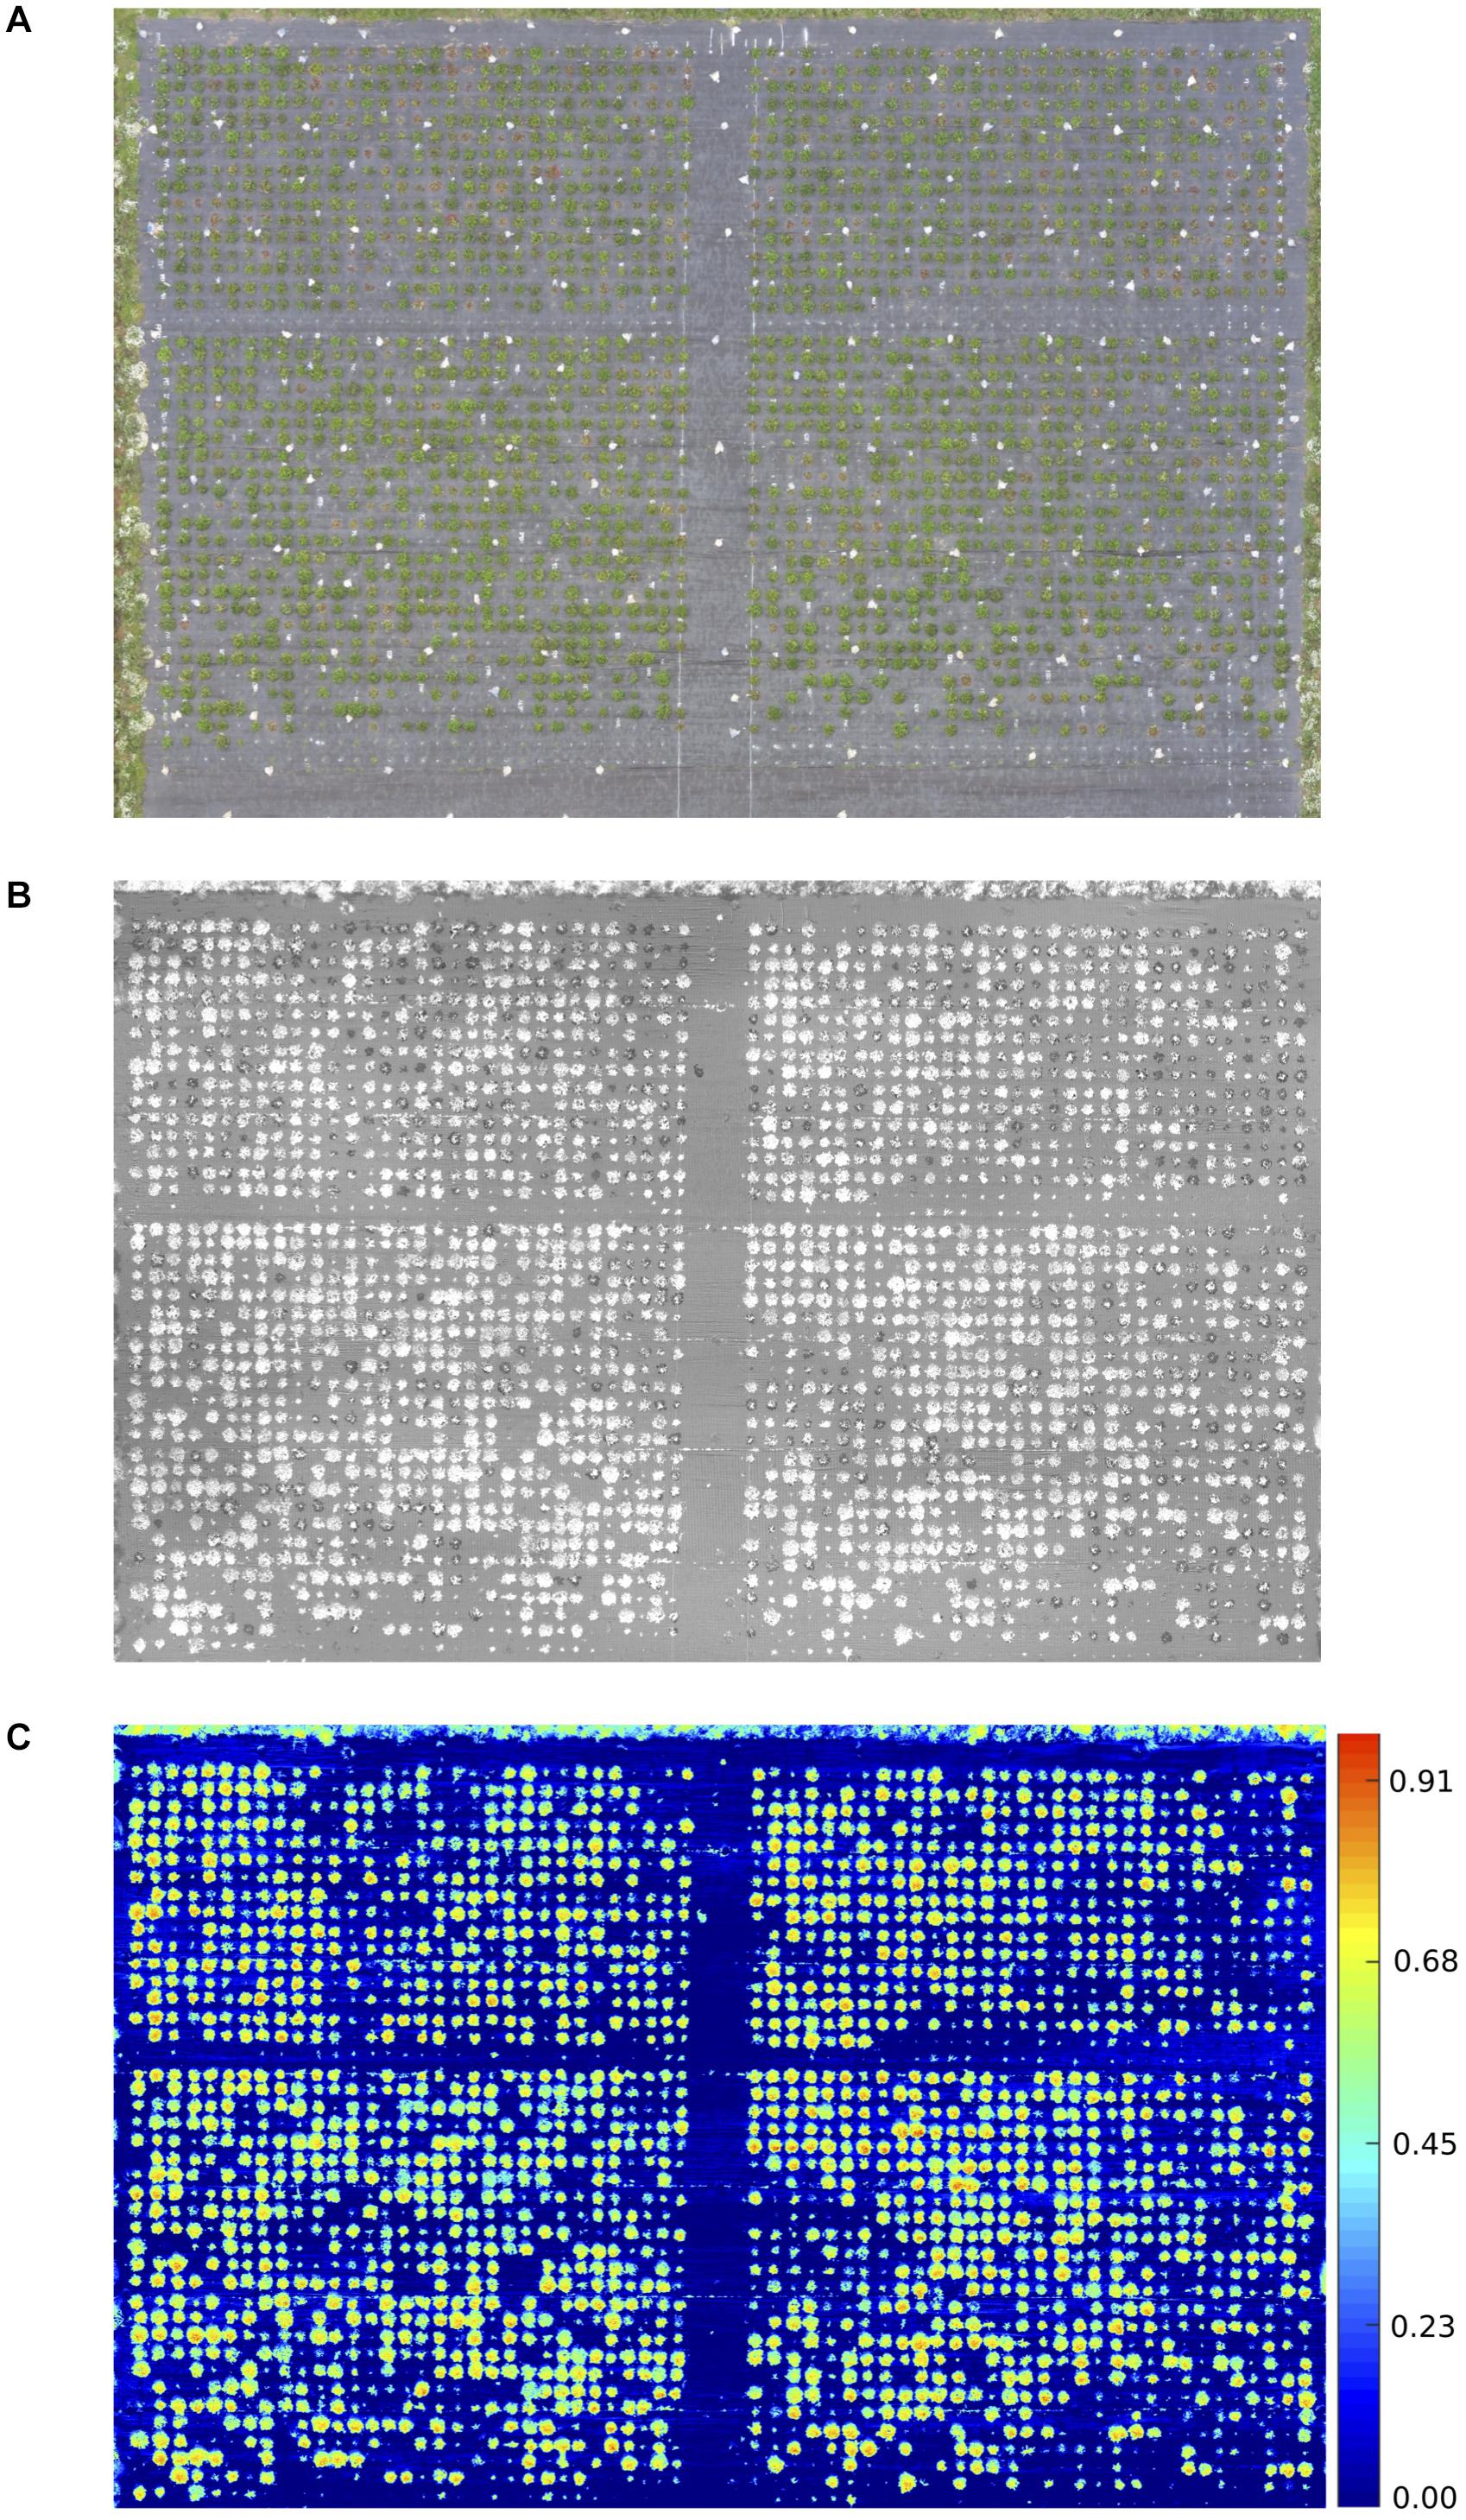
Figure 1. Aerial image taken using UAV of 2017 Verticillium disease field experiments containing the RxHb population and the validation set (A) RGB image (B) Green: Red ratio mask image of the canopy for each strawberry plant (C) Normalised difference vegetation index (NDVI) image with false color of the validation set and the “Redgauntlet” x “Hapil” (RxHb) mapping population.
Bandpass thresholding was applied to obtain the mask image of the whole canopy for each strawberry plant, the green:red band ratio image was found to provide a good contrast between the plant canopy and background (Figure 1B). A semi-automated image analysis software was developed to calculate the average NDVI value for each plant (Figure 1C). Manual selection of a plant on the masked image allows the software to automatically calculate the ratio of total NDVI: total canopy pixel number.
Linkage Map Generation
The Qiagen DNAeasy plant mini extraction kit (Qiagen Ltd., Manchester, United Kingdom) was used to extract DNA from the studied genotypes and accessions according to the manufacturer’s instructions. F1 mapping populations RxHa, ExF and FxC were genotyped using the Affymetrix Istraw90 Axiom®array (i90k; Bassil et al., 2015) whereas the population RxHb and validation accessions were genotyped on the streamlined Axiom® IStraw35 384HT array (i35k; Verma et al., 2017). Crosslink was used to generate linkage maps1 a program developed specifically for polyploid plant species (Vickerstaff and Harrison, 2017). Fragaria x ananassa chromosome number is denoted by 1–7 and sub-genome number is represented by A-D as specified in van Dijk et al. (2014) and Sargent et al. (2015).
Statistical Analysis
For the RxHa historical data the BLUE was calculated using the relative AUDPC for QTL analysis (R package “nlme,” Pinheiro et al., 2017).
For populations phenotyped with both manual and UAV imaging, the Pearson’s correlation coefficient was calculated between the ratio of healthy:diseased leaf area, NDVI and the raw phenotypic disease score at each time point. A combined analysis used the NDVI-AUDPC and healthy:diseased leaf area-AUDPC alongside the AUDPC disease score to determine the efficacy of the drone phenotyping method. Transgressive segregation where progeny wilt phenotype varied more than expected based on parental phenotypes was assessed using a Dunnett’s test.
Disease resistance markers were identified and validated as outlined in Cockerton et al. (2018b). Furthermore, inference of whether resistant markers were present across multiple populations and the targeted marker association study was conducted as outlined in Cockerton et al. (2018b). Candidate resistance genes were identified in the Fragaria vesca genome (assembly v1.1; Shulaev et al., 2011) and screened for the presence of NB-LRR, TM–CC, RLP, RLK (S-type and general) domains and candidate Rosaceous MLO genes (Pessina et al., 2014) following published pipelines (Li et al., 2016). Resistance genes were identified within 100 kb of the significant resistance marker using BEDtools (Quinlan and Hall, 2010). Characterisation of homologous genes in the NCBI database was undertaken through tblastx (Karlin and Altschul, 1993). NB-ARC domains were identified from F. vesca ab initio and hybrid gene models using InterProScan (Quevillon et al., 2005). Significant association of NBS and NB-ARC domains with focal markers was tested through assessing their occurrence within 100 kb of 25 randomly sampled markers from across the four populations over 10,000 permutations.
Results
Resistance to Isolates Varies Between Cultivars
The cultivar “Redgauntlet” exhibits tolerance to the subclade II-1 isolate, 12158 and moderate tolerance to the subclade II-2 isolate 12008, however, the cultivar “Hapil” is susceptible to the isolates from both subclades (Supplementary Figure S1). The cultivars “Fenella,” “Flamenco,” and “Chandler” are highly tolerant to the V. dahliae subclade II-2 isolate whereas “Emily” is highly susceptible (Supplementary Figure S2).
The ‘Flamenco’ x ‘Chandler’ Linkage Map
The newly generated FxC linkage map (Supplementary Tables S1, S2) has an average genetic distance between markers of 0.3 cM which is a lower average gap than ExF and RxHa (Cockerton et al., 2018b), however, there are 10 gaps greater than 20 cM and linkage groups 2C, 3C, 6C, and 6D each resolved into two linkage groups. FxC linkage information was used as one of the five populations to construct the consensus map. All reported marker positions listed in this study are based on the position in the consensus map.
Comparison of Automated and Manual Phenotyping Methods
The proportion of diseased: healthy leaf area and the NDVI values were assessed at discrete time points and over time (Figure 1). A strong negative correlation was observed between the manual disease scores and diseased: healthy leaf area (Figure 2), with a stronger relationship observed between the manual disease score and NDVI for validation and RxHb phenotyping events August 2, 2017 (r = 0.78, p < 0.001) and September 13, 2017 (r = 0.78, p < 0.001) and also between the manual AUDPC and NDVI-AUDPC (r = 0.85, p > 0.001; Figure 2).
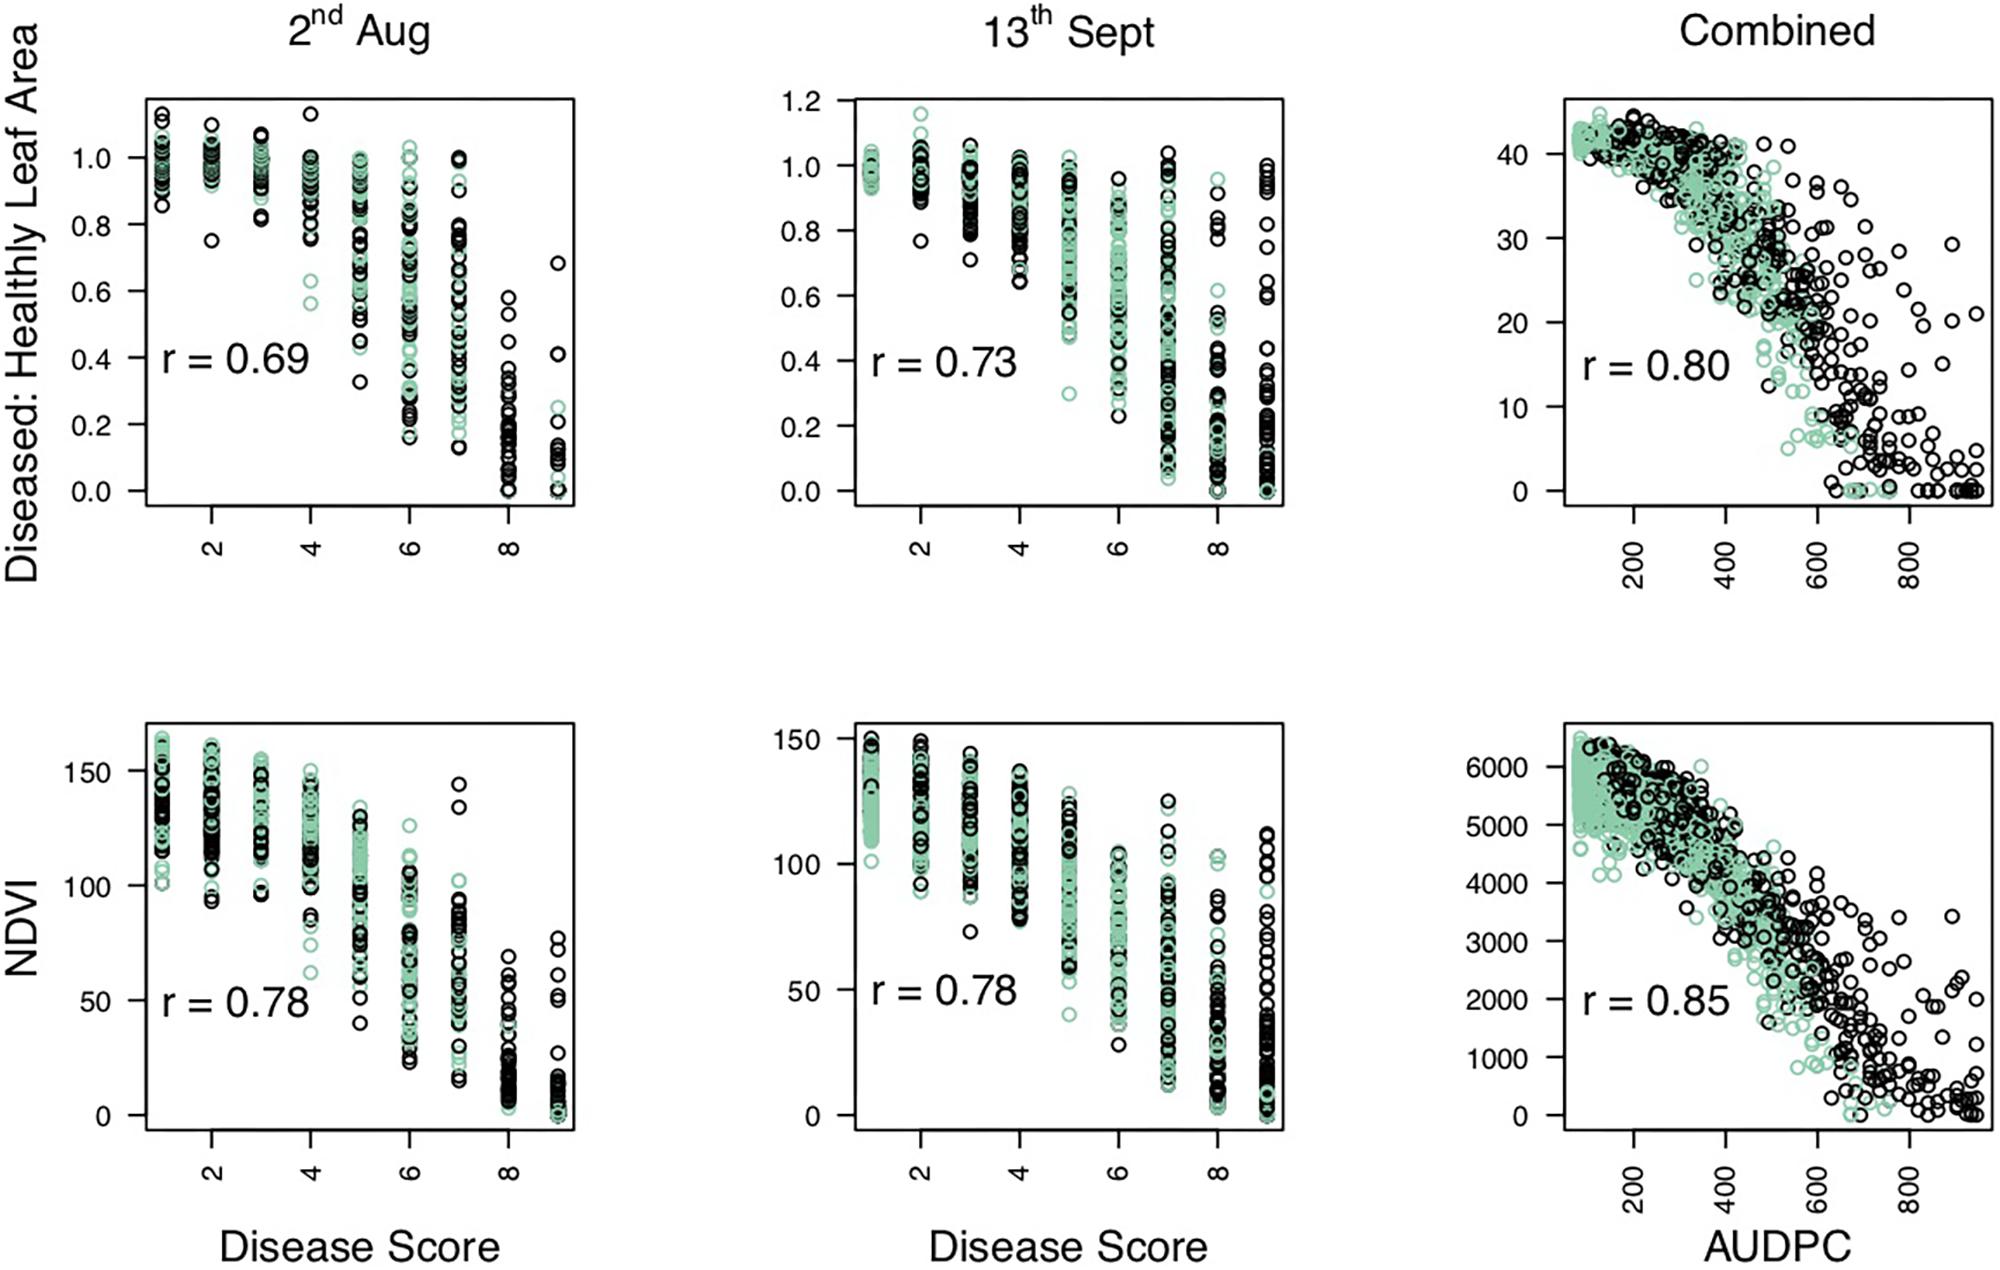
Figure 2. Correlation of disease scores measured through manual and automated techniques. Manual disease score against Diseased: Healthy and Normalized difference vegetation index (NDVI) leaf area for observation time points on 2nd August (2/8) and 13th September (13/9). Area under the disease progression curve calculated for combine Diseased: Healthy score and NDVI. Points represent the score for individual strawberry plants inoculated with Verticillium dahliae in the validation set (green) and the “Redgauntlet” x “Hapil” (RxHb; black) mapping population. r = pearson’s correlation values.
Significance values for focal SNPs predicted by either automated and manual phenotyping follow the same patterns across the strawberry genome (Figure 3) and three out of four resistance markers were successfully identified in the automated phenotyping QTL analysis (Figure 4).
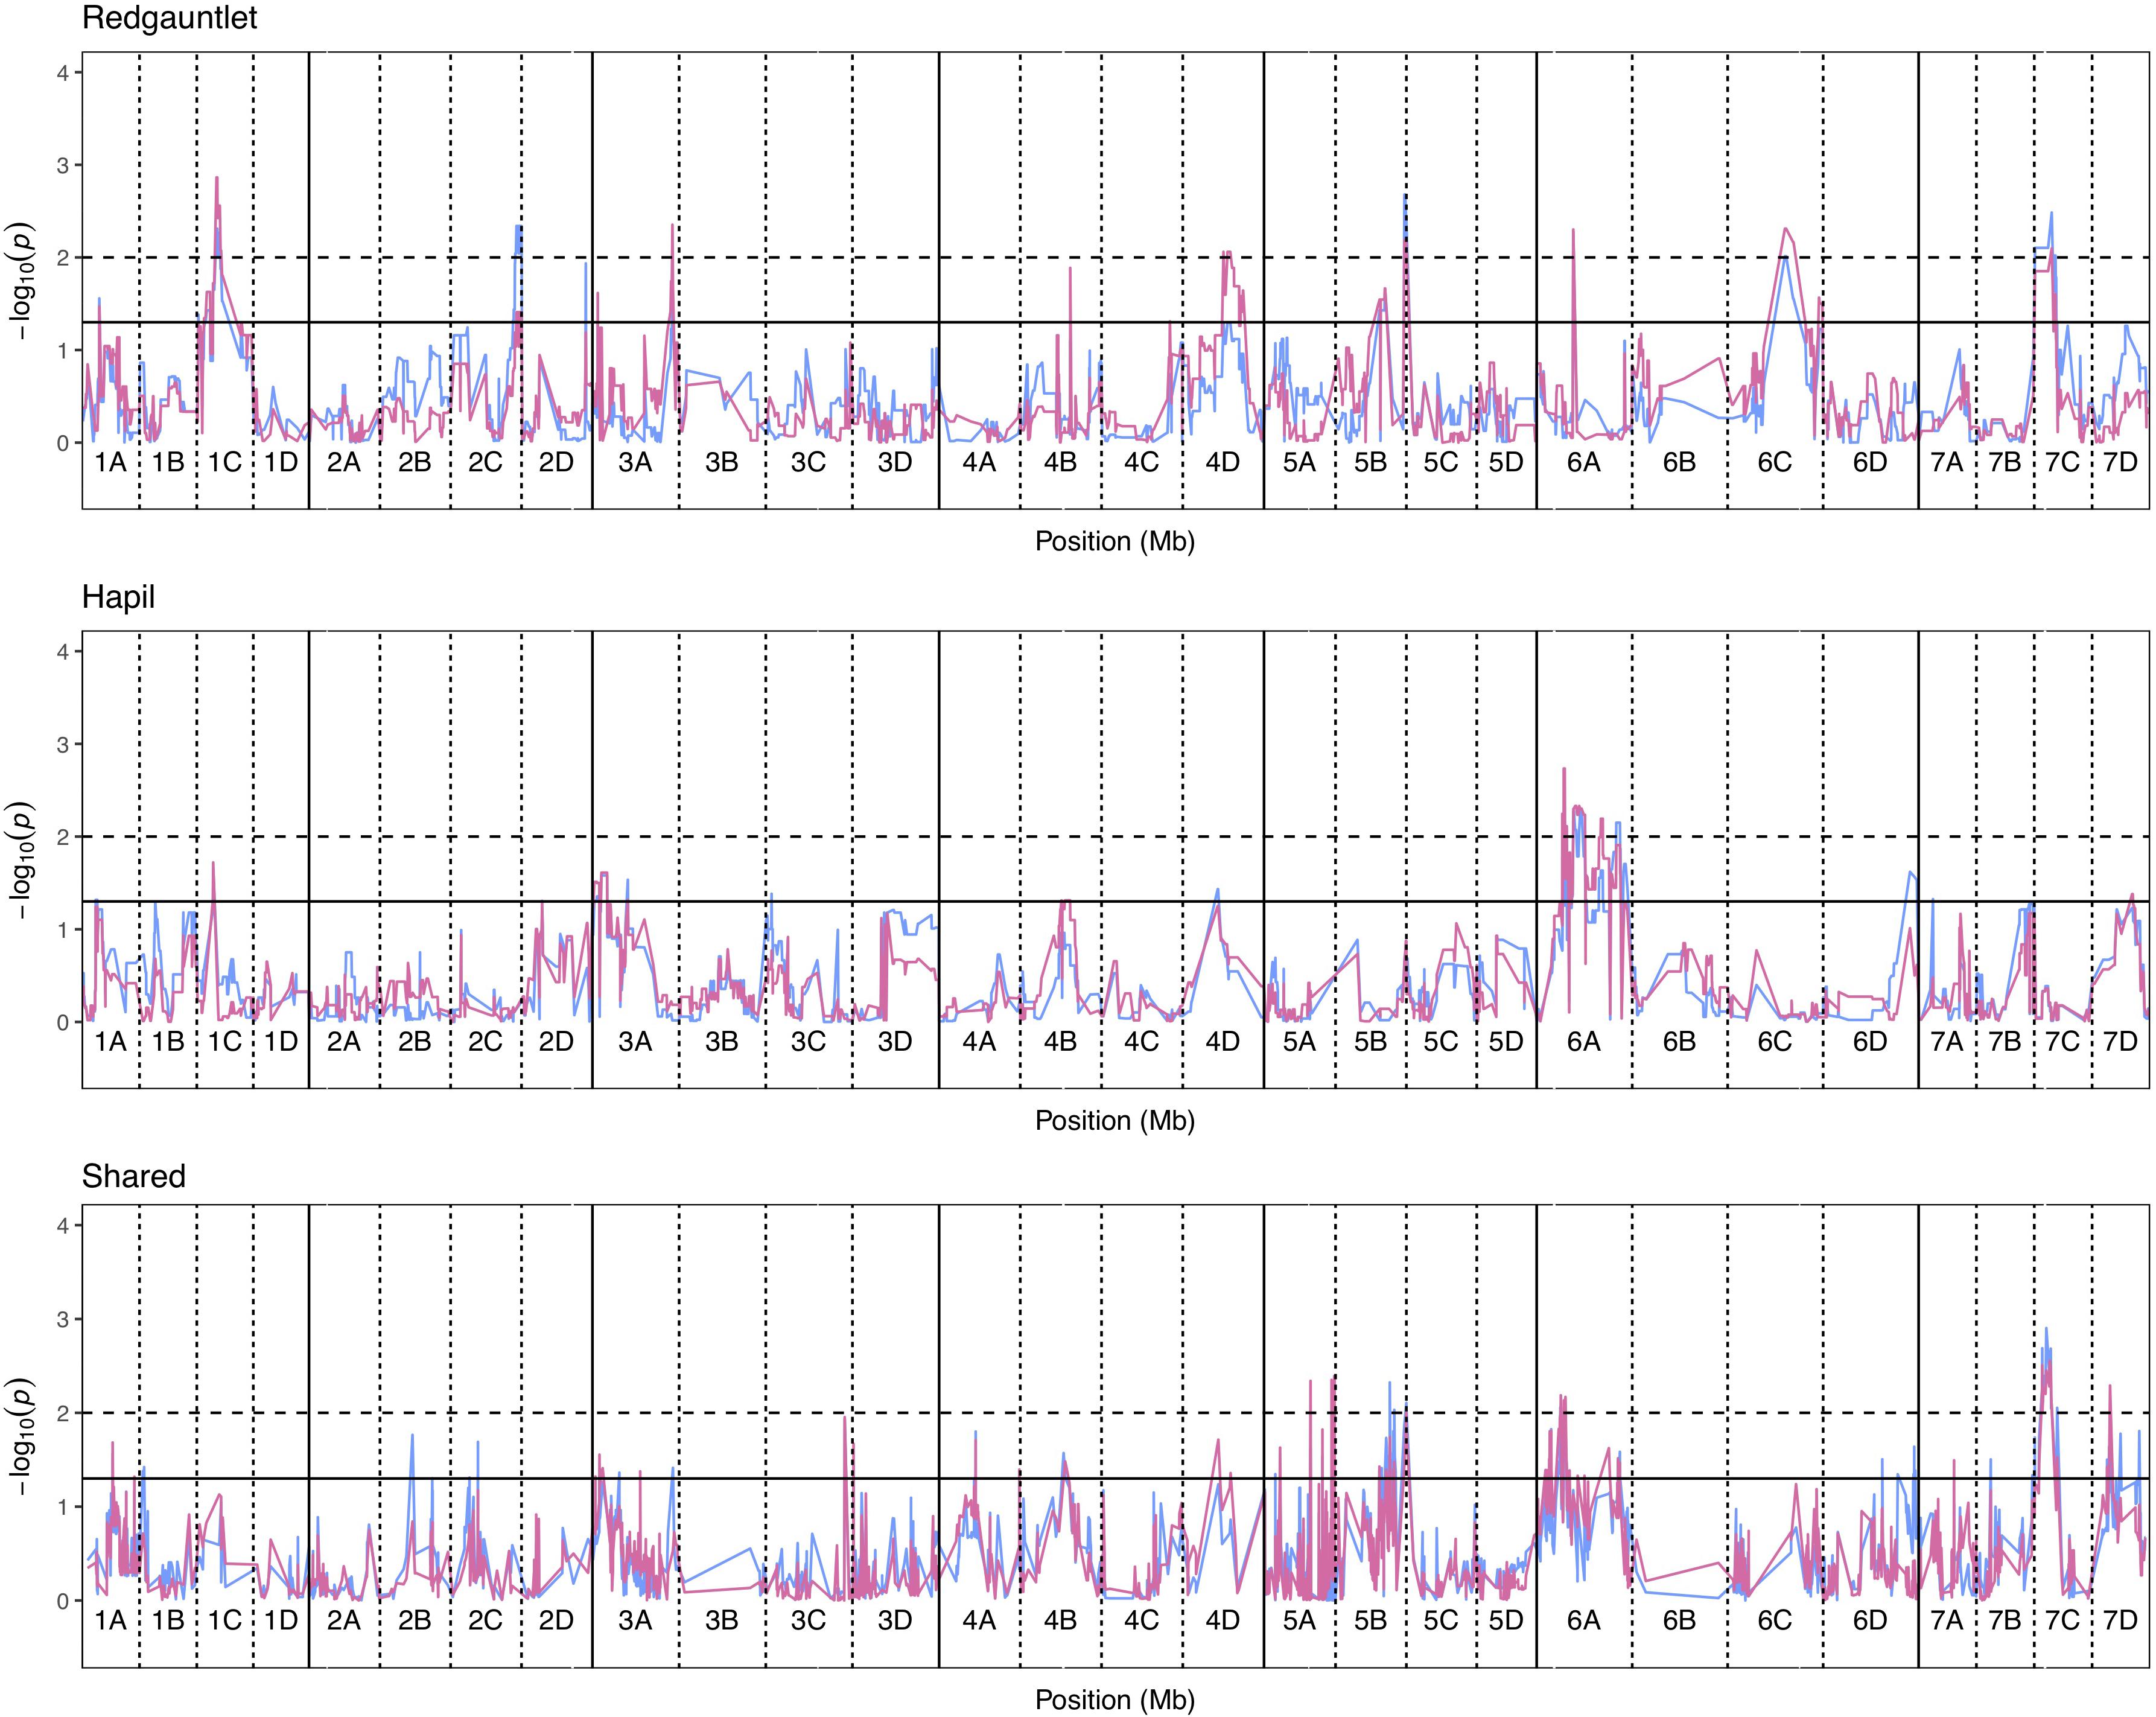
Figure 3. Kruskal–Wallis −log10 p-values denoting the association of single nucleotide polymorphisms with strawberry Verticillium dahliae automated and manual disease scores at each position in the octoploid strawberry genome in cM. Panels represent markers segregating in “Redgauntlet”, “Hapil” and both parents. Labels 1A–7D denote the 28 linkage groups. Solid horizontal line is p = 0.05, dashed horizontal line is p = 0.01. Color denotes phenotype measure blue- manual AUDPC, pink- NDVI-AUDPC.
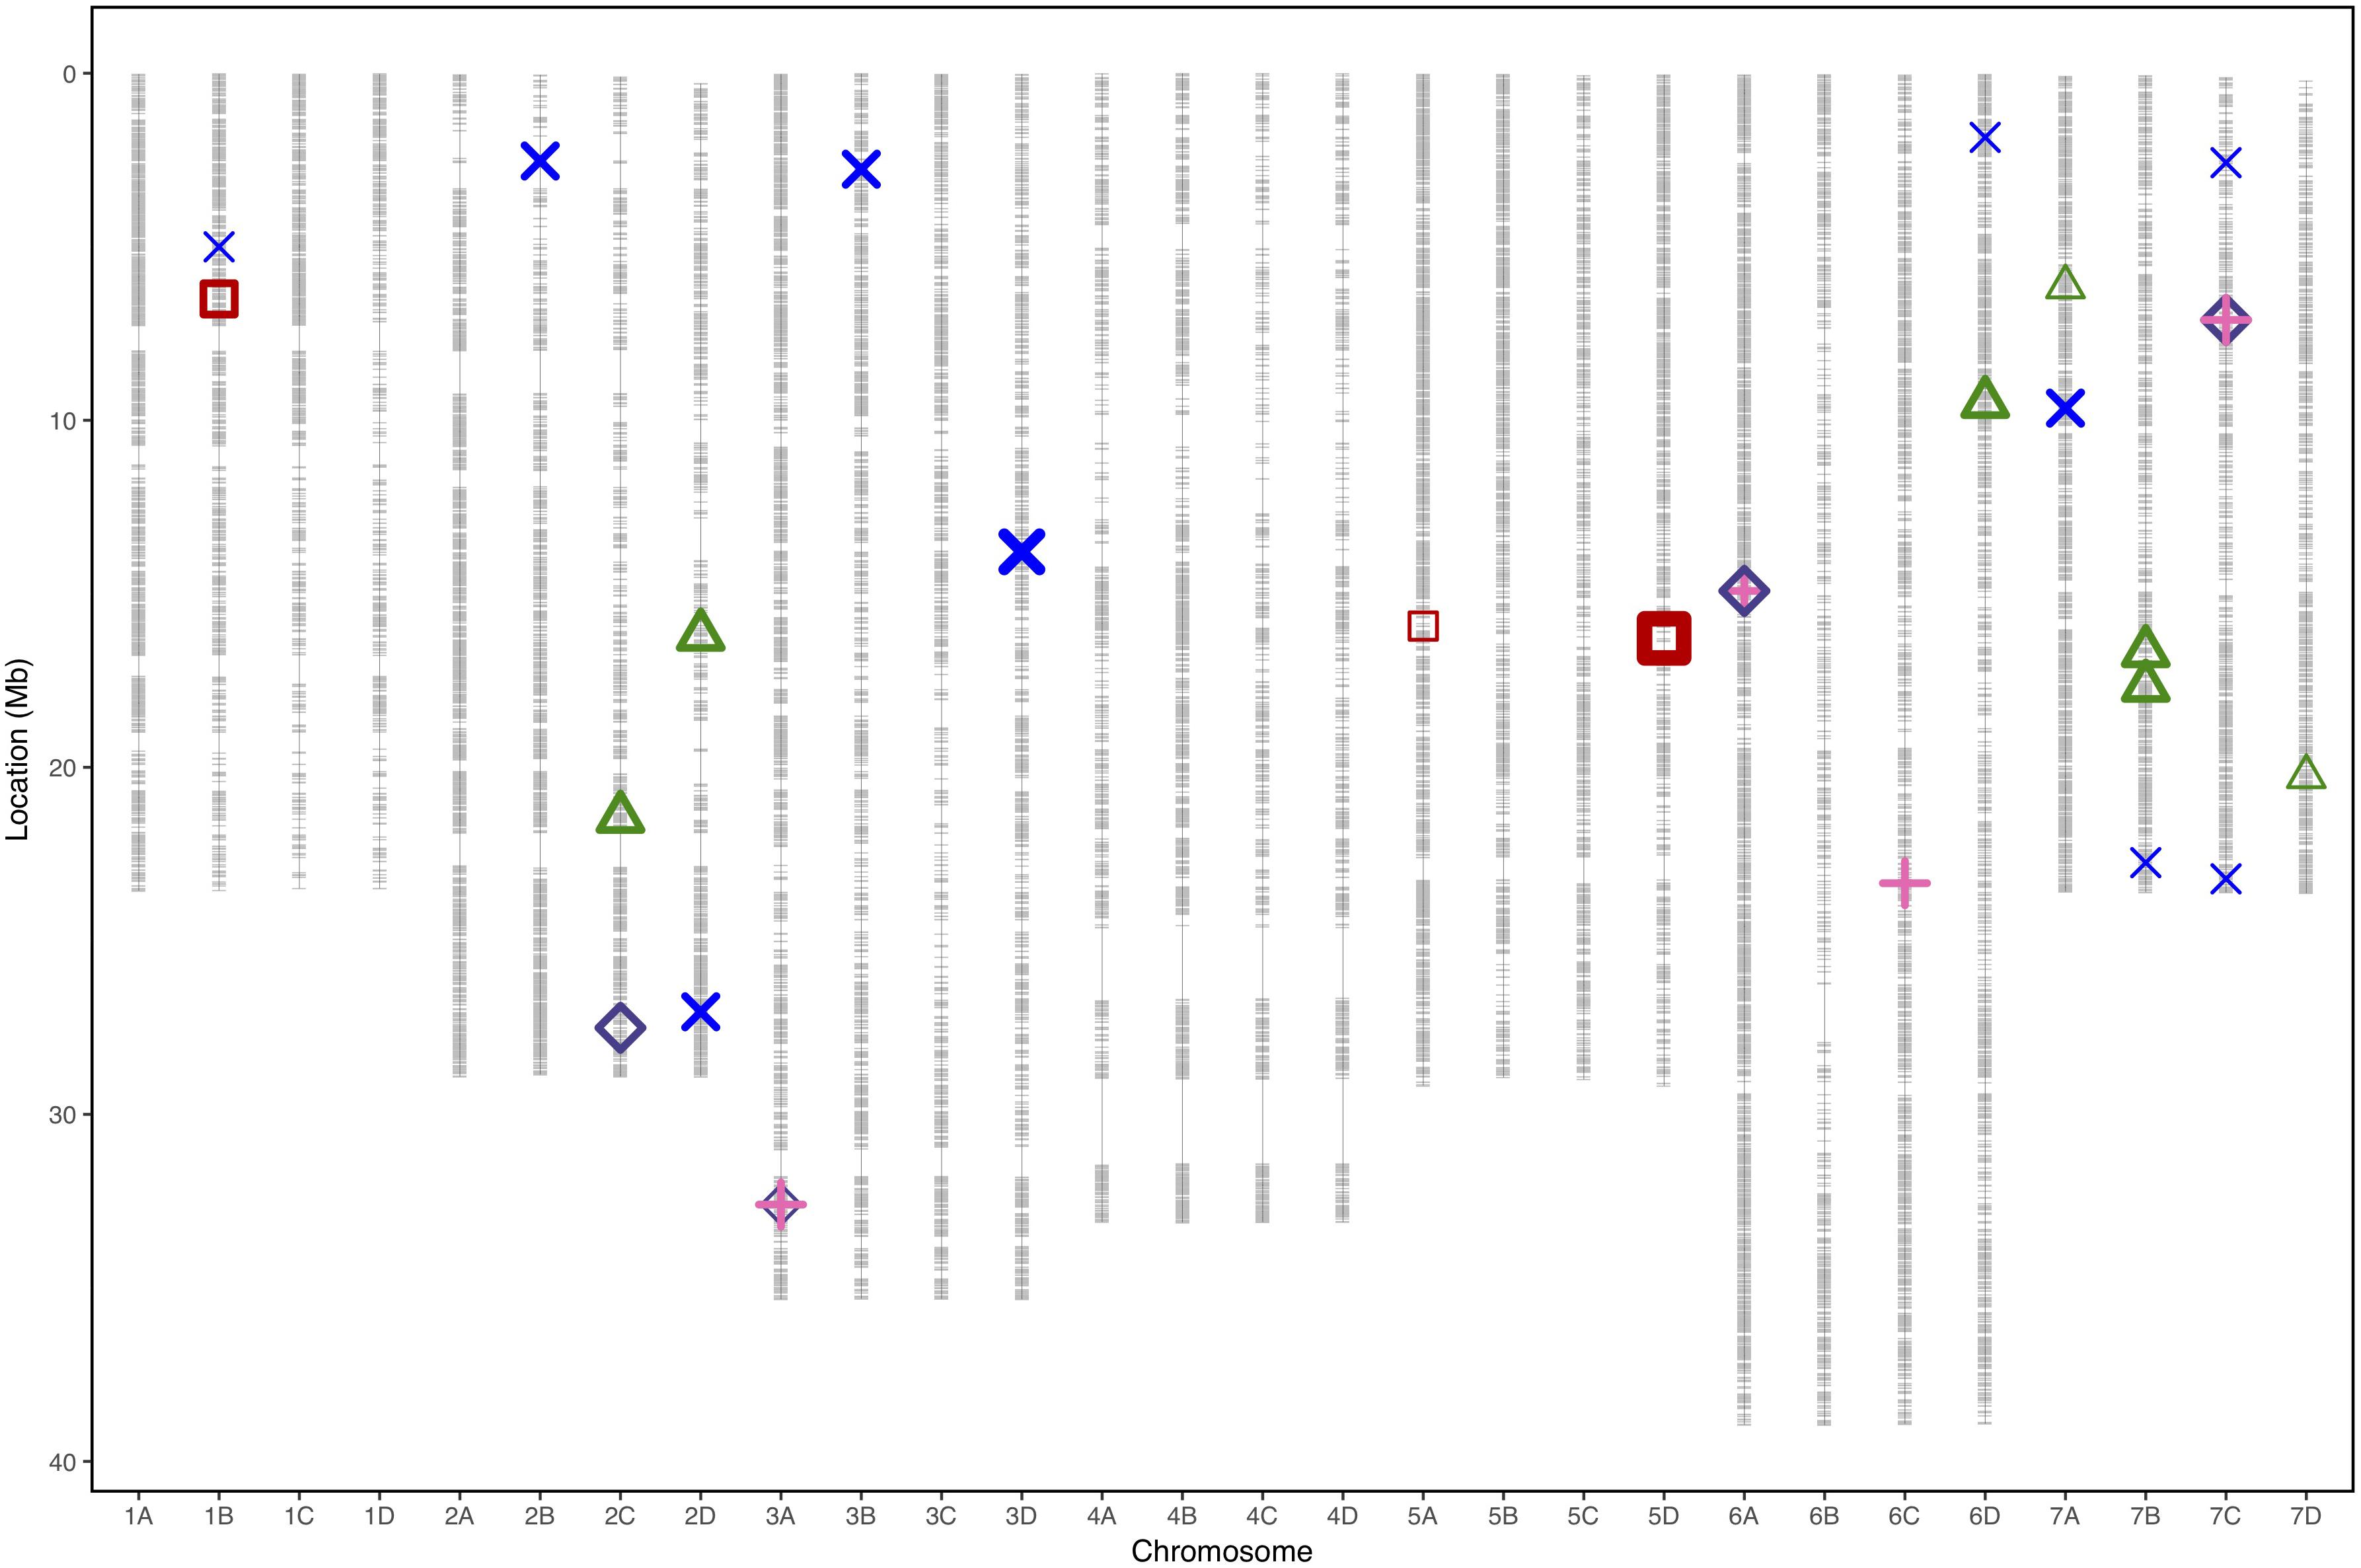
Figure 4. Physical marker positions of 35154 SNPs (gray) scaled to the Fragaria vesca genome (Hawaii 4 genome 2.0) in Mb for 28 linkage groups of octoploid strawberry (1A–7D). Quantitative trait loci associated with strawberry Verticillium dahliae disease resistance locations from each phenotyping event represented by points for “Emily” x “Fenella” 2016 (red squares), “Redgauntlet” x “Hapil” RxHa Best Linear Unbiased Estimate (2009, 2010, and 2011) (blue cross), RxHb 2017 manual scores (pink plus) and RxHb 2017 automatic scores (purple diamond) and “Flamenco” x “Chandler 2016 (green triangle). Points are weighted based on significance with thicker lines representing greater significance.
QTL Mapping in Four F1 Full-Sib Mapping Populations
In total, four populations were assessed for resistance to V. dahliae. Twenty-five focal markers for V. dahliae resistance were identified in the RxHa, RxHb, ExF, and FxC populations of strawberry (Figures 3–7 and Table 1). Twelve of these focal markers were considered to have a moderate effect with greater than 10 percent impact on disease score across the population. When comparing the observed versus expected disease scores the coefficients of determination, the focal markers explain between 25 and 68% of the observed mean disease scores between progeny members (Table 2).
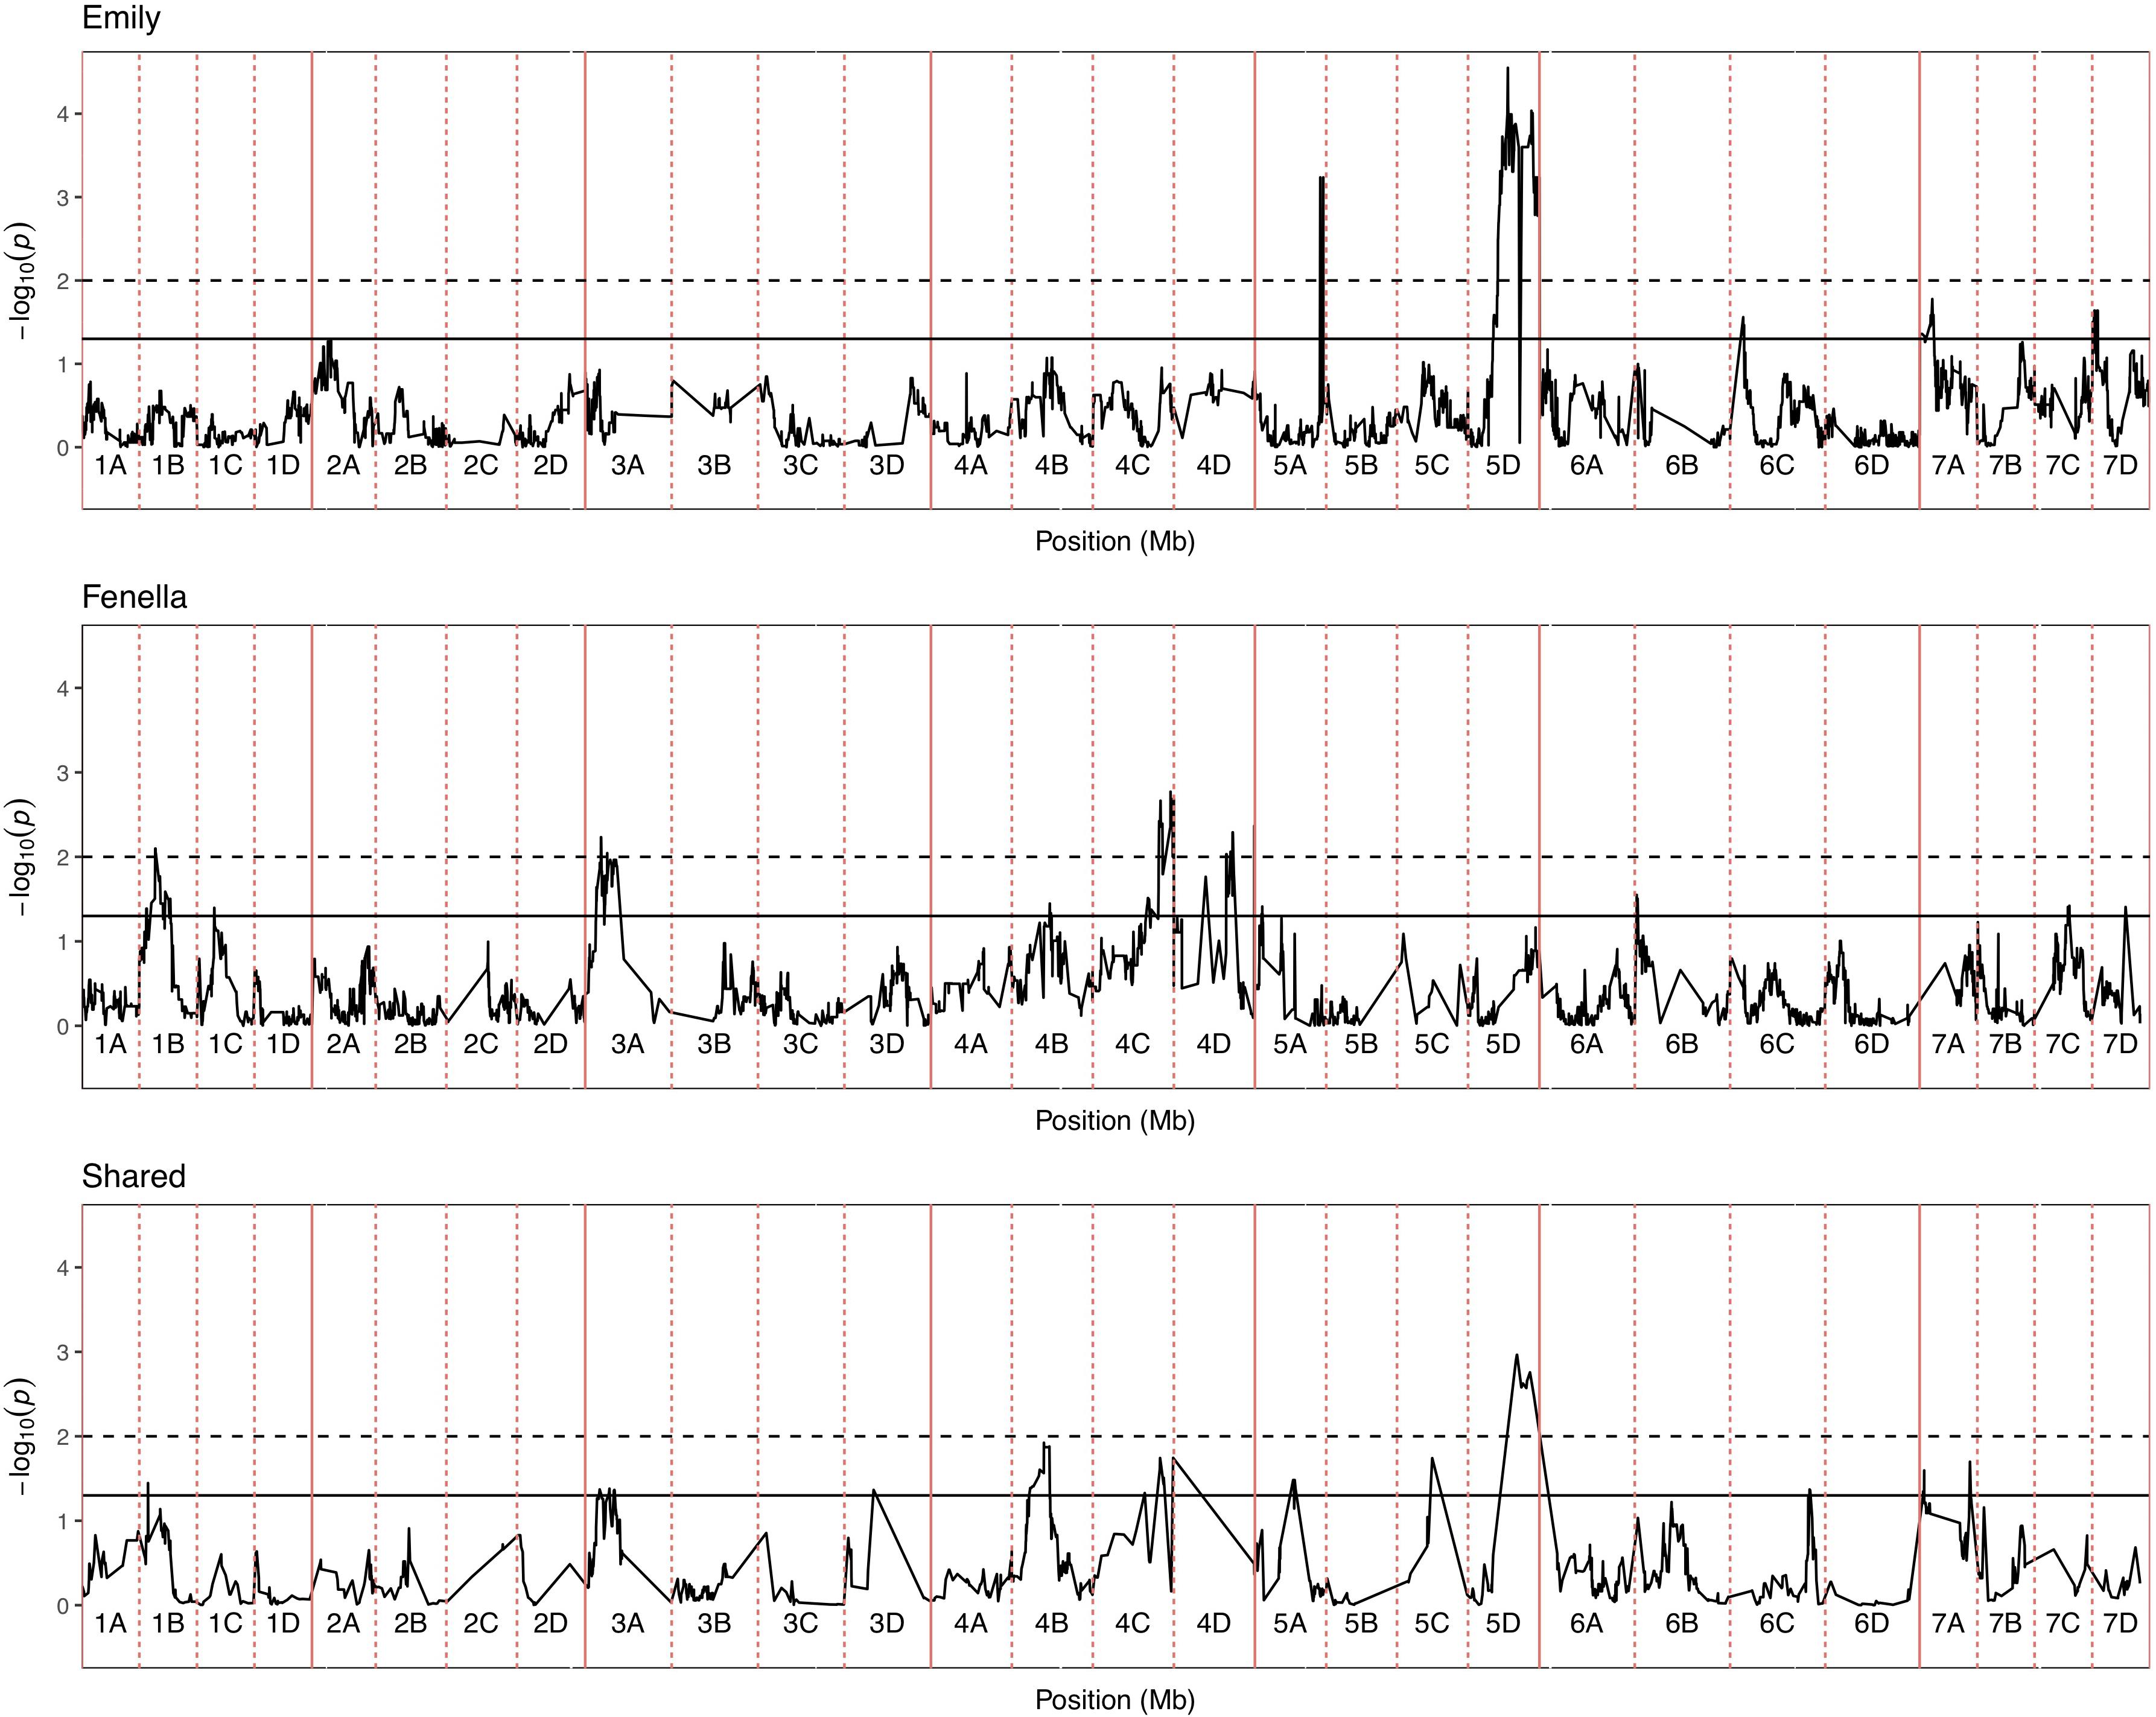
Figure 5. Kruskal–Wallis -log10 p-values denoting the association of single nucleotide polymorphism with strawberry Verticillium dahliae disease scores at each position in the octoploid strawberry genome in cM. Panels represent markers segregating in “Emily,” “Fenella” and both parents. Labels 1A–7D denote the 28 linkage groups. Solid horizontal line is p = 0.05, dashed horizontal line is p = 0.01.
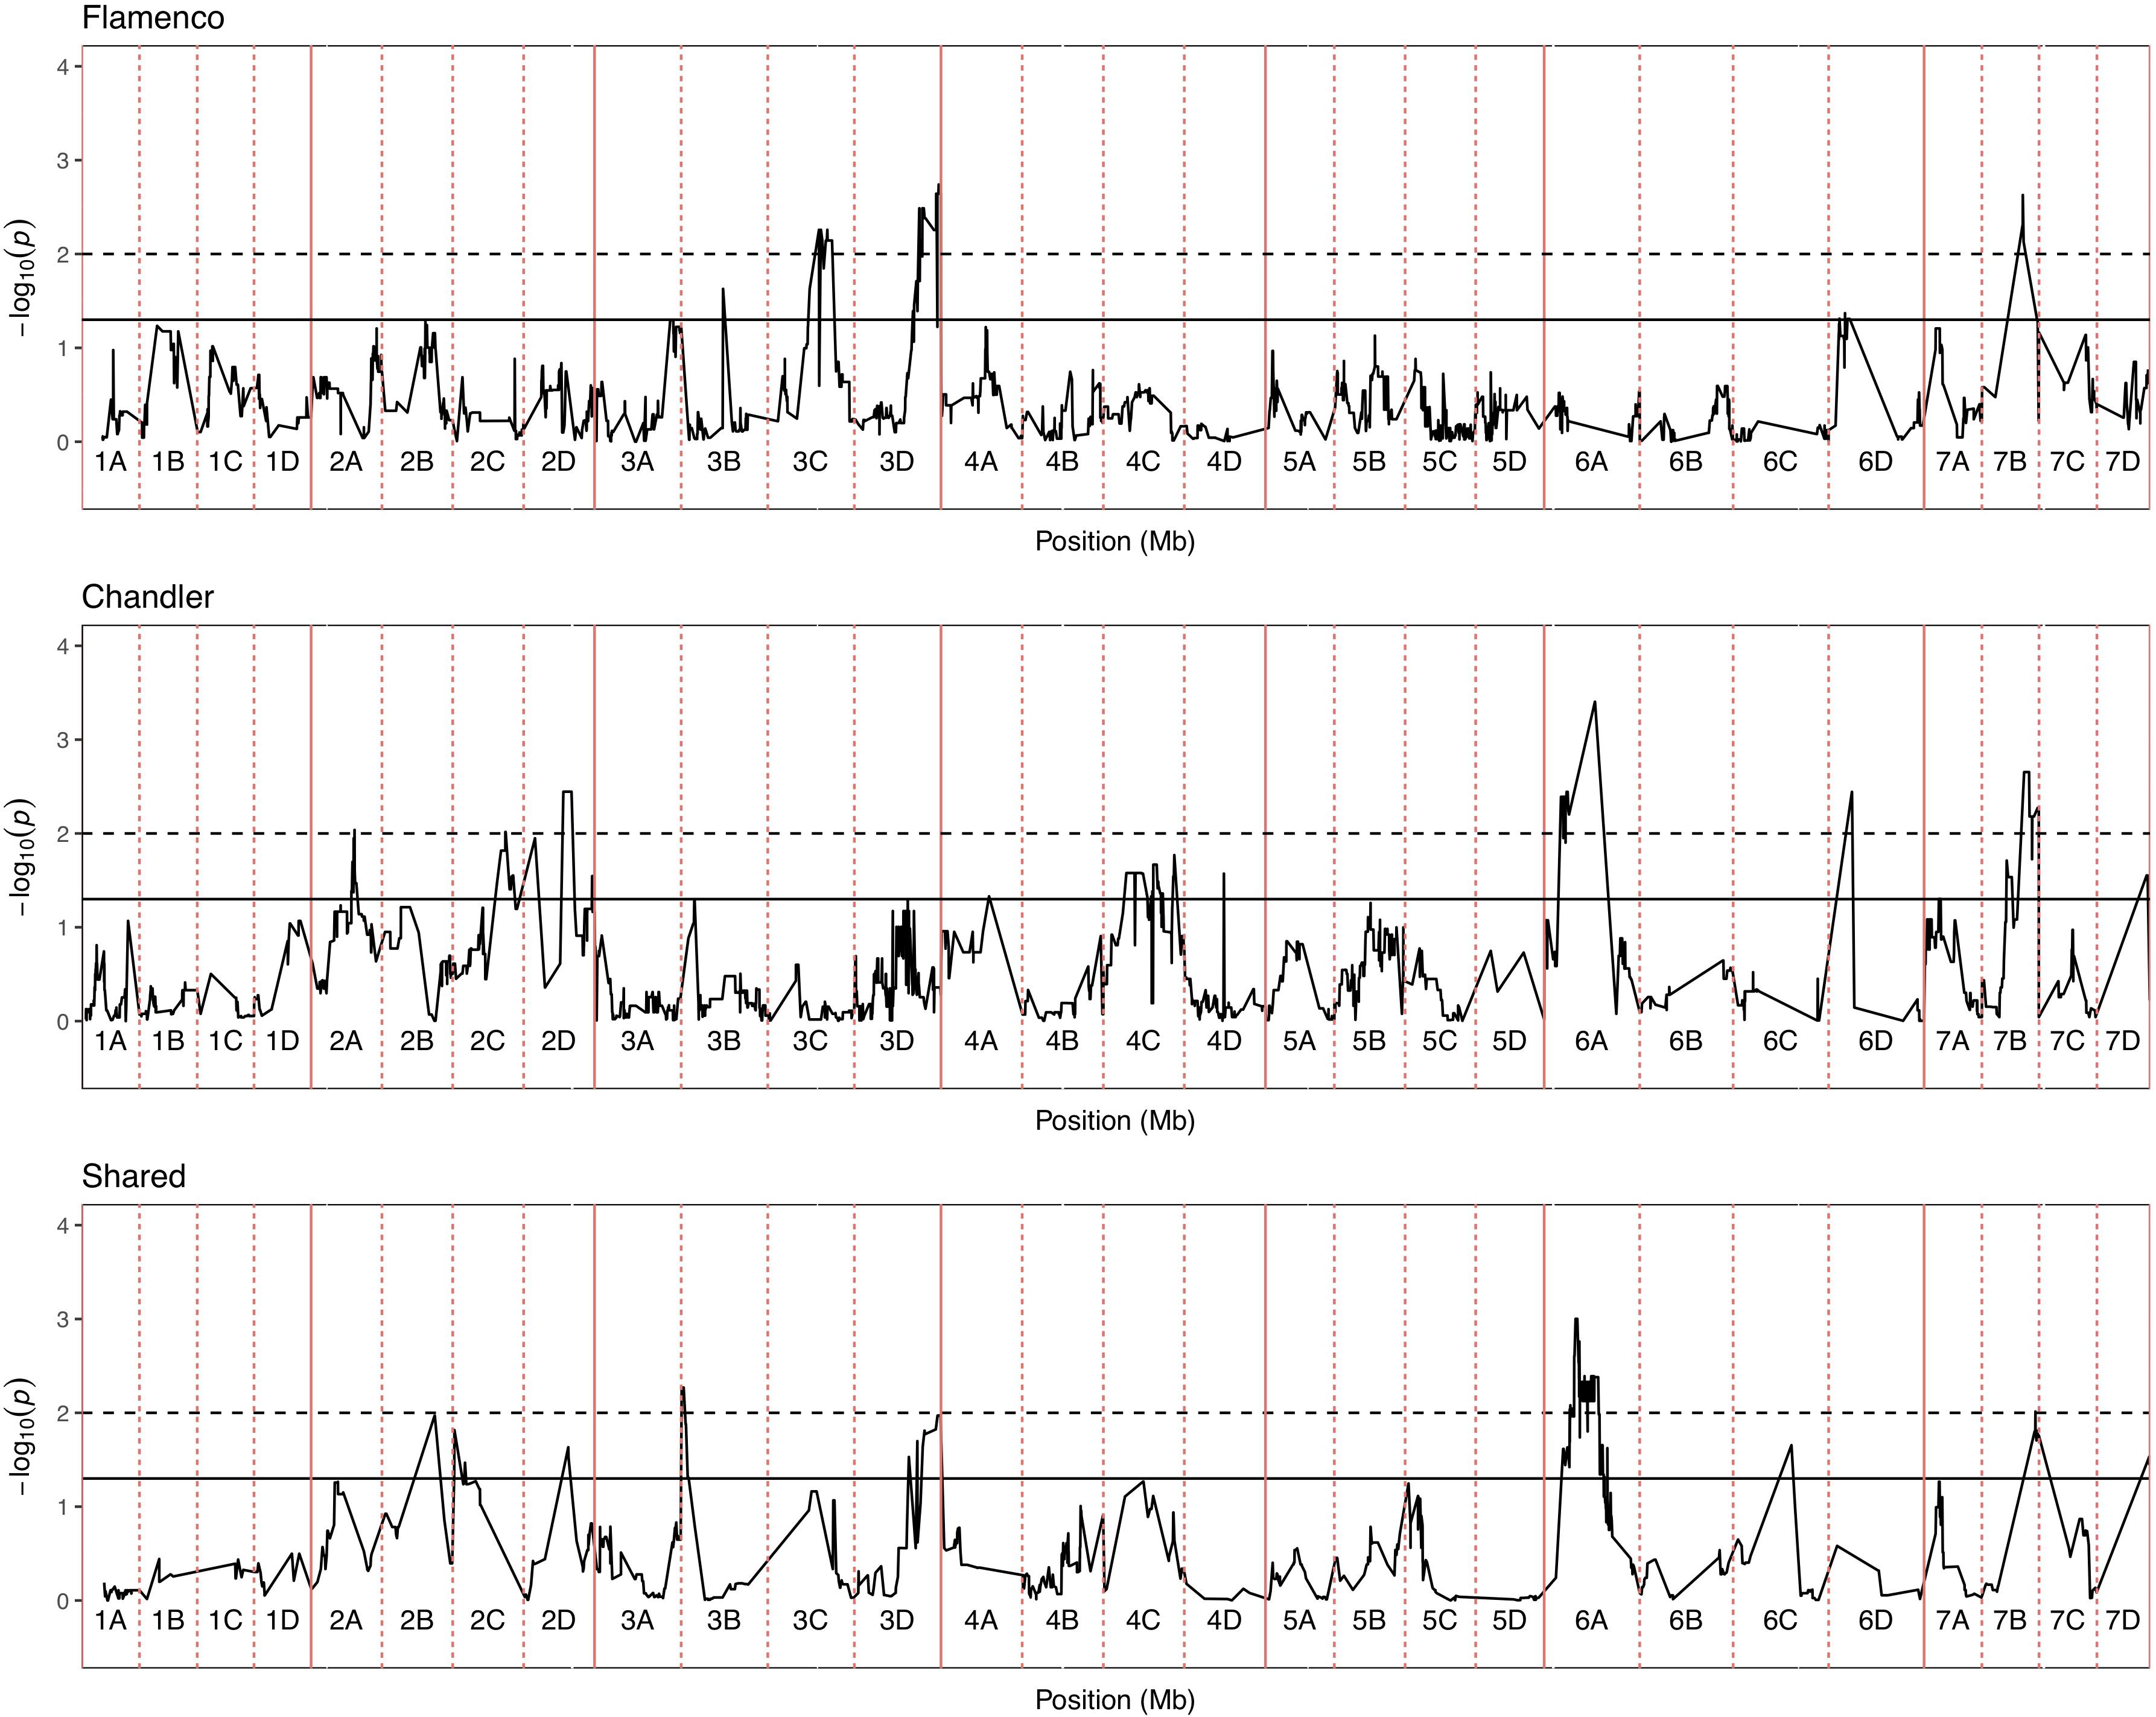
Figure 6. Kruskal–Wallis −log10 p-values denoting the association of single nucleotide polymorphism with strawberry Verticillium dahliae disease scores at each position in the octoploid strawberry genome in cM. Panels represent markers segregating in “Flamenco,” “Chandler” and both parents. Labels 1A–7D denote the 28 linkage groups. Solid horizontal line is p = 0.05, dashed horizontal line is p = 0.01.
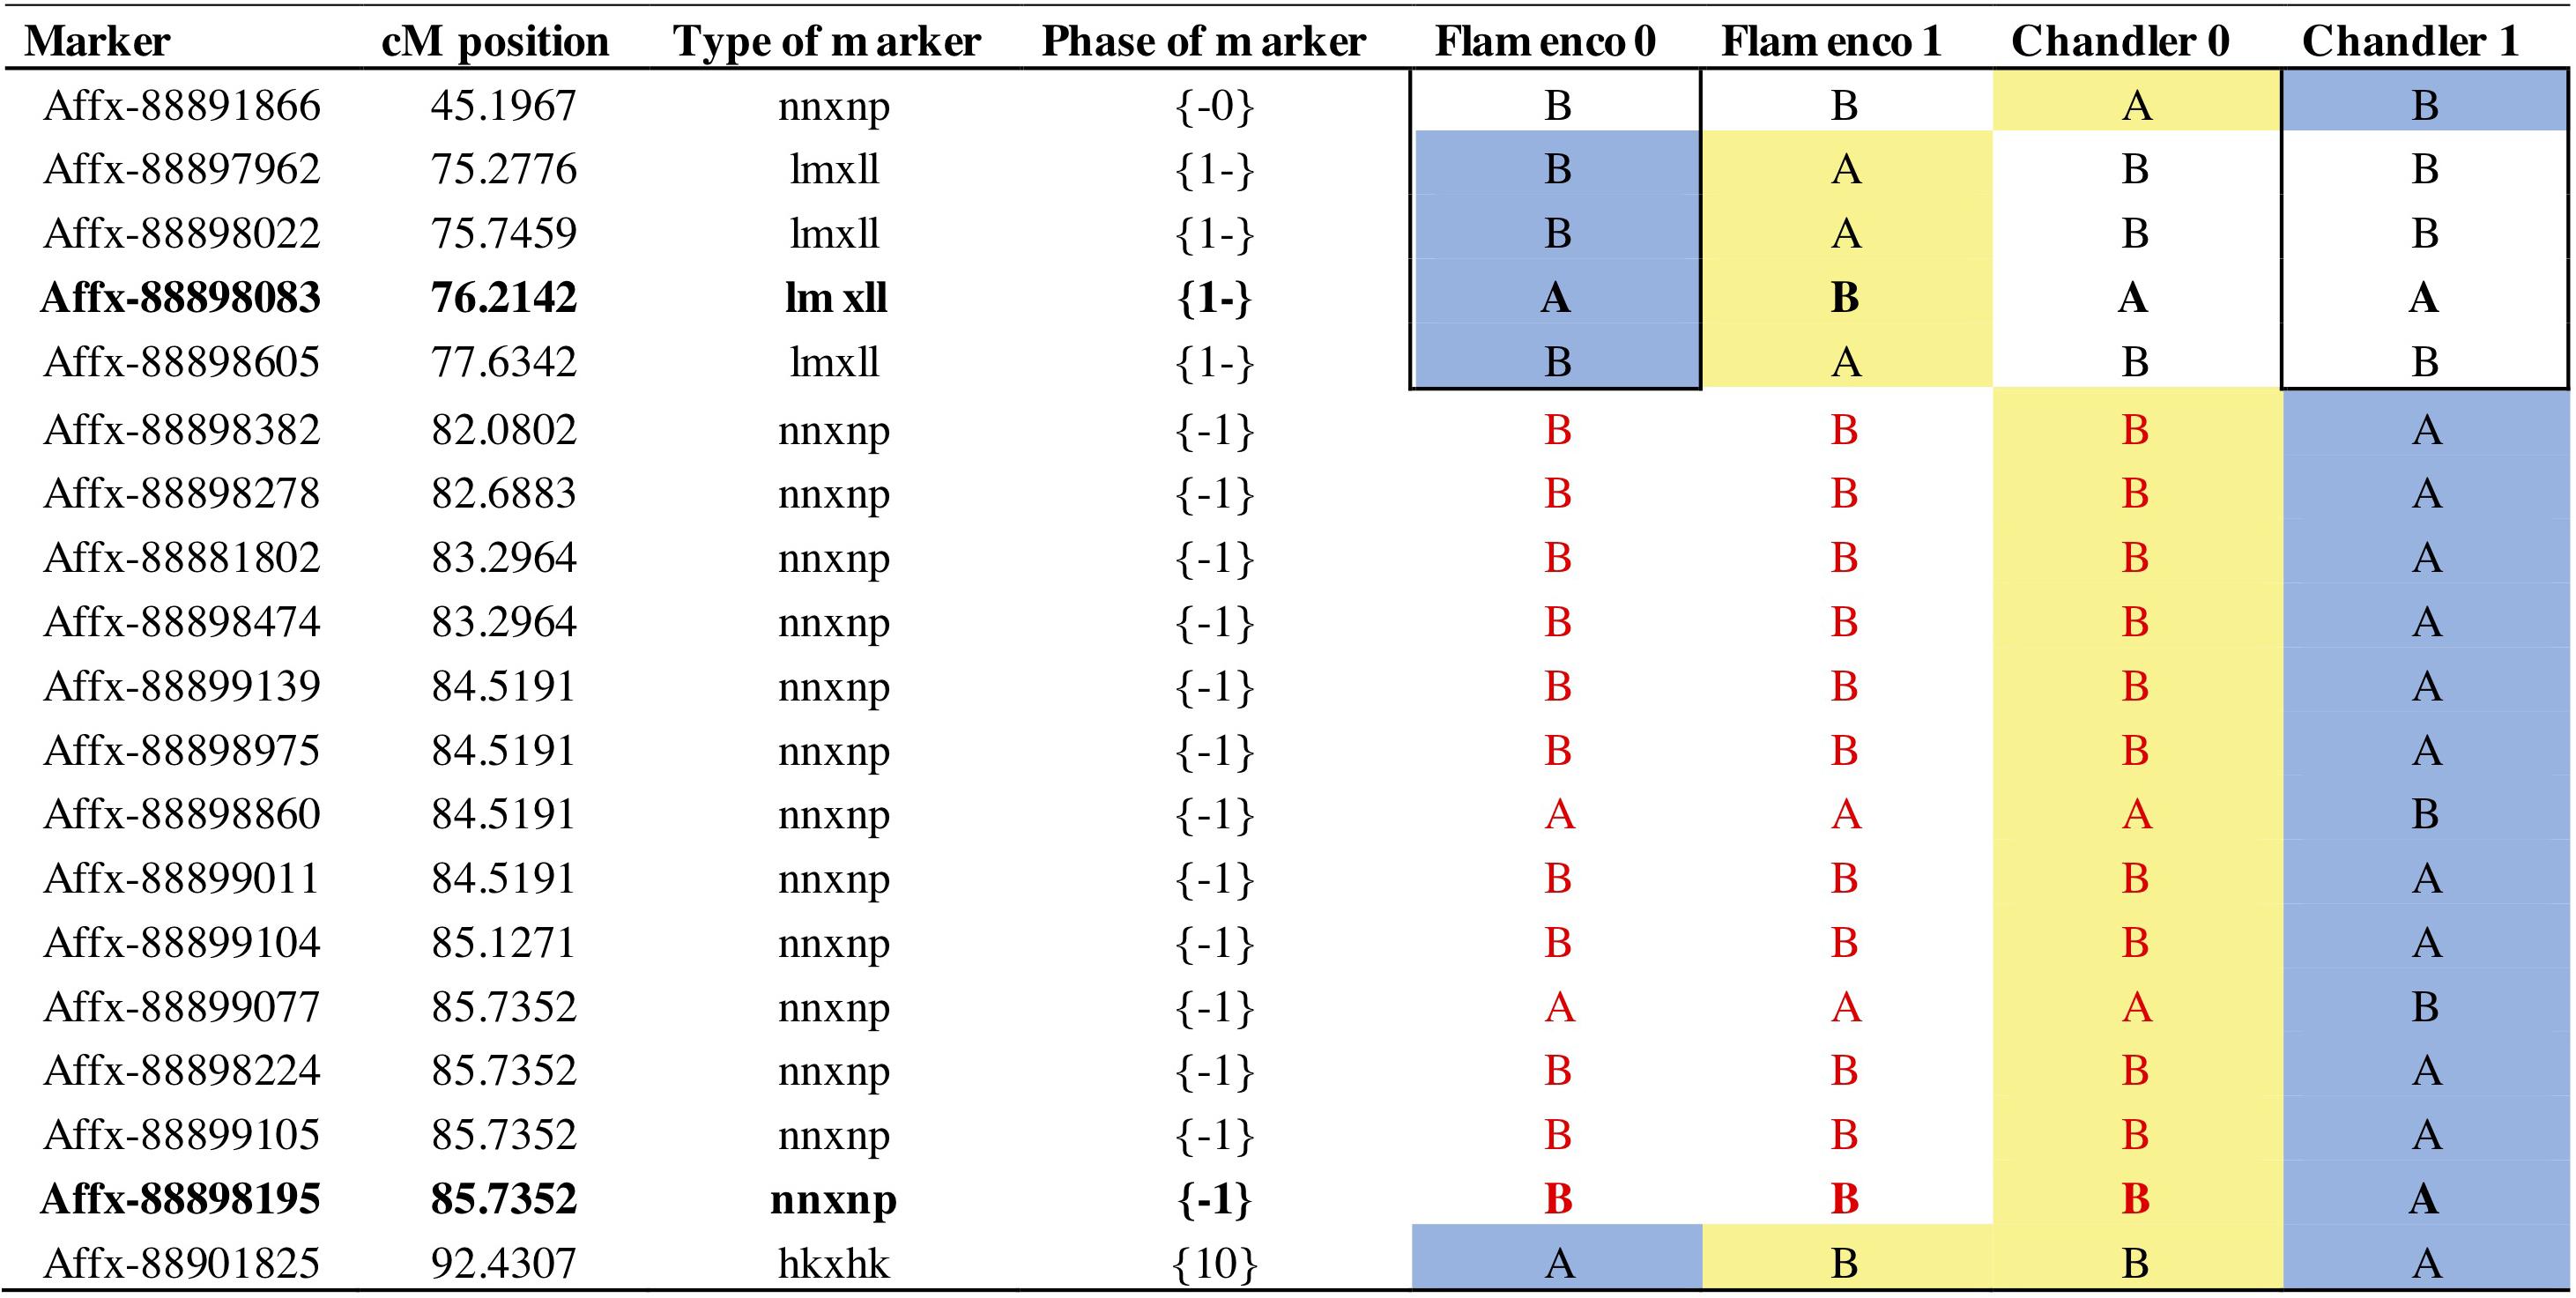
Figure 7. Parental markers on linkage group 7B for phase 0 and 1. Phase represents the grandparental haplotypes (0 or 1) for each parent denoted by the position {maternal or paternal} shared markers denoted in both positions. Bold text represents focal SNP markers; Affx-88898083 represents the focal marker FaRVd7B and Affx-88898195 represents the focal marker FaRVd7B2. Red text represents a shared haploblock. A blue background denotes markers associated with resistance and yellow background denotes markers associated with susceptibility.
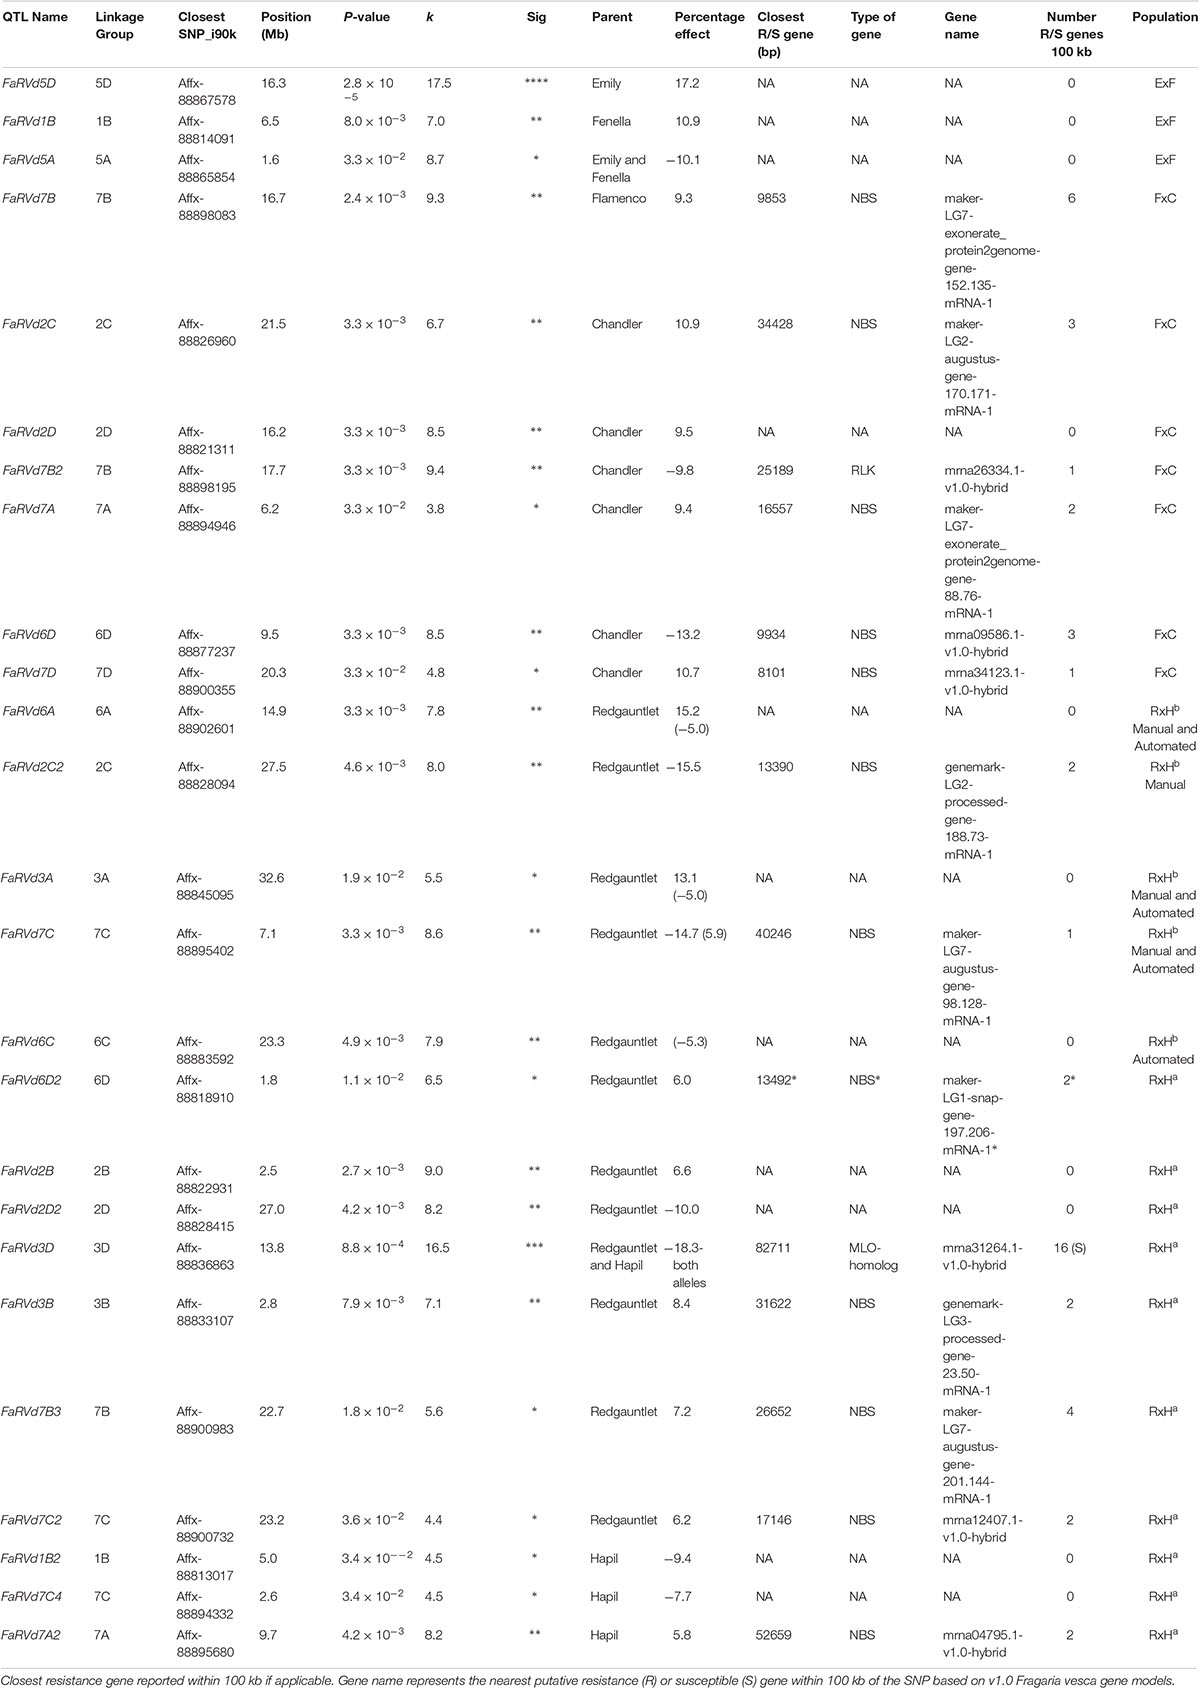
Table 1. Focal SNPs linked with each quantitative trait loci associated with strawberry Verticillium dahliae disease resistance identified through the Kruskal–Wallis analysis.
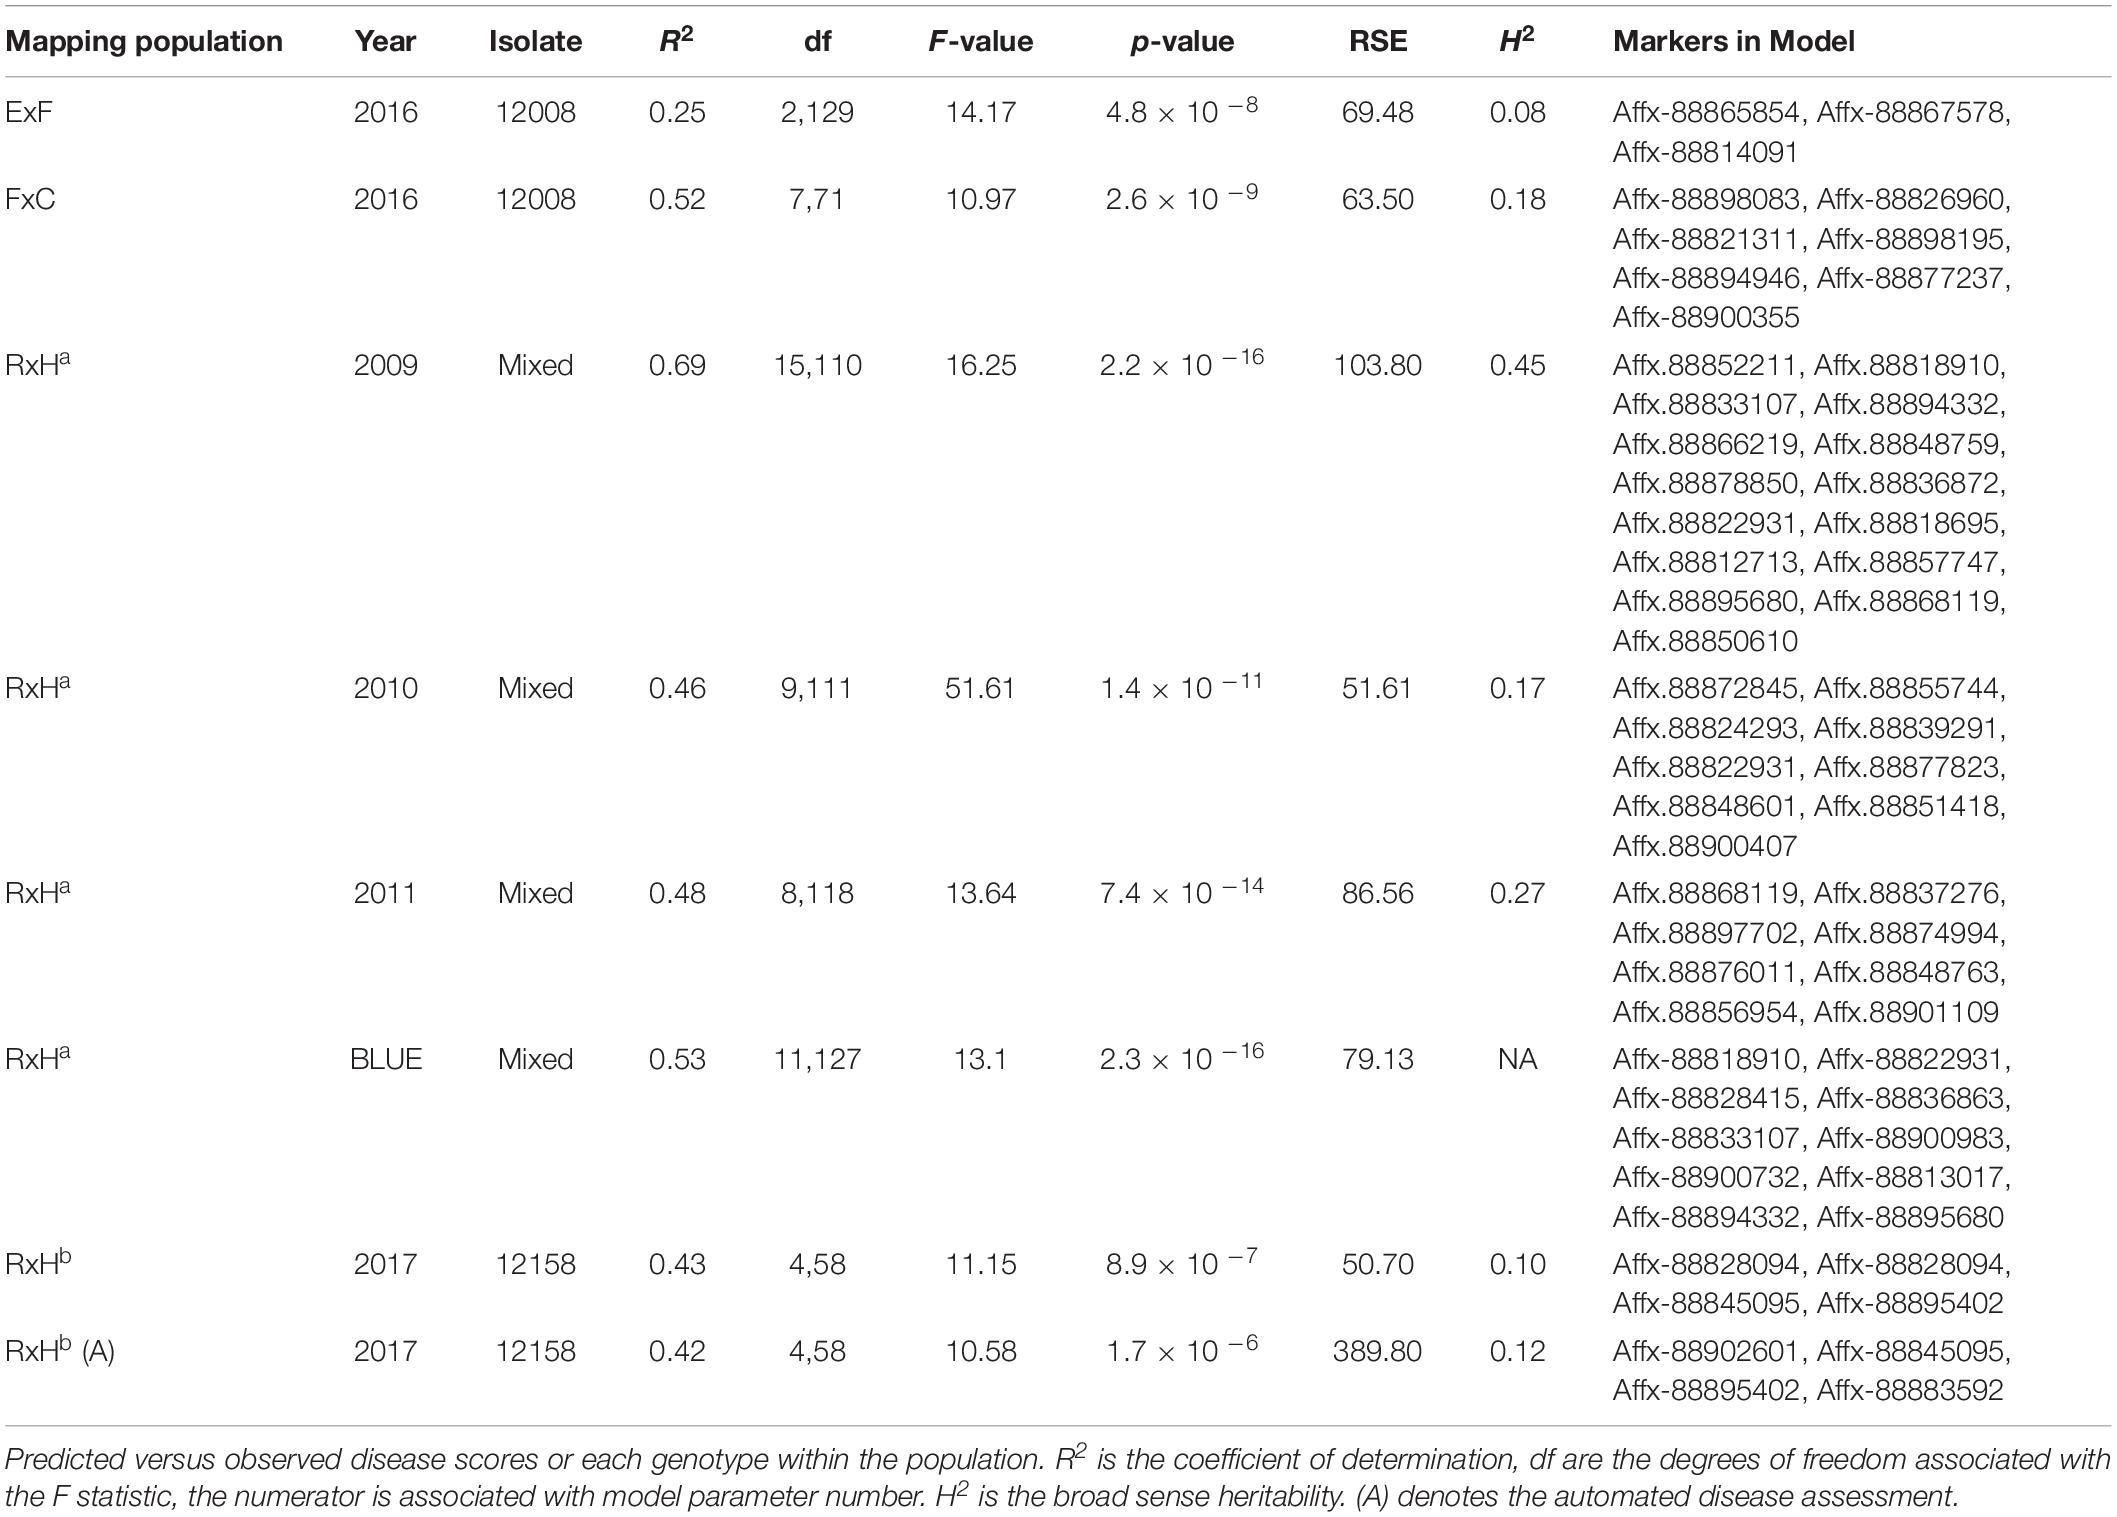
Table 2. Model parameters for the predictive linear model for each phenotyping event.
Resistance Markers Found Close to Neighboring Resistance Genes
A total of 14 out of 25 markers identified were located within 100 kb of a putative resistance gene found in F. vesca (Table 1), each of which indicating a potential target for further study. Twelve resistance markers were found to be within 100 kb of a putative resistance gene containing a NBS. NBS containing genes were more frequently associated with resistance focal SNPs than markers selected at random (p = 0.0073–0.0017, n = 10,000; Supplementary Figure S3). Nine of the twelve NBS genes contained an NB-ARC domain, however, NB-ARC domain containing genes were not more frequently associated with resistance focal SNPs than markers selected at random (p = 0.066–0.024, n = 10,000; Supplementary Figure S4).
Improved QTL Identification With SNP Data
Newly generated SNP data has allowed the analysis of the RxHa mapping population wilt phenotypic data reported in Antanaviciute et al. (2015). Our new analyses identified four different loci represented by SNP markers which are located on the same linkage groups as four of the QTL previously reported using the SSR marker analysis (Antanaviciute et al., 2015) and six novel resistance QTL. The original SSR markers associated with wilt resistance all mapped to the same chromosome as originally reported, however, different sub-genomes were assigned when following the linkage group nomenclature stipulated by van Dijk et al. (2014) and Sargent et al. (2015). The QTL RVd1 maps to linkage group 3B and is located 2.7 Mb from the FaRVd3B SNP marker. RVd3 maps to linkage group 7A and is 6.4 Mb from FaVd7A2. RVd7 maps to linkage group 2D and is 1.2 Mb away from FaRVd2D2. RVd4-M1 mapped to linkage group 2B, however, it is not considered to represent the same QTL as FaRVd2B as it was mapped 12.6 Mb away. The RxHa SNP strawberry map has a greater density of segregating loci (3451) than the SSR map (1133) therefore the SNP data allows greater accuracy of QTL mapping which, when combined with the consensus map, assists the comparison of alleles to other phenotyped populations. Discrepancies between the two analyses can be explained by the removal of 13 rogue individuals, the use of AUDPC phenotyping measure and BLUE calculated across multiple years of phenotyping, in comparison the original analysis used data from the single most heritable scoring event for each year.
Overlap of Resistance Markers Between Cultivars
The resistance marker FaRVd7B identified in ‘Flamenco’ and FaRVd7B2 in ‘Chandler’ are 9.5 cM and 1 Mb apart, however, the analysis of haploblocks revealed that these two markers represent discrete resistance loci present on different haplotypes (Figure 7). Shared markers indicate that the resistance marker from “Flamenco” and “Chandler” contribute to resistance in an additive fashion. The haploblock representing the marker FaRVd7B is associated with resistance in “Flamenco” is also present in “Chandler,” however, it is associated with susceptibility. This low transferability indicates that marker tagging the resistance haplotype FaRVd7B is not in linkage disequilibrium with the resistance gene.
The resistance markers FaRVd1B and FaRVd1B2 from population RxHa and ExF, respectively, are positioned 1.5 Mb apart on linkage group 1B (Table 1). Comparison of haploblocks across the two-populations allowed us to determine whether the two markers represent the same resistance allele. Although the focal markers are reciprocally monomorphic, analysis of shared polymorphic neighboring markers indicated that the resistant markers are present on different haplotypes and therefore represent discrete resistance loci.
No overlap in markers was observed between resistance loci identified between the RxHa combined analysis and the RxHb populations screened with mixed inoculum and subclade II-2 inoculum, respectively (Table 1). By contrast, the marker Affx-88837276 identified on linkage group 7C was 0.72 Mb from the focal marker identified in the RxHa 2011 phenotyping event indicating the possibility of an overlapping QTL associated with resistance to different isolates.
The aforementioned co-dominant shared marker, FaRVd3D, was identified in both “Redgauntlet” and “Hapil” cultivars; this is a shared resistance QTL between the two cultivars. The shared marker FaRVd5A identified a resistance allele present in both “Emily” and “Fenella” cultivars whereby homozygous genotypes containing two resistance alleles are required to observe significant levels of resistance.
Validation of Two Resistance Markers Across the Wider Germplasm
Identification of substitute i35k SNPs co-localizing with focal SNPs identified in the i90k F1 mapping population analysis allowed focal markers to be screened across the wider germplasm (Supplementary Figure S5 and Supplementary Table S3). Two of the focal SNPs identified in the F1 cross studies maintained a strong association with resistance across the validation accessions. FaRVd2B identified in “Redgauntlet” (X2(4,5;1) = 5.72; p = 0.017) and FaRVd6D identified in “Chandler” (X2(4,6;2) = 7.47; p = 0.024) explained 13.4 and 2.2% of the variation in disease scores observed in the validation germplasm, respectively.
Discussion
Description of Resistance
Multiple sources of resistance to Verticillium wilt were observed across six strawberry cultivars indicating a wealth of genetic resources that can be exploited by breeders. Similar studies have also found multiple sources of resistance to V. dahliae in strawberry, and all alleles were found to be dominant (Govorova and Govorov, 1997). We observe that the dominantly inherited allele FaRV5D (Affx-88867578) is associated with an increase in susceptibility (Figure 8). It is impossible to know from this work whether FaRV5D is a susceptibility factor or whether it represents an additive resistance allele which is in repulsion to the identified marker. Further work, through selfing “Emily,” or through crossing heterozygous ExF progeny would generate the missing homozygous class and reveal the inheritance of this resistance allele more clearly. Should FaRV5D be found to represent a recessive resistance allele it could prove a valuable tool for strawberry breeders. Resistant homologs of susceptibility factors have been shown to be highly robust, with exploitation lasting for 50 years in the field (Kang et al., 2005; Pavan et al., 2010), therefore utilization of such a resistance incidence could prove a highly robust strategy to prevent against Verticillium infection.

Figure 8. Phasing and marker effect sizes for the FaRVd5D focal SNP and neighboring shared markers. Parental phased haploblocks for linkage group 5D represented in “Emily 0”, “Emily 1”, “Fenella 0” and “Fenella 1” columns, Red haplotype associated with susceptibility. Grand phenotype means for each marker class represented under marker classes denoted “ll”, “lm”, “hh”,”hk”, “kh” and “kk”; ll/lm represents markers that segregate in the maternal parent, hh, hk, kh and kk represents markers that segregates in both parents. cM – centimorgan distance along linkage group 5D, p – probability for the k – Kruskal–Wallace test statistic testing differences between marker classes.
A resistance QTL was identified in both “Redgauntlet” and “Hapil” cultivars on linkage group 3D. Analysis of parental and shared markers in this region indicated resistance alleles from both parents co-localized to the same location and thus represent the same QTL. This QTL was termed FaRVd3D and could be best represented by haploblocks phase 1 “Hapil” and phase 0 “Redgauntlet.” Both alleles are required in order to observe the greatest combined resistance effect thus indicating that this QTL was inherited in a co-dominant fashion.
Genotypes exhibit large variation in the disease response when compared to variation across genotypes. The variation is represented by large standard error values (Supplementary Figure S2) and the corresponding low broad sense heritability values (Table 2). The high correlation between automated and manual phenotyping values, validates the manual phenotypic scores. We can therefore conclude that the large variation associated with disease score reflects the truly variable nature of the Verticillium disease responses in strawberry. This within-genotype variation has been observed previously and as such, high replication of genotypes in Verticillium trials (n = 10) mitigates this large variation and results in a greater phenotyping accuracy.
Transgressive Segregation
Transgressive segregation toward susceptibility was observed in the FxC population (Supplementary Figure S2) with 7.5% of progeny exhibiting a significantly higher disease symptoms than that of the parents. The parental cultivars “Flamenco” and “Chandler” are related, namely “Chandler” is the grandparent of “Flamenco.” Reports that inbreeding results in increased susceptibility to plant diseases (Watt et al., 2013) alongside negative implications on other traits (Maas and Galleta, 1996) support the observation of increased susceptibility after crossing two related parents. Transgressive segregation toward susceptibility indicates that the two parental lines contain different resistance alleles (Geiger and Heun, 1989), indeed we do not identify any shared markers or loci between the two parents, however, only one significant marker was identified in “Flamenco.” Nonetheless, this cross allowed the identification of a number of focal SNPs for further investigation.
Limitations of the i35k Phenotyping Platform
Phenotypic data was re-analyzed using the subset of i90k markers represented on the i35 SNP chip. The subset of i35k markers were associated with a slightly reduced power to detect resistance markers (Supplementary Figure S5). A surrogate i35k SNP marker could not be elucidated for FaRVd6D. The i35k focal SNP representing the FaRVd5D shifted 9.2 Mb and FaRVd1B2 had shifted 2.0 Mb. However, the remaining focal markers were detected within 0.8 Mb or less of the i90k focal SNP. The validation set of 92 cultivars was phenotyped using the streamlined i35k SNP chip. A targeted marker association analysis using the validation phenotyping event did not pull out any resistance markers, typically genome wide analysis requires a greater genotype number. Either a greater density of markers or a greater number of genotypes may allow the identification of resistance QTL present across the wider germplasm.
Environmental Factors
Variation in weather conditions can lead to variation in disease severity between years (Talboys and Bennett, 1969), the variation in disease development may explain differences observed in RxHa phenotyping events (Supplementary Figures S6, S7) (Keyworth and Bennett, 1951). Where variation in disease susceptibility was observed in cultivars of “Earliglow,” “Howard 17” and “Bounty” across different publications (Vining et al., 2015) this may be due to environmental variation or variation in the isolates subclade used for inoculations. Pre-inoculation of strawberry with low virulence V. dahliae isolates has been shown impact the virulence of pathogenic V. dahliae strawberry isolates (Diehl et al., 2013). Thus, the mix of isolates for RxHa trials and the presence of existing V. dahliae microsclerotia at trial sites may have influenced disease expression.
NBS Genes May Contribute to Verticillium Resistance
A high proportion of the resistance focal SNPs were associated with NBS resistance genes indicating that NB-LRR mediated signaling may play a role in strawberry Verticillium resistance. NBS genes have been implicated in Verticillium resistance in other host systems. Seven TIR-NBS-LRR resistance genes were observed to be up-regulated in Arabidopsis thaliana 24 h after Verticillium co-culturing (Scholz et al., 2018) again indicating NBS-LRRs may play a role in Verticillium resistance. The NBS resistance gene GbaNA1 was found to control disease resistance to Verticillium in cotton and also confer resistance when transformed into A. thaliana (Li et al., 2018a, b). A positive correlation between the number of Verticillium and Fusarium wilt resistance QTL and NBS genes was observed on subgenome A of Cotton (Zhang et al., 2015). The most convincing evidence for the existence of Verticillium specific nuclear interactions can be observed through the pathogen effector VdSCP7 which was found to localize at the host nucleus and modulate effector triggered immunity in cotton (Zhang et al., 2017). Of the 12 identified NBS resistance genes, nine were found to contain a NB-ARC domain. NB-ARCs have been demonstrated to trigger HR leading to localized plant cell death and thus containment of the pathogen (Hammond-Kosack and Jones, 1996; van der Biezen and Jones, 1998). HR occurs in response to pathogen derived molecules (Avr genes) with trigger specificity controlled by LRR domains of the resistance gene (van der Biezen and Jones, 1998). A high frequency of NB-ARC association with Verticillium resistance focal SNPs suggests that HR may play a large role in V. dahliae resistance response of strawberry. HR resistance is typically considered to be race specific and also have a lower durability within the field (Lindhout, 2002). Previous studies have highlighted the importance of the HR in roots: Phytophthora sojae resistance was partially induced in soybean through the use of lesion mutant lines which triggered root cell death in response to pathogen invasion (Kosslak et al., 1996). This also resulted in a trade-off where lesion mutants exhibited an inability to form symbiotic nodules with nitrogen-fixing bacteria (Kosslak et al., 1996). Further evidence that HR may be an important factor of a resistance response to V. dahliae infection can be seen where the effector PevD1 identified in V. dahliae isolated from cotton resulted in HR when infiltrated onto tobacco (Wang et al., 2012) and similarly with the Verticillium effector Ave1 in tobacco (Fan et al., 2018). Of particular interest was the marker FaRVd7B3 where the closest resistance gene shows 90% identity to 47% of the resistance gene muRdr1 controlling gene-for-gene specific resistance to Diplocarpon rosae a foliar fungal disease in tetraploid rose (Rosa multiflora) (Terefe-Ayana et al., 2011).
Automated Phenotyping as a Tool for Breeders
The UAV and imaging have allowed the development of a high-throughput phenotyping system to assess the disease resistance status of plants. A substantial labor-saving cost could be achieved through implementation of the phenotyping platform as the manual assessment of 2500 plants five times over the season took a total of 37.5 h. In contrast switching to a UAV-based phenotyping approach cut the time down to 2.5 h. There was a strong association between the manual disease scores (AUDPC) and the automated disease scores (NDVI-AUDPC) of V. dahliae inoculated plants. Furthermore, the use of automated phenotypic scores resulted in successful identification of resistance markers. In a similar study NDVI was found to be a good measure for Verticillium wilt structural damage in olive (Calderón et al., 2013), which suggests the transferability of this NDVI disease score across different crop hosts. In future work, the semi-automated image analysis will be improved to fully automated canopy segmentation.
Deploying the Identified Resistance
Most of the alleles identified in this study are of moderate effect with two out of 25 consistently preforming over the wider germplasm. Studying the Verticillium resistance present within pertinent cultivars related to breeding populations will ensure greater relevance of future resistance markers. In the absence of robust markers associated with the moderate resistance incidences seen here, and in the complete absence of major single gene resistance, we believe that genomic selection may provide a better strategy to breed Verticillium disease resistance into strawberry. Nonetheless, recent advances in strawberry research including recent advances in genome sequencing (unpublished observation) and successful CRIPSR/CAS9 transformation (Wilson et al., 2018), could be used to identify putative resistance genes and allow functional characterisation, respectively. These tools may allow the development of robust functional markers which perfectly tag the causative resistance genes associated with FaRVd5D and FaRVd3D.
Conclusion
Marker-assisted breeding and more likely genomic selection will result in a higher probability of developing a successful cultivar containing Verticillium wilt resistance and provides plant breeders with a competitive advantage in comparison to those implementing empirical breeding strategies. Here we report multiple loci of interest for breeders, two of which are associated with resistance across the wider strawberry germplasm. Furthermore, we highlight the potential for a HR resistance mechanism to play a large role in resistance to Verticillium in strawberry. The automated phenotyping platform could provide a valuable tool for breeders and pre-breeding research work.
Author Contributions
HC, DS, CE, and RH conceived and designed the experiments. HC, CM-M, and AG-C performed all pathogenicity tests. RV analyzed SNP data and made linkage map. AP propagated plant material. HC analyzed pathogen data and conducted quantitative genetics analysis. BL analyzed imaging data. DWS provided plant material and phenotyping advice. AA provided gene annotations and bioinformatics support. HC, BL, and RH wrote the manuscript with contributions from all authors.
Conflict of Interest Statement
DS and CE were employed by company Driscoll’s Genetics Ltd.
The remaining authors declare that the research was conducted in the absence of any commercial or financial relationships that could be construed as a potential conflict of interest.
Acknowledgments
The authors acknowledge funding from the Biotechnology and Biological Sciences Research Council (BBSRC) BB/E007074/1 and Innovate United Kingdom project 101630. The authors acknowledge the help of Rafael M. Jiménez-Diaz for help in determining the subclade of the Verticillium dahliae isolates. The authors acknowledge Eric Van de Weg, Phillip Brain, and Xiangming Xu for statistical advice. The authors acknowledge Outfield for drone imaging. The authors also acknowledge Dr. Beatrice Denoyes, INRA and Dr. Amparo Monfort, CRAG for granting the use of their informative markers in the production of the strawberry consensus linkage map. This manuscript has been released as a preprint at https://www.biorxiv.org/content/10.1101/497107v1 (Cockerton et al., 2018a).
Supplementary Material
The Supplementary Material for this article can be found online at: https://www.frontiersin.org/articles/10.3389/fpls.2019.00924/full#supplementary-material
FIGURE S1 | Area under the disease progression curve for “Hapil,” “Redgauntlet,” and “Chandler” cultivars. Light gray bars represent plants inoculated with Verticillium dahliae isolate 12008 from subclade II-2, white bars 12158 from subclade II-1 and dark gray represents mock inoculated plants.
FIGURE S2 | Area under the disease progression curve for each genotype from the “Flamenco” x “Chandler” and “Emily” x “Fenella” populations.
FIGURE S3 | Permutation test results showing the frequency of twenty-five randomly sampled markers, from those present in the F1 populations, that fell within 100 kb of a NBS containing resistance gene over 10,000 iterations. The red vertical line represents the number of markers within 100 kb of an NBS observed in three F1 populations.
FIGURE S4 | Permutation test results showing the frequency of twenty-five randomly sampled markers, from those present in the F1 populations, that fell within 100 kb of an NB-ARC containing resistance gene over 10,000 iterations. The red vertical line represents the number of markers within 100 kb of an NB-ARC observed in three F1 populations.
FIGURE S5 | Physical marker positions of SNP markers (gray) scaled to the Fragaria vesca genome (Hawaii 4 version 2.0) in Mb for 28 linkage groups of octoploid strawberry (1A–7D) marker positions scaled to F. vesca genome. Resistance marker locations from the Istraw90 Affymetrix chip (red; +) and Istraw35 Affymetrix chip validation SNPs (green; ⋄). Overlap of symbols indicates focal SNPs identified at the same location.
FIGURE S6 | Kruskal–Wallis -log10 p-values denoting the association of SNPs with strawberry Verticillium dahliae disease scores at each position in the octoploid strawberry genome in cM. Panels represent markers segregating in “Redgauntlet,” “Hapil” and both parents. Labels 1A–7D denote the 28 linkage groups. Solid horizontal line is p = 0.05, dashed horizontal line is p = 0.01. Color denotes phenotyping event blue- 2009, lime- 2010, green- 2011, orange- 2017.
FIGURE S7 | Relative Area Under the Disease Progression Curve (AUDPC) for each of the seven phenotyping events illustrating the phenotypic range of disease symptoms. “Emily” x “Fenella” (ExF), “Flamenco” x “Chandler” (FxC), Validation set (Val), “Redgauntlet” x “Hapil” in population 1 (RxHa) over 3 years (2009, 2010, and 2011), and population 2 (RxHb). A relative AUDPC of 80 indicates an a-symptomatic plant and 900 indicates a plant that died at the first timepoint.
TABLE S1 | Genetic map for “Flamenco” x “Chandler” F1 population for Axiom® IStraw90 markers generated using Crosslink (Vickerstaff and Harrison, 2017).
TABLE S2 | “Flamenco” x “Chandler” Axiom® IStraw90 marker order based upon Fragaria vesca Hawaii 4 genome version 2.0 22.
TABLE S3 | List of individuals in the validation set.
Abbreviations
AUDPC, area under the disease progression curve; cfu, colony forming units; ExF, “Emily” x “Fenella” mapping population; FaRVd∗∗, Fragaria x ananassa resistance allele for Verticillium dahliae ∗∗ denotes chromosome (1–7) and subgenome (A-D); FxC, “Flamenco” x “Chandler” mapping population; GCA, general combining ability; HR, hypersensitive response; i35k, istraw35 affymetrix chip; i90k, istraw90 affymetrix chip; NB-ARC, domain name; NBS, nucleotide binding site; NDVI, normalized difference vegetation index; NIR, near infrared; QTL, quantitative trait loci; R, red; rAUDPC, relative area under the disease progression curve; RGB, red green blue; RH%, percentage relative humidity; RxHa, “Redgauntlet” x “Hapil” mapping population. Cross one (n = 169), screened with mixed inoculum; RxHb, “Redgauntlet” x “Hapil” mapping population. Cross two (n = 80), screened with isolate 12158; SCA, specific combined ability; SNP, single nucleotide polymorphism; SSR, simple sequence repeat; UAV, unmanned aerial vehicle.
Footnotes
References
Antanaviciute, L., Šurbanovski, N., Harrison, N., McLeary, K. J., Simpson, D. W., Wilson, F., et al. (2015). Mapping QTL associated with Verticillium dahliae resistance in the cultivated strawberry (Fragaria × ananassa). Hortic. Res. 2:15009. doi: 10.1038/hortres.2015.9
Atallah, Z. K., Hayes, R. J., and Subbarao, K. V. (2011). Fifteen years of Verticillium wilt of lettuce in America’s salad bowl: a tale of immigration, subjugation, and abatement. Plant Dis. 95, 784–792. doi: 10.1094/PDIS-01-11-0075
Barbedo, J. G. A. (2013). Digital image processing techniques for detecting, quantifying and classifying plant diseases. Springerplus 2:660. doi: 10.1186/2193-1801-2-660
Bassil, N. V., Davis, T. M., Zhang, H., Ficklin, S., Mittmann, M., Webster, T., et al. (2015). Development and preliminary evaluation of a 90 K Axiom® SNP array for the allo-octoploid cultivated strawberry Fragaria × ananassa. BMC Genomics 16:1310. doi: 10.1186/s12864-015-1310-1
Bhat, R. G., and Subbarao, K. V. (1999). Host range specificity in Verticillium dahliae. Phytopathology 89, 1218–1225. doi: 10.1094/PHYTO.1999.89.12.1218
Bolek, Y., El-Zik, K. M., Pepper, A. E., Bell, A. A., Magill, C. W., Thaxton, P. M., et al. (2005). Mapping of verticillium wilt resistance genes in cotton. Plant Sci. 168, 1581–1590. doi: 10.1016/j.plantsci.2005.02.008
Calderón, R., Navas-Cortés, J. A., Lucena, C., and Zarco-Tejada, P. J. (2013). High-resolution airborne hyperspectral and thermal imagery for early detection of Verticillium wilt of olive using fluorescence, temperature and narrow-band spectral indices. Remote Sens. Environ. 139, 231–245. doi: 10.1016/j.rse.2013.07.031
Candiago, S., Remondino, F., De Giglio, M., Dubbini, M., and Gattelli, M. (2015). Evaluating multispectral images and vegetation indices for precision farming applications from UAV images. Remote Sens. 7, 4026–4047. doi: 10.3390/rs70404026
Chalavi, V., and Tabaeizadeh, Z. (2003). Enhanced resistance to Verticillium dahliae in transgenic strawberry plants expressing a Lycopersicon chilense chitinase gene. J. Am. Soc. Hortic. Sci. 128, 747–753. doi: 10.21273/jashs.128.5.0747
Chen, P., Lee, B., and Robb, J. (2004). Tolerance to a non-host isolate of Verticillium dahliae in tomato. Physiol. Mol. Plant Pathol. 64, 283–291. doi: 10.1007/s00425-008-0840-z
Cockerton, H. M., Li, B., Vickertstaff, R. J., Eyre, C. A., Sargent, D. J., Armitage, A. D., et al. (2018a). Image-based phenotyping and disease screening of multiple populations for resistance to Verticillium dahliae in cultivated strawberry Fragaria x ananassa. bioRxiv
Cockerton, H. M., Vickerstaff, R. J., Wilson, F., Karlstrom, A., Sobczyk, M., Passey, A. J., et al. (2018b). Identification of powdery mildew resistance QTL in Fragaria × ananassa. BioRxiv
Colla, P., Gilardi, G., and Gullino, M. L. (2012). A review and critical analysis of the European situation of soilborne disease management in the vegetable sector. Phytoparasitica 40, 515–523. doi: 10.1007/s12600-012-0252-2
Dan, H., Ali-Khan, S. T., and Robb, J. (2001). Use of quantitative PCR diagnostics to identify tolerance and resistance to Verticillium dahliae in Potato. Plant Dis. 85, 700–705. doi: 10.1094/PDIS.2001.85.7.700
de Jonge, R., van Esse, H. P., Maruthachalam, K., Bolton, M. D., Santhanam, P., Saber, M. K., et al. (2012). Tomato immune receptor Ve1 recognizes effector of multiple fungal pathogens uncovered by genome and RNA sequencing. Proc. Natl. Acad. Sci. U.S.A. 109, 5110–5115. doi: 10.1073/pnas.1119623109
Diehl, K., Rebensburg, P., and Lentzsch, P. (2013). Field application of non-pathogenic Verticillium dahliae genotypes for regulation of wilt in strawberry plants. AJPS 4:24. doi: 10.4236/ajps.2013.47a2004
Fan, R., Cockerton, H. M., Armitage, A. D., Bates, H., Cascant-Lopez, E., Antanaviciute, L., et al. (2018). Vegetative compatibility groups partition variation in the virulence of Verticillium dahliae on strawberry. PLoS One 13:e0191824. doi: 10.1371/journal.pone.0191824
Felipe de, M. (2017). Agricolae: Statistical Procedures for Agricultural Research. Available at: http://tarwi.lamolina.edu.pe/f̃mendiburu (accessed April 4, 2019).
Fradin, E. F., Zhang, Z., Juarez Ayala, J. C., Castroverde, C. D. M., Nazar, R. N., Robb, J., et al. (2009). Genetic dissection of Verticillium wilt resistance mediated by tomato Ve1. Plant Physiol. 150, 320–332. doi: 10.1104/pp.109.136762
Geiger, H. H., and Heun, M. (1989). Genetics of quantitative resistance to fungal diseases. Annu. Rev. Phytopathol. 27, 317–341. doi: 10.1146/annurev.phyto.27.1.317
Govorova, G. F., and Govorov, D. N. (1997). “Species and race specialization of Verticillium fungi in the former soviet union: report of a long-term study,” in Proceedings of the Seventh International Verticillium Symposium, (Greece: CABI), 55. doi: 10.2307/j.ctvddzs0t.7
Hammond-Kosack, K. E., and Jones, J. D. (1996). Resistance gene-dependent plant defense responses. Plant Cell 8, 1773–1791. doi: 10.1105/tpc.8.10.1773
Harris, D. C., and Yang, J. R. (1996). The relationship between the amount of Verticillium dahliae in soil and the incidence of strawberry wilt as a basis for disease risk prediction. Plant Pathol. 45, 106–114. doi: 10.1046/j.1365-3059.1996.d01-96.x
Harris, D. C., Yang, J. R., and Ridout, M. S. (1993). The detection and estimation of Verticillium dahliae in naturally infested soil. Plant Pathol. 42, 238–250. doi: 10.1111/j.1365-3059.1993.tb01496.x
Hayes, R. J., McHale, L. K., Vallad, G. E., Truco, M. J., Michelmore, R. W., Klosterman, S. J., et al. (2011). The inheritance of resistance to Verticillium wilt caused by race 1 isolates of Verticillium dahliae in the lettuce cultivar La Brillante. Theor. Appl. Genet. 123, 509–517. doi: 10.1007/s00122-011-1603-y
Jiménez-Díaz, R. M., and Olivares-García, C. (2017). Variation of pathotypes and races and their correlations with clonal lineages in Verticillium dahliae. Plant Pathol. 66, 651–666. doi: 10.1111/ppa.12611
Kang, B. C., Yeam, I., Frantz, J. D., Murphy, J. F., and Jahn, M. M. (2005). The pvr1 locus in capsicum encodes a translation initiation factor eIF4E that interacts with Tobacco etch virus VPg. Plant J. 42, 392–405. doi: 10.1111/j.1365-313x.2005.02381.x
Karlin, S., and Altschul, S. F. (1993). Applications and statistics for multiple high-scoring segments in molecular sequences. Proc. Natl. Acad. Sci. U.S.A. 90, 5873–5877. doi: 10.1073/pnas.90.12.5873
Kawchuk, L. M., Hachey, J., Lynch, D. R., Kulcsar, F., van Rooijen, G., Waterer, D. R., et al. (2001). Tomato Ve disease resistance genes encode cell surface-like receptors. Proc. Natl. Acad. Sci. U.S.A. 98, 6511–6515. doi: 10.1073/pnas.091114198
Keyworth, W. G., and Bennett, M. (1951). Verticillium wilt of the strawberry. J. Hortic. Sci. 26, 304–316. doi: 10.1080/00221589.1951.11513743
Kosslak, R. M., Dieter, J. R., Ruff, R. L., Chamberlin, M. A., Bowen, B. A., and Palmer, R. G. (1996). Partial resistance to root-borne infection by phytophthora sojae in three allelic necrotic root mutants in soybean. J. Hered. 87, 415–422. doi: 10.1093/oxfordjournals.jhered.a023030
Li, N. Y., Ma, X. F., Short, D. P., Li, T. G., Zhou, L., Gui, Y. J., et al. (2018a). The island cotton NBS-LRR gene GbaNA1 confers resistance to the non-race 1 Verticillium dahliae isolate Vd991. Mol. Plant Pathol. 19, 1466–1479. doi: 10.1111/mpp.12630
Li, N. Y., Zhou, L., Zhang, D. D., Klosterman, S. J., Li, T. G., Gui, Y. J., et al. (2018b). Heterologous expression of the cotton NBS-LRR Gene GbaNA1 enhances verticillium wilt resistance in Arabidopsis. Front. Plant Sci. 9:119. doi: 10.3389/fpls.2018.00119
Li, P., Quan, X., Jia, G., Xiao, J., Cloutier, S., and You, F. M. (2016). RGAugury: a pipeline for genome-wide prediction of resistance gene analogs (RGAs) in plants. BMC Genomics 17:852. doi: 10.1186/s12864-016-3197-x
Lindhout, P. (2002). The perspectives of polygenic resistance in breeding for durable disease resistance. Euphytica 124, 217–226.
López-Escudero, F. J., and Blanco-López, M. A. (2007). Relationship between the inoculum density of Verticillium dahliae and the progress of Verticillium wilt of olive. Plant Dis. 91, 1372–1378. doi: 10.1094/PDIS-91-11-1372
López-Escudero, F. J., del Río, C., Caballero, J. M., and Blanco-López, M. A. (2004). Evaluation of olive cultivars for resistance to Verticillium dahliae. Eur. J. Plant Pathol. 110, 79–85. doi: 10.1023/B:EJPP.0000010150.08098.2d
Maas, J. L. (1998). Compendium of Strawberry Diseases. St. Paul: American Phytopathological Society.
Maas, J. L., and Galleta, G. J. (1996). Recent progress in strawberry disease research. Acta Hortic. 439, 769–780. doi: 10.1093/pcp/pcr136
Mahlein, A.-K. (2016). Plant disease detection by imaging sensors – parallels and specific demands for precision agriculture and plant phenotyping. Plant Dis. 100, 241–251. doi: 10.1094/PDIS-03-15-0340-FE
Masny, A., Żurawicz, E., and Pruski, K. (2014). Combining ability analysis in 10 strawberry genotypes used in breeding cultivars for tolerance to verticillium wilt. J. Am. Soc. Hortic. Sci. 139, 275–281. doi: 10.21273/jashs.139.3.275
Paplomatas, E. J., Bassett, D. M., Broome, J. C., and DeVay, J. E. (1992). Incidence of Verticillium wilt and yield losses of cotton cultivars (Gossypium hirsutum) based on soil inoculum density of Verticillium dahliae. Phytopathology 82, 1417–1420.
Pavan, S., Jacobsen, E., Visser, R. G., and Bai, Y. (2010). Loss of susceptibility as a novel breeding strategy for durable and broad-spectrum resistance. Mol. Breed. 1, 25.
Pessina, S., Pavan, S., Catalano, D., Gallotta, A., Visser, R. G. F., Bai, Y., et al. (2014). Characterization of the MLO gene family in Rosaceae and gene expression analysis in Malus domestica. BMC Genomics 15:618. doi: 10.1186/1471-2164-15-618
Pinheiro, J., Bates, D., DebRoy, S., and Sarkar, D. R Core Team. (2017). nlme: Linear and Nonlinear Mixed Effects Models. Available at: https://CRAN.R-project.org/package=nlme (accessed May 12, 2019).
Potgieter, A. B., George-Jaeggli, B., Chapman, S. C., Laws, K., Suárez Cadavid, L. A., Wixted, J., et al. (2017). Multi-spectral imaging from an unmanned aerial vehicle enables the assessment of seasonal leaf area dynamics of sorghum breeding lines. Front. Plant Sci. 8:1532. doi: 10.3389/fpls.2017.01532
Quevillon, E., Silventoinen, V., Pillai, S., Harte, N., Mulder, N., Apweiler, R., et al. (2005). InterProScan: protein domains identifier. Nucleic Acids Res. 33, W116–W120. doi: 10.1093/nar/gki442
Quinlan, A. R., and Hall, I. M. (2010). BEDTools: a flexible suite of utilities for comparing genomic features. Bioinformatics 26, 841–842. doi: 10.1093/bioinformatics/btq033
Sargent, D. J., Passey, T., Šurbanovski, N., Lopez Girona, E., Kuchta, P., Davik, J., et al. (2012). A microsatellite linkage map for the cultivated strawberry (Fragaria × ananassa) suggests extensive regions of homozygosity in the genome that may have resulted from breeding and selection. Theor. Appl. Genet. 124, 1229–1240. doi: 10.1007/s00122-011-1782-6
Sargent, D. J., Yang, Y., Šurbanovski, N., Bianco, L., Buti, M., Velasco, R., et al. (2015). HaploSNP affinities and linkage map positions illuminate subgenome composition in the octoploid, cultivated strawberry (Fragaria × ananassa). Plant Sci. 242, 140–150. doi: 10.1016/j.plantsci.2015.07.004
Scholz, S. S., Schmidt-Heck, W., Guthke, R., Furch, A. C., Reichelt, M., Gershenzon, J., et al. (2018). Verticillium dahliae-Arabidopsis interaction causes changes in gene expression profiles and jasmonate levels on different time scales. Front. Microbiol. 9:217. doi: 10.3389/fmicb.2018.00217
Shaner, G., and Finney, R. E. (1977). The effect of nitrogen fertilization on the expression of slow-mildewing resistance in Knox wheat. Phytopathology 67, 1051–1056.
Shaw, D. V., and Gubler, W. D. (1996). Genetic variation for field resistance to Verticillium dahliae evaluated using genotypes and segregating progenies of California strawberries. J. Am. Soc. Hortic. Sci. 121, 625–628. doi: 10.21273/jashs.121.4.625
Shaw, D. V., Gubler, W. D., and Hansen, J. (1997). Field resistance of California strawberries to Verticillium dahliae at three conidial inoculum concentrations. HortScience 32, 711–713. doi: 10.21273/hortsci.32.4.711
Shulaev, V., Sargent, D. J., Crowhurst, R. N., Mockler, T. C., Folkerts, O., Delcher, A. L., et al. (2011). The genome of woodland strawberry (Fragaria vesca). Nat. Genet. 43, 109–116. doi: 10.1038/ng.740
Soares, A. X. (2004). Verticillium dahliae”: analysis of colonisation of strawberry cultivars (’Fragaria x ananassa’) & development of a transformation tool for genetic manipulation. PhD Thesis, London: Imperial College, University of London.
Sugiura, R., Tsuda, S., Tamiya, S., Itoh, A., Nishiwaki, K., Murakami, N., et al. (2016). Field phenotyping system for the assessment of potato late blight resistance using RGB imagery from an unmanned aerial vehicle. Biosyst. Eng. 148, 1–10. doi: 10.1016/j.biosystemseng.2016.04.010
Talboys, P. W., and Bennett, M. (1969). Growth and wilt (Verticillium dahliae) development in strawberry cultivars over a transition between two soil series. Ann. Appl. Biol. 64, 483–493. doi: 10.1111/j.1744-7348.1969.tb02897.x
Terefe-Ayana, D., Yasmin, A., Le, T. L., Kaufmann, H., Biber, A., Kühr, A., et al. (2011). Mining disease-resistance genes in roses: functional and molecular characterization of the rdr1 locus. Front. Plant Sci. 2:35. doi: 10.3389/fpls.2011.00035
van der Biezen, E. A., and Jones, J. D. (1998). The NB-ARC domain: a novel signalling motif shared by plant resistance gene products and regulators of cell death in animals. Curr. Biol. 8, R226–R227.
van Dijk, T., Pagliarani, G., Pikunova, A., Noordijk, Y., Yilmaz-Temel, H., Meulenbroek, B., et al. (2014). Genomic rearrangements and signatures of breeding in the allo-octoploid strawberry as revealed through an allele dose based SSR linkage map. BMC Plant Biol. 14:55. doi: 10.1186/1471-2229-14-55
Verma, S., Bassil, N. V., Zhang, H., Ficklin, S., Mittmann, M., Teresa, W., et al. (2017). Development and evaluation of the Axiom® IStraw35 384HT array for the allo-octoploid cultivated strawberry Fragaria × ananassa. Acta Hortic. 1156, 75–82. doi: 10.1186/s12864-015-1310-1
Vickerstaff, R. J., and Harrison, R. J. (2017). Crosslink: A fast, scriptable genetic mapper for outcrossing species. BioRxiv
Vining, K. J., Davis, T. M., Jamieson, A. R., and Mahoney, L. L. (2015). Germplasm resources for verticillium wilt resistance breeding and genetics in strawberry (Fragaria). JBR 5, 183–195. doi: 10.3233/JBR-150096
Wang, B., Yang, X., Zeng, H., Liu, H., Zhou, T., Tan, B., et al. (2012). The purification and characterization of a novel hypersensitive-like response-inducing elicitor from Verticillium dahliae that induces resistance responses in tobacco. Appl. Microbiol. Biotechnol. 93, 191–201. doi: 10.1007/s00253-011-3405-1
Watt, K., Graham, J., and Gordon, S. C. (2013). Current and future transgenic control strategies to vine weevil and other insect resistance in strawberry. SpringerPlus 2:660.
Wilson, F., Harrison, K., Armitage, A. D., Simkin, A. J., and Harrison, R. J. (2018). CRISPR/Cas9-mediated mutagenesis of phytoene desaturase in diploid and octoploid strawberry. bioRxiv
Woolliams, G. E. (1966). Host range and symptomology of verticillium dahliae in economic, weed, and native plants in interior British Columbia. Can. J. Plant Sci. 46, 661–669. doi: 10.4141/cjps66-110
Zebrowska, J., Hortyński, J., and Cholewa, T. (2006). Resistance to Verticillium dahliae (Kleb.) in the strawberry breeding lines. Commun. Agric. Appl. Biol. Sci. 71, 1031–1036.
Zhang, J., Yu, J., Pei, W., Li, X., Said, J., Song, M., et al. (2015). Genetic analysis of Verticillium wilt resistance in a backcross inbred line population and a meta-analysis of quantitative trait loci for disease resistance in cotton. BMC Genomics 16:577. doi: 10.1186/s12864-015-1682-2
Zhang, L., Ni, H., Du, X., Wang, S., Ma, X. W., Nürnberger, T., et al. (2017). The Verticillium-specific protein VdSCP7 localizes to the plant nucleus and modulates immunity to fungal infections. New Phytol. 215, 368–381. doi: 10.1111/nph.14537
Keywords: disease resistance, Fragaria x ananassa, wilt, NDVI, NBS, breeding
Citation: Cockerton HM, Li B, Vickerstaff RJ, Eyre CA, Sargent DJ, Armitage AD, Marina-Montes C, Garcia-Cruz A, Passey AJ, Simpson DW and Harrison RJ (2019) Identifying Verticillium dahliae Resistance in Strawberry Through Disease Screening of Multiple Populations and Image Based Phenotyping. Front. Plant Sci. 10:924. doi: 10.3389/fpls.2019.00924
Received: 04 January 2019; Accepted: 01 July 2019;
Published: 18 July 2019.
Edited by:
Urs Schmidhalter, Technical University of Munich, GermanyReviewed by:
Sachiko Narita Isobe, Kazusa DNA Research Institute, JapanKlaus Olbricht, Humboldt University of Berlin, Germany
Copyright © 2019 Cockerton, Li, Vickerstaff, Eyre, Sargent, Armitage, Marina-Montes, Garcia-Cruz, Passey, Simpson and Harrison. This is an open-access article distributed under the terms of the Creative Commons Attribution License (CC BY). The use, distribution or reproduction in other forums is permitted, provided the original author(s) and the copyright owner(s) are credited and that the original publication in this journal is cited, in accordance with accepted academic practice. No use, distribution or reproduction is permitted which does not comply with these terms.
*Correspondence: Richard Jonathan Harrison, Richard.Harrison@niab.com orcid.org/0000-0002-3307-3519