 Hui Wu1
 Jianrong Guo
 Zhen Yang
 Baoshan Wang
- 1Shandong Provincial Key Laboratory of Plant Stress, College of Life Sciences, Shandong Normal University, Ji’nan, China
- 2Shandong Provincial Key Laboratory of Microbial Engineering, School of Biologic Engineering, Qilu University of Technology (Shandong Academy of Sciences), Ji’nan, China
- 3Department of Biotechnology, College of Life Science and Technology, Huazhong University of Science and Technology, Wuhan, China
Salinity is a major and complex abiotic stress that inhibits plant growth and reduces crop yield. Given the global increase in soil salinity, there is a need to develop salt-tolerant species. Brassica napus L. is an important oilseed crop with some level of salt tolerance. However, few studies have evaluated its salt tolerance thoroughly or screened for traits that can be reliably evaluated for salt tolerance. Here, we evaluated salt tolerance in 549 B. napus inbred lines with different genetic backgrounds using the membership function value (MFV) of certain traits, including the germination rate, root and shoot length, root and shoot fresh weight, and total fresh weight. According to the evaluation criteria-mean MFV, 50 highly salt-tolerant, 115 salt-tolerant, 71 moderately salt-tolerant, 202 salt-sensitive, and 111 highly salt-sensitive inbred lines were screened at the germination stage. We also developed a mathematical evaluation model and identified that the salt tolerance index of shoot fresh weight is a single trait that reliably represents the salt tolerance of B. napus germplasm at the germination stage. These results are useful for evaluating and breeding salt-tolerant B. napus germplasm.
Introduction
Salinity is a major abiotic stress that inhibits plant growth and reduces crop yield (Kumar et al., 2010; Tavakkoli et al., 2011). About 800 million hectares of farmland are affected by salinization worldwide (Cramer et al., 2011). In China, there are about 100 million hectares of salinized land, and this number is predicted to increase (Song and Wang, 2015; Yang and Wang, 2015). Saline soil is mainly caused by poor irrigation practices, along with saline groundwater in inland regions and high ocean tides in the coastal regions (Ganie et al., 2016).
The ability of the plant to survive and complete its life cycle under saline conditions is dependent on its salt tolerance, which varies among different species and growth stages (Zeng et al., 2002; Akbari et al., 2007). Thus, the best way to use saline soil is to screen for and develop salt-tolerant crop species and varieties (Ghoulam and Fares, 2001; Ashraf et al., 2012). Plant response to salinity is mainly reflected in morphological, physiological, biochemical, and molecular changes. For example, salinity stress results in osmotic stress, ion toxicity, and nutritional imbalances (Jones and Gorham, 2002), which reduces growth and alters the levels of cell metabolites (Rhodes et al., 2002).
Seed germination is the first stage of the plant’s life cycle, and is negatively affected by salinity (Azza et al., 2007; Feizi et al., 2007). Several previous studies have shown that seed germination is extremely sensitive to salinity in most plant species (Heenan et al., 1988). Abbas et al. (2013) demonstrated that the percent germination, shoot and root length, and dry weight of rice (Oryza sativa) were reduced with increasing levels of NaCl. Similarly, in dicotyledonous cabbage (Brassica oleracea), seed germination and the growth of roots and buds were also inhibited under salt stress (Jamil et al., 2007). Therefore, salt tolerance at the germination stage is critical for the successful growth of plants in saline conditions.
Oilseed rape (Brassica napus) is an important salt-tolerant oilseed crop (Maas, 1993; Ashraf and McNeilly, 2004). Determining the reliable index and traits is important for salt-tolerant breeding. Many studies have shown that halophytes, such as Suaeda salsa and Salicornia europaea, have high salt tolerance at the germination stage though their germination rates are also reduced (Song et al., 2008; Hakim et al., 2010; Deng et al., 2014; Guo et al., 2018), while all crops are highly sensitive to salinity (Carpycy et al., 2009; Hakim et al., 2010; Cokkızgın, 2012; Ding et al., 2018). However, the indicators for evaluation of salt tolerance at germination stage are not consistent between different species. Various screening methods for salinity tolerance have been developed, including plant growth (Sayed, 1985), germination rate, leaf or root elongation (Garcia et al., 1995), K+/Na+ discrimination (Asch et al., 2000), and Cl− exclusion (Rogers and Noble, 1992). The Na+ content in the shoot is considered a reliable trait of salt tolerance in barley (Hordeum vulgare; Pakniyat et al., 1997). In rice, Makihara et al. (2001) proposed that the photosynthetic rate of excised leaf blades is a good indicator of salt tolerance. However, few studies have focused on salt tolerance in B. napus. According to Long et al. (2013), root and shoot length can be used as an early indicator for evaluating salt tolerance of B. napus. Hu et al. (2018) evaluated the salt tolerance of a small number of B. napus germplasms using a comprehensive analysis of multi-index results, but an effective screening indicator was not presented. Thus, a reliable screening trait for salt tolerance of B. napus and an effective large-scale screening method at the seed germination stage have yet to be determined.
In this study, 549 B. napus germplasms (inbred lines) were used to evaluate salt tolerance. In addition, we established a mathematical evaluation model and found a reliable screening trait for investigating the salt tolerance of B. napus at the germination stage. These results provide a basis for breeding salt-tolerant B. napus.
Materials and Methods
Plant Materials
A total of 564 inbred lines seeds of B. napus with different genetic backgrounds were harvested in 2016 and stored in a refrigerator at temperatures < 4°C prior for germination experiments. These seeds were kindly provided by Professor Maoteng Li from Huazhong University of Science and Technology.
Determination of Optimal Salt Stress Concentration
Fifteen inbred lines were randomly selected from the 564 inbred lines and used to determine the optimal salt concentration within a concentration of 50, 100, 150, 200, and 250 mmol L−1 NaCl. Seeds treated with distilled water (0 mmol L−1 NaCl) were assigned as the control. Seeds were sterilized with 70% alcohol for 15 min, washed five times with distilled water, and then soaked in distilled water for 12 h. Twelve uniform and healthy seeds were selected from each of the 15 inbred lines and germinated in 9-cm Petri dishes lined with a double-layer of blotting paper and containing 9 mL of NaCl solution at the concentrations stated above. The seeds were cultured in a growth chamber at 28 ± 3°C/23 ± 3°C (day/night) with a relative humidity of 70%, and a light intensity of 600 μmol m−2 s−1 (14 h light/10 h dark). Seeds were considered to have germinated when the radicle length was ≥2 mm. It was considered as the optimum stress concentration of NaCl at which the salt-injury index was 50% of the control.
Screening of Salt-Tolerant Inbred Lines
The 9 cm diameter Petri dishes were divided into three equal parts, with each part containing 12 uniform seeds of a B. napus inbred line and treated with the optimum NaCl concentration and distilled water (control), respectively, and there were three biological replicates in each treatment. For each inbred line, 36 seeds were in each treatment (control and 200 mmol L−1 NaCl).
Determination of Physiological Parameters
The number of germinated seeds was recorded every day for 7 days. The fresh weight and seedlings length were also measured at 7 days after sowing (DAS).
To evaluate the salt tolerance of B. napus inbred lines at the germination stage, the germination rate, the fresh weight of the shoot and root (mg) and the shoot and root length (cm) were determined. These were calculated using the formulae below.
Germination rate (GR): Germination rate was calculated 7 DAS:
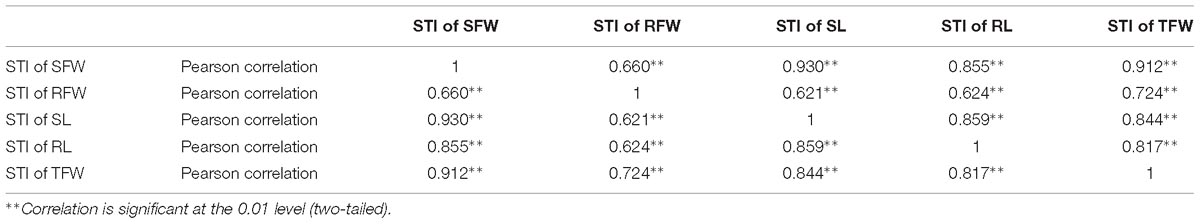
Table 1. Correlation analysis between salt tolerance indices of shoot fresh weight (STI of SFW), root fresh weight (STI of RFW), shoot length (STI of SL), root length (STI of RL), and total fresh weight (STI of TFW) of 438 B. napus inbred lines in the presence of 200 mmol L−1 NaCl.
Where G7 is the number of germinated seeds on the 7 DAS, T is the total number of seeds (Alvarado et al., 1987; Ruan et al., 2002).
In order to reduce the effect of the germination rate (faster or slower) on the later growth of root and shoot, the abnormal seedlings (particular faster or slower) were removed during the germination and uniform seedlings were used to compare the following parameters at 7 DAS.
Shoot length (SL) and root length (RL) were measured individually at 7 DAS.
Shoot fresh weight (SFW) and root fresh weight (RFW) were determined for each replication at 7 DAS.
Total fresh weight (TFW) is the sum of SFW and RFW of an individual plant.
The salt-tolerance index (STI) is the ratio of the value for the NaCl-treated plant/value for the control.
Salt-injury index (SII): SII = 1-STI.
Salt Tolerance Evaluation
The salt tolerance of B. napus was evaluated using the membership function value (MFV) using the fuzzy comprehensive evaluation method (Chen et al., 2012). The MFV of salt tolerance was calculated using the following equation:
where, Xi is the MFV of STI in a specific inbred line, X is the actual measured value of STI in a specific inbred line, and Xmax and Xmin are the maximum and minimum values observed in all inbred lines, respectively (Ding et al., 2018). According to the average value of the MFVs of each trait, the salt tolerance of the inbred line was evaluated. The MFVs of all inbred lines ranged from 0 to 1.
For each genotype, mean MFV is the average of MFVs of germination rate, shoot weight, root weight, shoot length, root length, and total fresh weight. So, each genotype has its own mean MFV, the bigger the mean MFV, the higher the salt tolerance.
Hierarchical Cluster Analysis
hierarchical cluster analysis was also used to evaluate salt tolerance. The salt tolerance was divided into five levels: highly salt tolerant (HST), salt tolerant (ST), moderately salt tolerant (MST), salt sensitive (SS), highly salt sensitive (HSS).
Using the software of SPSS to perform multiple regression analysis on mean MFV (dependent variable Y) and STI value (independent variable Xi) for each genotype. A mathematical evaluation model for salt tolerance was established: Y = β1X1+ β2X2+ β3X3+ β4X4+ β5X5+ μ, where Y is the mean MFV, X1 is the STI of SFW, X2 is the STI of RFW, X3 is the STI of SL, X4 is the STI of RL, X5 is the STI of TFW, β is the B of unstandardized coefficient, and μ is constant. Constant (μ) means the random error term.
Statistical Analysis
The data are presented as means ± standard deviation (SD). The values were analyzed using SPSS (version 13.0) for windows and ANOVA followed by Tukey’s post hoc test. All tests were performed using SPSS Version 13.0 for Windows (SPSS, Chicago, IL, United States).
Results
Determination of Optimal Salt Concentration
We determined the GR, SFW, RFW, SL, RL, and TFW of 15 B. napus inbred lines at 7 DAS (Supplementary Table S1). The SII of each indicator was calculated based on the data in Supplementary Tables S1, S2 and the average SII for each indicator over all 15 lines was analyzed using linear regression analysis (Figure 1). When treated with 191.3 mmol L−1 NaCl, the SII of the GR decreased to 50% of control. The NaCl concentration at which the SII of SFW decreased to 50% was 191.5 mmol L−1. For RFW, SL, RL, and TFW, the concentration of NaCl which led to a 50% decrease in the SII was 156.1, 133.2, 175.7, and 175.9 mmol L−1, respectively. The average concentration of these four NaCl concentrations was 173.9 mmol L−1. Therefore, 200 mmol L−1 NaCl was used in the present study to evaluate the salt tolerance of the other 549 B. napus inbred lines.
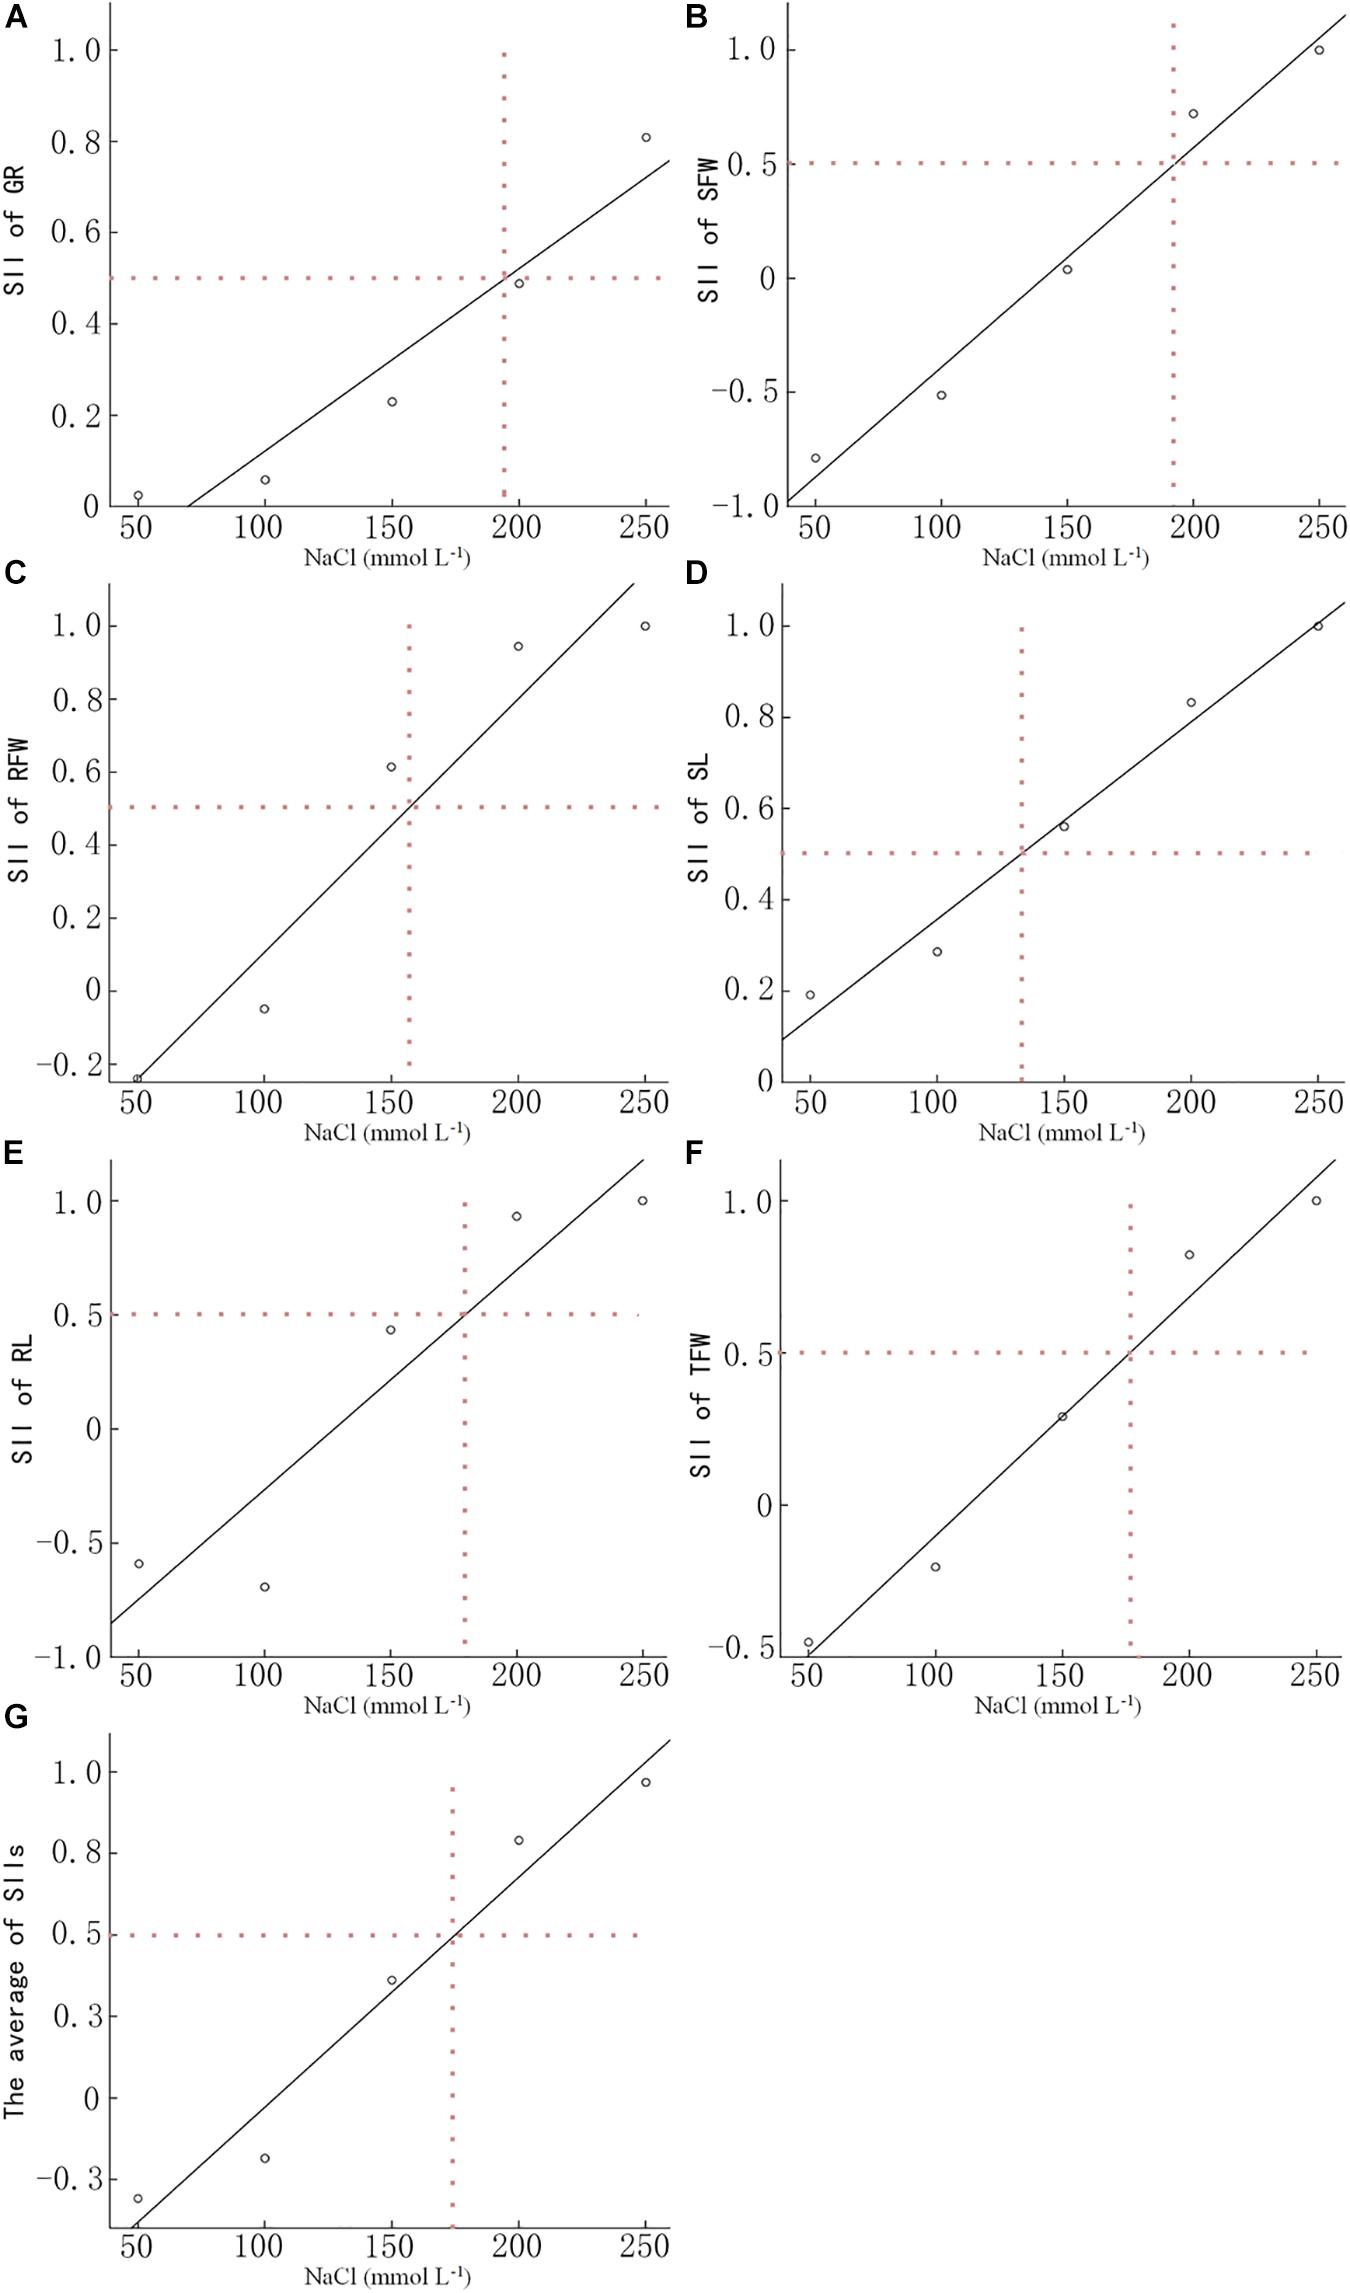
Figure 1. Determination of the optimal NaCl concentration for evaluating salt tolerance. The NaCl concentration of the salt-injury index is 0.5 of the germination rate (A), shoot fresh weight (B), root fresh weight (C), shoot length (D), root length (E), total fresh weight (F), and the average (G) of 15 Brassica napus inbred lines under different NaCl concentrations. Data in the figure are means of 15 B. napus inbred lines for each indicator under each concentration of NaCl.
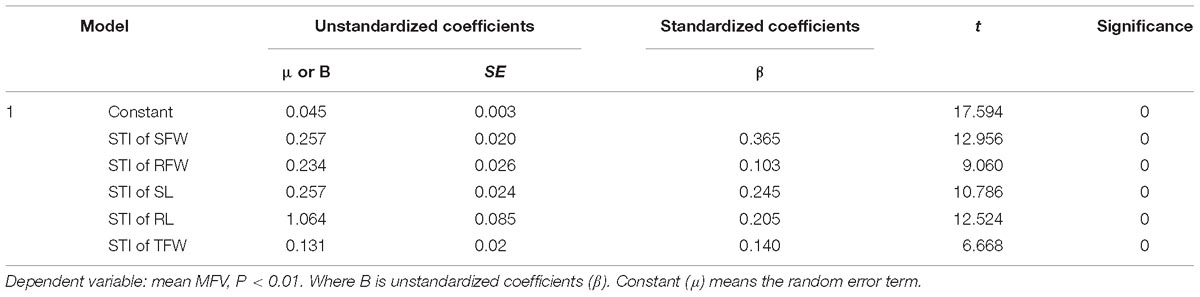
Table 2. Multiple regression analysis for salt tolerance indices of shoot fresh weight (STI of SFW), root fresh weight (STI of RFW), shoot length (STI of SL), root length (STI of RL), and total fresh weight (STI of TFW) in the presence of 200 mmol L−1 NaCl.
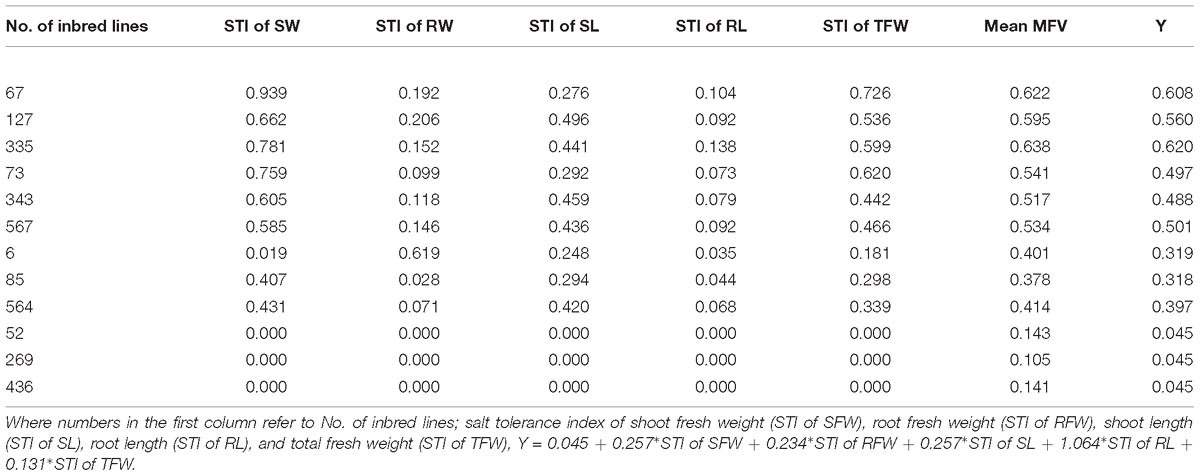
Table 3. Salt tolerance verification of multiple regression analysis with their MFVs.
Correlation Analysis of Physiological Parameters Under Salt Stress
The GR, SFW, RFW, SL, RL, and TFW of each inbred line were measured at 200 mmol L−1 NaCl at 7 DAS (Supplementary Table S3), and the STI of each indicator was calculated (Supplementary Table S4; data from the un-germinated inbred lines under these conditions is not shown). To determine the relationship (if any) between these physiological parameters under NaCl stress, a correlation analysis was performed (Table 1). There was a positive correlation between any two STIs of SFW, RFW, SL, RL, and TFW, and the highest correlation coefficient (0.930) was between the STI of SFW and the STI of SL. The second-highest correlation coefficient was that between the STI of SFW and the STI of TFW (0.912), and the lowest correlation coefficient was between the STI of RFW and the STI of SL (0.621).
Salt Tolerance Evaluation
The MFV of each indicator and mean MFV was calculated (Supplementary Table S5), and a hierarchical cluster analysis based on the Furthest Neighbor was used to evaluate the salt tolerance of B. napus inbred lines (Figure 2). The salt tolerance of 438 B. napus inbred lines was divided into four levels with a distance of three between each level: HST, ST, MST, and SS. In addition, the un-germinated B. napus inbred lines in the experiment were classified as HSS. The difference in salt tolerance (distinguished by the MFV of each indicator after germination) between the B. napus inbred lines is shown in Supplementary Table S6. Among all the B. napus inbred lines analyzed, 50 were classified as HST, 115 as ST, 71 as MST, 202 as SS, and 111 as HSS (Figure 3).
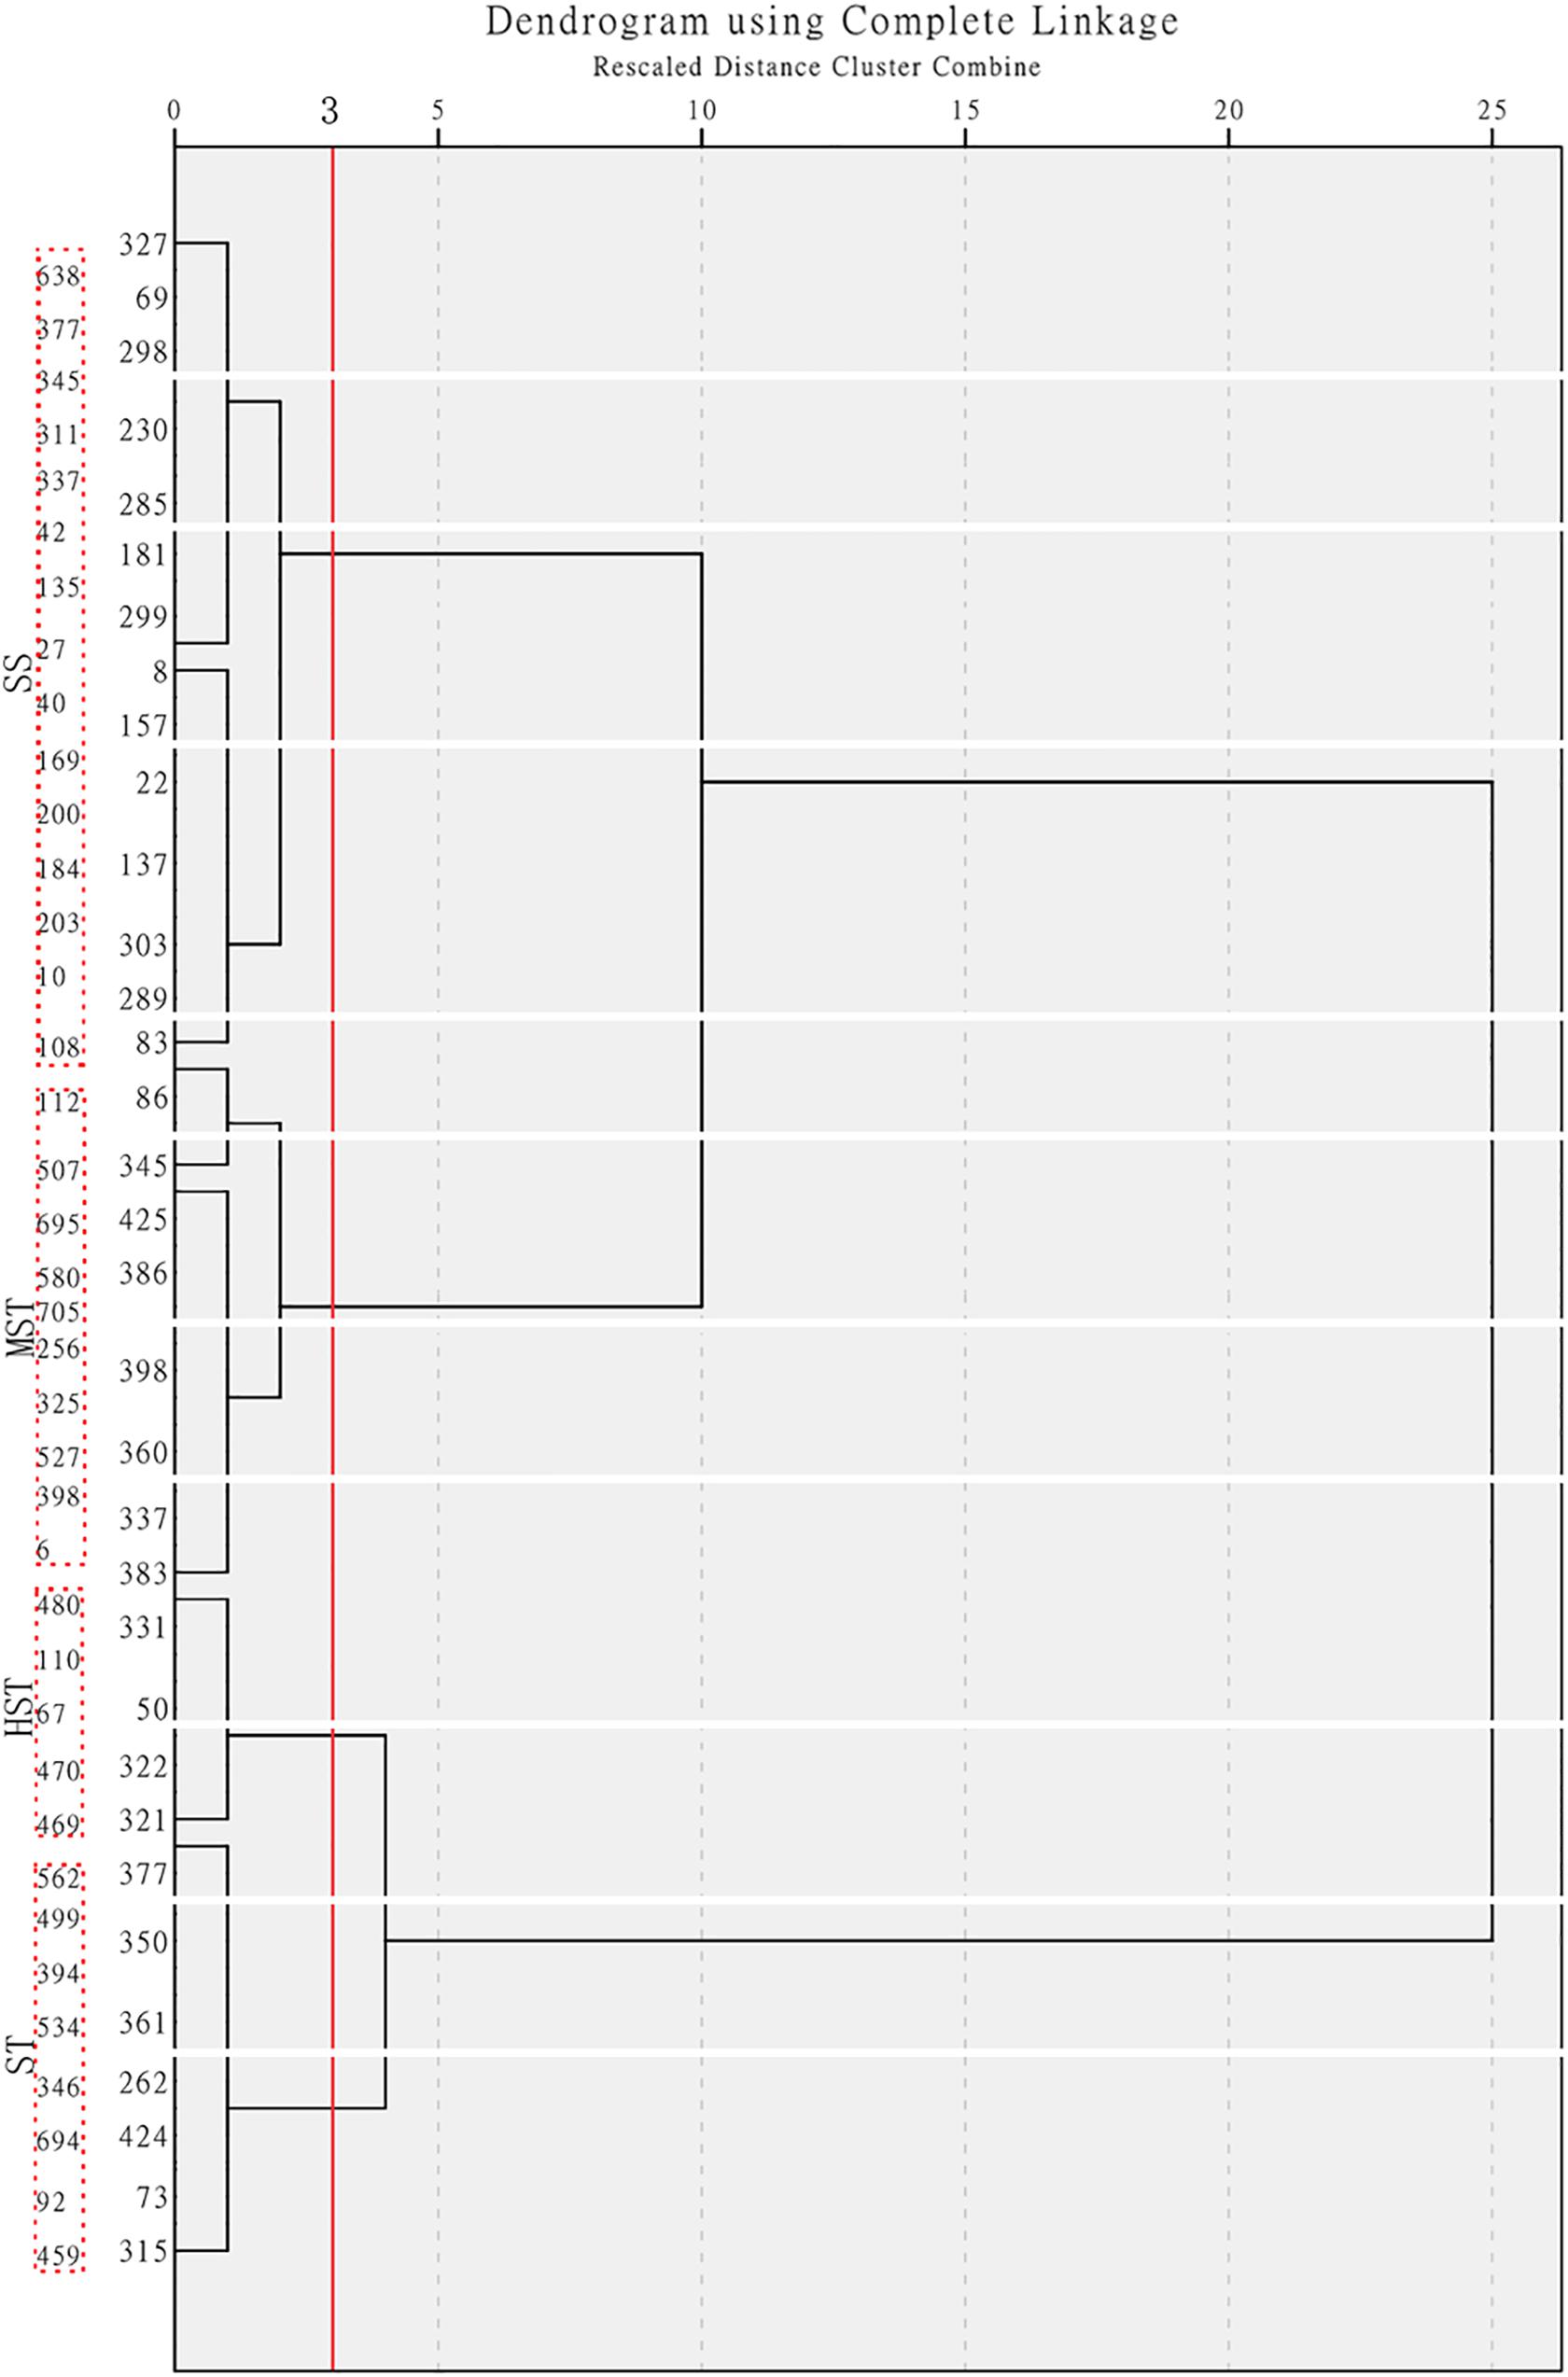
Figure 2. Hierarchical cluster analysis based on the Furthest Neighbor to evaluate the salt tolerance of 438 B. napus inbred lines. HST, high salt tolerance; ST, salt tolerance; MST, moderately salt tolerant; and SS, salt sensitive.
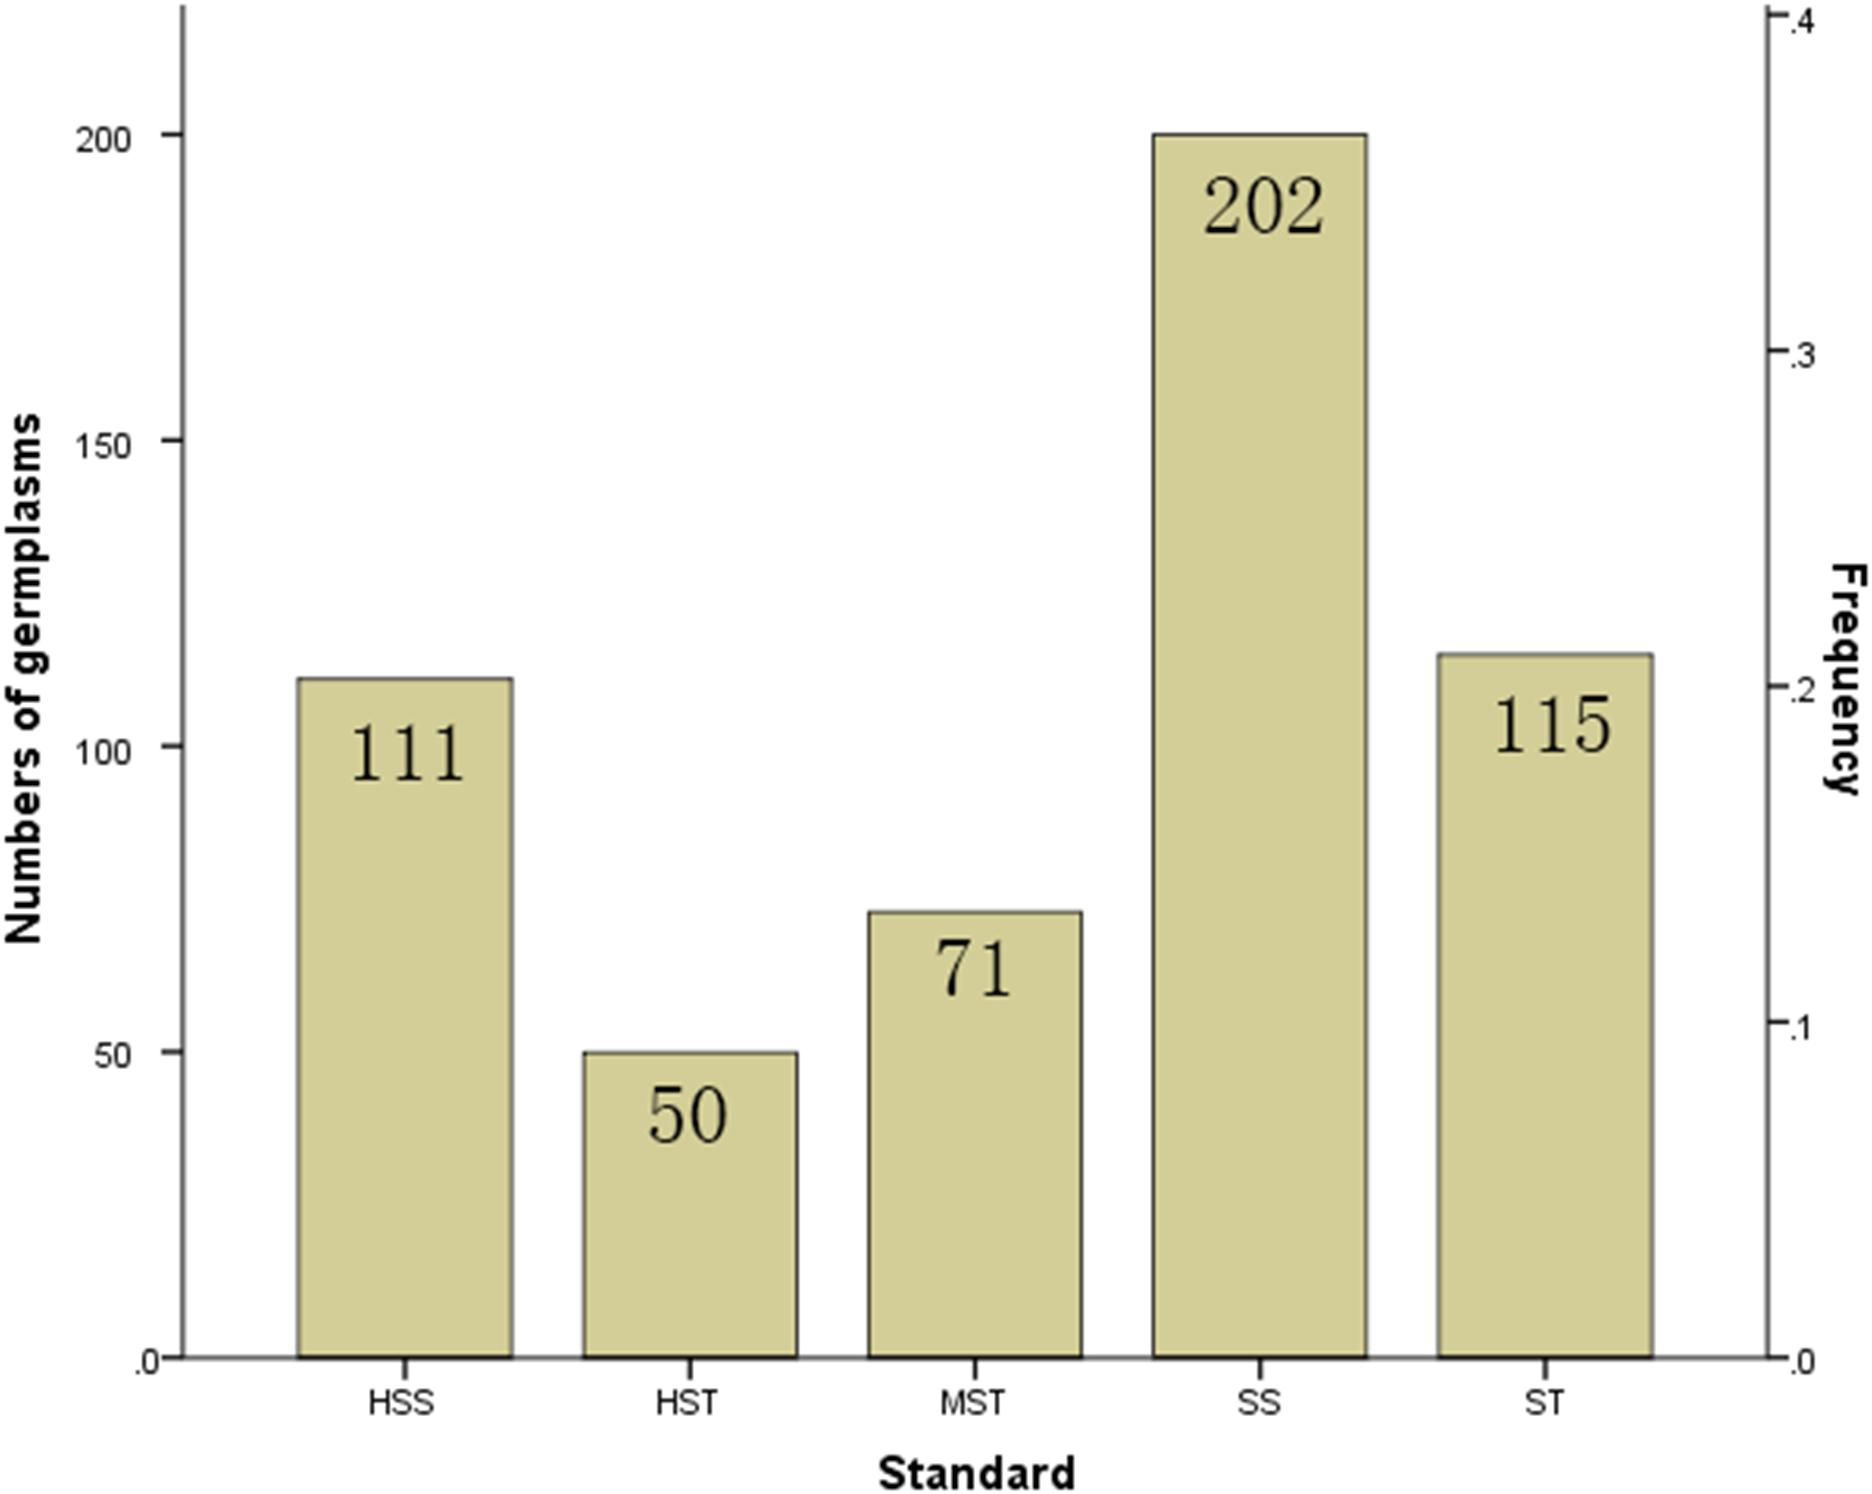
Figure 3. Proportion of the 549 B. napus inbred lines with different salt tolerances. HST, highly salt tolerant; ST, salt tolerant; MST, moderately salt tolerant; SS, salt sensitive; HSS, highly salt sensitive based on hierarchical cluster analysis of salt tolerance.
Establishment of a Salt Tolerance Evaluation Model and Screening for a Reliable Single Indicator
A mathematical evaluation model for analyzing the salt tolerance of 438 B. napus inbred lines was established using multiple regression analysis. The unstandardized coefficients of the STI of SFW, RFW, SL, RL, and TFW were 0.257, 0.234, 0.257, 1.064, and 0.131, respectively. The random error term was 0.045. Therefore Y = 0.045+0.257∗STI of SFW+0.234∗STI of RFW+0.257∗STI of SL+1.064∗STI of RL+0.131∗STI of TFW (P < 0.01) (Table 2), where Y represents the salt tolerance of a B. napus inbred line.
To test whether the mathematical evaluation model can predict the salt tolerance of any inbred line, three inbred lines in each of the different clusters were randomly selected and their Y values were calculated (Table 3). The results indicated that the formula can be used to evaluate the salt tolerance of any B. napus inbred line at the germination stage. For example, the Y of # 67 (HST) is 0.045+0.257∗0.939+0.234∗0.192+0.257∗0.276+1.064∗0.104+ 0.131∗0.726; therefore Y = 0.608, and its mean MFV is 0.622; the Y of # 73 (ST) is 0.497, and its mean MFV is 0.541; and the Y of # 564 (MST) is 0.397, and its mean MFV is 0.414. The values of mean MFV and Y were very close. In addition, we use this model to analyze salt tolerance that the genotypes used for determination of optimal salt concentration. The results of salt tolerance analysis are shown in Supplementary Table S6. We find that the higher salt tolerance (Y value) of the genotypes which showed higher growth under mild salt stress as compared to those of controls. Therefore, our model is reliable and salt tolerance can be predicted by calculating the Y value of any B. napus inbred line using the STIs of growth parameters such as SFW, RFW, SL, RL, and TFW at the germination stage.
The higher the mean MFV, the higher the salt tolerance (Ding et al., 2018). In our study, the mean MFV was affected by the STI of SFW, RFW, SL, RL, and TFW, which means that the higher STI value of each indicator, the higher the MFV value. To determine which indicator is most reliable in reflecting salt tolerance, a linear model between the STI of each indicator and the mean of MFV was fitted. As shown in Figure 4, the R2 between the mean MFV and the STI of SFW was the highest (0.930), the R2 between the mean MFVs and the STI of SL, RL, and TFW were slightly lower, i.e., 0.89, 0.822, and 0.851, respectively, and the R2 between the mean MFV and the STI of RFW was the lowest (0.527). These results are consistent with the results presented in Table 2, in which the standardized beta coefficient between the mean MFV and the STI of SFW was also the highest. Overall, our results suggest that shoot fresh weight can be used as a reliable trait to evaluate the salt tolerance of B. napus inbred lines at the germination stage.
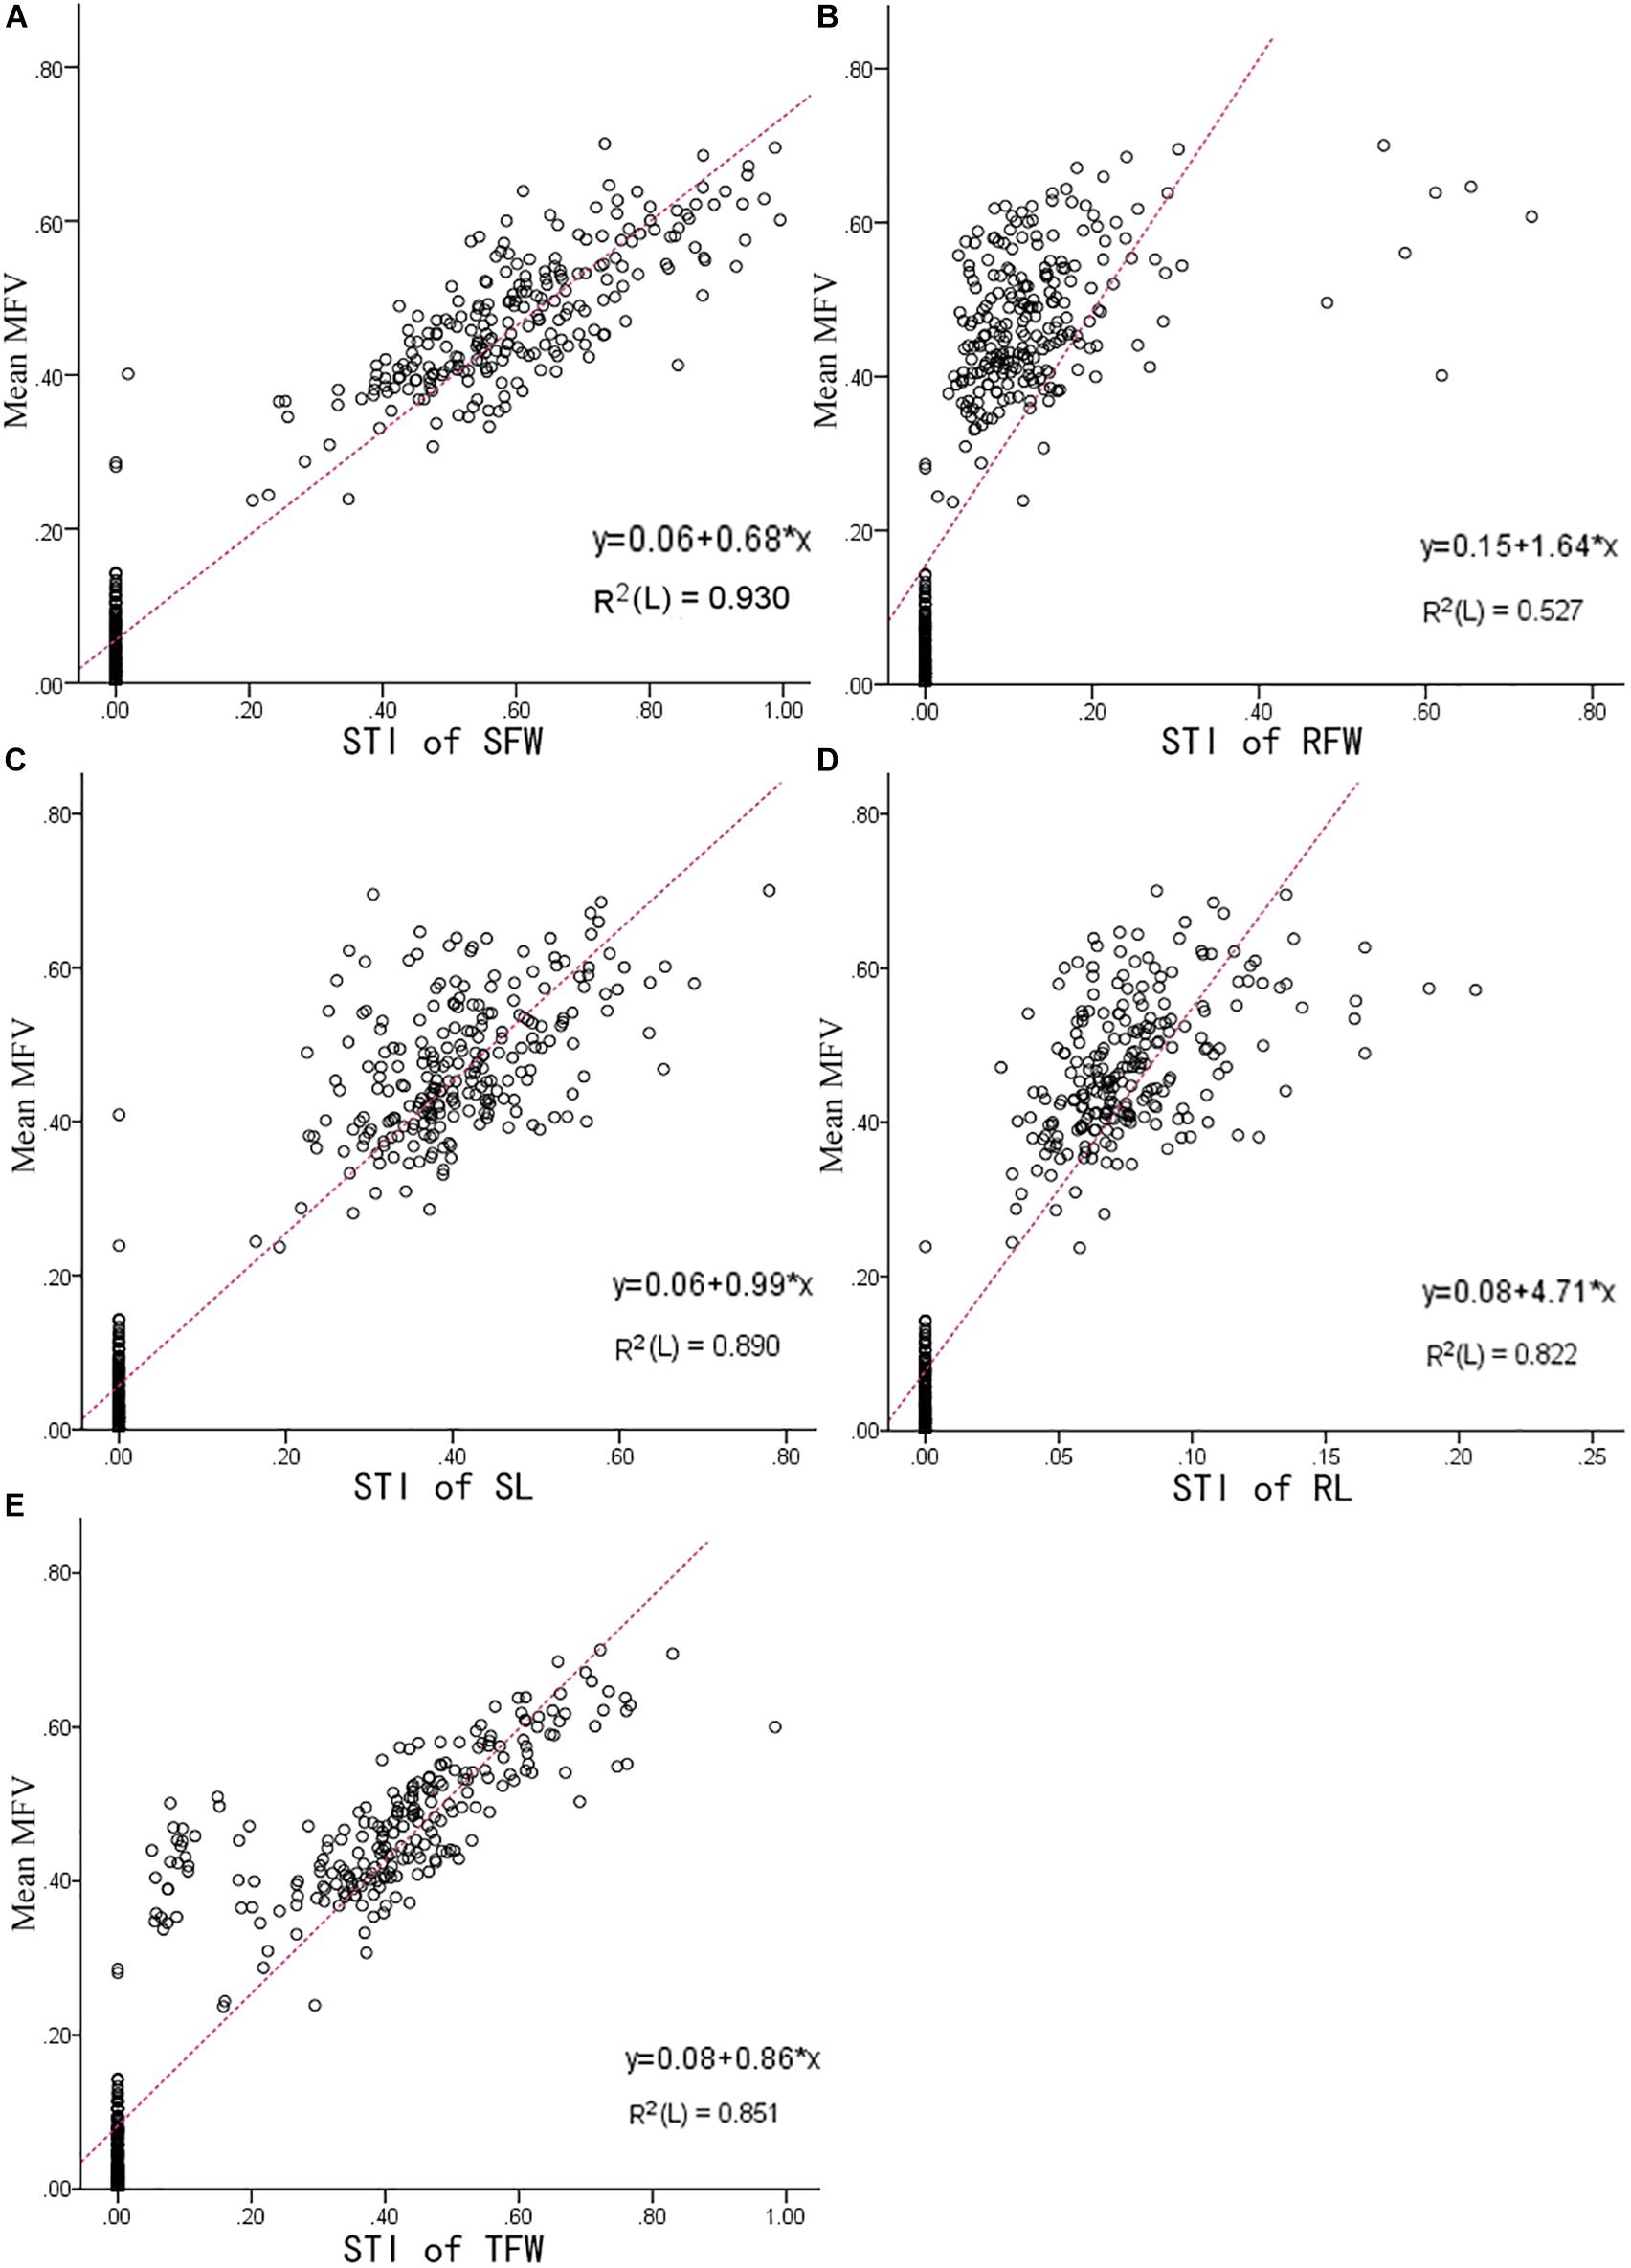
Figure 4. The linear fit between the STI of each indicator and the mean MFV of an individual B. napus inbred line (438 B. napus inbred lines with different tolerances to salt stress). (A) Is between Mean MFV and STI of SFW (salt tolerance index of shoot fresh weight); (B) is between Mean MFV and STI of RFW (salt tolerance index of root fresh weight); (C) is between Mean MFV and STI of SL (salt tolerance index of shoot length); (D) is between Mean MFV and STI of RL (salt tolerance index of root length); (E) is between Mean MFV and STI of TFW (salt tolerance index of total fresh weight).
To test if the shoot fresh weight reflects salt tolerance accurately, three inbred lines were randomly selected, from each salt-resistant category and the phenotypes of the seedlings, and the shoot fresh weights were determined at 7 DAS in 200 mmol L−1 NaCl (Figure 5). There was no significant difference (P > 0.05) in growth between the different B. napus inbred lines in the control (no NaCl) treatment. However, the growth and shoot fresh weight were significantly reduced by NaCl as the salt tolerance of the B. napus inbred lines decreased (HSS > SS > MST > ST > HST). When treated with 200 mmol L−1 NaCl, the leaves of the HST B. napus inbred lines were still green, while the leaves of the ST B. napus inbred lines turned yellow. The HSS B. napus inbred lines barely germinated in 200 mmol L−1 NaCl. The average shoot fresh weight of an individual plant was 27.82 mg (HST lines) and 12.89 mg (MST lines). Furthermore, the total fresh weight of SS B. napus lines was close to 0 g (Figure 5B).
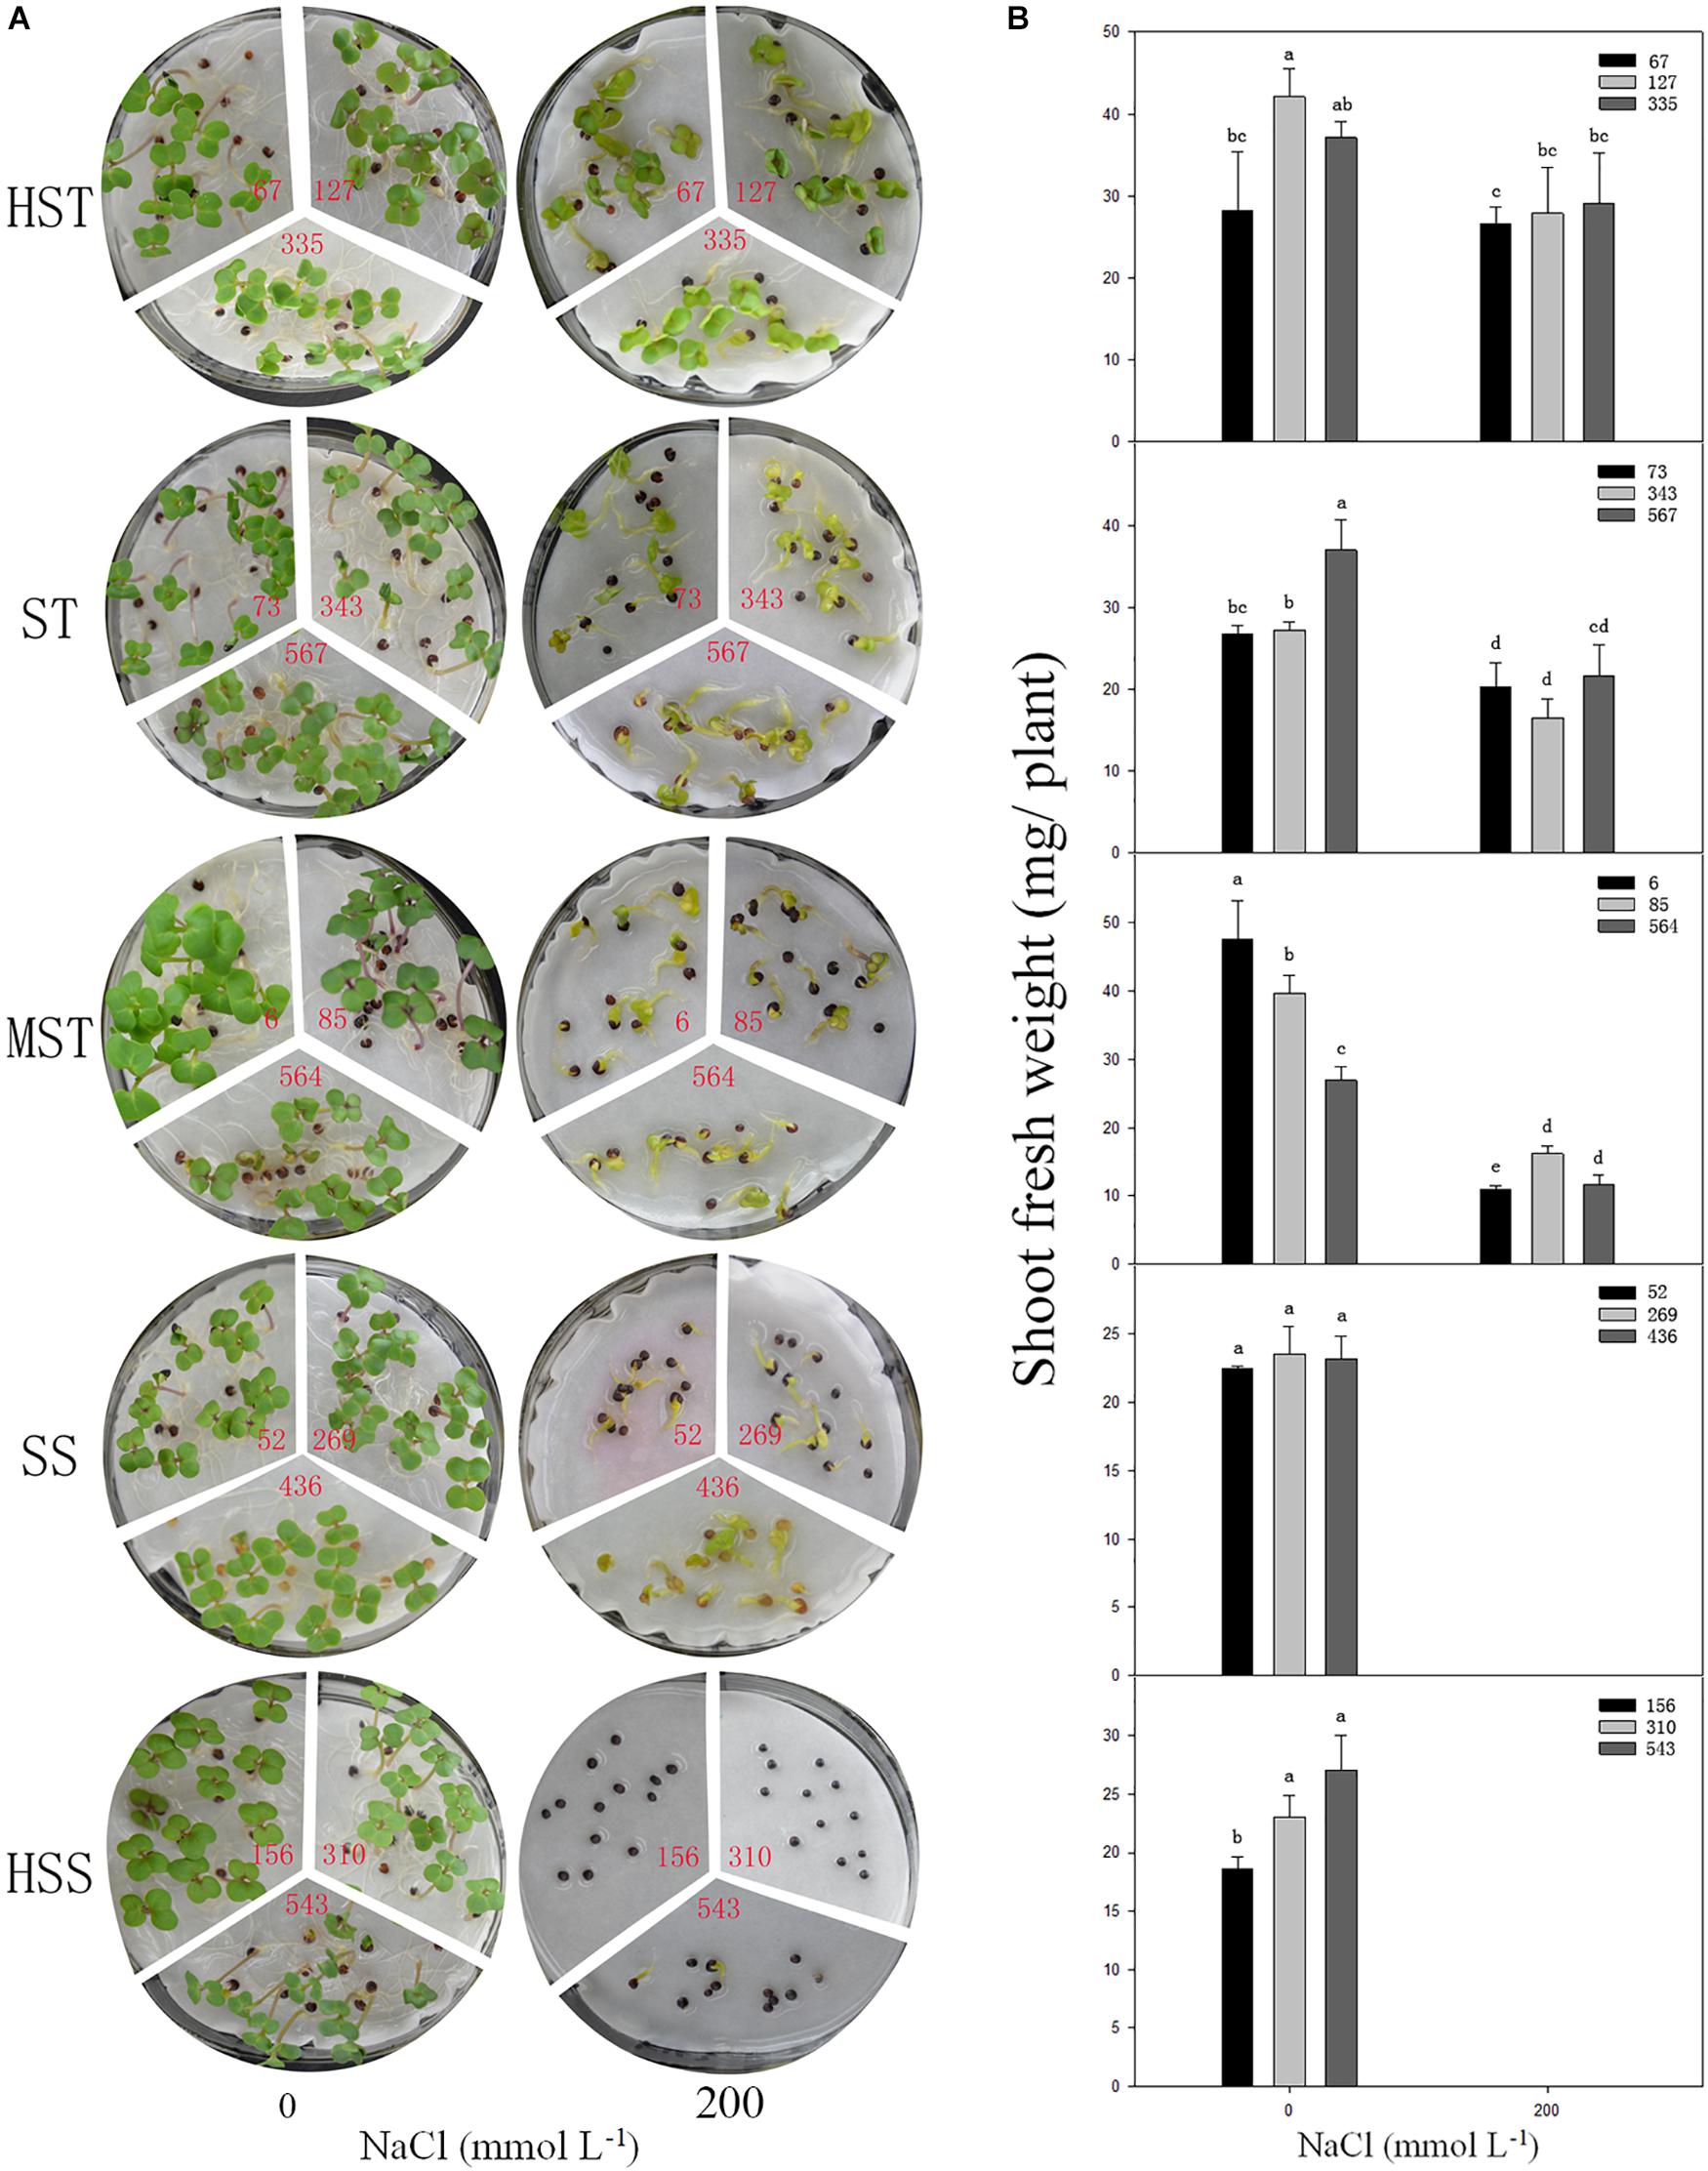
Figure 5. Phenotypes (A) and shoot fresh weight (B) of the seedlings of different salt-tolerant B. napus inbred lines at 7 DAS under 200 mmol L−1. No. of HST (highly salt tolerant): 67, 127, and 335; ST (salt tolerant): 73, 343, and 567; MST (moderately salt tolerant): 6, 85, and 564; SS (salt sensitive): 52, 269, and 436; and HSS (highly salt sensitive): 156, 310, and 543 B. napus lines. Data are means (n = 18) ± SD. Different letters indicate significant difference at P < 0.05.
Discussion
Most plants have developed salt-resistant stress mechanisms, but their ability to resist salt stress varies widely among different species and cultivars (Ashraf and Wu, 1994). According to Maas (1993), B. napus has a certain level of salt tolerance. However, the salt concentration that B. napus can tolerate is much lower than that of a true halophyte (Deng et al., 2014; Yuan et al., 2016; Guo et al., 2018). When B. napus is cultivated in saline soil, growth is inhibited and seed oil production is low. In this study, 200 mmol L−1 NaCl was determined as the optimal concentration to evaluate the salt tolerance based on the salt resistance of 15 B. napus inbred lines using a concentration gradient experiment because germination rate of B. napus inbred lines were differently reduced (Supplementary Table S1). Subsequently, the salt resistance of 549 B. napus inbred lines with different genetic backgrounds was determined under 200 mM NaCl. Interestingly, some of the genotypes showed higher root and shoot growth under 50 or 100 mM NaCl as compared to those of controls. B. napus is considered to be a crop with a certain salt tolerance (Maas, 1993). For euhalophytes, a moderate salinity significantly promotes vegetable and reproductive growth due to efficient ion compartmentalization and succulence (Song et al., 2008; Qi et al., 2009; Yang et al., 2010; Song and Wang, 2015; Guo et al., 2018). Our previous results showed that halophyte, for example Thellungilla halophila is more adaptive to salinity compared with Arabidopsis thaliana at stages of seed germination and seedling establishment (Guo et al., 2012). For some B. napus genotypes, the reason of the elevated growth at low concentration NaCl treatments may be related to faster and higher water absorption and physiological start than controls. We speculate that these genotypes have higher ion content and lower water potential under mild salt stress as compared to those of controls, which led to a higher root and shoot growth. However, the ion content needs to be determined in the next step to verify this speculation.
We observed that the germination rate of B. napus seeds from all cultivars decreased in the presence of 200 mmol L−1 NaCl. According to Ayaz et al. (2000), the decline in germination rate is most likely due to metabolic disorders that occur under salt stress conditions. We believe that the germplasms in the 549 B. napus inbred lines that did not germinate were HSS. Whether the seed germinates or not is a qualitative change that does not accurately express quantitative changes and therefore does not reflect the plant’s ability to grow under salt stress. Therefore, the salt tolerance of B. napus cannot be accurately evaluated using germination rate alone. Hu et al. (2018) evaluated the salt tolerance of 88 B. napus cultivars by the MFV using the fuzzy comprehensive evaluation method. Principal component analysis is used for fuzzy evaluation, and determining the contribution rate of the principal components involves subjective factors, which therefore cannot objectively express the salt tolerance of the cultivars themselves. In our study, the MFV of STI of growth parameters such as SFW, RFW, SL, RL, and TFW at the germination stage in a specific inbred line was calculated based on the data of 438 inbred lines respectively. Then, for each genotype, mean MFV (the average of MFVs of germination rate, shoot weight, root weight, shoot length, root length, and total fresh weight) was calculated. The mean MFV is a multiple indicator for evaluating plant salt tolerance, and the bigger the mean MFV, the higher the salt tolerance. Therefore, the mean MFV and a hierarchical cluster analysis based on the Furthest Neighbor was used to evaluate the salt tolerance of B. napus inbred lines (Figure 2). The salt tolerance of 438 B. napus inbred lines was determined and divided into 50 HST, 115 ST, 71 MST, and 202 SS. In addition, the 111 un-germinated B. napus inbred lines were classified as HSS.
When we determine the salt tolerance of one or some B. napus genotypes, it is difficult to get an answer without a large number of other genotypes as a comparison. It is also laborious and complicated to evaluate salt tolerance using the MFV. To easily and reliably evaluate salt tolerance of one B. napus inbred line or variety, we developed a mathematical formula for the evaluation of salt tolerance using multiple regression analysis. Consequently, we can estimate the salt tolerance of any B. napus inbred line by calculating the Y value. A relatively accurate evaluation of salt tolerance can be obtained in our mathematical model. The bigger the Y value, the higher the salt tolerance (Table 3). It is the first time to establish a mathematical evaluation model to predict the salt tolerance of B. napus during germination. This mathematical formula will be useful in the screening of salt tolerance of B. napus.
According to Long et al. (2013), the root and shoot length can be used as an early indicator for evaluating salt tolerance in B. napus. Hu et al. (2018), however, considered that a comprehensive analysis of multi-index results would better reflect the salt tolerance of B. napus during germination. However, measuring multiple traits is difficult and time-consuming, especially on a large scale. In this study, based on R2 between the mean MFV and multiple indicators, the STI of SFW appears to be a single that reliable screening trait for the assessment of salt tolerance of B. napus inbred lines. This result provides the foundation for less difficult and more time-efficient evaluation of salt tolerance, and for salt-tolerant breeding of B. napus.
Conclusion
In this study, we determined the optimal NaCl concentration (200 mmol L−1) for the salt tolerance evaluation of B. napus. 50 HST, 115 ST, 71 MST, 202 SS, and 111 HSS of B. napus inbred lines were screened during the germination stage. Furthermore, we proposed a mathematical evaluation model to assess the salt tolerance. We found that the SFW was a reliable trait for evaluating salt tolerance of B. napus inbred lines. These results will greatly contribute to the evaluation and breeding of salt tolerant B. napus.
Author Contributions
BW and ML designed the research. HW, JG, CW, KL, XZ, and ZY performed the experiments. HW and BW wrote the manuscript with contributions from the other authors. All authors analyzed the data.
Funding
This work was supported by the National Natural Science Foundation of China (Grant Nos. 31570251 and 31770288), the independent innovation and achievement transformation of special major key technical plans of Shandong Province (Grant Nos. 2015ZDJS03002 and 2017CXGC0313), the Natural Science Research Foundation of Shandong Province (Grant No. ZR2017MC003), and the Higher Educational Science and Technology Program of Shandong Province (Grant No. J17KA136).
Conflict of Interest Statement
The authors declare that the research was conducted in the absence of any commercial or financial relationships that could be construed as a potential conflict of interest.
Supplementary Material
The Supplementary Material for this article can be found online at: https://www.frontiersin.org/articles/10.3389/fpls.2019.00530/full#supplementary-material
References
Abbas, M. K., Ali, A. S., Hasan, H. H., and Ghal, R. H. (2013). Salt tolerance study of six cultivars of rice (Oryza sativa L.) during germination and early seedling growth. J. Agric. Sci. 5, 250–259.
Akbari, G., Sanavy, S. A., and Yousefzadeh, S. (2007). Effect of auxin and salt stress (NaCl) on seed germination of wheat cultivars (Triticum aestivum L.). Pak. J. Biol. Sci. 10, 2557–2561. doi: 10.3923/pjbs.2007.2557.2561
Alvarado, A. D., Bradford, K. J., and Hewitt, J. D. (1987). Osmotic priming of tomato seeds: effects on germination, field emergence, seedling growth, and fruit yield. Mol. Microbiol. 62, 566–579.
Asch, F., Dingkuhn, M., Dörffling, K., and Miezan, K. (2000). Leaf K/Na ratio predicts salinity induced yield loss in irrigated rice. Euphytica 113, 109–118.
Ashraf, M., and McNeilly, T. (2004). Salinity tolerance in Brassica oilseeds. Crit. Rev. Plant Sci. 23, 157–174. doi: 10.1007/s11103-014-0201-1
Ashraf, M., and Wu, L. (1994). Breeding for salinity tolerance in plants. Crit. Rev. Plant Sci. 13, 17–42.
Ashraf, M. Y., Awan, A. R., and Mahmood, K. (2012). Rehabilitation of saline ecosystems through cultivation of salt tolerant plants. Pak. J. Bot.44, 69–75.
Ayaz, F. A., Kadioglu, A., and Urgut, R. T. (2000). Water stress effects on the content of low molecular weight carbohydrates and phenolic acids in Cienanthe setosa. Can. J. Plant Sci. 80, 373–378. doi: 10.4141/p99-005
Azza, M. A. M., Fatma El-Quensi, E. M., and Farahat, M. M. (2007). Responses of ornamental plants and woody trees to salinity. World J. Agric. Sci. 3, 386–395.
Carpycy, E. B., Celyk, N., and Bayram, G. (2009). Effects of salt stress on germination of some maize (Zea mays L.) cultivars. Afr. J. Biotechnol. 8, 4918–4922.
Chen, X., Min, D., Yasir, T. A., and Hu, Y. G. (2012). Evaluation of 14 morphological, yield-related and physiological traits as indicators of drought tolerance in Chinese winter bread wheat revealed by analysis of the membership function value of drought tolerance (MFVD). Field Crops Res. 137, 195–201. doi: 10.1016/j.fcr.2012.09.008
Cokkızgın, A. (2012). Salinity stress in common bean (Phaseolus vulgaris L.) seed germination. Not. Bot. Horti Agrobo. 40, 177–182. doi: 10.1007/s11356-017-9847-y
Cramer, G. R., Urano, K., Delrot, S., Pezzotti, M., and Shinozaki, K. (2011). Effects of abiotic stress on plants: a systems biology perspective. BMC Plant Biol. 11:163. doi: 10.1186/1471-2229-11-163
Deng, Y., Yuan, F., Feng, Z., Ding, T., Song, J., and Wang, B. (2014). Comparative study on seed germination characteristics of two species of Australia saltbush under salt stress. Acta Ecol. Sin. 34, 337–341. doi: 10.1016/j.chnaes.2013.07.011
Ding, T., Yang, Z., Wei, X., Yuan, F., Yin, S., and Wang, B. (2018). Evaluation of salt-tolerant germplasm and screening of the salt-tolerance traits of sweet sorghum in the germination stage. Funct. Plant Biol. 45,1073–1081.
Feizi, M., Aghakhani, A., Mostafazadeh-Frad, B., and Heidarpour, M. (2007). Salt tolerance of wheat according to soil and drainage water salinity. Pak. J. Biol. Sci. 10, 2824–2830. doi: 10.3923/pjbs.2007.2824.2830
Ganie, S. A., Borgohain, M. J., Kritika, K., Talukdar, A., Pani, D. R., and Mondal, T. K. (2016). Assessment of genetic diversity of Saltol QTL among the rice (Oryza sativa L.) genotypes. Physiol. Mol. Biol. Plant 22, 107–114. doi: 10.1007/s12298-016-0342-6
Garcia, A., Senadhira, D., Flowers, T. J., and Yeo, A. R. (1995). The effects of selection for sodium transport and of selection for agronomic characteristics upon salt resistance in rice (Oryza sativa, L.). Theor. Appl. Genet. 90, 1106–1111. doi: 10.1007/BF00222929
Ghoulam, C., and Fares, K. (2001). Effect of salinity on seed germination and early seedling growth of sugar beet (Beta vulgaris L.). Seed Sci. Technol. 29,357–364.
Guo, J., Li, Y., Han, G., Song, J., and Wang, B. (2018). NaCl markedly improved the reproductive capacity of the euhalophyte Suaeda salsa. Funct. Plant Biol. 45, 350–361.
Guo, Y. H., Jia, W. J., Song, J., Wang, D., Chen, M., and Wang, B. S. (2012). Thellungilla halophila is more adaptive to salinity than Arabidopsis thaliana at stages of seed germination and seedling establishment. Acta Physiol. Plant 34, 1287–1294. doi: 10.1007/s11738-012-0925-y
Hakim, M. A., Juraimi, A. S., Begum, M., Hanafi, M. M., Ismail, M. R., and Selamat, A. (2010). Effect of salt stress on germination and early seedling growth of rice (Oryza sativa L.). Afr. J. Biotechnol. 9, 1911–1918. doi: 10.5897/ajb09.1526
Heenan, D. P., Lewin, L. G., and McCaffery, D. W. (1988). Salinity tolerance in rice varieties at different growth stages. Aus. J. Exp. Agric. 28,343–349.
Hu, D. X., Wu, D. M., You, J. C., He, Y. J., and Qian, W. (2018). Principal component analysis and comprehensive evaluation on salt tolerance related traits in Brassica napus L. Bot. Res. 07, 101–112. doi: 10.12677/br.2018.72014
Jamil, M., Lee, K. B., Jung, K. Y., Lee, D. B., Han, M. S., and Rha, E. S. (2007). Salt stress inhibits germination and early seedling growth in cabbage (Brassica oleracea capitata L.). Pak. J. Biol. Sci. 10, 910–914. doi: 10.3923/pjbs.2007.910.914
Jones, G. W., and Gorham, J. (2002). “Intra- and inter-cellular compartmentation of ions-a study in specificity and plasticity,” in Salinity: Environment-Plants-Molecules, eds A. Läuchli and U. Lüttge (Dordrecht: Kluwer), 159–180. doi: 10.1007/0-306-48155-3_8
Kumar, V., Shriram, V., Kishor, P. B. K., Jawali, N., and Shitole, M. G. (2010). Enhanced proline accumulation and salt stress tolerance of transgenic indica, rice by over-expressing P5CSF129A, gene. Plant Biotechnol. Rep. 4, 37–48. doi: 10.1007/s11816-009-0118-3
Long, W. H., Pu, H. M., Zhang, J. F., Qi, C. K., and Zhang, X. K. (2013). Screening of Brassica napus for salinity tolerance at germination stage. Chi. J. Oil Crop Sci. 35, 271–275.
Maas, E. V. (1993). “Testing crops for salinity tolerance,” in Proceeding of the Workshop on Adaptation of Plants to Soil Stresses, Lincoln.
Makihara, D., Hirai, Y., Tsuda, M., and Okamoto, K. (2001). Evaluation of salinity tolerance in Rice. Photosynthesis of excised leaves in relation to sodium accumulation. Jap. J. Crop Sci. 70, 78–83. doi: 10.1626/jcs.70.78
Pakniyat, H., Handley, L. L., Thomas, W. T. B., Connolly, T., Macaulay, M., Caligari, P. D. S., et al. (1997). Comparison of shoot dry weight, Na +, content and δ 13C values of arie and other semi-dwarf barley mutants under salt-stress. Euphytica 94, 7–14.
Qi, C. H., Chen, M., Song, J., and Wang, B. S. (2009). Increase in aquaporin activity is involved in leaf succulence of the euhalophyte Suaeda salsa, under salinity. Plant Sci. 176, 200–205. doi: 10.1016/j.plantsci.2008.09.019
Rhodes, D., Nadolska-Orczyk, A., and Rich, P. J. (2002). Salinity, Osmolytes and Compatible Solutes. Dordrecht: Springer.
Rogers, M. E., and Noble, C. L. (1992). Variation in growth and ion accumulation between two selected populations of Trifolium repens, L. differing in salt tolerance. Plant Soil 146, 131–136. doi: 10.1007/bf00012005
Ruan, S., Xue, Q., and Tylkowska, K. (2002). The influence of priming on germination of rice (Oryza sativa L.) seeds and seedling emergence and performance in flooded soil. Seed Sci. Technol. 30, 61–67.
Sayed, H. I. (1985). Diversity of salt tolerance in a germplasm collection of wheat (Triticum aestivum L.). Theor. Appl. Genet. 69, 651–657. doi: 10.1007/BF00251118
Song, J., Fan, H., Zhao, Y., Jia, Y., Du, X., and Wang, B. (2008). Effect of salinity on germination, seedling emergence, seedling growth and ion accumulation of a euhalophyte Suaeda salsa in an intertidal zone and on saline inland. Aquat. Bot. 88, 331–337. doi: 10.1016/j.aquabot.2007.11.004
Song, J., and Wang, B. (2015). Using euhalophytes to understand salt tolerance and to develop saline agriculture: Suaeda salsa as a promising model. Ann. Bot. 115, 541–553. doi: 10.1093/aob/mcu194
Tavakkoli, E., Fatehi, F., Coventry, S., Rengasamy, P., and McDonald, G. K. (2011). Additive effects of Na+ and Cl- ions on barley growth under salinity stress. J. Exp. Bot. 62, 2189–2203. doi: 10.1093/jxb/erq422
Yang, M. F., Song, J., and Wang, B. S. (2010). Organ-specific responses of vacuolar H+-ATPase in the shoots and roots of C3 halophyte Suaeda salsa to NaCl. J. Integr. Plant Biol. 52, 308–314. doi: 10.1111/j.1744-7909.2010.00895.x
Yang, Z., and Wang, B. (2015). Present status of saline soil resources and countermeasures for improvement and utilization in China. Shandong Agri. Sci. 47, 125–130.
Yuan, F., Leng, B., and Wang, B. (2016). Progress in studying salt secretion from the salt glands in recretohalophytes: how do plants secrete salt? Front. Plant Sci. 7:977. doi: 10.3389/fpls.2016.00977
Keywords: Brassica napus L., germination, evaluation, screening of salt-tolerant index, salt tolerance
Citation: Wu H, Guo J, Wang C, Li K, Zhang X, Yang Z, Li M and Wang B (2019) An Effective Screening Method and a Reliable Screening Trait for Salt Tolerance of Brassica napus at the Germination Stage. Front. Plant Sci. 10:530. doi: 10.3389/fpls.2019.00530
Received: 21 December 2018; Accepted: 05 April 2019;
Published: 26 April 2019.
Edited by:
Eric Ruelland, Centre National de la Recherche Scientifique (CNRS), FranceCopyright © 2019 Wu, Guo, Wang, Li, Zhang, Yang, Li and Wang. This is an open-access article distributed under the terms of the Creative Commons Attribution License (CC BY). The use, distribution or reproduction in other forums is permitted, provided the original author(s) and the copyright owner(s) are credited and that the original publication in this journal is cited, in accordance with accepted academic practice. No use, distribution or reproduction is permitted which does not comply with these terms.
*Correspondence: Baoshan Wang, bswang@sdnu.edu.cn