 Kun Ning
 Changjun Ding
 Wenxu Zhu
 Weixi Zhang1,2
 Yingbai Shen
 Xiaohua Su
- 1State Key Laboratory of Tree Genetics and Breeding, Research Institute of Forestry, Chinese Academy of Forestry, Beijing, China
- 2Key Laboratory of Tree Breeding and Cultivation, State Forestry Administration, Beijing, China
- 3College of Forestry, Shenyang Agricultural University, Shenyang, China
- 4Shandong Provincial Key Laboratory of Forest Tree Genetic Improvement, Shandong Academy of Forestry, Jinan, China
- 5College of Biological Sciences and Technology, Beijing Forestry University, Beijing, China
- 6Co-Innovation Center for Sustainable Forestry in Southern China, Nanjing Forestry University, Nanjing, China
Poplar, a model for woody plant research, is the most widely distributed tree species in the world. Metabolites are the basis of phenotypes, allowing an intuitive and effective understanding of biological processes and their mechanisms. However, metabolites in non-transgenic and multi-gene transgenic poplar remains poorly characterized, especially in regards of the influences on quantity and in the analysis of the relative abundance of metabolites after the introduction of multi stress-related genes. In this study, we investigated the cambium metabolomes of one non-transgenic (D5-0) and two multi-gene (vgb, SacB, JERF36, BtCry3A, and OC-I) transgenic lines (D5-20 and D5-21) of hybrid poplar (Populus × euramericana ‘Guariento’) using both gas chromatography–mass spectrometry (GC–MS) and ultra-performance liquid chromatography-tandem mass spectrometry (UPLC–MS/MS). We aimed to explore the effects of the exogenous genes on metabolite composition and to screen out metabolites with important biological functions. Finally, we identified 239 named metabolites and determined their relative abundance. Among these, 197 metabolites had a different abundance across the three lines. These methabolites spanned nine primary and 44 secondary metabolism pathways. Arginine and glutamate, as substrates and intermediates in nitrogen metabolism, and important in growth and stress-related processes, as well as sucrose, uridine diphosphate glucose, and their derivatives, precursors in cell wall pathways, and catechol, relevant to insect resistance, differed greatly between the genetically modified and non-transgenic poplar. These findings may provide a basis for further study of cambium metabolism, and fully understand metabolites associated with stress response.
Introduction
In gymnosperms and dicotyledons, the cambium, a thin layer of ubiquitous active lateral meristem, promotes the continuous thickening of plants providing partially undifferentiated cells for plant growth. Moreover, it forms parallel rows of cells, which result in secondary tissue (Guo et al., 2009). Cambium is vital to the growth and development of woody plants. Like most other pioneer species, poplar is characterized by rapid growth and can quickly colonize open areas (Broeck, 2003). However, drought, high salinity, flooding, pests, diseases as well as biotic and abiotic stresses affect the yield and quality of poplar (Bartels and Sunkar, 2005; Ferry et al., 2006; Sairam et al., 2008). Previous works created numerous transgenic trees with the ability to resist adverse environmental stresses. Nevertheless, simultaneous enhancement of multiple characteristics continues to be a matter of great urgency and practical significance in woody species.
In a previous study, we generated a multi-gene transgenic poplar (Populus × euramericana ‘Guariento’), harboring five exogenous stress-related genes [vgb, encoding Vitreoscilla hemoglobin (VHb); SacB, encoding levansucrase related to fructan biosynthesis in Bacillus subtilis; JERF36, encoding jasmonate/ethylene-responsive factor protein from tomato; BtCry3A, encoding δ-endotoxin from Bacillus thuringiensis and OC-I, encoding the proteinase inhibitor oryzacystatin I from rice], co-transferring them into poplar (Populus × euramericana ‘Guariento’) using biolistic bombardment (Wang et al., 2007). Transcriptome analysis also found more differential expressed genes related to stress responses in the transgenic line D5-20 (Zhang et al., 2014). However, how these transferred multigene activate and change the plant metabolome to cope with stressors is still unknown.
Compared with the substantial achievements of whole genome re-sequencing and RNA sequencing, metabolomics continues to lag behind in tree biology (Robinson et al., 2017). Metabolomics is a valuable tool for comprehensive, non-biased, and high-throughput analysis of complex metabolite in specific organisms or environmental stressors, and enhances the understanding of the mechanisms behind biological responses (Gibbons et al., 2015; Meijón et al., 2016). Nowadays, the combination of MS-based platforms and other analytical technologies can increase metabolome coverage (Escandón et al., 2018). Gas chromatography–mass spectrometry (GC–MS) can measure the majority of primary metabolites, whereas liquid chromatography–mass spectrometry (LC–MS) can better cover large hydrophobic metabolites predominant in secondary metabolisms (Doerfler et al., 2013). For example, this allowed for the comparison of the metabolome of genetically modified and non-genetically modified soybean seeds for biosafety assessment (Clarke et al., 2013). Moreover, as a sugar-metabolizing enzyme, UDP-glucose pyrophosphorylase (UGPase) catalyzes the reversible reaction of UDP-glucose and pyrophosphate, metabolic profiling of xylem, phloem, and leaves of PdUGPase2-overexpressing Populus deltoides using GC–MS showed that PdUGPase2 disrupts the primary and secondary metabolisms, reduces the levels of sugar and starch, and increased phenolic compounds (Payyavula et al., 2014).
At present, the study of plant metabolites explores plant systemic response to genetic and environmental changes to react to adverse environmental stress, and to improve crop yield and quality (Saito and Matsuda, 2010; Adamski and Suhre, 2013). Furthermore, it is an important research tool for screening crop cultivars and evaluating transgenic plants (Keurentjes, 2009; Yang et al., 2014). Many metabolic studies focus on agricultural crops, yet large scale metabolomic studies in forestry are lacking. Furthermore, non-targeted metabolic profile analysis between non-transgenic and transgenic perennial poplar using ultra-performance liquid chromatography-tandem mass spectrometry (UHLC/MS/MS) or GC/MS have been rarely reported in woody plants, especially to investigate metabolic adjustments in plant after the transformation of multiple genes. Here, we conducted a large-scale non-targeted metabolomic analysis of the cambium of two transgenic and one non-transgenic lines of poplar. Our findings may identify metabolic markers for plant stress response.
Materials and Methods
Plant Material and Cambium Collection
One non-transgenic (D5-0) and two transgenic 7-year-old poplar lines (D5-20 and D5-21), respectively, were grown under natural conditions at the Shou Guang test forest of the Chinese Academy of Forestry in Shandong, China. During the most rapid seasonal growth stage, 18 cambium tissue samples (six biological replicates per line) were scraped with a knife and removed from the tree bark 3 m from the ground. The samples were quickly frozen in liquid nitrogen and stored at –80°C.
Metabolite Profiling
Metabolic profiling of poplar cambium was performed in SJTU-Metabolon Joint Metabolomics Laboratory using a global unbiased platform. More detailed information about the instrument, data acquisition and processing, and metabolite identification and quantitation, were published elsewhere (Evans et al., 2009; Ohta et al., 2009). For sample extraction, cambiums of each sample (six biological replicates each sample) were ground into a fine powder in liquid nitrogen using a SPEX 6870 Freezer/Mill (SPEX SamplePrep, Metuchen, NJ, United States), and then lyophilized in a vacuum-freeze dryer (FreeZone Freeze Dry System, Labconco, KS, United States). Lyophilized powder (40 mg) of each sample was extracted at room temperature using 400 μl methanol extraction buffer containing recovery standards (Qu et al., 2014).
For GC/MS analysis, a gas chromatography system (CP-3800 Varian, Inc.) that equipped with a CP-8400 automatic injector and a mass spectrometry detector system of 4,000 electron impact ion trap were employed herein. A VF-1ms capillary column (30 m × 0.25 mm × 0.25 μm) was used with a constant flow rate at 1.0 mL/min of helium as carrier gas. Samples were re-dried under vacuum desiccation for a minimum of 24 h, and then derivatized using BSTFA (bistrimethyl-silyl-triflouroacetamide) in dried nitrogen. The derivatized samples were transferred to autosampler vials (2 mL GC), and each sample of 1 μL was injected into GC–MS with the 25:1 split ratio. The GC column was 5% phenyl and the initial oven temperature was kept at 100°C for 2 min, then with a rate of 10°C/min to increase 300°C and remained at 300°C for 10 min. The temperatures of the injector and transfer pipeline were set at 250°C (Jung et al., 2013). The metabolites were separated by chromatographic column with a time gradient elution and then detected by mass spectrometer, the retention time was the peaking time of chromatography. Electron impact ionization with 70 eV ionization energy and full scan in the range of 50–1,000 m/z were used to analyze the samples on a Thermo-Finnigan Trace DSQ fast-scanning single-quadrupole mass spectrometer. The retention time and molecular weight (m/z) for all detectable ions were measured.
The UPLC/MS/MS platform was based on a Waters Acquity UPLC (Waters, Milford, MA, United States) and a linear trap quadrupole (LTQ) mass spectrometer (Thermo Fisher, Corporation), which had a linear ion-trap (LIT) front end and a Fourier transform ion cyclotron resonance (FT-ICR) mass spectrometer backend. The extract samples were split into two aliquots, dried and then reconstituted in acidic or basic LC-compatible solvents, and each solvent contained 11 or more internal standards at fixed concentrations (Chen et al., 2016). The acidic extract samples of one aliquot was analyzed for positive ions, while the other basic extract samples was analyzed for negative ions in two independent injections using separate acid/base dedicated 2.1 mm × 100 mm Waters BEH C18 1.7 μm particle columns heated to 40°C. Extracts reconstituted in acidic conditions were gradient eluted at 350 μl/min using (a) 0.1% formic acid in water and (b) methanol containing 0.1% formic acid (0 to 70% b in 4 min, 70–98% b in 0.5 min, and 98% b for 0.9 min), while the extracts reconstituted in ammonium bicarbonate used: (a) 6.5 mM ammonium bicarbonate in water, pH8.0 and (b) 6.5 mM ammonium bicarbonate in 95/5 methanol/water (the same gradient profile as above) at 350 μl/min (Evans et al., 2009). The mass spectrometry analysis was performed alternately between full MS and data-dependent MS/MS scans using dynamic exclusion.
The metabolites were identified by automatically matching ion features against the Metabolon’s reference library entries. The reference library of each platform was generated from approximately 1,500 authentic standards and each library contains retention time index (RI), molecular ion mass (m/z), and MS/MS spectra data on all molecules as well as their associated adducts, in-source fragments, and multimers up to ∼10,000 recorded (Evans et al., 2009). The combination of chromatographic retention index and mass spectrum characteristics showed an indication to match the specific metabolite.
Data Extraction and Statistical Analysis
Data normalization was performed for internal consistency by processing a constant weight per volume of extraction solvent for each sample, and each compound was corrected by registering the medians to equal one (1.00) and normalizing each data point proportionately in run-day blocks. For UPLC/MS/MS platform, accurate mass determination could be performed for the ions with counts greater than two million and made on the parent ion as well as fragments for that the typical mass error less than 5 ppm. Peaks were identified using Metabolon’s proprietary peak integration in-house software, and component parts were stored in a separate and specifically designed complex data structure (Chen et al., 2016). The one-way analysis of variance (ANOVA) was used to determine the significant differences between the means of tested groups. Classification analysis was conducted using random forest analyses. Principle component analysis was carried out using SIMCA-P 12.0 software. p-Values and False discovery rate (FDR) of each correlation were calculated using Cor.test function (Benjamini and Yekutieli, 2001). A p-value of <0.05 was considered statistically significant. FDR was conducted to correct multiple comparisons, while the FDR for a given set of compounds can be estimated using the q-value (Storey and Tibshirani, 2003).
Results
Metabolomic Profiling of Poplar Cambium
We investigated the metabolome of poplar cambium using an untargeted global metabolomic platform that integrated GC/MS and UPLC/MS/MS to evaluate the differences between non-transgenic and transgenic lines. We identify 239 metabolites confirmed by reference standards, and we also determined the relative abundance of metabolites. We constructed a heat map to display the scaled data, arranging compounds by pathway groups. According to annotations in PlantCyc1 and in the Kyoto Encyclopedia of Genes and Genomes (KEGG Compound Database2), the identified metabolites mapped to general biochemical pathways (Dersch et al., 2016). These metabolites divided into nine primary pathways (Figure 1A), which contained to 48 sub-pathways (Supplementary Table 1). Forty-two metabolites showed no significant difference across the three lines. These pathways mapped to most of the primary and secondary metabolisms. We found differences between the six biological replicates, especially in line D5-0. Variation between biological replicates within lines tended to be quite high, often as high as the average variation between lines.
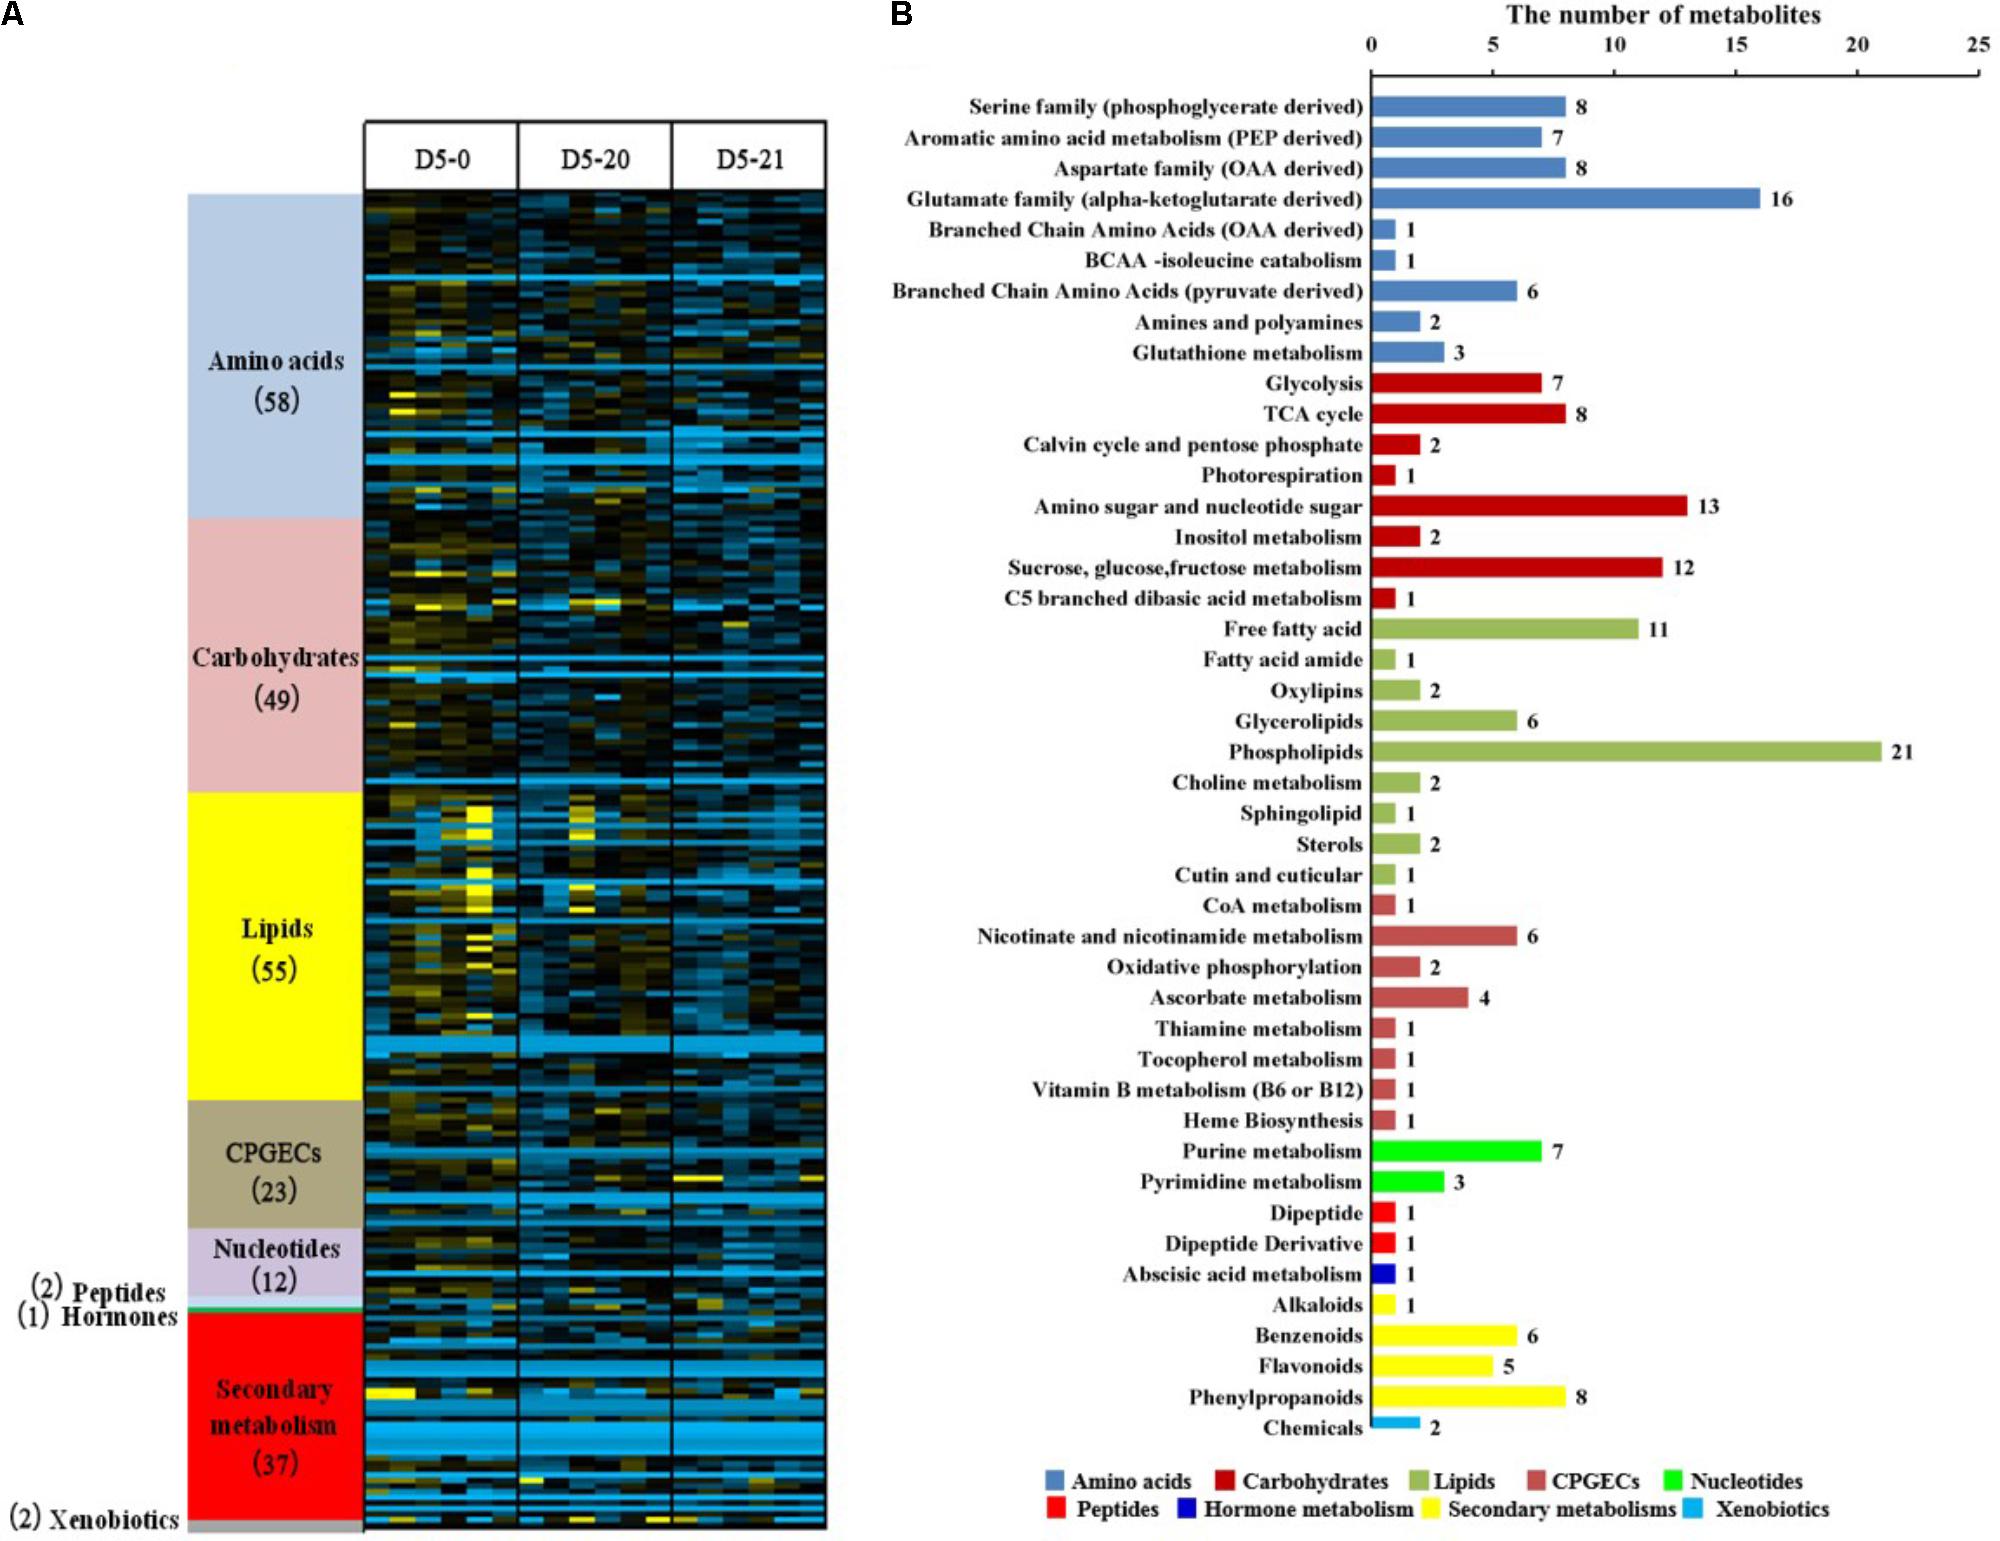
FIGURE 1. Distribution of identified metabolites in the cambium of non-transgenic and transgenic poplar. (A) Heat map showing the clustering of detected metabolites into nine classes across the three lines. Different colors represent nine metabolic pathways of the 239 metabolites, and the numerals in parentheses represent the numbers of metabolites identified in the primary metabolic pathways. (B) The distribution of metabolic pathways of the differential 197 metabolites. Ordinate reports the various metabolic pathways, while abscissa represents the number of metabolites. Different colors represent primary pathways.
Metabolic Variations Between Non-transgenic and Transgenic Poplar
We excluded metabolites which showed no differences between the three lines, obtaining 197 out of 239 metabolites. These were part of nine primary metabolisms and 44 secondary metabolism pathways, including 52 amino acids, 47 lipids, 46 carbohydrates, 20 secondary metabolisms, 17 CPGECs (cofactors, prosthetic groups, electron carriers), 10 nucleotides, two xenobiotics, two peptides, and one hormone metabolism (Figure 1B and Supplementary Table 2). Notably, primary metabolisms involving amino acid, lipids, and carbohydrates account for the 73.6% of the total metabolites and mainly participated in the pathways.
To reduce the complexity of the metabolomics data, we conducted an unsupervised multivariate data analysis method principal component analysis (PCA) of the metabolites showing differences between the different lines (Figure 2). Our PCA analysis with two principal components explaining 48.89% of the overall variance of the metabolite profiles, 34.47 and 14.42% for principal component 1 (PC1) and PC2. The PC scores revealed that compounds from D5-0 clustered separately from both those from D5-20 to D5-21, with only a partial overlap to the compound of line D5-20. Line D5-20 and D5-21 instead clustered together. Line D5-21 was most consistent, and was clearly separated from D5-0.
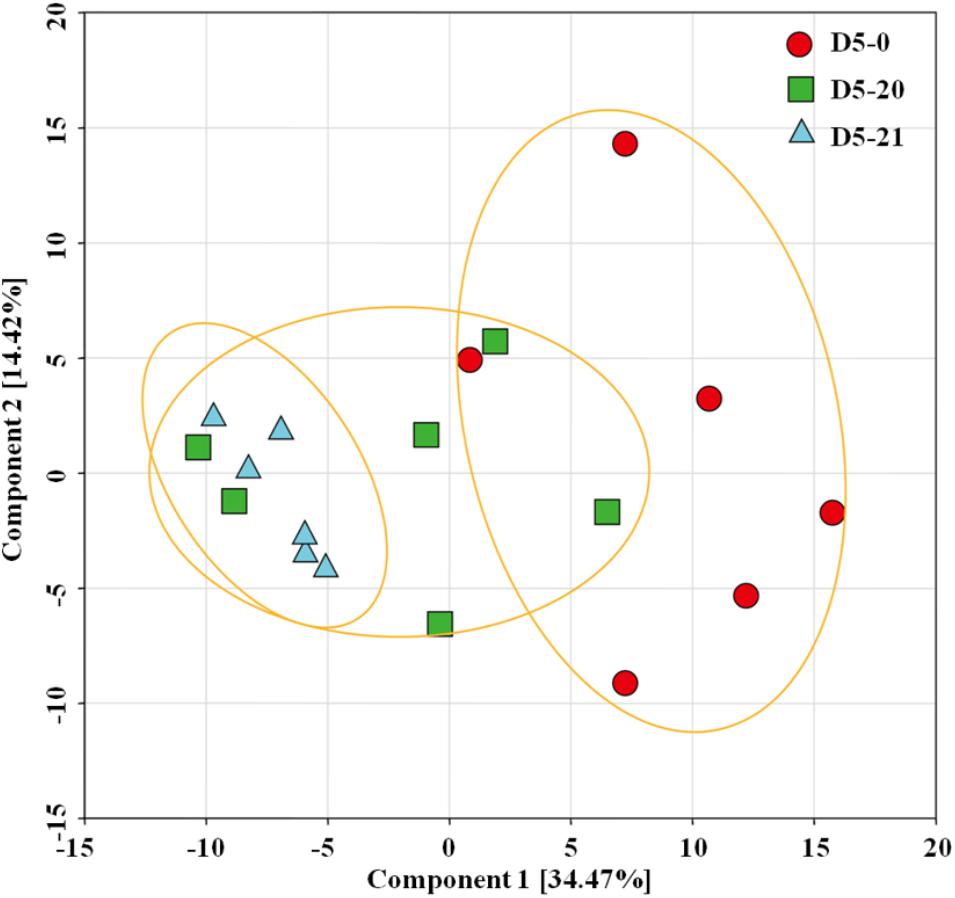
FIGURE 2. Principal component analysis (PCA) score plots of metabolome data from the cambium of transgenic and non-transgenic poplar. PCA score plot of the three lines. The red circle indicates non-transgenic line D5-0, while the green square and blue triangle indicate multi-gene transgenic line D5-20 and D5-21, respectively. The plot displays PC1 on the ordinate axis and PC2 on the abscissa.
To further identify metabolic variation across the cambium of the three lines, we performed a one-way ANOVA (Table 1), where we considered a p-value ≤ 0.05 significant. We observed significant differences between non-transgenic and transgenic poplar. In the comparison between D5-20 and D5-0, we identified a total of 52 significant metabolic changes, containing 20 carbohydrates, nine lipids, seven amino acids and derivatives, seven CPGECs, five secondary metabolites, and four nucleotides, of which five metabolites were increased and 47 metabolites were decreased in line D5-20. In the comparison between D5-21 and D5-0, we observed 83 significant metabolic changes, including 25 amino acids and derivatives, 21 carbohydrates, 17 lipids, eight nucleotides, six CPGECs, four secondary metabolites, and two peptides. Nine of the metabolites were increased and 74 metabolites were decreased in line D5-21. Finally, for the comparison between D5-21 and D5-20, we identified 13 significant metabolic changes, covering one amino acid, three carbohydrates, four lipids, three nucleotides, one peptide, and one secondary metabolite. Two of the metabolites were increased, while 11 metabolites were decreased in line D5-21.
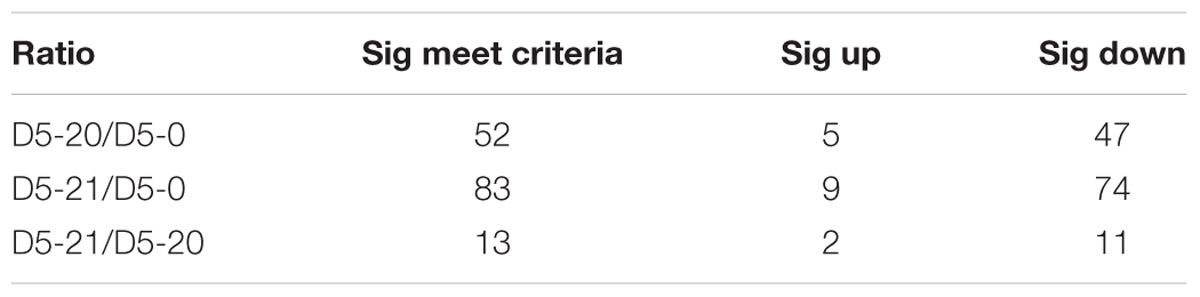
TABLE 1. Analysis of the differences metabolite content between transgenic and non-transgenic poplar by ANOVA.
Metabolic Changes in Transgenic Poplar
When we compared D5-20 and D5-21 to D5-0, metabolites that showed changes were primarily involved in metabolisms of amino acids, carbohydrates, lipids, and secondary metabolites. In the amino acid primary pathway, arginine and glutamate were significantly increased in D5-20 and D5-21. However betaine, 2-hydroxyadipate, 2-pyrrolidinone, and leucine were reduced. The metabolites of carbohydrate metabolic pathways were closely related to glycolysis, citric acid cycle (TCA cycle), and the metabolisms of amino sugar, nucleotide sugar, sucrose, glucose, and fructose. The two carbohydrates which showed the greatest increase were uridine diphosphate glucose (UDP-glucose), and sucrose in D5-20 and D5-21, while the five carbohydrates which showed the greatest decrease were glucuronate, malate, N-acetylglucosamine, ribose, and xylose. In the lipid primary pathway, beta-sitosterol, sphinganine, 2-hydroxyglutarate, 1-stearoylglycerol (1-monostearin), 1-stearoylglycerophosphocholine (18:0), 1-oleoylglycerol (1-monoolein), and 12,13-DiHOME were reduced. In the secondary metabolic pathway, catechol was the most significantly increased in both transgenic poplar, while 4-hydroxybenzoate and 4-hydroxycinnamate were markedly reduced in the transgenic poplar lines. In addition, five metabolites grouped under CPGECs and four metabolites from the nucleotide primary pathways decreased in transgenic lines, the greatest changes occurred in nicotinate/nicotinamide metabolism and purine metabolism. Altogether, compare to non-transgenic line D5-0, we have screened out five significantly increased metabolites in two multi-gene transgenic lines, including two alpha-ketoglutarate derived in amino acid super pathway (arginine and glutamate), two carbohydrates (UDP-glucose and sucrose), and one secondary metabolisms (catechol) (data listed in Supplementary Table 2).
Specific Pathway Related Functional Effects
We used random forest analysis (RF) to assess which compounds contributed most to differentiation between lines. Lipids and pentose derivatives tended to dominate the separation of the cambium samples. The oxylipin 12,13-DiHOME and the pentose sugar acid xylonate, sphinganine, a lipid possibly involved in cutin synthesis, and the pentose sugar acid arabonate were the four most important compounds for correct classification of cambium from each line (Figure 3A).
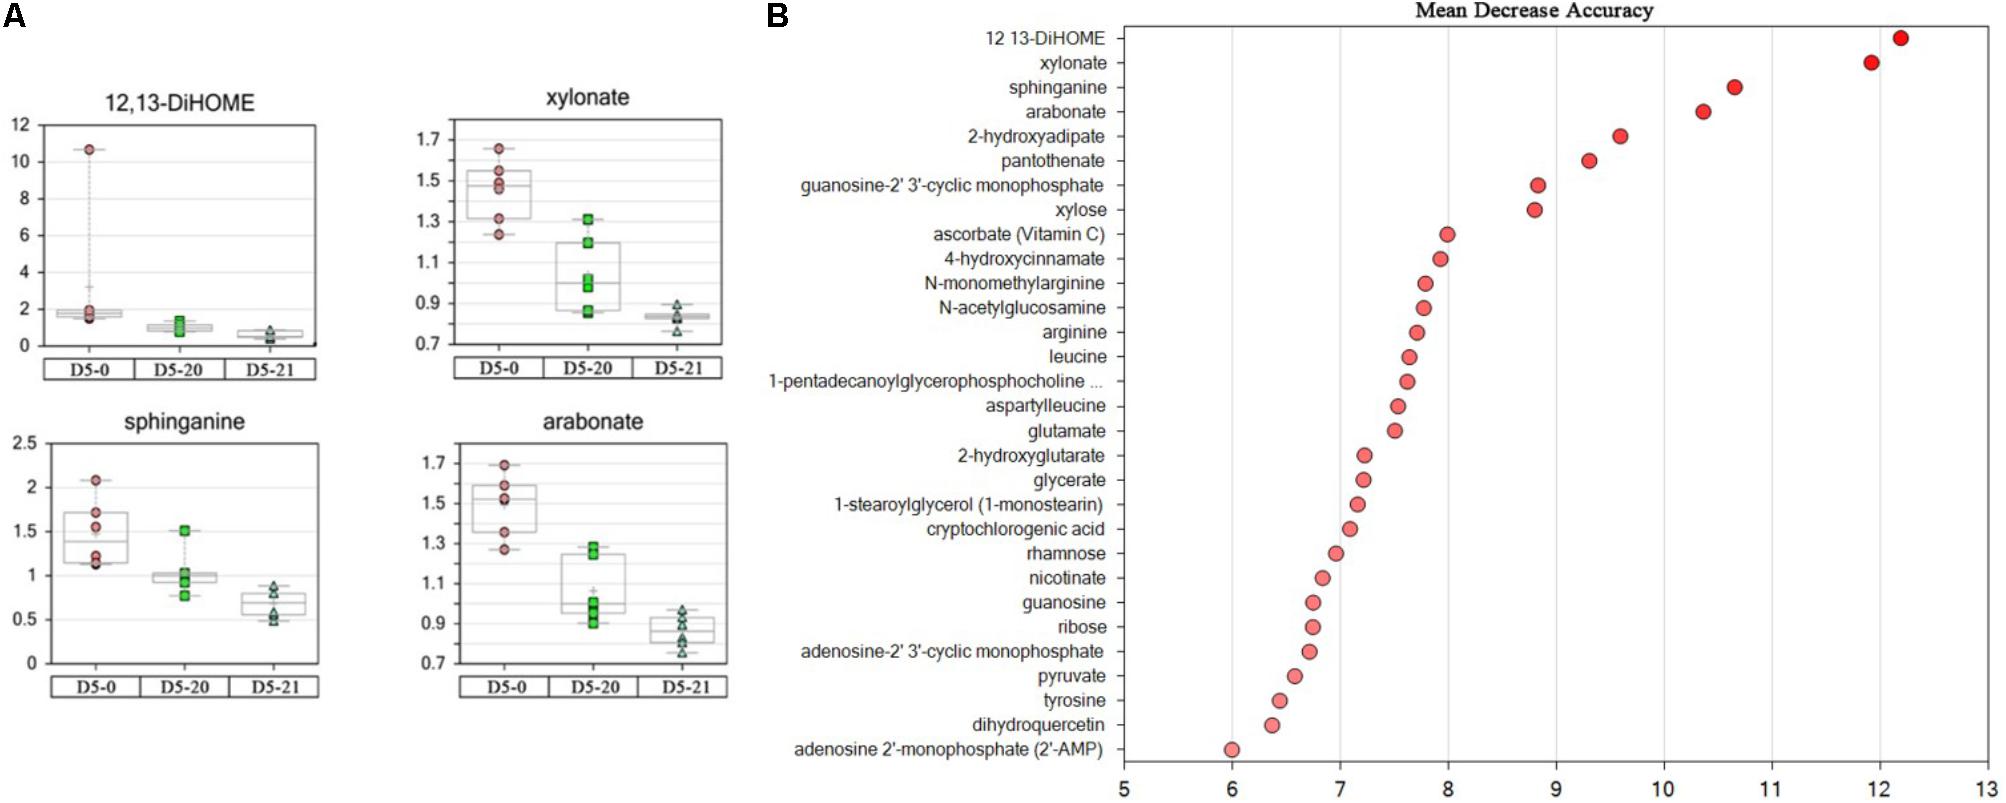
FIGURE 3. Four most important compounds and top 30 metabolites. (A) The four most important compounds for correct classification of MDA value > 10 from non-transgenic and transgenic polar. The ordinates represent scaled intensity. (B) The top 30 metabolites for classification.
The probability that the samples were correctly classified was 72% (Table 2). When calculating the “important variable,” we used “Mean Decrease Accuracy-MDA” to identify the variables (metabolites) that contributed the greatest to the classification. We sorted RF values by the “importance” of metabolites. Figure 3B and Table 3 show the first 30 metabolites and their correct classification.
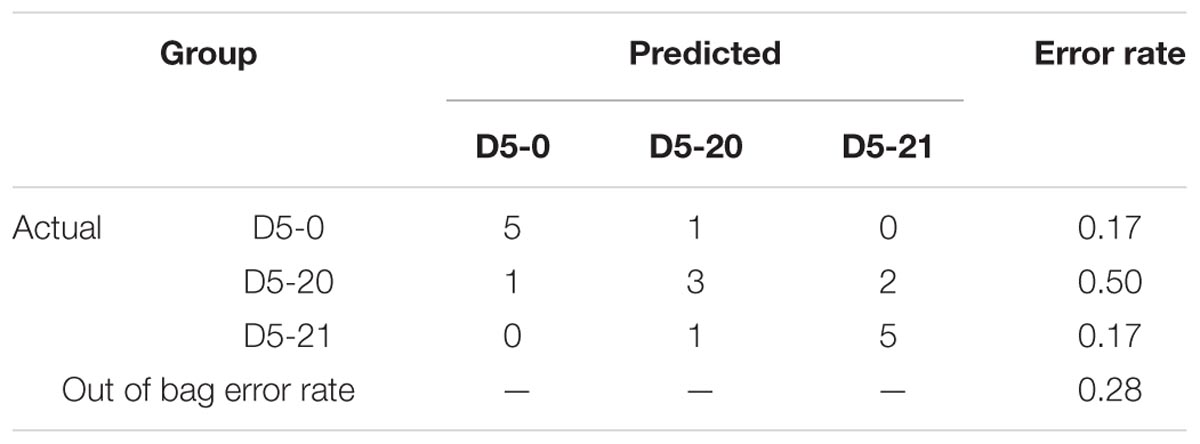
TABLE 2. Random forest analysis used for the analysis of the differences in metabolite content between transgenic and non-transgenic poplar.
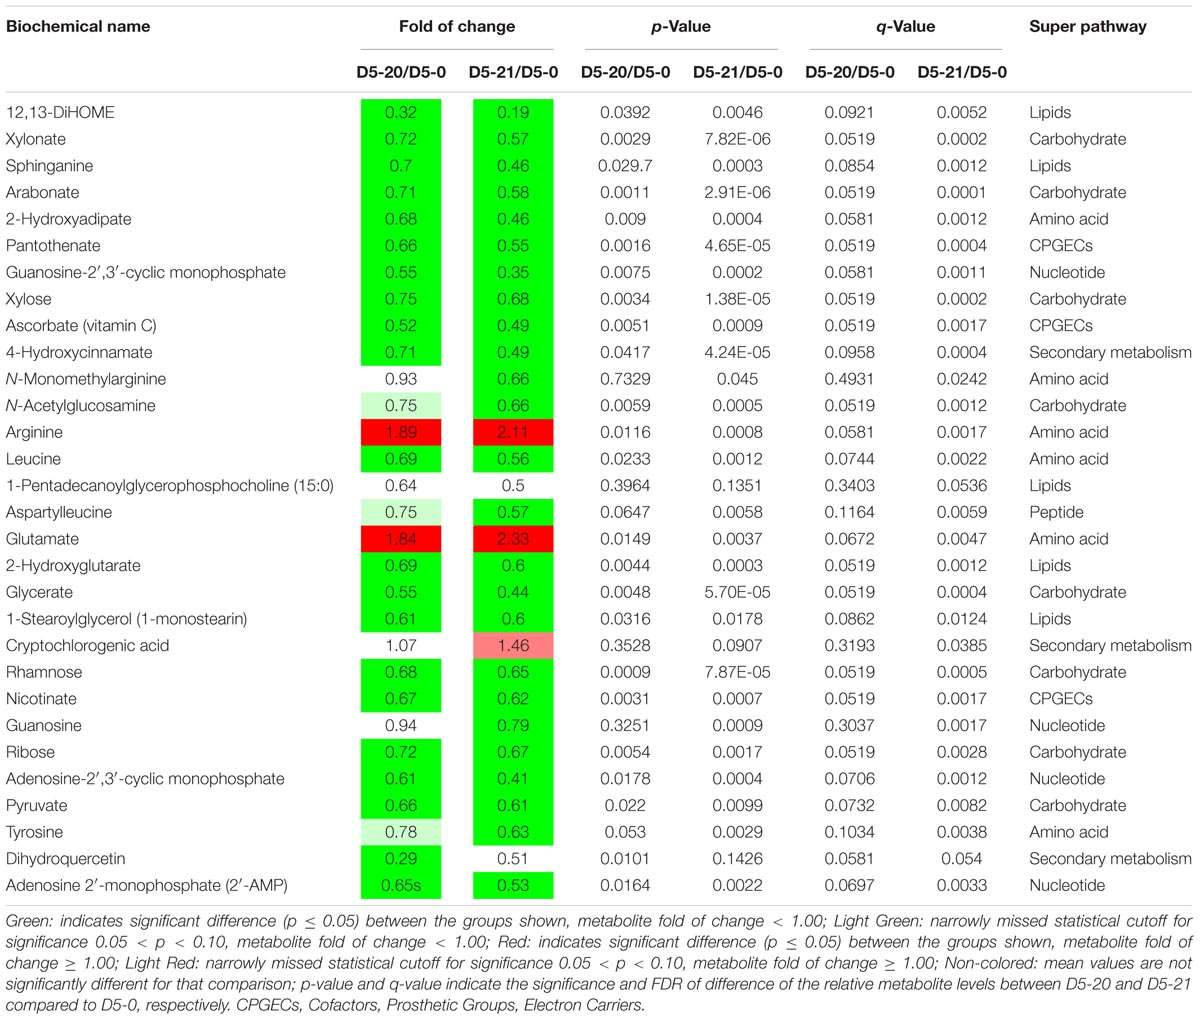
TABLE 3. Top 30 metabolites that contributed significantly to the correct classification of D5-20 and D5-21 compared to D5-0.
We compared the spread of the mean values across the lines, calculated the ratio between maximum and minimum mean values for all compounds, and selected compounds with a variation higher that threefold variation in the ratio between maximum and minimum mean values (Figure 4A). Oxidized lipids were highly variable and higher in D5-0. These may serve as messengers for communication both within and between cells, or may induce structural and metabolic changes in the cell of cambium.
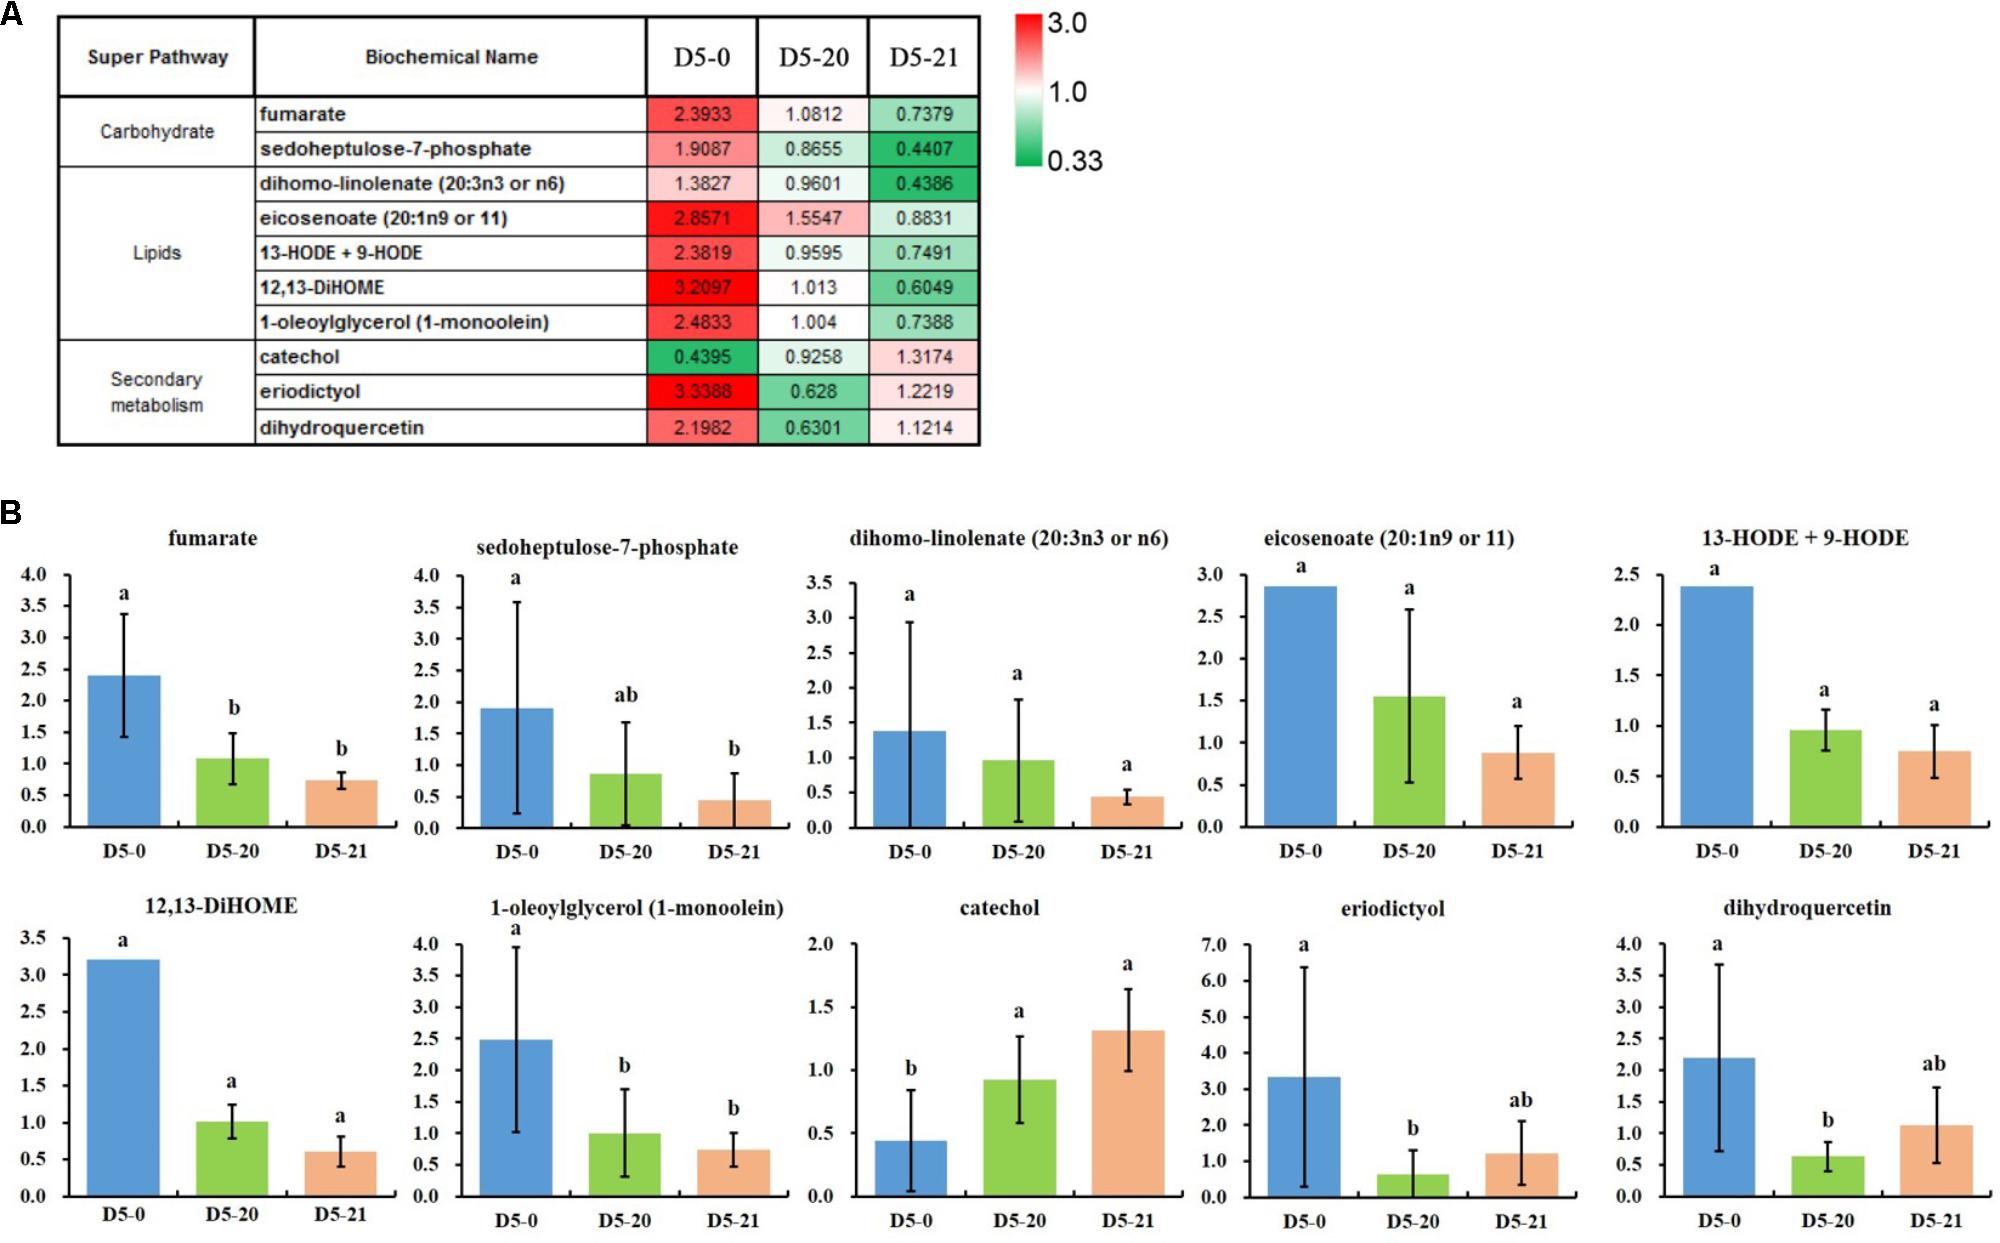
FIGURE 4. The 10 most variable compounds. (A) The ratio between maximum and minimum mean values for the most variable compounds by variety (>3-fold mean range). (B) The relative abundance of the 10 variable compounds. The ordinates represent scaled intensity of the relative abundance. Error bars are shown for six replicates of the relative abundance. Different letters indicate a statistically significant difference when analyzed by one-way ANOVA and a multiple comparison using Duncan’s test at p ≤ 0.05. For column diagram with no standards deviations, eicosenoate (20:1n9 or 11), 13-HODE + 9-HODE and 12,13-DiHOME in D5-0 line, the standards deviations are not shown due to the large variation in the presence of one to two biological replicates and the standards deviations are greater than the average value.
In accordance with the RF data, cambium data were dominated by a disproportionate number of oxidized lipids (e.g., dihomo-linoleate, eicosenoate, 13-HODE+9-HODE, 12,13-DiHOME, and 1-oleoylglycerol) which were highest in D5-0. It is interesting that the secondary metabolite catechol was low in D5-0 line compared to two transgenic lines, while the two flavonoids eriodictyol and dihydroquercetin were high in this same line (Figure 4B).
Compounds Associated With Cell Wall Metabolism
We found pentose derivatives in our cambium RF analysis. Figure 5 shows a wide range of compounds associated with cell wall metabolism. Several pentoses or pentose acids (fucose, arabonate, rhamnose, xylose, and xylonate) were increased in variety D5-0. At the same time, sucrose and UDP-glucose, the major precursors for carbon in the cell wall pathways, were lower in D5-0 compared to the two transgenic lines D5-20 and D5-21.
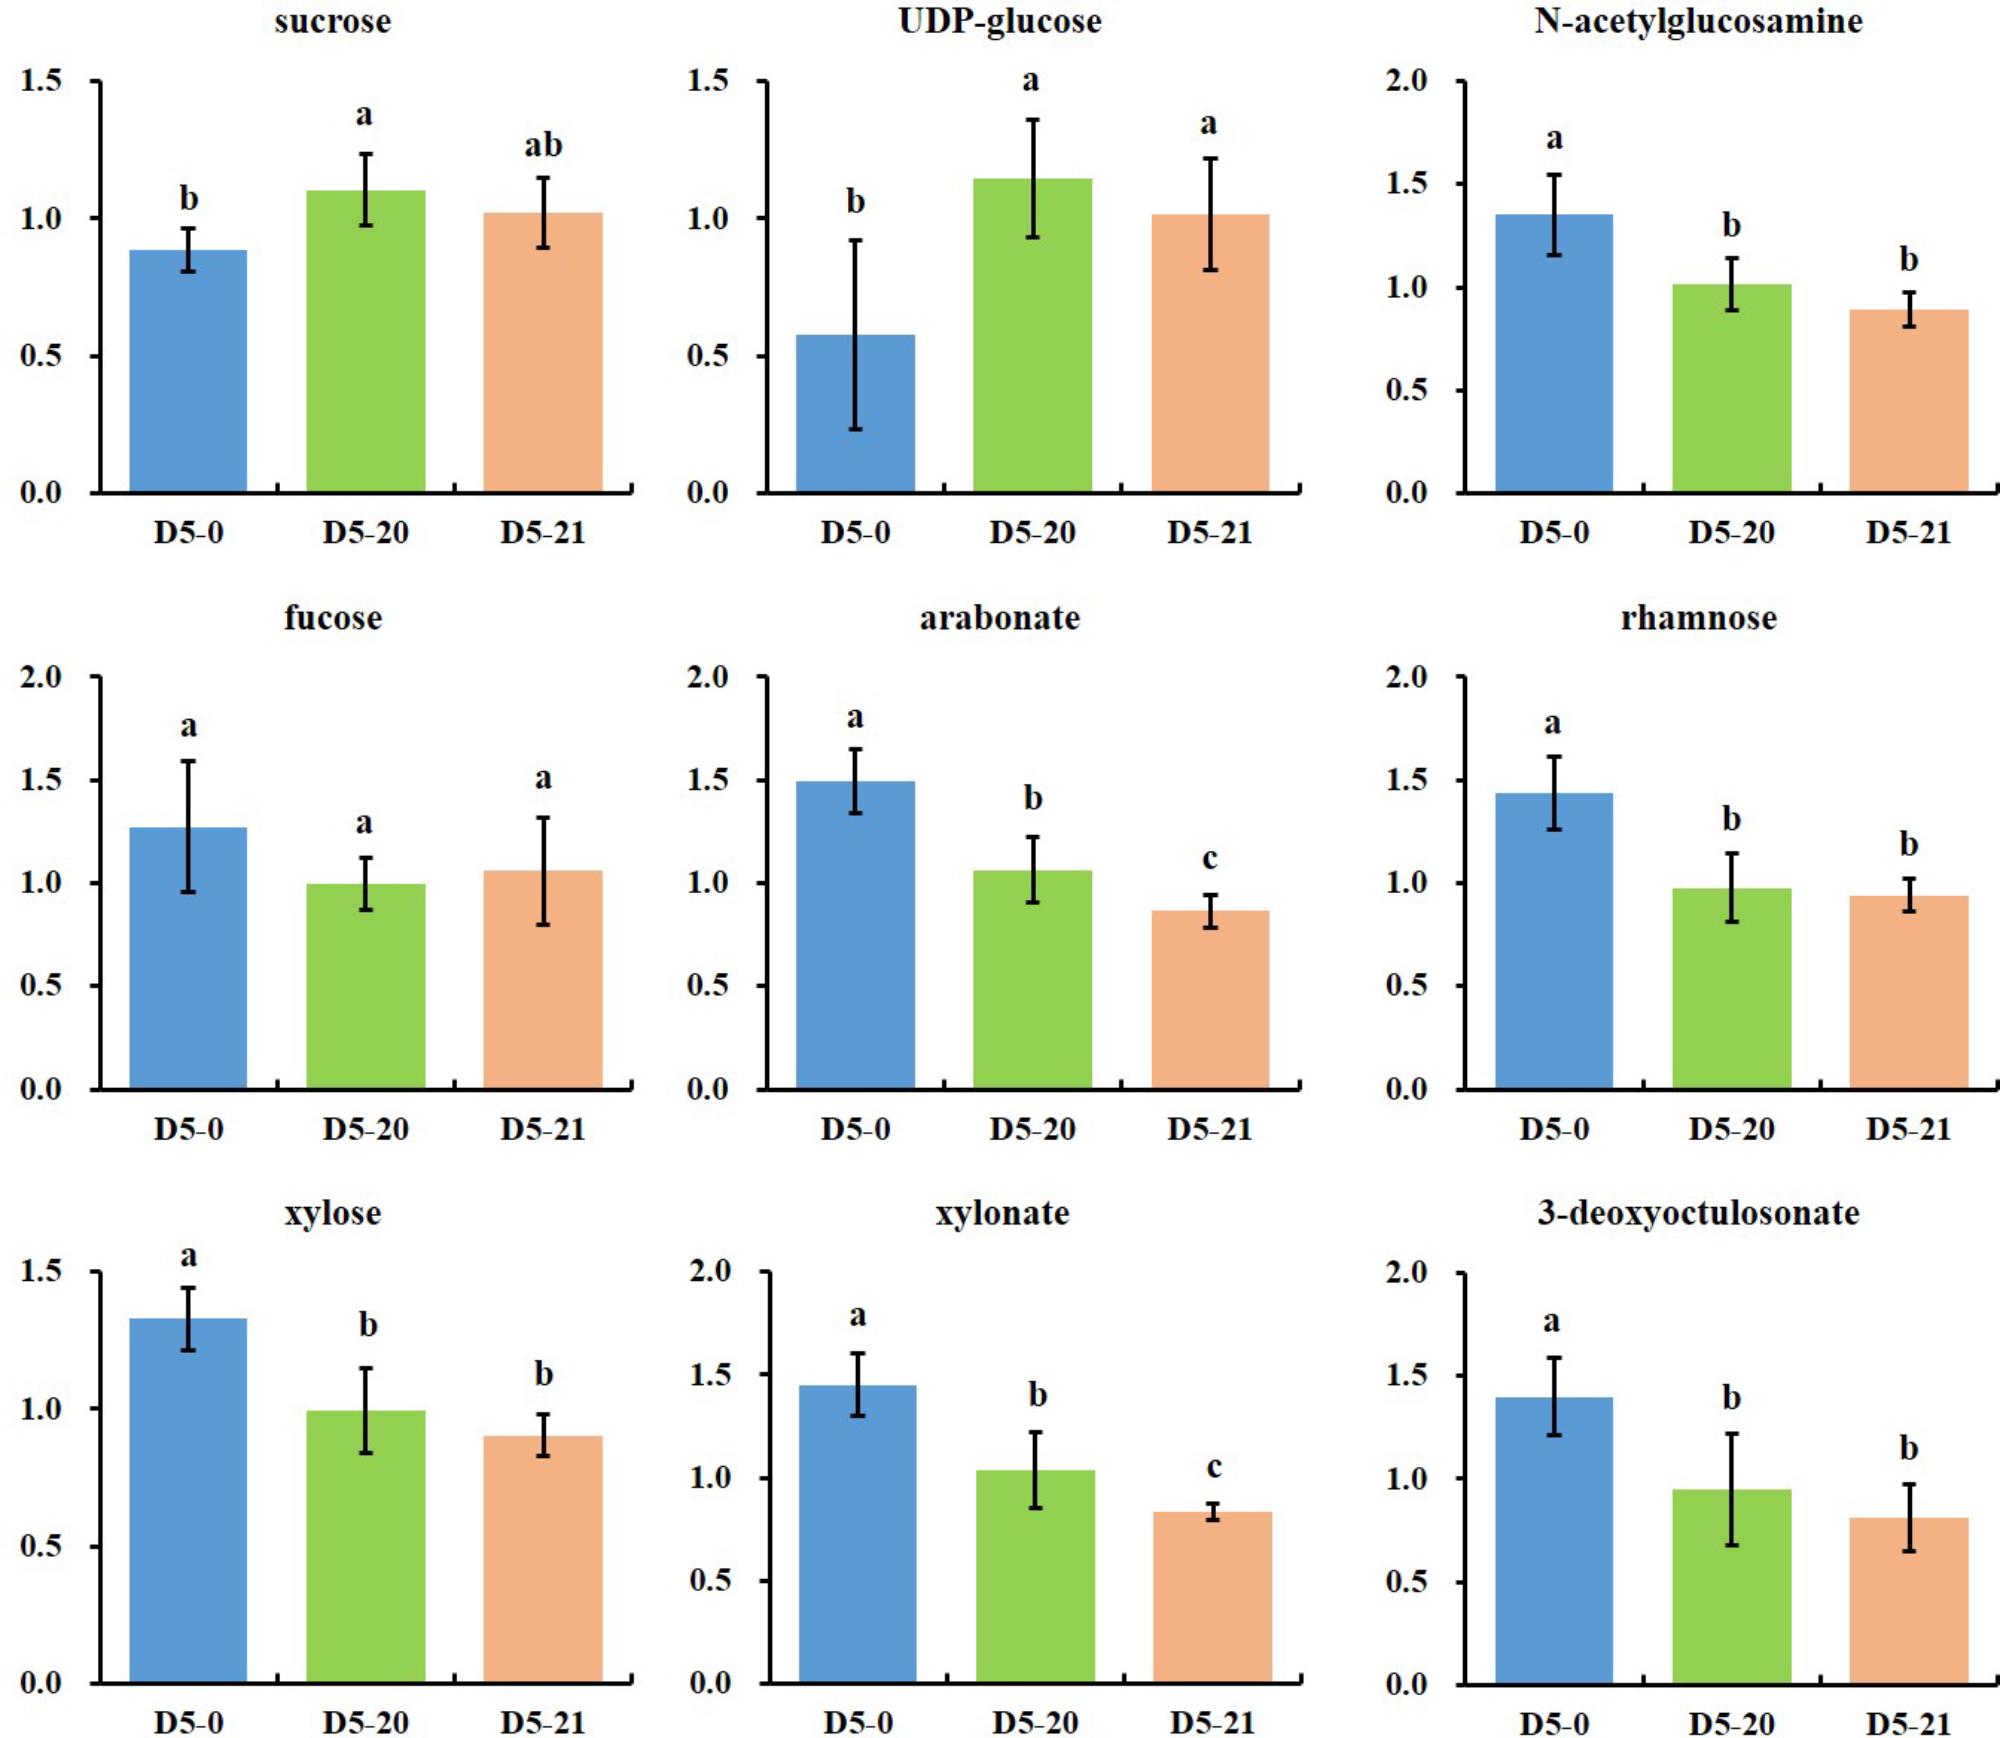
FIGURE 5. Metabolites associated with cell wall and polysaccharide metabolisms. The ordinates represent scaled intensity of the relative abundance. Error bars are shown for six replicates of the relative abundance. Different letters indicate a statistically significant difference when analyzed by one-way ANOVA and a multiple comparison using Duncan’s test at p ≤ 0.05.
Discussion
The cambium is a tissue unique to woody plants that consists of several layers of narrow elongated, parenchyma cells that are easily damaged during sampling. This high fragility makes traditional methods difficult to use for the study of cambial structure and function. The formation of cambium is directly related to the lateral growth of woody plants, so the metabolites in the cambium are crucial to improve wood growth and stress resistance in poplar. Therefore, the analysis of perennial poplar using UHLC/MS/MS or GC/MS may aid research into the composition and content of cambium metabolism. To understand the composition and variation of metabolites in non-transgenic and transgenic poplar, we performed standardized non-targeted UPLC–MS/MS and GC–MS metabolomic analysis.
Multi-gene transgenic poplar lines D5-20 and D5-21 exhibit greater wood growth, higher tolerance to multiple stressors (drought, salt, and waterlogging), and better insect tolerance than non-transgenic D5-0 in long-term greenhouse and field experiments (Su et al., 2011; Zhang et al., 2011). Transcriptomic analysis revealed that the expression of stress response genes changed in transgenic D5-20 line poplar (Zhang et al., 2014). All of the findings confirmed the effects of transgenes in transgenic poplars due to the introduction of multiple stress-related genes. In comparison these studies, we found small changes in metabolites associated with the transgenic lines to some extent.
Previous metabolomic studies focused on stress-related metabolic changes or the metabolic variation of species diversity during evolution and among different cultivars (Joshi et al., 2010; Schmidt et al., 2011; Hu et al., 2014; Jorge et al., 2016). Here, we focused on discovering the metabolites associated with multi stress-related genes transgenic lines and investigating the variations among different lines. Ultimately, we identified 197 metabolites with as significance difference between the three lines, in which the three major primary metabolism groups (amino acids, lipids, and carbohydrates) accounted for more than 70% of all identified metabolites. Levandi et al. (2008) used CE-MS [capillary electrophoresis (CE)] to compare the differences of metabolites between three Bt (Bacillus thuringiensis) transgenic lines and common maize, finding some metabolites with significantly differences in their content. Lin et al. (2014) identified 104 metabolites in significantly different amounts among different soybean cultivars, with a large number of these metabolites being amino acid, carbohydrate, or lipid metabolisms in essential metabolic processes in soybean seed development. Meanwhile, metabolome analysis indicated the content of these three main metabolites (amino acids, organic acids, and sugars) changed in response to water deficiency in two spring-wheat cultivars (Michaletti et al., 2018).
Previous report indicated that rapid and profound changes in amino acid pools in response to oxidative stress in rice and wheat (Shingaki-Wells et al., 2011). Here, we found two significantly increased metabolites (arginine and glutamate) in amino acid primary pathway in multi-genes transgenic lines compare to non-transgenic line. Arginine is the precursor of PA and NO (as important messenger molecules in organism) biosynthesis, which participate in almost all physiological and biochemical processes, including growth and development, stress resistance and other processes in plants (Crawford, 2006; Morris, 2006). However, arginine is negatively correlated with heading time, one of shared metabolite-morphological trait associations between japonica and indica rice (Hu et al., 2014). This is in disagreement with our results, where arginine was significantly increased in transgenic lines. Actually, arginine level is strongly associated with field phenotypes (height, diameter, and composite leaf angle), the NAC154 overexpressing tissues verified the role of increased arginine levels in anti-senescence/dormancy-associated processes in poplar (Jervis et al., 2015). Glutamate is an important branching points for the biosynthesis of several amino acids, and serves as amino group donors for amino acid metabolism (Ishikawa et al., 2010). Moreover, glutamate induces the expression of bHLH and IRO2, both involved in regulation of stress responses, in rice roots (Kan et al., 2015). Therefore, increased arginine and glutamate levels might be responsible for better growth performances and stress-resistance in transgenic lines.
Among the carbohydrates metabolites which showed different levels in the transgenic lines, sucrose and UDP-glucose, both of which are major precursors associated with cell wall pathways, and both showed an increase in the two transgenic lines. A previous study reported that more than 62% carbohydrates, including sucrose, have shown significantly variations among 29 different soybean cultivars (Lin et al., 2014). Conversely, in maize kernels, there are no significantly differences among 14 maize varieties for over 80% of carbohydrates analyzed (sucrose included) (Rao et al., 2014). As the main photosynthetic product and the initial form of sugar transport, sucrose is hydrolyzed into glucose and fructose or sucrose synthases, and finally to form UDP-glucose and fructose in higher plants (Koch, 2004). However, seasonal cessation of wood formation is relevant to the reduced levels of sucrose in poplar (Deslauriers et al., 2009). GC–MS analysis shows that salt-tolerant varieties maize hybrids with different salt tolerance accumulate glucose, fructose, and sucrose (Richter et al., 2015). Additionally, the high levels sucrose detected in water-stressed leaf tissue of Populus tomentosa (Nishizawa et al., 2008), and the accumulation of sucrose, glucose, and fructose in Populus hybrids in response to drought (Kozlowski and Pallardy, 2002) suggest that some of these compounds are likely to act as osmotic agent to maintain cell turgor and stabilize cellular proteins (Seki et al., 2007). On behalf of a vital branch point in carbohydrate metabolism, UDP-glucose can synthetize other nucleotide sugars like UDP-glucuronic acid and directly guides synthesis of sucrose, starch, hemicellulose or cellulose, and pectin (Gibeaut, 2000; Bar-Peled and O’Neill, 2011). We observed an increased the levels of UDP-glucose associated with cell wall and polysaccharide metabolism in D5-20 and D5-21 lines, which is related to the superior performance of these transgenic lines. Previous study show that expression of SacB in transgenic sugar beet display increased levels of fructan (Bartels and Sunkar, 2005), while transgenic potato has higher content of the non-structural carbohydrates fructan, fructose, glucose, starch, and sucrose (van der Meer et al., 1994). These results were in agreement with our study, showing that SacB expression affects carbohydrates metabolism.
In contrast to the evident changes in amino acid and carbohydrate metabolites, we detected just a small percentage of secondary metabolites (about 10%), including alkaloids, benzenoids, flavonoids, and phenylpropanoids. Among of these, the most significant difference was in the content of catechol between transgenic lines and non-transgenic line. Catechol is readily oxidized by polyphenol oxidase (PPO), a process which increases the content of the anti-insect activity phenolics compounds producing highly reactive o-quinones (Duffey and Felton, 1991), and catechol itself also has anti-insect activity (Duffey and Stout, 1996). Haruta et al. (2001) propose that PPO contributes to aspen defense by enhancing the toxicity of catechol, and that release of catechol and PPO oxidation is a possible mechanism of toxicity in trembling aspen (Populus tremuloides). Indeed, approximately 50% of synthetic catechol is used to consume for pesticides (Qu et al., 2015). Therefore, catechol in transgenic lines has likely a role in insect resistance. BtCry3A, encoding a δ-endotoxin from Bacillus thuringiensis, and OC-I, encoding the proteinase inhibitor oryzacystatin I from riceconferring tolerance to coleopterous insecta, are present in both D5-20 and D5-21. So far, no reports are available on an interaction between BtCry3A or OC-I and catechol, but the overexpression of two genes and the increased catechol content are likely responsible to confer resistance to coleopterous insect.
Phenolic glycosides are one of the main secondary metabolites in poplar, and have been found in various poplar species. In P. tremuloides, four kinds of structure-related phenolic glycosides, salicin, salicortin, tremuloidin, and tremulacin are present, of these, salicin and salicortin are common in poplar, while grandidentoside, and HCH-salicorin have a relatively narrow distribution (Tsai et al., 2006). Metabolic profiling showed that PdUGPase2 reduces the levels of sugar and starch, but increased phenolic compounds in PdUGPase2 overexpressing Populus (Payyavula et al., 2014). Here, we detected the presence of salicin, but its differences between the three lines were not significant, and therefore we did not consider this compound for further experiments.
In summary, despite biological replicate variation, we were able to document significant metabolomic differences in the cambium of transgenic and non-transgenic poplar. The greatest differences between lines were two alpha-ketoglutarate derivatives and catechol that relevant to growth and insect-resistance, as well as sugars and its derivatives mostly associated with cell wall metabolism. As the cambium is the site of xylem production, these results are not surprising. However, evident difference in the content of these compounds between these poplar lines suggests that these metabolites may be important for stress response.
Conclusion
In this study, we investigated the metabolome of the cambium of one non-transgenic and two multi-gene transgenic lines of hybrid poplar using both GC–MS and UPLC–MS/MS with a large-scale non-targeted metabolomics analysis. One hundred ninety-seven metabolites showed significant differences between the non-transgenic and multi-gene transgenic lines. Two alpha-ketoglutarate derivatives of arginine and glutamate in the amino acid primary pathway showed higher level in both transgenic lines, promoting growth and resisting to external stress. Moreover, we also found differences in the content of sucrose and UDP-glucose, mostly associated with major carbon precursors for cell wall pathways, and catechol, which relates to insect resistance. Our findings may provide a basis for further studies on cambium metabolism in poplar, molecular breeding to enhance stress-related activity.
Author Contributions
KN and CD projected and implemented all the experiments and drafted the manuscript. XS, WZhu, WZhang, YD, and YS were involved in devising and directing the experiments and proofreading the manuscript. XS contributed to the concept of the research, gave constructive advice on the experiments, and finally completed the manuscript.
Funding
This study was supported by the Basic Research Fund of RIF (Grant No. CAFYBB2017SY001), the National High-Tech R&D Program of China (863 Program) (Grant No. 2011AA100201), and the National Key Program on Transgenic Research (Grant No. 2018ZX08021001).
Conflict of Interest Statement
The authors declare that the research was conducted in the absence of any commercial or financial relationships that could be construed as a potential conflict of interest.
Supplementary Material
The Supplementary Material for this article can be found online at: https://www.frontiersin.org/articles/10.3389/fpls.2018.01201/full#supplementary-material
Footnotes
References
Adamski, J., and Suhre, K. (2013). Metabolomics platforms for genome wide association studies-linking the genome to the metabolome. Curr. Opin. Biotechnol. 24, 39–47. doi: 10.1016/j.copbio.2012.10.003
Bar-Peled, M., and O’Neill, M. A. (2011). Plant nucleotide sugar formation, interconversion, and salvage by sugar recycling. Annu. Rev. Plant Biol. 62, 127–155. doi: 10.1146/annurev-arplant-042110-103918
Bartels, D., and Sunkar, R. (2005). Drought and salt tolerance in plants. Crit. Rev. Plant Sci. 24, 23–58. doi: 10.1080/07352680590910410
Benjamini, Y., and Yekutieli, D. (2001). The control of the false discovery rate in multiple testing under dependency. Ann. Stat. 29, 1165–1188.
Broeck, A. V. (2003). European Black Poplar-Populus nigra: Technical Guidelines for Genetic Conservation and Use. Rome: International Plant Genetic Resources Institute, 1–6.
Chen, Z. Q., Zhang, H. N., Yang, L. N., Jiang, H. W., Guo, S. J., Li, Y., et al. (2016). Construction of a metabolomics profile of arsenic trioxide effect in gastric carcinoma cell line SGC7901. Acta Biochim. Biophys. Sin. 5, 474–481. doi: 10.1093/abbs/gmw022
Clarke, J. D., Alexander, D. C., Ward, D. P., Ryals, J. A., Mitchell, M. W., Wulffm, J. E., et al. (2013). Assessment of genetically modified soybean in relation to natural variation in the soybean seed metabolome. Sci. Rep. 3:3871. doi: 10.1038/srep03082
Crawford, N. M. (2006). Mechanisms for nitric oxide synthesis in plants. J. Exp. Bot. 57, 471–478. doi: 10.1093/jxb/erj050
Dersch, L. M., Beckers, V., and Wittmann, C. (2016). Green pathways: metabolic network analysis of plant systems. Metab. Eng. 34, 1–24. doi: 10.1016/j.ymben.2015.12.001
Deslauriers, A., Giovannelli, A., Rossi, S., Castro, G., Fragnelli, G., and Traversi, L. (2009). Intra-annual cambial activity and carbon availability in stem of poplar. Tree Physiol. 29, 1223–1235. doi: 10.1093/treephys/tpp061
Doerfler, H., Lyon, D., Nägele, T., Sun, X. L., Fragner, L., Hadacek, F., et al. (2013). Granger causality in integrated GC-MS and LC-MS metabolomics data reveals the interface of primary and secondary metabolism. Metabolomics 9, 564–574. doi: 10.1007/s11306-012-0470-0
Duffey, S. S., and Felton, G. W. (1991). “Enzymatic antinutritive defenses of the tomato plant against insects,” in Naturally Occurring Pest Bioregulators, ed. P. A. Hedin (Washington, DC: ACS Press), 167–197. doi: 10.1021/bk-1991-0449.ch012
Duffey, S. S., and Stout, M. J. (1996). Antinutritive and toxic components of plant defense against insects. Arch. Insect. Biochem. Physiol. 32, 3–37. doi: 10.1002/(SICI)1520-6327(1996)32:1<3::AID-ARCH2>3.0.CO;2-1
Escandón, M., Meijón, M., Valledor, L., Pascual, J., Pinto, G., and Cañal, M. J. (2018). Metabolome integrated analysis of high-temperature response in Pinus radiate. Front. Plant Sci. 9:485. doi: 10.3389/fpls.2018.00485
Evans, A. M., DeHaven, C. D., Barrett, T., Mitchell, M., and Milgram, E. (2009). Integrated, nontargeted ultrahigh performance liquid chromatography/electrospray ionization tandem mass spectrometry platform for the identification and relative quantification of the small molecule complement of biological systems. Anal. Chem. 81, 6656–6667. doi: 10.1021/ac901536h
Ferry, N., Edwards, M. G., Gatehouse, J., Capell, T., Christou, P., and Gatehouse, A. M. (2006). Transgenic plants for insect pest control: a forward looking scientific perspective. Transgenic Res. 15, 13–19. doi: 10.1007/s11248-005-4803-x
Gibbons, H., O’Gorman, A., and Brennan, L. (2015). Metabolomics as a tool in nutritional research. Curr. Opin. Lipidol. 26, 30–34. doi: 10.1097/MOL.0000000000000140
Gibeaut, D. M. (2000). Nucleotide sugars and glycosyltransferases for synthesis of cell wall matrix polysaccharides. Plant Physiol. Biochem. 38, 69–80. doi: 10.1016/S0981-9428(00)00167-4
Guo, Y., Qin, G. J., Gu, H. Y., and Qu, L. J. (2009). Dof5.6/HCA2, a Dof transcription factor gene, regulates interfascicular cambium formation and vascular tissue development in Arabidopsis. Plant Cell 21, 3518–3534. doi: 10.1105/tpc.108.064139
Haruta, M., Pedersen, J. A., and Constabel, C. P. (2001). Polyphenol oxidase and herbivore defense in trembling aspen (Populus tremuloides): cDNA cloning, expression, and potential substrates. Physiol. Plant. 112, 552–558. doi: 10.1034/j.1399-3054.2001.1120413.x
Hu, C. Y., Shi, J. X., Quan, S., Cui, B., Kleessen, S., Nikoloski, Z., et al. (2014). Metabolic variation between japonica and indica rice cultivars as revealed by non-targeted metabolomics. Sci. Rep. 4:5067. doi: 10.1038/srep05067
Ishikawa, T., Takahara, K., Hirabayashi, T., Matsumura, H., Fujisawa, S., Terauchi, R., et al. (2010). Metabolome analysis of response to oxidative stress in rice suspension cells overexpressing cell death suppressor Bax inhibitor-1. Plant Cell Physiol. 51, 9–20. doi: 10.1093/pcp/pcp162
Jervis, J., Hildreth, S. B., Sheng, X. Y., Beers, E. P., Brunner, A. M., and Helm, R. F. (2015). A metabolomic assessment of NAC154 transcription factor overexpression in field grown poplar stem wood. Phytochemistry 115, 112–120. doi: 10.1016/j.phytochem.2015.02.013
Jorge, T. F., Mata, A. T., and António, C. (2016). Mass spectrometry as a quantitative tool in plant metabolomics. Philos. Trans. A Math. Phys. Eng. Sci. 374:20150370. doi: 10.1098/rsta.2015.0370
Joshi, T., Yao, Q., Franklin, L. D., Brechenmacher, L., Valliyodan, B., Stacey, G., et al. (2010). “SoyMetDB: the soybean metabolome database,” in Proceedings of the International Conference on IEEE Bioinformatics and Biomedicine (BIBM), Kansan, MO, 203–208. doi: 10.1109/BIBM.2010.5706563
Jung, E. S., Lee, S., Lim, S. H., Ha, S. H., Liu, K. H., and Lee, C. H. (2013). Metabolite profiling of the short-term responses of rice leaves (Oryza sativa cv. Ilmi) cultivated under different LED lights and its correlations with antioxidant activities. Plant Sci. 210, 61–69. doi: 10.1016/j.plantsci.2013.05.004
Kan, C. C., Chung, T. Y., Juo, Y. A., and Hsieh, M. H. (2015). Glutamine rapidly induces the expression of key transcription factor genes involved in nitrogen and stress responses in rice roots. BMC Genomics 16:731. doi: 10.1186/s12864-015-1892-7
Keurentjes, J. J. (2009). Genetical metabolomics: closing in on phenotypes. Curr. Opin. Plant Biol. 12, 223–230. doi: 10.1016/j.pbi.2008.12.003
Koch, K. (2004). Sucrose metabolism: regulatory mechanisms and pivotal roles in sugar sensing and plant development. Curr. Opin. Plant Biol. 7, 235–246. doi: 10.1016/j.pbi.2004.03.014
Kozlowski, T. T., and Pallardy, S. G. (2002). Acclimation and adaptive responses of woody plants to environmental stresses. Bot. Rev. 68, 270–334. doi: 10.1663/0006-8101(2002)068[0270:AAAROW]2.0.CO;2
Levandi, T., Leon, C., Kaljurand, M., Garcia-Cañas, V., and Cifuentes, A. (2008). Capillary electrophoresis time-of-flight mass spectrometry for comparative metabolomics of transgenic versus conventional maize. Anal. Chem. 80, 6329–6335. doi: 10.1021/ac8006329
Lin, H., Rao, J., Shi, J. X., Hu, C. Y., Cheng, F., Wilson, Z. A., et al. (2014). Seed metabolomic study reveals significant metabolite variations and correlations among different soybean cultivars. J. Integr. Plant Biol. 56, 826–836. doi: 10.1111/jipb.12228
Meijón, M., Feito, I., Oravec, M., Delatorre, C., Weckwerth, W., Majada, J., et al. (2016). Exploring natural variation of Pinus pinaster Aiton using metabolomics: is it possible to identify the region of origin of a pine from its metabolites? Mol. Ecol. 25, 959–976. doi: 10.1111/mec.13525
Michaletti, A., Naghavi, M. R., Toorchi, M., Zolla, L., and Rinalducci, S. (2018). Metabolomics and proteomics reveal drought-stress responses of leaf tissues from spring-wheat. Sci. Rep. 8:5710. doi: 10.1038/s41598-018-24012-y
Morris, S. J. (2006). Arginine: beyond protein. Am. J. Clin. Nutr. 83, 508S–512S. doi: 10.1093/ajcn/83.2.508S
Nishizawa, A., Yabuta, Y., and Shigeoka, S. (2008). Galactinol and raffinose constitute a novel function to protect plants from oxidative damage. Plant Physiol. 147, 1251–1263.
Ohta, T., Masutomi, N., Tsutsui, N., Sakairi, T., Mitchell, M., Milburn, M. V., et al. (2009). Untargeted metabolomic profiling as an evaluative tool of fenofibrate-induced toxicology in Fischer 344 male rats. Toxicol Pathol. 37, 521–535.
Payyavula, R. S., Tschaplinski, T. J., Jawdy, S. S., Sykes, R. W., Tuskan, G. A., and Kalluri, U. C. (2014). Metabolic profiling reveals altered sugar and secondary metabolism in response to UGPase overexpression in Populus. BMC Plant Biol. 14:265. doi: 10.1186/s12870-014-0265-8
Qu, G. R., Quan, S., Mondol, P., Xu, J., Zhang, D. B., and Shi, J. X. (2014). Comparative metabolomics analysis of wild type and mads3 mutant rice anthers. J. Integr. Plant Biol. 56, 849–863. doi: 10.1111/jipb.12245
Qu, J. Y., Wang, Y., Dong, Y., Zhu, Z. Y., and Xing, H. H. (2015). Sensitive determination of catechol using a glassy carbon electrode modified with L-cysteine and ZnS:Ni/ZnS quantum dots. Anal. Methods 7, 260–265. doi: 10.1039/C4AY02199A
Rao, J., Cheng, F., Hu, C. Y., Quan, S., Lin, H., Wang, J., et al. (2014). Metabolic map of mature maize kernels. Metabolomics 10, 775–787. doi: 10.1007/s11306-014-0624-3
Richter, J. A., Erhan, A., Kopka, J., and Zörb, C. (2015). Metabolic contribution to salt stress in two maize hybrids with contrasting resistance. Plant Sci. 233, 107–115. doi: 10.1016/j.plantsci.2015.01.006
Robinson, A. R., Dauwe, R., and Mansfield, S. D. (2017). Assessing the between-background stability of metabolic effects arising from lignin-related transgenic modifications, in two Populus hybrids using non-targeted metabolomics. Tree Physiol. 38, 378–396. doi: 10.1093/treephys/tpx110
Sairam, R. K., Kumutha, D., Ezhilmathi, K., Deshmukh, P. S., and Srivastava, G. C. (2008). Physiology and biochemistry of waterlogging tolerance in plants. Biol. Plant. 52, 401–412. doi: 10.1007/s10535-008-0084-6
Saito, K., and Matsuda, F. (2010). Metabolomics for functional genomics, systems biology, and biotechnology. Annu. Rev. Plant Biol. 61, 463–489. doi: 10.1146/annurev.arplant.043008.092035
Schmidt, M. A., Barbazuk, W. B., Sandford, M., May, G., Song, Z. H., Zhou, W. X., et al. (2011). Silencing of soybean seed storage proteins results in a rebalanced protein composition preserving seed protein content without major collateral changes in the metabolome and transcriptome. Plant Physiol. 156, 330–345. doi: 10.1104/pp.111.173807
Seki, M., Umezawa, T., Urano, K., and Shinozaki, K. (2007). Regulatory metabolic networks in drought stress responses. Curr. Opin. Plant Biol. 10, 296–302.
Shingaki-Wells, R. N., Huang, S. B., Taylor, N. L., Carroll, A. J., Zhou, W. X., and Millar, A. H. (2011). Differential molecular responses of rice and wheat coleoptiles to anoxia reveal novel metabolic adaptations in amino acid metabolism for tissue tolerance. Plant Physiol. 156, 1706–1724. doi: 10.1104/pp.111.175570
Storey, J. D., and Tibshirani, R. (2003). Statistical significance for genomewide studies. Proc. Natl. Acad. Sci. U.S.A. 100, 9440–9445. doi: 10.1073/pnas.1530509100
Su, X. H., Chu, Y. G., Li, H., Hou, Y. J., Zhang, B. Y., Huang, Q. J., et al. (2011). Expression of multiple resistance genes enhances tolerance to environmental stressors in transgenic poplar (Populus × euramericana ‘Guariento’). PLoS One 6:e24614. doi: 10.1371/journal.pone.0024614
Tsai, C. J., Harding, S. A., Tschaplinski, T. J., Lindroth, R. L., and Yuan, Y. (2006). Genome-wide analysis of the structural genes regulating defense phenylpropanoid metabolism in Populus. New Phytol. 172, 47–62. doi: 10.1111/j.1469-8137.2006.01798.x
van der Meer, I. M., Ebskamp, M. J. M., Visser, R. G. F., Weisbeek, P. J., and Smeekens, S. C. M. (1994). Fructan as a new carbohydrate sink in transgenic potato plants. Plant Cell 6, 561–570. doi: 10.1105/tpc.6.4.561
Wang, J. G., Su, X. H., Ji, L. L., Zhang, B. Y., Hu, Z. M., Huang, R. F., et al. (2007). Multiple transgenes Populus × euramericana ‘Guariento’ plants obtained by biolistic bombardment. Chin. Sci. Bull. 52, 224–230. doi: 10.1007/s11434-007-0034-2
Yang, Z. G., Nakabayashi, R., Okazaki, Y., Mori, T., Takamatsu, S., Kitanaka, S., et al. (2014). Toward better annotation in plant metabolomics: isolation and structure elucidation of 36 specialized metabolites from Oryza sativa (rice) by using MS/MS and NMR analyses. Metabolomics 10, 543–555. doi: 10.1007/s11306-013-0619-5
Zhang, B. Y., Chen, M., Zhang, X. F., Luan, H. H., Tian, Y. C., and Su, X. H. (2011). Expression of Bt-Cry3A in transgenic Populus alba × P. glandulosa and its effects on target and non-target pests and the arthropod community. Transgenic Res. 20, 523–532. doi: 10.1007/s11248-010-9434-1
Keywords: metabolomics, multi-gene transgenic poplar, cambium, GC–MS, UPLC–MS/MS
Citation: Ning K, Ding C, Zhu W, Zhang W, Dong Y, Shen Y and Su X (2018) Comparative Metabolomic Analysis of the Cambium Tissue of Non-transgenic and Multi-Gene Transgenic Poplar (Populus × euramericana ‘Guariento’). Front. Plant Sci. 9:1201. doi: 10.3389/fpls.2018.01201
Received: 15 January 2018; Accepted: 26 July 2018;
Published: 17 August 2018.
Edited by:
Chang-Jun Liu, Brookhaven National Laboratory (DOE), United StatesReviewed by:
José Juan Ordaz-Ortiz, Centro de Investigación y de Estudios Avanzados del Instituto Politécnico Nacional (CINVESTAV-IPN), MexicoJane Ward, Rothamsted Research (BBSRC), United Kingdom
Copyright © 2018 Ning, Ding, Zhu, Zhang, Dong, Shen and Su. This is an open-access article distributed under the terms of the Creative Commons Attribution License (CC BY). The use, distribution or reproduction in other forums is permitted, provided the original author(s) and the copyright owner(s) are credited and that the original publication in this journal is cited, in accordance with accepted academic practice. No use, distribution or reproduction is permitted which does not comply with these terms.
*Correspondence: Xiaohua Su, suxh@caf.ac.cn
†These authors have contributed equally to this work