 Thomas D. Alcock1
 Lenka Havlickova2
 Zhesi He2
 Ian Bancroft2
 Philip J. White3,4
 Martin R. Broadley1
 Neil S. Graham1*
- 1Plant and Crop Sciences Division, University of Nottingham, Loughborough, United Kingdom
- 2Department of Biology, University of York, York, United Kingdom
- 3The James Hutton Institute, Dundee, United Kingdom
- 4Distinguished Scientist Fellowship Program, King Saud University, Riyadh, Saudi Arabia
Calcium (Ca) and magnesium (Mg) are essential plant nutrients and vital for human and animal nutrition. Biofortification of crops has previously been suggested to alleviate widespread human Ca and Mg deficiencies. In this study, new candidate genes influencing the leaf accumulation of Ca and Mg were identified in young Brassica napus plants using associative transcriptomics of ionomics datasets. A total of 247 and 166 SNP markers were associated with leaf Ca and Mg concentration, respectively, after false discovery rate correction and removal of SNPs with low second allele frequency. Gene expression markers at similar positions were also associated with leaf Ca and Mg concentration, including loci on chromosomes A10 and C2, within which lie previously identified transporter genes ACA8 and MGT7. Further candidate genes were selected from seven loci and the mineral composition of whole Arabidopsis thaliana shoots were characterized from lines mutated in orthologous genes. Four and two mutant lines had reduced shoot Ca and Mg concentration, respectively, compared to wild type plants. Three of these mutations were found to have tissue specific effects; notably reduced silique Ca in all three such mutant lines. This knowledge could be applied in targeted breeding, with the possibility of increasing Ca and Mg in plant tissue for improving human and livestock nutrition.
Introduction
Calcium (Ca) and magnesium (Mg) are essential plant nutrients and vital for human and animal nutrition (Broadley and White, 2010; White and Brown, 2010). In plants, most Ca is extracellular, where it is a key strengthening component in cell walls (Grusak et al., 2016). It also has an important role in plant-cell signaling. Calcium enters root cells through a variety of Ca2+-permeable cation channels (White and Broadley, 2003; Karley and White, 2009; White, 2015). The opening of these channels must be tightly controlled, as changes in cytosolic Ca2+ concentrations coordinate numerous developmental and environmental stress responses (McAinsh and Pittman, 2009). The accumulation of Ca at tissue- and cellular-levels is dependent on the expression of transport proteins (Conn and Gilliham, 2010; Rios et al., 2012). After uptake from soil by roots, Ca travels via either apoplastic or symplastic pathways to the xylem, through which, in the form of either Ca2+ or complexed with organic acids, it is transported to the shoot. Calcium is immobile in the phloem, and as such, tissues with low transpiration rates (including fruits, seeds, and tubers) often have low Ca concentrations (Karley and White, 2009). Among plant nutrients, Ca is required in relatively large amounts. However, concentrations vary amongst taxa, typically ranging from ∼0.1 to 4.4% dry matter (Broadley et al., 2003). Calcium deficiencies are relatively rare in field-grown crops, but can occur in crops grown in acidic or leaching prone soils. Where Ca supply is insufficient to meet growth requirements, costly symptoms can ensue. For instance, fruits lacking in Ca are prone to cracking, as a direct result of weakness in the cell wall (White, 2015).
Magnesium is essential for photosynthesis, forming the central atom of chlorophyll molecules. It also has a key role in protein synthesis by functioning as a bridging element for the aggregation of ribosome subunits, as well as in photophosphorylation and generation of reactive oxygen species in plants (Cakmak and Yazici, 2010). Magnesium is taken up by roots as Mg2+. Control of influx across the plasma membrane is dominated by members of the MGT/MRS2 family of transport proteins and potentially Mg2+-permeable cation channels (Karley and White, 2009; Lenz et al., 2013). One member of the MGT gene family in Arabidopsis thaliana, MAGNESIUM TRANSPORTER 1 (MGT1), encodes a protein localized to the plasma membrane (Li et al., 2001), suggesting its importance in the import and/or export of Mg in cells. Like Ca, Mg is transported from root to shoot cells through the xylem either as Mg2+ or complexed with organic acids. However, Mg is a phloem-mobile element, and is readily translocated to fruit, seeds, and tubers (White and Broadley, 2009). Shoot Mg concentrations are typically lower than shoot Ca concentrations across plant taxa, and vary between ∼0.1% to ∼1.0% dry matter (White et al., 2015).
In humans and animals, Ca is associated with the formation and metabolism of bone as well as being crucial for mediating vascular contraction and vasodilation, muscle function, nerve transmission, intracellular signaling, and hormonal secretion (Catharine, 2011). Based on food supply data, it was estimated that half of the population worldwide was at risk of Ca deficiency in 2011, with significant deficiency risks across all continents (Kumssa et al., 2015b). Magnesium is needed for over 300 biochemical reactions. It helps to maintain muscle function, prevents an irregular heartbeat, and is involved in protein synthesis (Yardley, 2009). Based on food supply data, <1% of the global population appeared to be at risk of dietary Mg deficiency in 2011 (Kumssa et al., 2015a). However, these data do not account for inhibitors of Mg adsorption, household waste, or distribution within countries and it is likely that significant deficiency risks exist within some populations. Magnesium deficiency risks are also likely to be greater in higher-income groups consuming processed foods, because Mg is among the nutrients commonly lost in processing (Swaminathan, 2003; Broadley and White, 2010; Kumssa et al., 2015a). Biofortification of crops has been previously suggested as a suitable approach for alleviating human deficiencies in a number of mineral nutrients, including Ca and Mg (White and Broadley, 2005; White and Broadley, 2009).
Previous analyses of variation in mineral concentrations across a wide range of plant species have shown that tissue Ca and Mg concentrations are inherently high in Brassicaceae compared most other taxa (Broadley et al., 2004; White et al., 2015). These traits have proven to be heritable in Brassica oleracea (Broadley et al., 2008), B. rapa (Graham et al., 2014), and B. napus (Thomas et al., 2016). Thus, Brassica spp. are potentially good targets for understanding genetic bases of leaf Ca and Mg accumulation, and for potentially increasing dietary intakes of Ca and Mg in humans and animals. Expression quantitative trait locus (eQTL) analyses in B. rapa previously led to the discovery of Ca responsive genes which may prove useful in marker-assisted selection for increased Ca concentration in shoot tissue (Graham et al., 2014). These include orthologs of A. thaliana Ca2+ transporter genes CATION EXCHANGER 1 (CAX1) and AUTOINHIBITED CA2+ ATPASE, ISOFORM 8 (ACA8), and subsequent work showed that allelic variants of the former gene in B. rapa influenced Ca accumulation. B. napus includes oilseed types, swedes and fodder crops, and is widely cultivated globally. It is an amphidiploid species that likely originated from multiple spontaneous hybridizations between B. rapa (A genome; turnip rape) and B. oleracea (C genome; cabbage, kale) and contains a full set of chromosomes from each (Iniguez-Luy and Federico, 2011; Chalhoub et al., 2014). This complexity has previously hindered the genetic study of this and other polyploid crops. However, recent and ongoing advances in sequencing and genome mapping technologies have allowed the rapid genotyping of multiple accessions at a fraction of the cost of older technologies. This has improved the feasibility of using a large diversity population over traditional mapping populations in genetic studies of crop species (Trick et al., 2009).
Associative transcriptomics (Harper et al., 2012) focuses on the analysis of transcribed sequences (mRNA-seq) across diversity populations to identify high-resolution loci influencing complex traits. An advantage using of RNA over DNA sequences in association studies is the ability to develop markers based on both single-nucleotide polymorphisms (SNPs) and transcript abundance (gene-expression markers; GEMs; Harper et al., 2012). Gene expression levels may be particularly important in the control of traits in polyploid species in which gene duplication may have led to unequal expression (Adams et al., 2003). Associative transcriptomics has been recently used in B. napus to identify genes underlying control of seed glucosinolate content (Harper et al., 2012; Lu et al., 2014) and anion homeostasis (Koprivova et al., 2014). The former two studies utilized panels of 84 and 101 genotypes, respectively. Despite the relatively small population sizes, a number of loci associated with seed glucosinolate concentrations were identified. Most notable associations include loci containing orthologs of A. thaliana HIGH ALIPHATIC GLUCOSINOLATE 1 and 3 (HAG1 and HAG3), known to regulate aliphatic glucosinolate biosynthesis (Sønderby et al., 2010). Koprivova et al. (2014), also made use of the panel of 84 genotypes and identified a number of loci associated with leaf nitrate, phosphate, and sulfate. Within these loci were a number of clear candidate genes, including a calcium-activated chloride channel previously shown to control nitrate levels in A. thaliana (De Angeli et al., 2006) which was associated with leaf nitrate concentration and a hypothetical phosphate/phosphoenolpyruvate translocator associated with leaf phosphate concentration.
Leaf Ca and Mg concentrations were previously characterized in a diversity population of ∼400 genotypes of B. napus in a broad-spectrum mineral analysis (Thomas et al., 2016). This population is likely to capture most of the species-wide variation, comprising oilseed, swede and fodder types. In this study, we perform associative analyses on this data using transcriptome sequences from 383 genotypes to identify genes influencing Ca and Mg accumulation. Candidate genes could be applied in marker assisted breeding in this and other Brassica crops, with the possibility of improving nutrient use efficiency of the crop and increasing available nutrients in edible plant tissue for improving human and livestock nutrition.
Materials and Methods
Characterization of Leaf Ca and Mg Concentration
This study used the Renewable Industrial Products from Rapeseed (RIPR) diversity population of inbred lines of Brassica napus genotypes (Thomas et al., 2016). These were developed from the ERANET-ASSYST consortium diversity population (Bus et al., 2011, 2014; Körber et al., 2012, 2015) with further lines included. A subset of 383 genotypes were selected, comprising 160 winter-, 127 spring-, and seven semi-winter-oilseed rape (OSR), 35 swede, 15 winter fodder, and 39 exotic/unspecified habits. These were previously characterized for leaf mineral concentrations by inductively coupled plasma-mass spectrometry (ICP-MS) of polytunnel-grown plants sampled at the rosette stage (typically 6–8 true leaves showing; Thomas et al., 2016). The full leaf mineral dataset is available at the Brassica Information Portal (BIP1; The Earlham Institute, Norwich, United Kingdom) and at doi: 10.5281/zenodo.59937.
Associative Analyses
Transcriptome Sequencing and Population Structure Analysis
Extraction of RNA, quality checking and Illumina transcriptome sequencing were carried out as described by He et al. (2016). Tissue samples for RNA extraction were prepared from second true leaves, harvested when they reached ∼3 cm in diameter. RNA-seq data from each accession was mapped using methods described by Bancroft et al. (2011) and Higgins et al. (2012) onto ordered Brassica A and C genome-based pan-transcriptomes developed by He et al. (2015). Transcriptome sequencing was performed by the Earlham Institute (formerly The Genome Analysis Centre; Norwich, United Kingdom). Across the 383 accession panel, 46,307 single SNPs and 309,229 hemi-SNPs were detected and scored of which 256,397 SNPs had a population second allele frequency (saf) > 0.01. Transcript abundance was quantified and normalized as reads per kb per million aligned reads (RPKM) for each accession for 116,098 coding DNA sequence (CDS) models of the pan-transcriptome reference. Significant expression (mean > 0.4 RPKM) was detected for 53,889 CDS models. Inference of population structure by Q-matrix was obtained by Population Structure Inference using Kernel-PCA and Optimization (PSIKO; Popescu et al., 2014). A heatmap illustrating the relatedness of all genotypes in this study can be found in Supplementary Figure 1. Transcriptome sequences are deposited within the Sequence Read Archive (Leinonen et al., 2011) under accession number PRJNA309367.
Associative Transcriptomics
Associative transcriptomics was performed using SNPs, Q-matrix and trait data in a compressed mixed linear model approach (Zhang et al., 2010) implemented in the GAPIT R package (Lipka et al., 2012) in R 3.2.0 (R Core Team, 2015). The association analysis between gene expression markers (GEMs) and traits was performed by using fixed effect linear modeling in R with RPKM values and Q-matrix data as the explanatory variables and trait score the response variable using custom designed scripts (Harper et al., 2012; Havlickova et al., in press). Coefficients of determination (R2), constants and significance values were calculated for each regression. Manhattan plots were generated using graph functions in R. SNPs with low second allele frequency (<0.01) were filtered from the dataset prior to generating plots. In total 256,397 SNPs and 53,889 GEMs were plotted. False discovery rate (FDR; Benjamini and Hochberg, 1995) and Bonferroni (Dunn, 1961) corrections were used to set significance thresholds at P < 0.05. Due to sequence similarity between B. napus A and C genomes, assignment to a specific genome was not possible for all SNP markers; such markers are plotted in gray and appear in both positions on Manhattan plots. See Supplementary Figures 2–5 for quartile–quartile (QQ) plots of each association analysis.
Candidate Gene Identification
Ordered pan-transcriptome data based on Brassica A and C genomes from B. rapa, B. napus, and B. oleracea CDS gene models (He et al., 2015) were used to identify candidate genes. Candidate genes were selected based on Arabidopsis thaliana annotated functions of Brassica orthologs within estimated linkage disequilibrium (LD) decay of significantly associated markers (around 1–2 cM on average; Ecke et al., 2010). Further information relating to candidate gene predicted function was obtained from genome browsers comprising sequences of B. rapa (A genome, Chiifu-401-41; Wang et al., 2011) and B. oleracea (C genome, TO1000DH3; Parkin et al., 2014) at Ensembl Plants (Kersey et al., 2016). A. thaliana functional information were obtained from The Arabidopsis Information Resource (TAIR; Huala et al., 2001). Further resources used to aid with selection of candidates included A. thaliana gene expression data at The Bio-Analytic Resource for Plant Biology (Waese and Provart, 2017) and ionomic data at the Purdue Ionomics Information Management System (PIIMS; Baxter et al., 2007).
Experiments Using Arabidopsis thaliana Mutants
Plant Material and Genotyping
Seed of 15 Arabidopsis thaliana mutant lines representing 10 candidate genes were acquired from the Nottingham Arabidopsis Stock Centre (Nottingham, United Kingdom). These comprised SALK (Alonso et al., 2003) and SAIL (Sessions et al., 2002) T-DNA lines and are summarized in Table 1. Arabidopsis thaliana ecotype Columbia-0 (Col-0) was used as the wild type control in all experiments. Plants were by genotyped for homozygous T-DNA insertions by conventional PCR. Genotyping primers are summarized in Table 1. Left border primers used were SALK LBb1 and SAIL LB1 for SALK and SAIL lines, respectively.
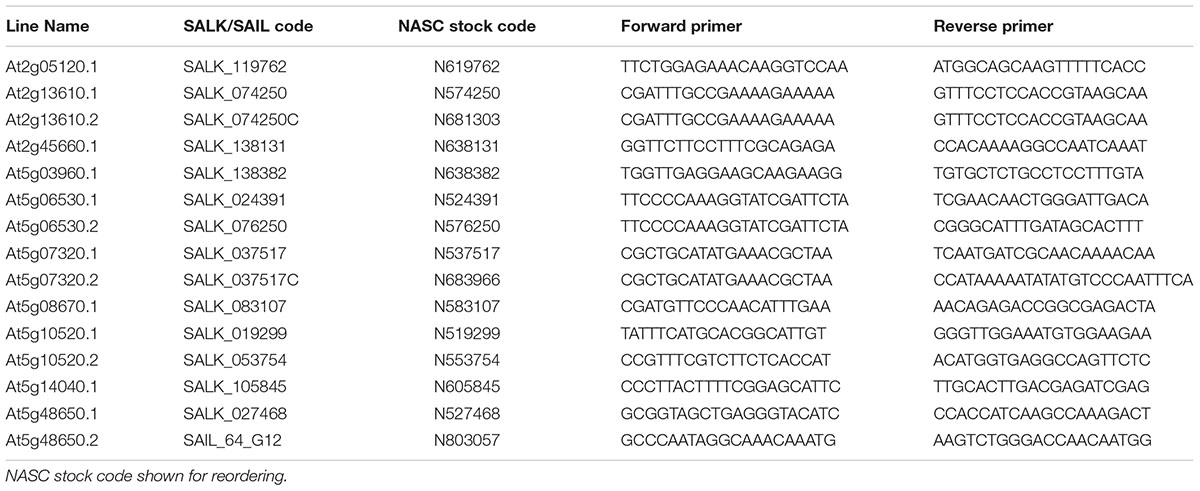
TABLE 1. Summary of Arabidopsis thaliana T-DNA insertion lines acquired for characterisation including primers used for genotyping.
Preliminary Phenotyping
Seeds from homozygous mutant lines and Col-0 were sterilized in bleach, then washed in H2O and 70% ethanol prior to sowing on plates containing 1% agar containing 0.4 g L-1 Hoagland’s solution (Hoagland and Arnon, 1950; ¼ strength). Plates were stored in darkness at 4°C for 24 h, and then moved to a controlled environment growth chamber set to 23°C (∼30 W m-2 continuous light). After 7 days, plants were transferred to pots containing Levington M3 compost (ICL Specialty Fertilizers, Ipswich, Suffolk, United Kingdom) plus T34 biocontrol (Fargro Ltd., Arundel, West Sussex, United Kingdom) and placed on flow benches in a glasshouse with 18°C heating, venting at 20°C, with 16-h supplementary lighting (76 W m-2). Flow bench automatic irrigation operated once daily. After 10 days of establishment, six plants of each line were chosen randomly and transferred to individual wells in 16 well trays in a six block, using a one-way randomized design generated in GenStat (17th edition; VSN International, 2014) in which plants of each line were represented once per block and randomized within each block (Supplementary Table 1). In total, each line was represented six times. ARACON systems (Betatech BVBA, Gent, Belgium) were used to keep plants separate. At mid-flowering, whole shoots were harvested by cutting them below the rosette. Shoots were dried at 50°C for at least 2 days, and then crushed by hand within paper bags. Shoot subsamples (∼0.10 g DW) were digested using a microwave system comprising a Multiwave 3000 platform with a 48-vessel MF50 rotor (Anton Paar GmbH, Graz, Austria). Digestion vessels were perfluoroalkoxy (PFA) liner material and polyethylethylketone (PEEK) pressure jackets (Anton Paar GmbH). Leaf material was digested in 2 mL 70% Trace Analysis Grade HNO3, 1 mL Milli-Q water (18.2 MΩ cm; Fisher Scientific UK Ltd., Loughborough, United Kingdom), and 1 mL H2O2 with microwave settings as follows: power = 1,400 W, temp = 140°C, pressure = 2 MPa, time = 45 min. Two operational blanks and duplicate samples of certified reference material (CRM; Tomato SRM 1573a, NIST, Gaithersburg, MD, United States) were included in each digestion run. Following digestion, each tube was made up to a final volume of 15 mL by adding 11 mL Milli-Q water and transferred to a 25 mL universal tube (Sarstedt Ltd., Nümbrecht, Germany) and stored at room temperature. Leaf digestates were diluted 1-in-5 using Milli-Q water prior to broad-spectrum elemental analysis by ICP-MS as described previously (Thomas et al., 2016). For each data-point, an element-specific operational blank concentration (mean of each ICP-MS run) was subtracted. Data were then multiplied by initial sample volume, divided by the initial dry mass of plant material, and converted to mg element kg-1 of dry leaf or seed material. The CRM Ca and Mg recovery averaged 99 and 89%, respectively.
Tissue Partitioning Experiment
Based on results from preliminary phenotyping, lines At2g13610.2, At5g07320.2, and At5g48650.2 were found to have significantly lower shoot Ca or Mg concentrations than wild type plants and hence were selected for further characterization. Individual seed from these lines and Col-0 were sown into 12 well trays containing Levington M3 compost plus T34 biocontrol and placed on flow benches in a glasshouse with 18°C heating, venting at 20°C, with 16-h supplementary lighting (76 W m-2). Flow bench automatic-irrigation operated once daily. After successful establishment, 12 plants per genotype were selected randomly and transplanted into individual 9 cm pots. These were arranged in a 12 block, one-way randomized design generated in GenStat in which each genotype was represented once per block and genotypes randomized within each block (Supplementary Table 2). At mid-flowering (40 days after sowing), entire shoots were harvested. Shoots were partitioned into rosette leaves, stem, cauline leaves, and siliques. Tissue samples were dried at 50°C for 6 days, and then samples from plants in blocks 1–4, 5–8, and 9–12 were pooled into the four genotypes to ensure enough sample was available for mineral analysis. Pooled samples were crushed by hand, and then microwave digested prior to mineral analysis by ICP-MS as described above. Digestates were diluted 1-in-10 prior to mineral analysis. The recovery of Ca and Mg from the CRM averaged 96 and 88%, respectively.
Statistical Analyses
Data from experiments using A. thaliana mutants were analyzed using one-way ANOVA in GenStat (17th edition; VSN International, 2014) with block design included in the model. Tissue Ca and Mg concentration data were analyzed separately in each case, and tissue types were analyzed using separate ANOVA tests in the tissue partitioning experiment. For the preliminary phenotyping experiment, six replicate plants were analyzed for each genotype. For the tissue partitioning experiment, three samples, each comprising pooled samples from four replicate plants, were analyzed for each genotype. Means of different A. thaliana genotypes were compared using Least Significant Difference (LSD) functions in GenStat with differences considered significant at P < 0.05. Further LSD tests were conducted at P < 0.01 and P < 0.001 levels.
Results
Variation in Leaf Ca and Mg Concentration in the RIPR Diversity Population
The leaf concentrations of 21 mineral elements including Ca and Mg in the RIPR diversity population were previously determined by Thomas et al. (2016). Leaf Ca concentrations varied over threefold across the population, from 5,838 mg kg-1 to 18,752 mg kg-1. Leaf Mg concentrations were of a similar order of magnitude and varied over twofold, from 5,118 mg kg-1 to 13,429 mg kg-1. The frequency distribution of these two elements approximated a normal distribution (Supplementary Figure 6). Leaf Ca and Mg concentrations were among the highest, positively correlated elements measured across genotypes and tissues, with an r-value of 0.87 (P < 0.001). Leaf Ca and Mg concentrations varied between crop type, with higher concentrations of both elements in leaves of spring and semi-winter OSR than in winter OSR, winter fodder, and swede types.
Associative Transcriptomics Suggest Flowering Time Regulators Are Important Markers for Leaf Ca and Mg Concentrations
To identify candidate loci, SNPs and GEMs were used separately in analyses. A total of 1,295 and eight SNPs were found to be significantly associated with B. napus leaf Ca concentration after FDR and Bonferroni corrections, respectively. After removing SNPs with low second allele frequency, this was reduced to 247 and five SNPs, respectively, across all chromosomes. Visually determined association peaks on Manhattan plots were observed on chromosomes A3, A6, A7, A10, C2, C3, and C9 (Figure 1A). The most well defined peak was located on chromosome A10 and contained four out of the five SNPs above the Bonferroni corrected significance threshold (P = 0.05). The fifth SNP above this threshold fell in a peak on chromosome C9, in a region known to share sequence homology with parts of chromosome A10 (Chalhoub et al., 2014). A total of 5,557 and 141 GEMs were identified as significantly associated with leaf Ca concentration after FDR and Bonferroni corrections, respectively (Figure 1B). Notable peaks were observed on chromosomes A2 and C2. Single, associated GEMs were found at similar locations to SNP association peaks on chromosomes A3 and C2. The A. thaliana ortholog of B. napus genes corresponding to both these GEMs is At5g10140, which encodes FLOWERING LOCUS C (FLC), a transcription factor important for controlling flowering time (Michaels and Amasino, 1999). A further associated GEM was found in a region of chromosome A10, close to a SNP peak associated with leaf Ca concentration. Other single GEMs associated with leaf Ca concentration were observed on chromosomes A5, A6, C4, and C6. B. napus genes corresponding to these GEMs on chromosomes A5 and C4 are orthologous to A. thaliana At2g45660, which encodes SUPPRESSOR OF OVEREXPRESSION OF CO 1 (SOC1), another flowering time regulator (Lee et al., 2000).
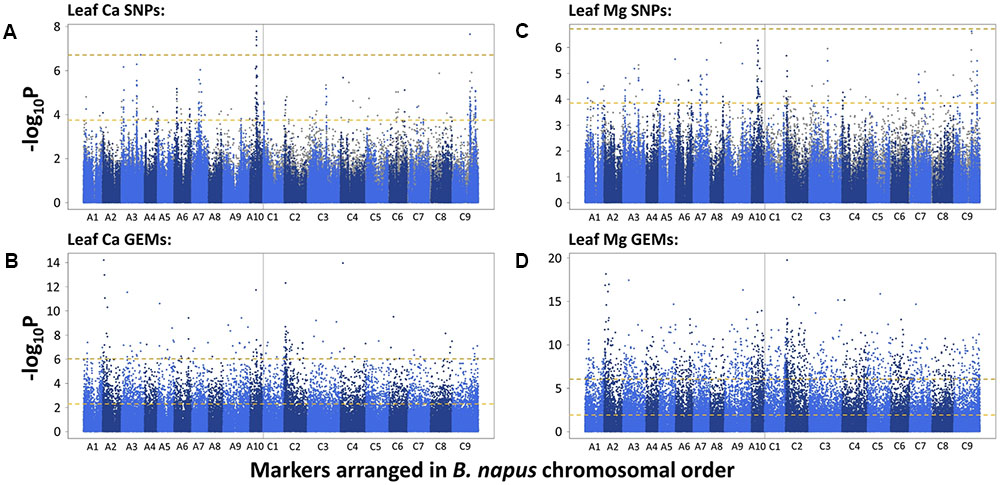
FIGURE 1. –log10P values of SNPs and GEMs associated with leaf Ca concentration (A,B, respectively) and leaf Mg concentration (C,D, respectively) in order of markers within the B. napus pan-transcriptome. Upper, gold, dashed line represents Bonferroni corrected significance threshold; lower, yellow, dashed line represents FDR corrected significance threshold (P = 0.05).
The SNP and GEM associations for leaf Mg concentration were similar to those described for leaf Ca concentration. A total of 1,012 and one significant SNP(s) were found after FDR and Bonferroni corrections, respectively. After removing SNPs with low second allele frequency, this was reduced to 166 and zero SNPs, respectively, across all chromosomes. Of these 166 SNPs, 86 were identical to SNPs identified as significantly associated with leaf Ca concentration after FDR correction and removal of SNPs with low second allele frequency, indicating the potential of similar mechanisms to partly regulate accumulation. Visually determined association peaks largely co-localized with those associated with leaf Ca concentration, specifically on chromosomes A3, A7, A10, C2, C3, and C9 (Figure 1C). The most well defined peak was again on chromosome A10, and as before, a region on chromosome C9 with sequence homology to this region also contained associated SNPs. An association peak on chromosome A2 was also particularly well defined, containing 15 SNPs above the FDR corrected significance threshold. A total of 12,973 and 1,489 GEMs were identified as significantly associated with leaf Mg concentration after FDR and Bonferroni corrections, respectively, across all chromosomes (Figure 1D). Of these, 5,160 and 131 were also significantly associated with leaf Ca concentration after FDR and Bonferroni corrections, respectively. Notable peaks were again observed on chromosomes A2 and C2. The most highly associated GEMs on A3 and C2 were identical to those associated with leaf Ca concentration which correspond to A. thaliana FLC, and an associated GEM on C4 is identical to the GEM associated with leaf Ca concentration corresponding to SOC1.
Genes Encoding Previously Identified Ca and Mg Transporters Are within Linkage Disequilibrium of Highly Associated Markers for Leaf Ca and Mg Concentration
Linkage disequilibrium describes the non-random association of alleles at different loci (Slatkin, 2008). Genes located physically near to each are generally inherited together, and hence are often in very strong LD. It is therefore feasible that any number of genes within LD of SNPs significantly associated with a trait may be controlling such associations. Based on associative transcriptomics results, seven loci were focussed on for the identification of candidate genes. These comprised regions of chromosomes A2, A3, A5, A6, A10, C2, and C4. A total of 17 B. napus candidate genes orthologous to 15 A. thaliana genes are summarized in Table 2. Four candidate genes were selected based on direct GEM hits as described above. These are Cab002472.4 and BnaC02g00490D (on chromosomes A3 and C2, respectively) encoding orthologs of A. thaliana At5g10140 (FLC), and Cab025356.1 and Bo4g024850.1 (on chromosomes A5 and C4, respectively) encoding orthologs of A. thaliana At2g45660 (SOC1). One and two candidate genes on chromosomes A2 and C2, respectively are orthologous to A. thaliana MAGNESIUM TRANSPORTER 7 (MGT7/MRS2-7). This was previously characterized in Arabidopsis thaliana as an Mg transporter important for Mg uptake at low external concentrations (Gebert et al., 2009). A further candidate gene on chromosome A10 is orthologous to A. thaliana AUTOINHIBITED CA2+-ATPASE, ISOFORM 8 (ACA8). This was previously characterized as a plasma membrane-localized Ca2+ transporting ATPase in A. thaliana (Bonza et al., 2000) and was identified as Ca responsive in B. rapa (Graham et al., 2014). The functions of the remaining nine candidate genes were selected based on sequence homology and annotations of A. thaliana orthologs and are either uncharacterized, or have not previously been experimentally shown to be involved in plant Ca or Mg accumulation (Table 2). These and At2g45660 (SOC1) were used for the selection of A. thaliana mutants.
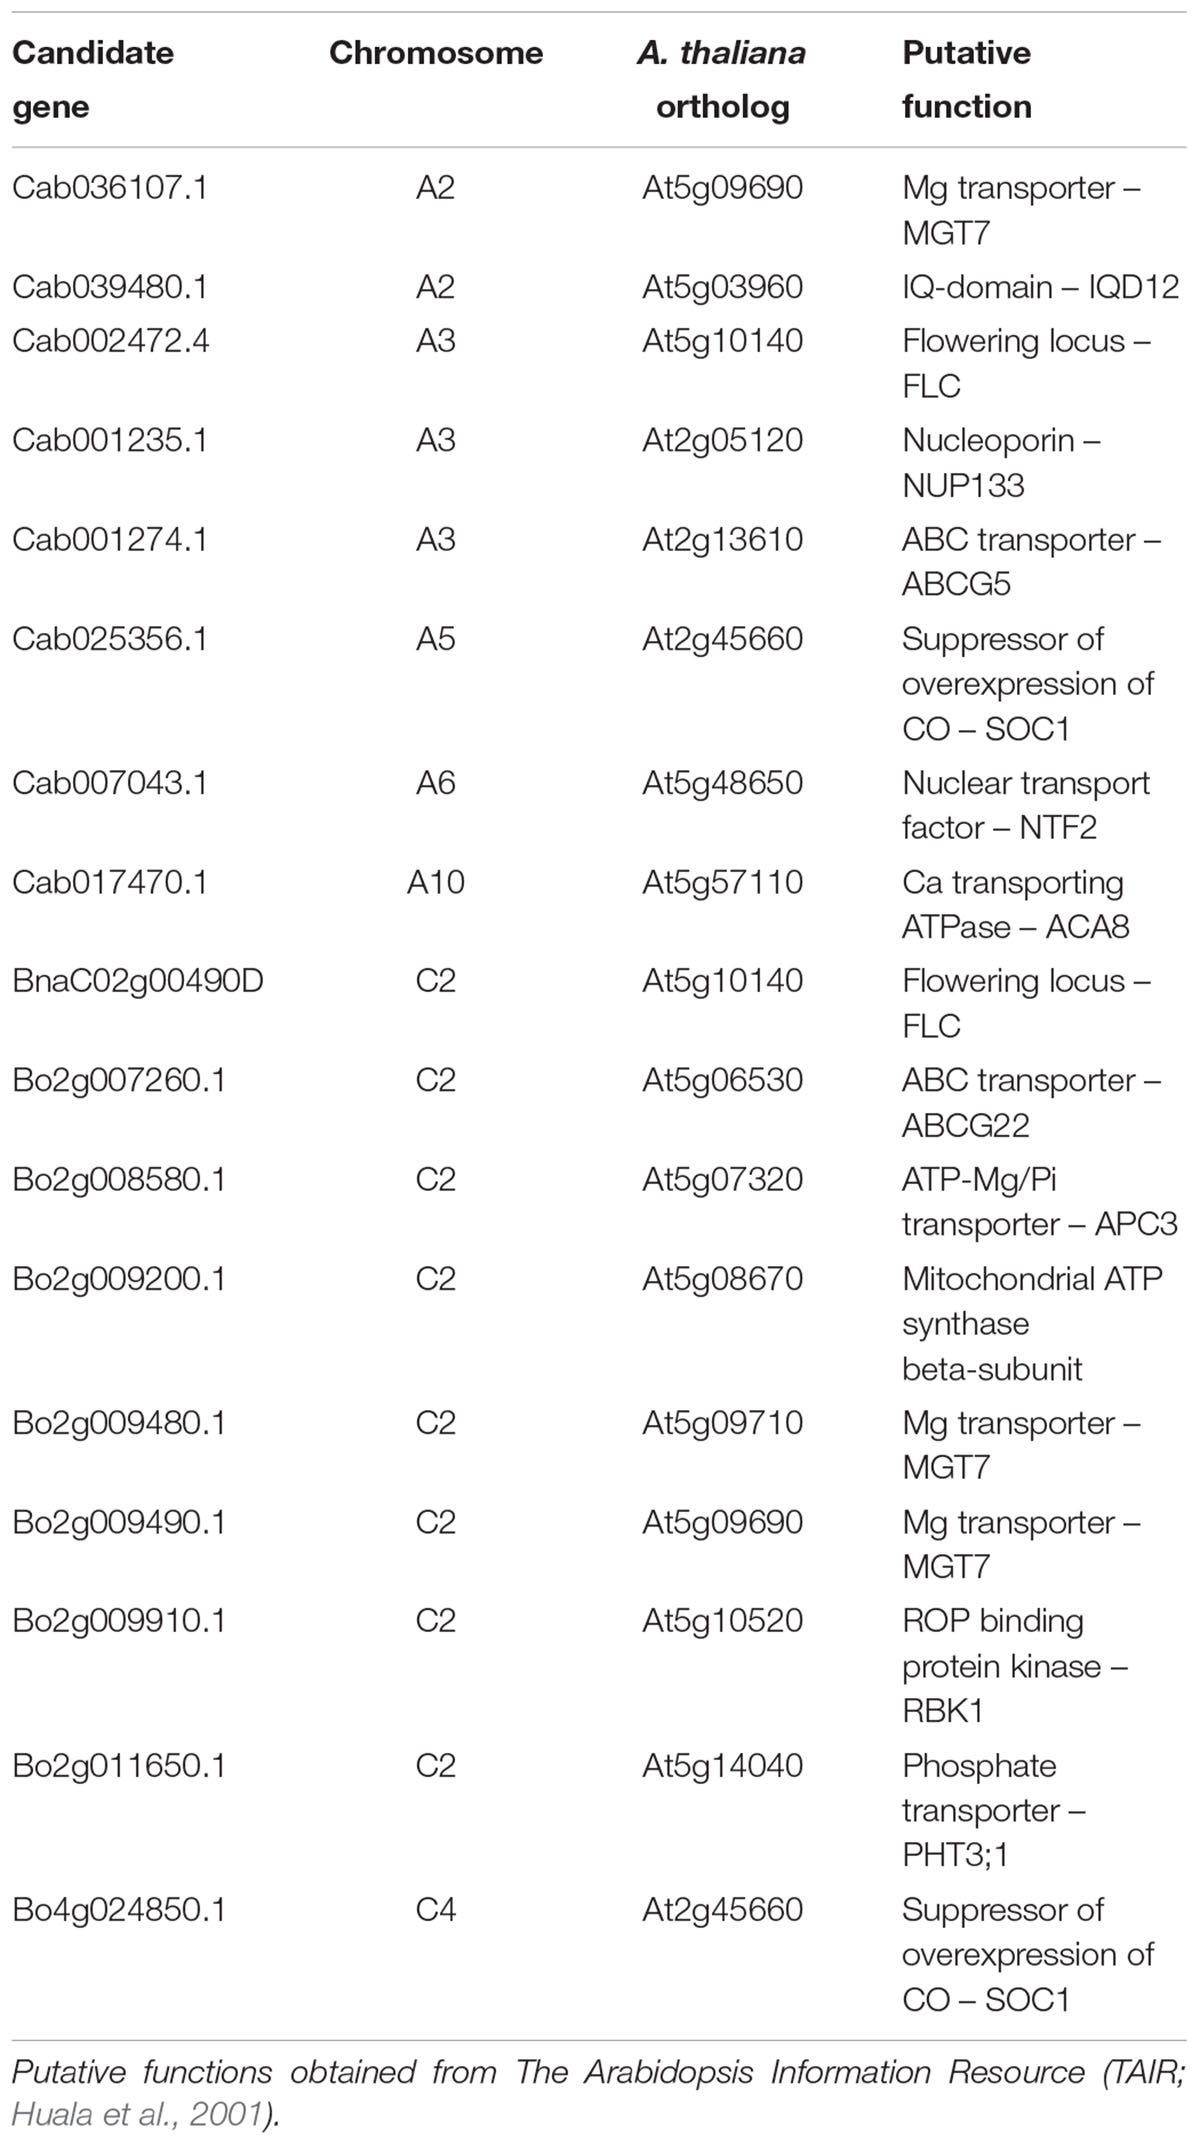
TABLE 2. Summary of candidate genes selected from associative transcriptomics outputs.
Four Mutant A. thaliana Lines Have Reduced Shoot Ca and Mg Concentration Compared to Wild Type and Effects Are Tissue Specific
Shoot Ca concentrations in a preliminary A. thaliana phenotyping experiment varied threefold between individual plants, from 8,684 to 26,387 mg kg-1 dry weight (DW; Supplementary Table 3). Much of this variation was observed within genotypes, with the largest variation observed in lines At5g7320.1 and At5g08670.1. Four mutant lines had significantly lower mean shoot Ca concentrations than wild type plants. These were At2g13610.2 (P < 0.05), At5g07320.2 (P < 0.01), At5g08670.1 (P < 0.05) and At5g48650.2 (P < 0.01; Figure 2A). Leaf Mg concentrations varied less, with twofold variation from 8,189 to 16,186 mg kg-1 DW observed between individual plants. Much of this variation was between genotypes. Two mutant lines had lower mean shoot Mg concentration than wild type plants. These were At2g13610.1 (P < 0.05) and At5g48650.2 (P < 0.05; Figure 2B). Based on these data, lines At2g13610.2, At5g07320.2, and At5g48650.2 were selected for characterization of tissue specific leaf Ca and Mg concentration.
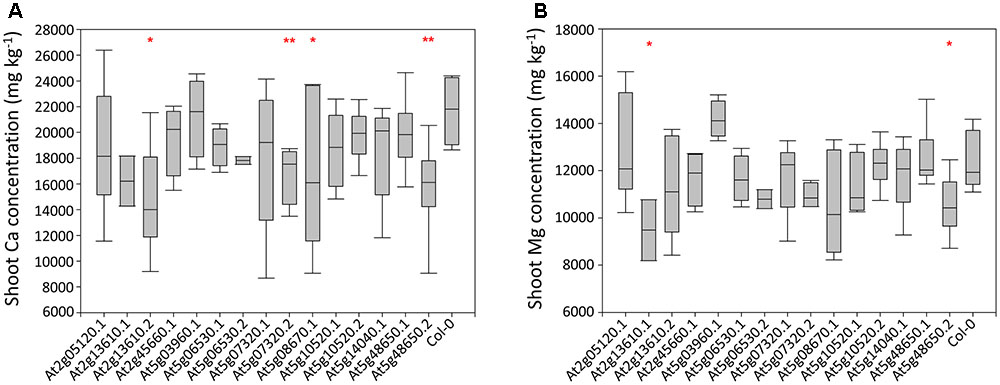
FIGURE 2. Shoot Ca (A) and Mg (B) concentrations across 15 mutant A. thaliana lines and wild type (Col-0) plants. Boxes represent the mid two quartiles with the median drawn; whiskers are the 95% confidence limits. Single and double stars above boxes represent significance at P < 0.05 and P < 0.01, respectively, compared to wild type (Col-0) plants.
Calcium concentrations varied over eightfold between tissues and pooled tissue samples, ranging from 4,998 mg kg-1 DW in stems to 40,536 mg kg-1 DW in cauline leaves (Figures 3A–D and Supplementary Table 4). Cauline and rosette leaf Ca concentrations were similar, ranging from 32,966 mg kg-1 DW in rosette leaves to 40,536 mg kg-1 DW in cauline leaves. Mean silique Ca concentrations were lower in lines At2g13610.2, At5g07320.2, and At5g48650.2 than wild type plants (P < 0.01; Figure 3B). Mean stem Ca concentrations were lower in lines At5g07320.2 and At5g48650.2 than wild type plants (P < 0.05; Figure 3C). Mean cauline leaf Ca concentration was lower in line At5g48650.2 than wild type plants (P < 0.05; Figure 3D). Mg concentrations varied over ninefold between tissues and pooled samples, ranging from 2,608 mg kg-1 DW in stems to 23,999 mg kg-1 DW in rosette leaves (Figures 4A–D). Cauline leaf and rosette leaf Mg concentrations had a similar range, from 18,026 to 21,328 mg kg-1 DW and from 19,240 to 23,999 mg kg-1 DW, respectively. Lines At2g13610.2 and At5g48650.2 had lower mean silique Mg than wild type plants (P < 0.05; Figure 4B). Line At5g48650.2 also had lower mean stem Mg than wild type plants. Finally, and comparable with results from cauline leaf Ca concentration analysis, mean cauline leaf Mg concentration was lower in line At5g48650.2 than in wild type plants (P < 0.05; Figure 4D).
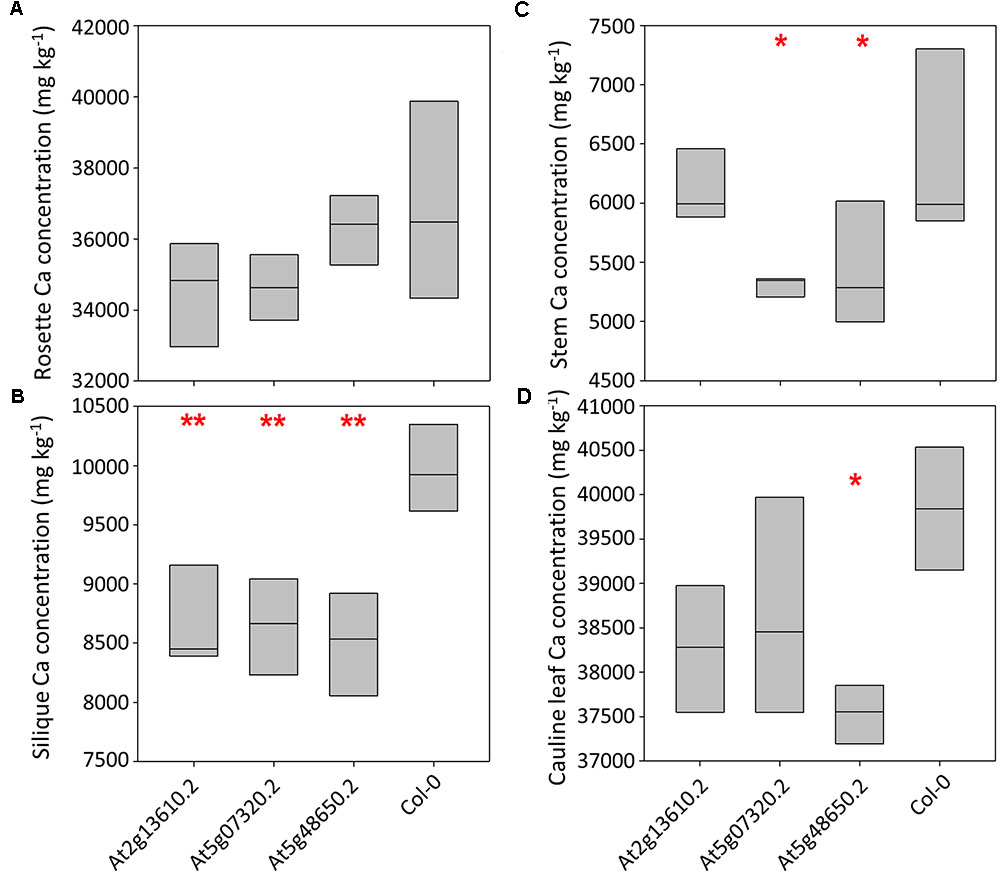
FIGURE 3. Rosette leaf (A), silique (B), stem (C) and cauline leaf (D) Ca concentrations across three mutant A. thaliana lines and wild type (Col-0) plants. Boxes represent full range of values with the median drawn. Single and double stars above boxes represent significance at P < 0.05 and P < 0.01, respectively, compared to wild type (Col-0) plants.
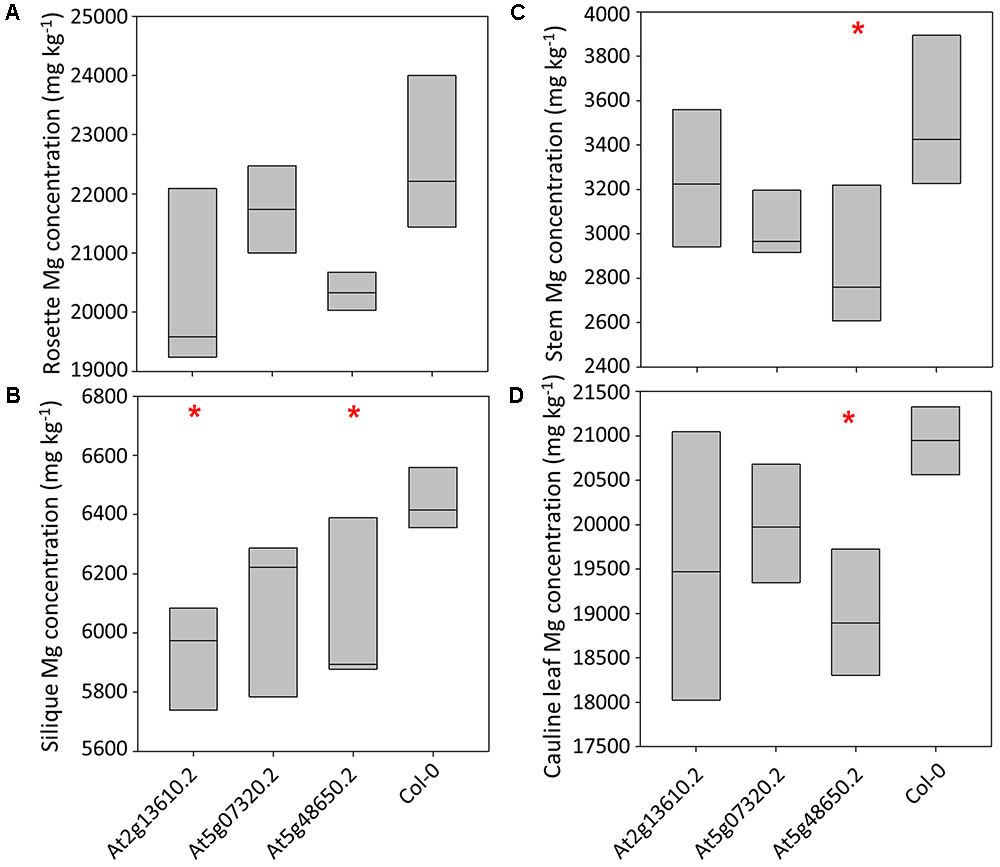
FIGURE 4. Rosette leaf (A), silique (B), stem (C) and cauline leaf (D) Mg concentrations across three mutant A. thaliana lines and wild type (Col-0) plants. Boxes represent full range of values with the median drawn. Single and double stars above boxes represent significance at P < 0.05 and P < 0.01, respectively, compared to wild type (Col-0) plants.
In summary, data from A. thaliana experiments identified four and two mutant lines with lower shoot Ca and Mg concentrations than wild type plants, respectively, and three of these mutations have tissue specific phenotypes. The main tissue specific effects were observed in silique tissue, with lower silique Ca concentrations in all three mutant lines investigated in the tissue partitioning experiment.
Discussion
SNP Based Association Analyses Identify Novel and Confirm Pre-determined Candidate Loci for Leaf Ca and Mg Concentrations
Leaf Ca concentration was highly associated with loci on chromosomes A3, A6, A7, A10, C2, C3, and C9 (Figure 1A). Similar loci were associated with leaf Mg concentration, specifically in regions of chromosomes A3, A7, A10, C2, C3, and C9 (Figure 1C). The most highly associated SNP for leaf Ca concentration was located on chromosome A10 (Figure 1A). This co-localizes with associated markers on C9 and markers on A10 and C9 for leaf Mg concentration. Co-localization of association peaks and associated markers for both mineral elements is unsurprising, as leaf Ca and Mg concentration data used in this study were very highly correlated (r = 0.87, P < 0.001; Thomas et al., 2016) and may reflect the relative lack of selectivity between these and other group II elements during accumulation within the plant (White, 2001). Such correlations between shoot Ca and Mg concentration have been previously shown in B. oleracea (Broadley et al., 2008) and a number of other angiosperm species (Broadley et al., 2004). Bus et al. (2014) previously investigated the genetic control of shoot ionome traits across 505 lines of B. napus using 3,910 SNPs in association analyses. Results showed two associations at a locus on chromosome C9 for shoot Ca and Mg concentration with a further association on chromosome C7 for shoot Ca concentration. The detection of an association locus on C9 is consistent with co-localized associations identified in this study. These results are also consistent with earlier findings by Broadley et al. (2008) who identified significant QTL for shoot Ca and Mg in B. oleracea on chromosomes C2, C6, C7, C8, and C9. Together, these results indicate the importance of loci on chromosomes A10 and C9 for Ca and Mg accumulation. The QTL identified for shoot Mg in B. oleracea on chromosome C2 by Broadley et al. (2008) is also consistent with findings in the present study that a locus on C2 is highly associated with leaf Mg concentration in B. napus. However, further work is required to confirm whether the loci are in close proximity to one another. To our knowledge, the remaining loci identified in this study have not been previously identified as important QTL for leaf Ca and Mg concentration in Brassica spp.
FLC and SOC1 GEM Associations May Be Linked to Variation in Leaf Ca and Mg Concentrations between Spring and Winter B. napus Types in the RIPR Panel
Gene-expression marker analyses associated markers corresponding to FLC and SOC1 with both leaf Ca and Mg concentrations. In A. thaliana, FLC is a repressor of flowering (Michaels and Amasino, 1999) and it has been previously shown that FLC transcript concentration correlates with vernalization requirements (Sheldon et al., 2000). Expression levels of SOC1 also correlate with flowering time in A. thaliana; in lines which flower later, SOC1 expression is very low (Lee et al., 2000). It is thought that SOC1 expression is repressed by FLC, indicating the tight regulatory links between these genes and flowering time. Leaf Ca and Mg concentration data used in this study were obtained from analysis of plants in the RIPR panel (Thomas et al., 2016) which includes a large number of spring and winter B. napus varieties. Thomas et al. (2016) observed differences in leaf Ca and Mg concentrations between these types, with higher mean concentrations of both leaf Ca and Mg in spring OSR compared to winter OSR and winter fodder types. Since winter OSR types are generally considered to have longer vernalization requirements than spring types, it is possible that the association of FLC and SOC1 with leaf Ca and Mg concentration observed in this study was a result of differences in vernalization requirement between these groups rather than direct genetic control of Ca and Mg uptake. It is worth noting that the association of GEMs with a trait does not indicate the causative polymorphism/s, only genes in which expression level is associated with variation in the trait. The causative polymorphism/s may lie in the promotor sequence of such genes, or localize somewhere upstream in the pathway. Hence, in the case of the flowering time genes identified here, it is unclear whether or not the observed associations with leaf Ca and Mg concentration are directly caused by changes in expression of FLC and SOC1. Despite this, their expression appears to be a suitable marker for the concentrations of these elements in B. napus. Further to this, the concentrations of a number of other mineral elements measured in the study of Thomas et al. (2016) were found to vary between crop types with typically different flowering times and vernalization requirements. Most notably, leaf concentrations of Mo, Na, P, and S were higher in spring OSR than winter OSR types. This suggests that flowering time, or the upstream mechanisms leading to changes in flowering time, has an effect on the concentrations of a number of nutrients in B. napus, though the pathway/s that lead to these differences remain unclear.
ACA8 and MGT7 Are among Genes within Linkage Disequilibrium of Associated Loci
Identification of high-resolution loci influencing leaf Ca and Mg concentrations enabled locus-specific exploration of the Brassica pan-transcriptomes and other genome resources for candidate genes within LD of SNPs. LD is especially relevant to the efficacy of associative transcriptomics in the absence of a marker in a trait-controlling gene. LD decays relatively quickly in B. napus (Ecke et al., 2010; Harper et al., 2012), and this helps to reduce the number of possibilities when searching for candidate genes. However, in this study, typically hundreds of genes were still within previously estimated LD decay (around 1–2 cM on average; Ecke et al., 2010) of most candidate loci. Fortunately, well annotated browsers of Brassica A and C genomes are available at Ensembl Plants (Kersey et al., 2016), which enabled rapid identification of nearby genes in the reference sequences with links to functional annotation of A. thaliana orthologs.
Most notable genes identified using this workflow include an ortholog of A. thaliana ACA8 near markers associated with leaf Ca on chromosome A10 and two orthologs of A. thaliana MGT7 near markers associated with leaf Mg on chromosomes A2 and C2. ACA8 encodes a Ca2+ transporting ATP-ase localized to the plasma membrane (Bonza et al., 2000). A B. rapa ortholog of A. thaliana ACA8 was previously identified under an eQTL hot spot on chromosome A3 (Graham et al., 2014). The eQTL associated with this gene was defined as Ca-responsive, i.e., the direction of the eQTL changed under high Ca supply. The A. thaliana ortholog of ACA8 was further investigated in silico in the same study using publically available phenotypic data at the PIIMs database (Baxter et al., 2007). This led to the identification of ACA8 T-DNA knockout mutants with greater shoot Ca concentrations than control plants in over 50% of mutant samples, indicating the ability of this gene to influence Ca accumulation in Brassica. MGT7 is a member of the MGT/MRS2 Mg transport family. This was previously characterized as a key transporter for Mg uptake at low external Mg concentrations by Gebert et al. (2009). Arabidopsis thaliana T-DNA knockout mutants were severely retarded in development when grown at low external Mg concentrations, but were visually unaffected when grown at higher external Mg concentrations. Both ACA8 and MGT7 are very promising candidate genes for the control of Ca and Mg accumulation in B. napus. The presence of these genes within LD of highly associated SNPs demonstrates the effectiveness of associative transcriptomics in candidate gene identification. Since ACA8 and MGT7 knockout mutants had previously been characterized in A. thaliana, they were not included in further experiments in this study.
Arabidopsis thaliana Mutant Phenotyping Reveals New Candidates for Ca and Mg Accumulation
The preliminary A. thaliana phenotyping experiment identified four mutant lines with lower shoot Ca concentrations and two with lower shoot Mg concentrations than wild type plants. The most notable of these was At5g48650.2, the only line in which both shoot Ca and Mg was affected. The gene mutated in this line encodes NUCLEAR TRANSPORT FACTOR 2 (NTF2). This protein is proposed to function in the import of RAN, a multifunctional GTPase involved in nucleocytoplasmic transport (Zhao et al., 2006). It is the first time that it has been characterized with a shoot Ca and Mg phenotype in A. thaliana. Further investigation of this line showed that it had lower Ca and Mg concentration than wild type plants in all tissues except rosette leaves, suggesting it could be a promising candidate for manipulating the translocation of Ca and Mg to specific tissues in crop plants. At5g07320 encodes the ATP-Mg/Pi transporter APC3. Despite being annotated as an Mg/Pi transporter, mutants in this gene were only found to have reduced shoot Ca concentration. Tissue specific characterisation of this line showed silique and stem Ca concentrations were lower than wild type plants. This suggests that, at least in these conditions, the effects of the mutation are limited. However, effects at different external Ca or Mg concentrations might be different. A further line mutated in a gene encoding an ABC transporter was found to have both lower Ca and Mg concentrations in siliques compared to wild type plants. Identifying candidate genes controlling silique nutrient traits is particularly important in B. napus, which is mostly grown for the harvest of seeds which have a secondary use in animal feed. All A. thaliana experiments in this study took place using a high-nutrient compost. This could have masked the phenotypes of mutations in a number of candidate genes which may have been able to maintain normal Ca and Mg concentrations due to sufficient soil concentrations. In addition, it is possible that the mutations characterized here would show greater defects in shoot Ca and Mg concentrations when grown in nutrient limiting conditions. As well as this, all plants in both A. thaliana experiments were harvested at a single growth stage and other phenotypes might be seen at other growth stages. Despite this, four candidate genes analyzed here have proven to be potential targets for altering Ca and Mg concentrations in B. napus. These are orthologs of the Arabidopsis thaliana genes At2g13610, At5g07320, At5g08670, and At5g48650.
Summary and Potential Applications
In this study, we have identified a number of genetic loci associated with leaf Ca and Mg concentration in B. napus. Within these loci, several novel candidate genes together with genes previously shown to influence or respond to Ca and Mg concentrations in this and closely related Brassica spp. were localized. Most well defined loci included regions on chromosomes A2, A10, C2, and C9, close to the known Ca and Mg transporters ACA8 and MGT7. Experiments in A. thaliana T-DNA knockouts confirmed that a further four candidate genes influence shoot Ca and Mg concentrations. This study used B. napus associative transcriptomics followed by an A. thaliana T-DNA knockout workflow to identify and test candidate genes quickly and efficiently. Due to similar phylogeny, genes characterized here in A. thaliana are likely to have additive effects in B. napus. However, further study of candidate genes in B. napus is required to confirm A. thaliana gene functions observed here and in previous studies are conserved. Both ACA8 and MGT7 are good targets for this, especially since ACA8 has previously exhibited Ca-responsiveness in B. rapa (Graham et al., 2014), and since the effects of mutations in A. thaliana MGT7 are so marked. Selection of B. napus genotypes with different alleles of target genes may lead to improved ability to grow in the presence of low soil Ca or Mg concentrations. The development of high Ca and Mg accumulating lines in edible portions of Brassica spp. also has the potential to reduce nutrient deficiencies in humans and livestock across the world.
Author Contributions
MB, IB, PW, TA, and NG conceived the project and contributed to experimental design. TA analyzed associative transcriptomics data and performed and analyzed A. thaliana mutant experiments. LH and ZH prepared functional genotypes and performed associative transcriptomics. TA and NG wrote the manuscript. All authors contributed to and have read and approved the final version of the manuscript.
Funding
This work was supported by the Biotechnology and Biological Sciences Research Council [grant number BB/L002124/1], (BBSRC, United Kingdom), Renewable Industrial Products from Rapeseed (RIPR) Programme to IB, including a studentship to TA. PW was supported by the Rural and Environment Science and Analytical Services Division (RESAS) of the Scottish Government.
Conflict of Interest Statement
The authors declare that the research was conducted in the absence of any commercial or financial relationships that could be construed as a potential conflict of interest.
Acknowledgments
We thank Andrea L. Harper at the University of York for advice on associative transcriptomics techniques and Scott D. Young, Lolita Wilson, and Saul Vazquez Reina at the University of Nottingham for ICP-MS analyses.
Supplementary Material
The Supplementary Material for this article can be found online at: https://www.frontiersin.org/articles/10.3389/fpls.2017.01968/full#supplementary-material
Footnotes
References
Adams, K. L., Cronn, R., Percifield, R., and Wendel, J. F. (2003). Genes duplicated by polyploidy show unequal contributions to the transcriptome and organ-specific reciprocal silencing. Proc. Natl. Acad. Sci. U.S.A. 100, 4649–4654. doi: 10.1073/pnas.0630618100
Alonso, J. M., Stepanova, A. N., Leisse, T. J., Kim, C. J., Chen, H., Shinn, P., et al. (2003). Genome-wide insertional mutagenesis of Arabidopsis thaliana. Science 301, 653–657. doi: 10.1126/science.1086391
Bancroft, I., Morgan, C., Fraser, F., Higgins, J., Wells, R., Clissold, L., et al. (2011). Dissecting the genome of the polyploid crop oilseed rape by transcriptome sequencing. Nat. Biotechnol. 29, 762–766. doi: 10.1038/nbt.1926
Baxter, I., Ouzzani, M., Orcun, S., Kennedy, B., Jandhyla, S. S., and Salt, D. E. (2007). Purdue ionomics information management system. An integrated functional genomics platform. Plant Physiol. 143, 600–611. doi: 10.1104/pp.106.092528
Benjamini, Y., and Hochberg, Y. (1995). Controlling the false discovery rate: a practical and powerful approach to multiple testing. J. R. Stat. Soc. B 57, 289–300.
Bonza, M. C., Morandini, P., Luoni, L., Geisler, M., Palmgren, M. G., and De Michelis, M. I. (2000). At-ACA8 encodes a plasma membrane-localized calcium-ATPase of Arabidopsis with a calmodulin-binding domain at the N terminus. Plant Physiol. 123, 1495–1506. doi: 10.1104/pp.123.4.1495
Broadley, M. R., Bowen, H. C., Cotterill, H. L., Hammond, J. P., Meacham, M. C., Mead, A., et al. (2003). Variation in the shoot calcium content of angiosperms. J. Exp. Bot. 54, 1431–1446. doi: 10.1093/jxb/erg143
Broadley, M. R., Bowen, H. C., Cotterill, H. L., Hammond, J. P., Meacham, M. C., Mead, A., et al. (2004). Phylogenetic variation in the shoot mineral concentration of angiosperms. J. Exp. Bot. 55, 321–336. doi: 10.1093/jxb/erh002
Broadley, M. R., Hammond, J. P., King, G. J., Astley, D., Bowen, H. C., Meacham, M. C., et al. (2008). Shoot calcium (Ca) and magnesium (Mg) concentrations differ between subtaxa, are highly heritable, and associate with potentially pleiotropic loci in Brassica oleracea. Plant Physiol. 146, 1707–1720. doi: 10.1104/pp.107.114645
Broadley, M. R., and White, P. J. (2010). Eats roots and leaves. Can edible horticultural crops address dietary calcium, magnesium and potassium deficiencies? Proc. Nutr. Soc. 69, 601–612. doi: 10.1017/S0029665110001588
Bus, A., Körber, N., Parkin, I. A. P., Samans, B., Snowdon, R. J., Li, J., et al. (2014). Species- and genome-wide dissection of the shoot ionome in Brassica napus and its relationship to seedling development. Front. Plant Sci. 5:485. doi: 10.3389/fpls.2014.00485
Bus, A., Körber, N., Snowdon, R., and Stich, B. (2011). Patterns of molecular variation in a species-wide germplasm set of Brassica napus. Theor. Appl. Genet. 123, 1413–1423. doi: 10.1007/s00122-011-1676-7
Cakmak, I., and Yazici, A. M. (2010). Magnesium: a forgotten element in crop production. Better Crops 94, 23–25.
Catharine, R. A. (2011). Dietary Reference Intakes for Calcium and Vitamin D. Washington, DC: National Academic Press, 35–74.
Chalhoub, B., Denoeud, F., Liu, S., Parkin, I. A. P., Tang, H., Wang, X., et al. (2014). Early allopolyploid evolution in the post-Neolithic Brassica napus oilseed genome. Science 345, 950–953. doi: 10.1126/science.1253435
Conn, S., and Gilliham, M. (2010). Comparative physiology of elemental distributions in plants. Ann. Bot. 105, 1081–1102. doi: 10.1093/aob/mcq027
De Angeli, A., Monachello, D., Ephritikhine, G., Frachisse, J. M., Thomine, S., Gambale, F., et al. (2006). The nitrate/proton antiporter AtCLCa mediates nitrate accumulation in plant vacuoles. Nature 442, 939–942. doi: 10.1038/nature05013
Dunn, O. J. (1961). Multiple comparisons among means. J. Am. Stat. Assoc. 56, 52–64. doi: 10.1080/01621459.1961.10482090
Ecke, W., Clemens, R., Honsdorf, N., and Becker, H. C. (2010). Extent and structure of linkage disequilibrium in canola quality winter rapeseed (Brassica napus L.). Theor. Appl. Genet. 120, 921–931. doi: 10.1007/s00122-009-1221-0
Gebert, M., Meschenmoser, K., Svidová, S., Weghuber, J., Schweyen, R., Eifler, K., et al. (2009). A root-expressed magnesium transporter of the MRS2/MGT gene family in Arabidopsis thaliana allows for growth in low-Mg2+ environments. Plant Cell 12, 4018–4030. doi: 10.1105/tpc.109.070557
Graham, N. S., Hammond, J. P., Lysenko, A., Mayes, S., Ó Lochlainn, S., Blasco, B., et al. (2014). Genetical and comparative genomics of Brassica under altered Ca supply identifies Arabidopsis Ca-transporter orthologs. Plant Cell 26, 2818–2830. doi: 10.1105/tpc.114.128603
Grusak, M. A., Broadley, M. R., and White, P. J. (2016). Plant Macro- and Micronutrient Minerals. Chichester: John Wiley & Sons. doi: 10.1002/9780470015902.a0001306.pub2
Harper, A. L., Trick, M., Higgins, J., Fraser, F., Clissold, L., Wells, R., et al. (2012). Associative transcriptomics of traits in the polyploid crop species Brassica napus. Nat. Biotechnol. 30, 798–802. doi: 10.1038/nbt.2302
Havlickova, L., He, Z., Wang, L., Langer, S., Harper, A. L., Kaur, H., et al. (in press). Validation of an updated Associative Transcriptomics platform for the polyploid crop species Brassica napus by dissection of the genetic architecture of erucic acid and tocopherol isoform variation in seeds. Plant J. doi: 10.1111/tpj.13767
He, Z., Cheng, F., Li, Y., Wang, X., Parkin, I. A., Chalhoub, B., et al. (2015). Construction of Brassica A and C genome-based ordered pan-transcriptomes for use in rapeseed genomic research. Data Brief 4, 357–362. doi: 10.1016/j.dib.2015.06.016
He, Z., Wang, L., Harper, A. L., Havlickova, L., Pradhan, A. K., Parkin, I. A. P., et al. (2016). Extensive homoeologous genome exchanges in allopolyploid crops revealed by mRNAseq-based visualization. Plant Biotechnol. J. 15, 594–604. doi: 10.1111/pbi.12657
Higgins, J., Magusin, A., Trick, M., Fraser, F., and Bancroft, I. (2012). Use of mRNA-seq to discriminate contributions to the transcriptome from the constituent genomes of the polyploid crop species Brassica napus. BMC Genomics 13:247. doi: 10.1186/1471-2164-13-247
Hoagland, D. R., and Arnon, D. I. (1950). The Water-Culture Method for Growing Plants without Soil. Berkeley, CA: University of California.
Huala, E., Dickerman, A., Garcia-Hernandez, M., Weems, D., Reiser, L., LaFond, F., et al. (2001). The Arabidopsis Information Resource (TAIR): a comprehensive database and web-based information retrieval, analysis, and visualization system for a model plant. Nucleic Acids Res. 29, 102–105. doi: 10.1093/nar/29.1.102
Iniguez-Luy, F. L., and Federico, M. L. (2011). “The Genetics of Brassica napus,” in Genetics and Genomics of the Brassicaceae, Plant Genetics and Genomics: Crops and Models, Vol. 9, eds R. Schmidt and I. Bancroft (New York, NY: Springer), 291–322.
Karley, A. J., and White, P. J. (2009). Moving cationic minerals to edible tissues: potassium, magnesium, calcium. Curr. Opin. Plant Biol. 12, 291–298. doi: 10.1016/j.pbi.2009.04.013
Kersey, P. J., Allen, J. E., Armean, I., Boddu, S., Bolt, B. J., Carvalho-Silva, D., et al. (2016). Ensembl genomes 2016: more genomes, more complexity. Nucleic Acids Res. 44, D574–D580. doi: 10.1093/nar/gkv1209
Koprivova, A., Harper, A. L., Trick, M., Bancroft, I., and Kopriva, S. (2014). Dissection of the control of anion homeostasis by associative transcriptomics in Brassica napus. Plant Physiol. 166, 442–450. doi: 10.1104/pp.114.239947
Körber, N., Bus, A., Li, J., Higgins, J., Bancroft, I., Higgins, E. E., et al. (2015). Seedling development traits in Brassica napus examined by gene expression analysis and association mapping. BMC Plant Biol. 15:136. doi: 10.1186/s12870-015-0496-3
Körber, N., Wittkop, B., Bus, A., Friedt, W., Snowdon, R. J., and Stich, B. (2012). Seedling development in a Brassica napus diversity set and its relationship to agronomic performance. Theor. Appl. Genet. 125, 1275–1287. doi: 10.1007/s00122-012-1912-9
Kumssa, D. B., Joy, E. J. M., Ander, E. L., Watts, M. J., Young, S. D., Rosanoff, A., et al. (2015a). Global magnesium supply in the food chain. Crop Pasture Sci. 66, 1278–1289. doi: 10.1071/CP15096
Kumssa, D. B., Joy, E. J. M., Ander, E. L., Watts, M. J., Young, S. D., Walker, S., et al. (2015b). Dietary calcium and zinc deficiency risks are decreasing but remain prevalent. Sci. Rep. 5:10974. doi: 10.1038/srep10974
Lee, H., Suh, S. S., Park, E., Cho, E., Ahn, J. H., Kim, S. G., et al. (2000). The AGAMOUS-LIKE 20 MADS domain protein integrates floral inductive pathways in Arabidopsis. Genes Dev. 14, 2366–2376. doi: 10.1101/gad.813600
Leinonen, R., Sugawara, H., and Shumway, M. (2011). The sequence read archive. Nucleic Acid Res. 39, D19–D21. doi: 10.1093/nar/gkq1019
Lenz, H., Dombinov, V., Dreistein, J., Reinhard, M. R., Gebert, M., and Knoop, V. (2013). Magnesium deficiency phenotypes upon multiple knockout of Arabidopsis thaliana MRS2 clade B genes can be ameliorated by concomitantly reduced calcium supply. Plant Cell Physiol. 54, 1118–1131. doi: 10.1093/pcp/pct062
Li, L., Tutone, A. F., Drummond, R. S. M., Gardner, R. C., and Luan, S. (2001). A novel family of magnesium transport genes in Arabidopsis. Plant Cell 13, 2761–2775. doi: 10.1105/tpc.13.12.2761
Lipka, A. E., Tian, F., Wang, Q., Peiffer, J., Li, M., Bradbury, P. J., et al. (2012). GAPIT: genome association and prediction integrated tool. Bioinformatics 28, 2397–2399. doi: 10.1093/bioinformatics/bts444
Lu, G., Harper, A. L., Trick, M., Morgan, C., Fraser, F., O’Neill, C., et al. (2014). Associative transcriptomics study dissects the genetic architecture of seed glucosinolate content in Brassica napus. DNA Res. 21, 613–625. doi: 10.1093/dnares/dsu024
McAinsh, M. R., and Pittman, J. K. (2009). Shaping the calcium signature. New Phytol. 181, 275–294. doi: 10.1111/j.1469-8137.2008.02682.x
Michaels, S. D., and Amasino, R. M. (1999). FLOWERING LOCUS C encodes a novel MADS domain protein that acts as a repressor of flowering. Plant Cell 11, 949–956. doi: 10.1105/tpc.11.5.949
Parkin, I. A., Koh, C., Tang, H., Robinson, S. J., Kagale, S., Clarke, W. E., et al. (2014). Transcriptome and methylome profiling reveals relics of genome dominance in the mesopolyploid Brassica oleracea. Genome Biol. 15:R77. doi: 10.1186/gb-2014-15-6-r77
Popescu, A. A., Harper, A. L., Trick, M., Bancroft, I., and Huber, K. T. (2014). A novel and fast approach for population structure inference using Kernel-PCA and optimisation (PSIKO). Genetics 198, 1421–1431. doi: 10.1534/genetics.114.171314
R Core Team (2015). R: A Language and Environment for Statistical Computing. Vienna: R Foundation for Statistical Computing.
Rios, J. J., O’Lochlainn, S., Devonshire, J., Graham, N. S., Hammond, J. P., King, G. J., et al. (2012). Distribution of calcium (Ca) and magnesium (Mg) in the leaves of Brassica rapa under varying exogenous Ca and Mg supply. Ann. Bot. 109, 1081–1089. doi: 10.1093/aob/mcs029
Sessions, A., Burke, E., Presting, G., Aux, G., McElver, J., and Patton, D. (2002). A high-throughput Arabidopsis reverse genetics system. Plant Cell 14, 2985–2994. doi: 10.1105/tpc.004630
Sheldon, C. C., Rouse, D. T., Finnegan, E. J., Peacock, W. J., and Dennis, E. S. (2000). The molecular basis of vernalization: the central role of FLOWERING LOCUS C (FLC). Proc. Natl. Acad. Sci. U.S.A. 28, 3753–3758. doi: 10.1073/pnas.97.7.3753
Slatkin, M. (2008). Linkage disequilibrium — understanding the evolutionary past and mapping the medical future. Nat. Rev. Genet. 9, 477–485. doi: 10.1038/nrg2361
Sønderby, I. E., Burow, M., Rowe, H. C., Kliebenstein, D. J., and Halkier, B. A. (2010). A complex interplay of three R2R3 MYB transcription factors determines the profile of aliphatic glucosinolates in Arabidopsis. Plant Physiol. 153, 348–363. doi: 10.1104/pp.109.149286
Thomas, C. L., Alcock, T. D., Graham, N. S., Hayden, R., Matterson, S., Wilson, L., et al. (2016). Root morphology and seed and leaf ionomic traits in a Brassica napus L. diversity panel show wide phenotypic variation and are characteristic of crop habit. BMC Plant Biol. 16:214. doi: 10.1186/s12870-016-0902-5
Trick, M., Long, Y., Meng, J., and Bancroft, I. (2009). Single nucleotide polymorphism (SNP) discovery in the polyploidy Brassica napus using Solexa transcriptome sequencing. Plant Biotechnol. J. 7, 334–346. doi: 10.1111/j.1467-7652.2008.00396.x
Waese, J., and Provart, N. J. (2017). “The bio-analytic resource for plant biology,” in Plant Genomics Databases: Methods and Protocols, ed. A. D. J. van Dijk (New York, NY: Springer), 119–148. doi: 10.1007/978-1-4939-6658-5_6
Wang, X., Wang, H., Wang, J., Sun, R., Wu, J., Liu, S., et al. (2011). The genome of the mesopolyploid crop species Brassica rapa. Nat. Genet. 43, 1035–1039. doi: 10.1038/ng.919
White, P. J. (2001). The pathways of calcium movement to the xylem. J. Exp. Bot. 52, 891–899. doi: 10.1093/jexbot/52.358.891
White, P. J. (2015). “Calcium,” in A Handbook of Plant Nutrition, 2nd Edn, eds A. V. Barker and D. J. Pilbeam (Boca Raton, FL: CRC Press), 165–198.
White, P. J., Bowen, H. C., Farley, E., Shaw, E. K., Thompson, J. A., Wright, G., et al. (2015). Phylogenetic effects on shoot magnesium concentration. Crop & Pasture Science 66, 1241–1248. doi: 10.1071/CP14228
White, P. J., and Broadley, M. R. (2003). Calcium in plants. Ann. Bot. 92, 487–511. doi: 10.1093/aob/mcg164
White, P. J., and Broadley, M. R. (2005). Biofortifying crops with essential mineral elements. Trends Plant Sci. 10, 586–593. doi: 10.1016/j.tplants.2005.10.001
White, P. J., and Broadley, M. R. (2009). Biofortification of crops with seven mineral elements often lacking in human diets – iron, zinc, copper, calcium, magnesium, selenium and iodine. New Phytol. 182, 49–84. doi: 10.1111/j.1469-8137.2008.02738.x
White, P. J., and Brown, P. H. (2010). Plant nutrition for sustainable development and global health. Ann. Bot. 105, 1073–1080. doi: 10.1093/aob/mcq085
Yardley, A. W. (ed.). (2009). Dietary Magnesium: New Research. New York, NY: Nova Science Publishers, Inc.
Zhang, Z., Ersoz, E., Lai, C., Todhunter, R. J., Tiwari, H. K., Gore, M. A., et al. (2010). Mixed linear model approach adapted for genome-wide association studies. Nat. Genet. 42, 355–360. doi: 10.1038/ng.546
Keywords: associative transcriptomics, GWAS, Brassica napus, calcium, magnesium, biofortification, nutrient use efficiency
Citation: Alcock TD, Havlickova L, He Z, Bancroft I, White PJ, Broadley MR and Graham NS (2017) Identification of Candidate Genes for Calcium and Magnesium Accumulation in Brassica napus L. by Association Genetics. Front. Plant Sci. 8:1968. doi: 10.3389/fpls.2017.01968
Received: 22 September 2017; Accepted: 31 October 2017;
Published: 15 November 2017.
Edited by:
Gareth John Norton, University of Aberdeen, United KingdomReviewed by:
Kun Lu, Southwest University, ChinaJuan Jose Rios, Centro de Edafología y Biología Aplicada del Segura (CSIC), Spain
Copyright © 2017 Alcock, Havlickova, He, Bancroft, White, Broadley and Graham. This is an open-access article distributed under the terms of the Creative Commons Attribution License (CC BY). The use, distribution or reproduction in other forums is permitted, provided the original author(s) or licensor are credited and that the original publication in this journal is cited, in accordance with accepted academic practice. No use, distribution or reproduction is permitted which does not comply with these terms.
*Correspondence: Neil S. Graham, neil.graham@nottingham.ac.uk