 Cheng Wang1,2
 Xi-Lin Hou
 Ying Li
- 1State Key Laboratory of Crop Genetics and Germplasm Enhancement, Nanjing Agricultural University, Nanjing, China
- 2Key Laboratory of Biology and Germplasm Enhancement of Horticultural Crops in East China, College of Horticulture, Nanjing Agricultural University, Nanjing, China
Non-heading Chinese cabbage (Brassica rapa ssp. chinensis Makino) is an important vegetable member of Brassica rapa crops. It exhibits a typical sporophytic self-incompatibility (SI) system and is an ideal model plant to explore the mechanism of SI. Gene expression research are frequently used to unravel the complex genetic mechanism and in such studies appropriate reference selection is vital. Validation of reference genes have neither been conducted in Brassica rapa flowers nor in SI trait. In this study, 13 candidate reference genes were selected and examined systematically in 96 non-heading Chinese cabbage flower samples that represent four strategic groups in compatible and self-incompatible lines of non-heading Chinese cabbage. Two RT-qPCR analysis software, geNorm and NormFinder, were used to evaluate the expression stability of these genes systematically. Results revealed that best-ranked references genes should be selected according to specific sample subsets. DNAJ, UKN1, and PP2A were identified as the most stable reference genes among all samples. Moreover, our research further revealed that the widely used reference genes, CYP and ACP, were the least suitable reference genes in most non-heading Chinese cabbage flower sample sets. To further validate the suitability of the reference genes identified in this study, the expression level of SRK and Exo70A1 genes which play important roles in regulating interaction between pollen and stigma were studied. Our study presented the first systematic study of reference gene(s) selection for SI study and provided guidelines to obtain more accurate RT-qPCR results in non-heading Chinese cabbage.
Introduction
Quantification of mRNA transcript levels analysis is increasingly important in furthering our insight into complex metabolic pathways and signaling networks which underlie physiological and developmental processes. Quantitative reverse transcription-PCR (RT-qPCR) has been used as the main analysis technique to quantify mRNA transcript levels as well as validate high-throughput data due to its high sensitivity, accuracy and specificity in various fields of biological research (Bustin, 2002; Artico et al., 2010). However, the accuracy of RT-qPCR is easily affected by various factors, such as the quality of mRNA samples, enzymatic efficiency in cDNA synthesis, the efficiency of amplification and the differences in transcriptional activity between the tissues or cells analyzed (Pfaffl, 2001; Derveaux et al., 2010). To avoid bias in RT-qPCR analysis, reliable internal controls, termed reference genes that are steadily expressed in different experimental condition, are essential for normalization.
Some of the commonly used reference genes in plants, such as beta-tubulin-4 (TUB4), polyubiquitin (UBQ), glyceraldehyde-3-phosphate dehydrogenase (GAPDH), 18S ribosomal RNA (18S rRNA), actin 7 (ACT7), DNAJ-like protein (DNAJ), and alpha tubulin-5 (TUA5), mostly involving in basic cellular processes, such as intermediary metabolism and protein translation and thus, have been widely adopted for gene expression analyses in different plant species (Die et al., 2010; Kozera and Rapacz, 2013; Wei et al., 2013; Xiao et al., 2014; Delporte et al., 2015). In addition, some new reference genes including F-box protein (F-box), acyl carrier proteins (ACP), phosphoenolpyruvate carboxylase-related kinase 1 (PEPKR1), hypothetical proteins of unknown function (UNK1), SAND family protein (SAND), and TAP42-interacting protein of 41 kDa (TIP41), were identified and found to express stably (Libault et al., 2008; Chang et al., 2012; Nakashima et al., 2013). However, no single reference gene can always keep its stability under variable conditions (Kim et al., 2003; Argyropoulos et al., 2006; Fu et al., 2013; Niu et al., 2015). A systematic validation of the expression stability of candidate reference genes in each experimental system should be carried out before using these reference genes for normalization data in gene expression analysis. Meanwhile, several statistical algorithms, such as geNorm (Vandesompele et al., 2002), NormFinder (Andersen et al., 2004) and BestKeeper (Pfaffl et al., 2004), were well developed to facilitate the evaluation of potential reference gene(s) expression stability from a set of candidate genes under different experimental conditions.
Self-incompatibility is a genetic system in flowering plants that prevents self-fertilization and encourages outcrossing to generate genetic diversity (De Nettancourt, 2001; Watanabe et al., 2001; Indriolo et al., 2014). Non-heading Chinese cabbage (Brassica rapa ssp. chinensis Makino), an important leaf vegetable cultivated and consumed in Asia, exhibits a typical sporophytic SI system (Wang et al., 2014a). The sporophytic SI trait widely exists in numerous Brassica crops, including Chinese cabbage, radish, broccoli and rape. It has been used as an important agronomic trait for efficient hybrid seed production of these crops. Viewed from another perspective, the self/non-self discrimination in SI between pollen and stigma is an excellent model system for intercellular communication and signal transduction in higher plants (Watanabe et al., 2012). However, the underlying mechanisms explaining this biological process is still not well understood. Thus, exploring the expression patterns of key genes associated with SI of Brassica crops will not only help us to understand the SI mechanism but also promote molecular breeding in Brassica species to ease the difficulty of year-round seed production. Some studies have been conducted to select appropriate reference genes in Brassica species, such as Brassica napus (Chen et al., 2010), Brassica juncea (Chandna et al., 2012) and Chinese cabbage (Qi et al., 2010; Xiao et al., 2012). However, all above reference gene studies were about development and stress. Nevertheless, little information, if any, is available concerning reference genes for SI study. Hence, potential reference gene should be defined before assessing the expression of target genes in SI plant.
In previous studies of SI, the molecular events associated with floral development, stigma development, various floral tissues, and pollen-stigma interaction were often used to understand SI in Brassicaceae family (Nasrallah et al., 2002; Loraine et al., 2013; Indriolo et al., 2014; Matsuda et al., 2014; Zhang et al., 2015). Furthermore, there were evidences that thousands of genes changed their expression levels during above events. Thus, the genes expressed of flowers under these experimental conditions need an in-depth study. In this study, the expression stability of 13 candidate reference genes (ACT7, EF1α, TUB4, GAPDH, CYP, DNAJ, HIS, TUA5, ACP, UKN1, SKIP16, CAC, and PP2A) was validated by RT-qPCR across a diverse set of flower samples representing different experimental conditions including different flower developmental stages, different stigma developmental stages, various floral tissues, and stigmas after self-pollination in SI and SC lines of non-heading Chinese cabbage. These genes either stably expressed in Brassica species according to previous studies, such as elongation factor-1α (EF1a) (Qi et al., 2010; Xiao et al., 2012), cyclophilin (CYP) (Qi et al., 2010), clathrin adaptor complex (CAC) (Chandna et al., 2012), or have been proved to perform well in flowers of other species, like histone H3 (HIS) (Imai et al., 2014), protein phosphatase 2A (PP2A) (Jin et al., 2013), SKP1/Ask-interacting protein 16 (SKIP16) (Fu et al., 2013). The statistical software geNorm and NormFinder were used to identify the most stable reference genes needed for normalization. Based on the statistical result, expression analysis of two genes of interest related to pollen-stigma recognition, S-locus receptor kinase (SRK) and Exo70A1 during SI response, were presented. Our study is the first analysis about validation of reference genes in flowers of non-heading Chinese cabbage and sets a precedent for future similar study in other species.
Materials and Methods
Plant Material
The self-incompatible line “NHCC 002”and compatible line “NHCC 210” of non-heading Chinese cabbage used in this research were provided by Professor Xilin Hou. The incompatible line is a stable inbred line with a low (<1.0) self-compatibility index (Cao et al., 2002), whereas that of the compatible line is higher than 5.0. Seeds were sowed in October 2014, grown in pots containing a soil: vermiculite (3:1) mixture in a controlled-environment growth chamber programmed for 16/8 h at 25/20°C for day/night, relative humidity of 60–70%. After 30 days, seedlings were transplanted to Jiangpu Horticultural Experimental Station of Nanjing Agricultural University. In March 2015, after removing the already opened flowers and siliques, inflorescences of the main and lateral branch were covered in plastic wrap. The next day, the plants were used for samples collection under normal growth conditions or after pollination treatments. Samples from five plants were treated as a biological replicate and triplicate samples were collected in each analysis. All samples were snap frozen in liquid nitrogen and stored at −80°C until further analysis.
Floral Development Stages (FD)
The criterion of floral development stage can be defined according to the number of days until flower opening (Stein et al., 1996). We describe them as follows. Floral development stage 1 (FD1): Flower buds at 5 days before anthesis. The lengths of the flower buds are approximately 3 mm. Floral development stage 2 (FD2): Flower buds at 3 days before anthesis with lengths of approximately 5 mm. Floral development stage 3 (FD3): Flower buds at 1 day before anthesis. The lengths of the flower buds are 7 mm. Floral development stage 4 (FD4): Freshly opening flowers. Flowers from SI and SC plant were defined as FDI1-4 and FDC1-4, respectively.
Stigma Development Stages (SD)
Stigmas were randomly collected from approximately 150 flower buds or freshly opened flowers corresponding to the four stages mentioned above. Stigmas from SI and SC plant were defined as SDI1-4 and SDC1-4, respectively.
Floral Tissues (FT)
Flower organs were separated from freshly opening flowers with forceps. Five different floral tissues including petals (FT1), sepals (FT2), anther (FT3), stigmas (FT4), and ovary (FT5) were collected. Floral tissues from SI and SC plant were defined as FTI1-5 and FTC1-5, respectively.
Pollinated Stigmas (PS)
Stigmas of freshly opening flowers were pollinated at anthesis with self-pollen and harvested immediately, which was defined as PS1. The other self-pollinated pistils were wrapped for 0.25 and 0.5 h and then were collected as PS2 and PS3. Stigmas from SI and SC plant were defined as PSI1-3 and PSC1-3, respectively. The fresh weight of pistils of each group (PSI1-3and PSC1-3) amounted to about 200 mg
Total RNA Isolation and cDNA Synthesis
Total RNA was extracted by RNA simple Total kit (TaKaRa, Dalian, China), according to the manufacturer's instructions. Then, the RNA was treated with DNase I digestion (TaKaRa, Dalian, China) to eliminate potential DNA contamination. The RNA concentration and purity were determined by Nanodrop ND 1000 spectrophotometer (Nanodrop Technologies, USA). Only RNA samples with A260/A280 ratio between 1.9 and 2.1 and A260/A230 ratio higher than 2.0 were used in the analysis. RNA integrity was further assessed by 1.5% agarose gel electrophoresis. Two microgram of total RNA was reverse transcribed into cDNA with a final volume of 20 μL using a Prime Script RT reagent kit (TaKaRa, Dalian, China), according to the manufacturer's instructions.
Selection of Reference Genes and Primer Design
Thirteen candidate reference genes, including eight protein-coding traditional reference genes (ACT7, EF1α, TUB4, GAPDH, CYP, DNAJ, HIS, and TUA5) and five novel reference genes (ACP, UKN1, SKIP16, CAC, and PP2A), were selected and evaluated for this study from TAIR database (http://www.arabidopsis.org) and previous study (Czechowski et al., 2005). Potential homologs of the 13 reference genes were identified from the genome sequencing data of non-heading Chinese cabbage (unpublished data). These candidate reference genes were cloned and confirmed through sequencing. The primers were designed using Beacon Designer v 7.9 (Premier Biosoft International, Palo Alto, CA, USA) with melting temperatures (TM) of 58–62°C, primer lengths of 18–25 bp and amplicon lengths of 100–250 bp (Table 1).
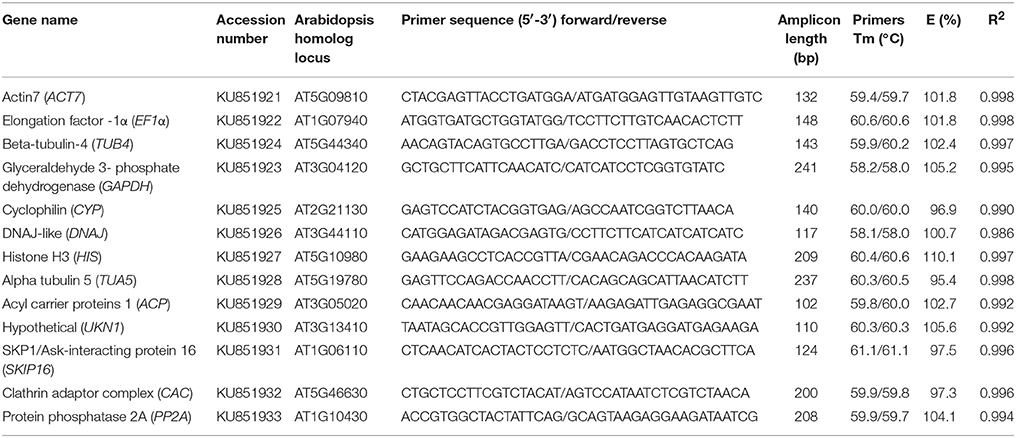
Table 1. Descriptions of candidate reference genes in B. rapa.
Quantitative RT-qPCR Assay
RT-qPCR was performed in 96-well optical plates (Bio-Rad, USA) on the StepOnePlus™ System (Applied Biosystems®, Foster City, CA, USA). The reaction mixture contained 10 μL of 2 × SYBR® Premix Ex Taq™ II (TaKaRa, Dalian, China), 0.8 μL of each primer (10 μM), 0.4 μL of 50 × ROX Reference Dye, 2 μL of diluted cDNA (1:10), and 6 μL of dH2O in a final volume of 20 μL. Amplifications were performed with the following cycling profile: 95°C for 30 s, 40 cycles of 95°C for 5 s and 60°C for 30 s, and a melting curve analysis protocol (60–95°C with temperature increment of 0.2°C every 10 s). No-template controls were also done at the same time.
All RT-qPCR experiments were performed with three biological and three technical replicates. Amplification efficiency (E) and correlation coefficient (R2) were calculated using the SDS software version 2.3 (Applied Biosystems®, Foster City, CA, USA) by standard curve method with tenfold serial dilutions method.
Data Analysis
The expression stability of the 13 reference genes were evaluated by geNorm and NormFinder in 96 samples (three biological replicates and 32 different conditions) under different experimental conditions. Expression levels of the tested reference genes were represented by Cq values, the cycle number at which the amplification curve reach a specific threshold. The raw Cq data (Table S1) were firstly transformed into relative expression levels with efficiency of each primer pairs according to previous research (Ramakers et al., 2003; Xiao et al., 2014). The transformed data were then used for the geNorm and the NormFinder, respectively. Moreover, sometimes reference genes may have different ranking in geNorm and NormFinder, to obtain the most stable reference genes, geometric mean was used to obtain a final result (Štajner et al., 2013; Xiao et al., 2014).
The geNorm is a Visual Basic application software and relies on the principle that the logarithmically transformed expression ratio of two perfect reference genes should be constant in a given sample set. The candidate reference genes were ranked according to the expression stability value M, which is the average pair-wise variation of a particular gene with all other reference genes. The gene with the lower M value is considered to have more stable expression, while that with the higher M value has the less stable expression (Vandesompele et al., 2002). Additionally, the geNorm can also calculates (Vn∕n+1), which is the pairwise variation of two sequential normalization factors NFn and NFn+1, to determine the minimum number of reference genes for accurate normalization with a cut-off value of 0.15 (Vandesompele et al., 2002).
NormFinder program is another Visual Basic application software used to assess the expression stabilities of tested genes according to intra- and inter-group variations and assigned a value for each candidate reference gene as a measure of their stability. The genes with lower values indicate low intra- and inter-group variations and are consider to have greater stability (Andersen et al., 2004).
Validation of Identified Reference Gene
To further validate the present analysis, the relative expression profiles of SRK (in different stigma development stages and different floral tissues of SI line) and Exo70A1 (in different floral tissues of SI and SC lines) were normalized by the most/least stable reference genes according to geNorm and NormFinder analysis. The RT-qPCR experimental procedure were the same as those described above. Data were calculated and analyzed using SDS version 2.3 software with the 2−ΔΔCt method (Livak and Schmittgen, 2001). The raw Cq values were listed in Table S2.
Results
Assessment of Efficiency and Specificity of Reference Genes
PCR amplification specificity for each gene was evaluated by agarose gel electrophoresis, with cDNA and genomic DNA as templates (Figure S1). The results demonstrated that all thirteen primer pairs amplified a specific product with the expected size and no primer dimers were found. The amplification of UKN1 and SKIP16 differed in size between genomic DNA and cDNA templates, as there are introns between the primer pair sequences on the genome DNA (Figure S1). These two genes were then used for assessing RNA quality. Specific amplifications were also confirmed by the melting curve analyses which showed a single and dominant peak for all the primer pairs (Figure S2).
All RNA samples were verified by PCR results of UKN1 and SKIP16 before carrying out RT-qPCR experiments. There was only a specific product with the expected size derived from cDNA template for each sample, which indicated there was no genomic DNA contamination in cDNA templates (data not shown). The RT-qPCR efficiency of the 13 reference genes varied from 95.4% for TUA5 to 110.1% for HIS, and correlation coefficients ranged from 0.986 to 0.998 (Table 1).
Expression Profile of the Reference Genes
Figure 1 provide an overview of the transcript levels of all 13 candidate reference genes. The expression levels of the candidate reference genes were determined as quantification cycle (Cq) values, and the transcripts abundance of these genes varied widely. Mean Cq values of all 32 conditions ranged from 17.38 (EF1α) to 25.62 (CYP) across all samples, while the majority of Cq values were between 17 and 25 (Figure 1). Interestingly, our data showed that CYP had a relatively low expression (high Cq values) in all SI samples than SC samples and ACP had a low expression 0 and 1 day before flowering than 3 and 5 days before flowering in both flowers (flower buds) and stigmas (Figure 2), so these two genes showed the most variation in expression levels (Figure 2). In addition, CYP and ACP showed relatively low expression levels with high Cq values, whereas, ACT7, EF1α, TUB4, GAPDH, and TUA5 showed high expression. Most candidate genes have close mean values and median values, especially for DNAJ, UKN1, and SKIP16, indicating evenly distributed Cq values (Figure 2).
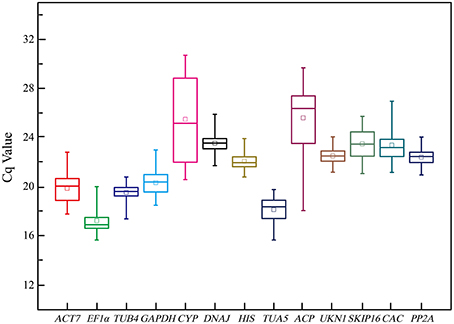
Figure 1. Cq values of 13 candidate reference genes tested in all 96 samples of non-heading Chinese cabbage. The line across the box depicts median. The inside box depicts mean. The outside box is determined by the 25th and 75th percentiles. The whiskers indicate the maximum and minimum values.
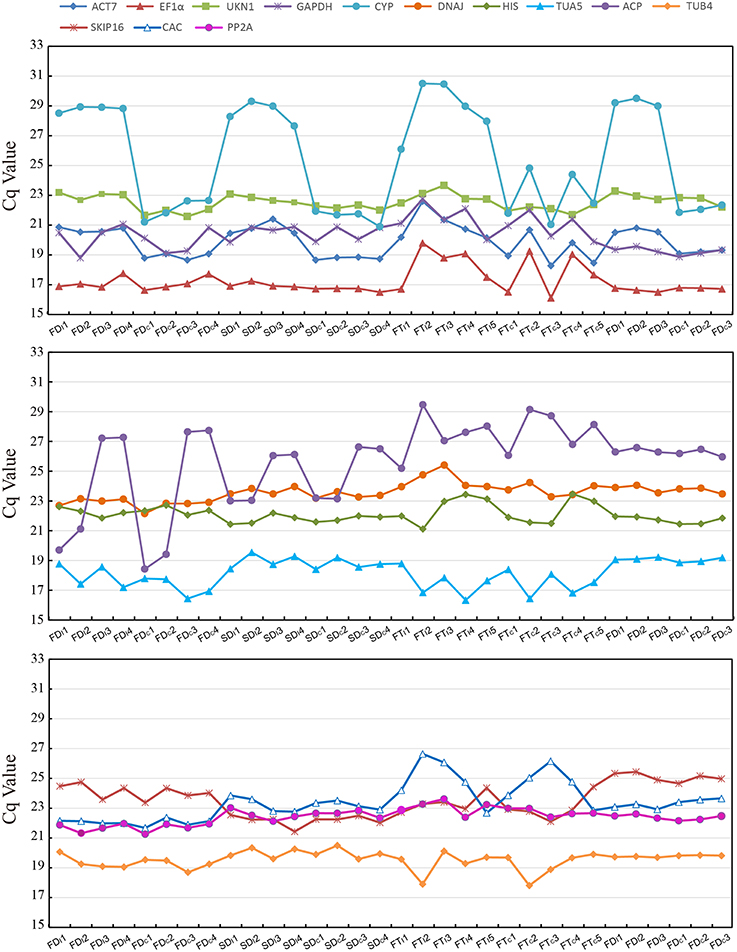
Figure 2. The mean Cq values of 13 candidate reference tested in all 32 conditions.
Expression Stability of Candidate Reference Genes in Two lines
After simple comparison of the Cq values of the potential reference genes, the stability of these genes was further assessed using geNorm and NormFinder. All 96 samples were divided into five groups: different flower developmental stages, different stigma developmental stages, various floral tissues, stigmas after self-pollination and total (data from all 96 samples), and the condition-specific reference genes were identified for each group.
As shown in Table 2, all reference genes were ranked based on their expression stability. For all 96 samples tested, DNAJ, UKN1, and PP2A were the three most stabe reference genes in both geNorm and NormFinder analysis. In different flower developmental stages, the most stable reference genes identified by geNorm differ from that defined by NormFinder, DNAJ was the most stable by a comprehensive comparison. In different stigma developmental stages, EF1α, DNAJ, and TUA5 were ranks as the top three reference genes among the 13 candidate genes. DNAJ and UKN1 were the two most stable genes among the 13 candidate genes in different floral tissues. In stigmas after self-pollination, GAPDH and HIS were the two most stable genes even though other 11 candidate genes also expressed stably. CYP was proved to be the least stable genes in all five condition-specific groups, as this genes had a relatively low expression in SI samples (average Ct value was 28.8) than SC samples (average Ct value was 22.2).
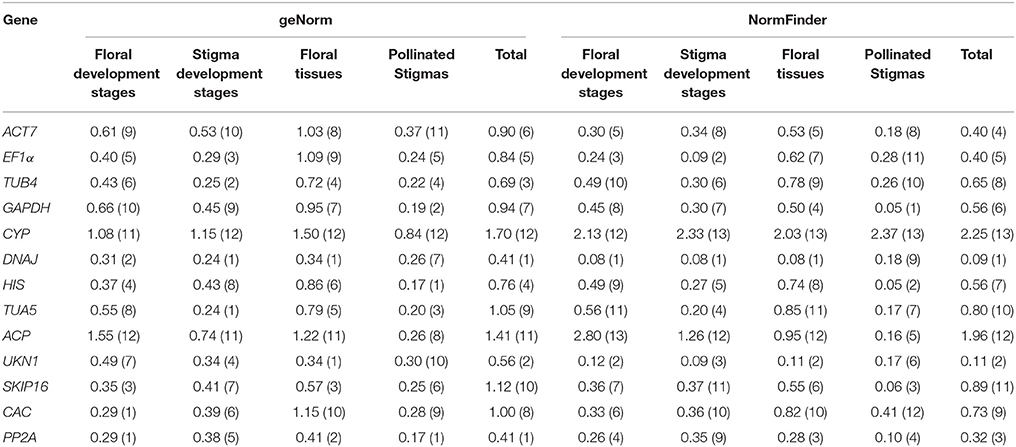
Table 2. Gene expression stability under individual sample sets in two lines calculated by geNorm and NormFinder.
Expression Stability of Candidate Reference Genes in Single Line
Some studies may only evaluate the expression of reference genes in a single line, meanwhile, to investigate the effect of different lines to the ranks of reference genes, we decided to perform stability analysis using the geNorm and NormFinder software programs using only the SI line or SC line as input. Accordingly, a total of 10 evaluation patterns were generated for both single experimental condition and total (all 48 SI samples or all 48 SC samples). As a result, DNAJ, UKN1, and PP2A were also the three most stable genes in all SI samples or all SC samples for both geNorm and NormFinder analysis, which was the same as above analysis in all 96 samples (Table 3). For stigmas after self-pollination in SI line or SC line, all reference genes had low M values in geNorm analysis and low stability values in NormFinder analysis, which indicated they were all expressed stably in both groups. For the other six groups in single inbred line, the best ranks of the reference genes were changed considerably comparing with the above analysis in two inbred lines. In SI plant, the two most stable reference genes for all of the experimental conditions determined were almost the same between geNorm and NormFinder analysis. In different flower developmental stages, ACT7 and PP2A were the two most stable reference genes. In different stigma developmental stages, ACT7 and EF1α were the two most stable reference genes. DNAJ and UKN1 were the two most stable reference genes in different floral tissues. In SC plant, DNAJ and PP2A performed well in different floral tissues by analysis with both software. For the other two groups, it was difficult to identify the most stable reference gene, so the geometric mean was used to obtain a final result (Štajner et al., 2013; Xiao et al., 2014). Finally, UKN1 and PP2A were selected as the two most stable reference genes in different flower developmental stages. In stigma at different developmental stages, ACT7 and SKIP16 were selected as the most stable genes.
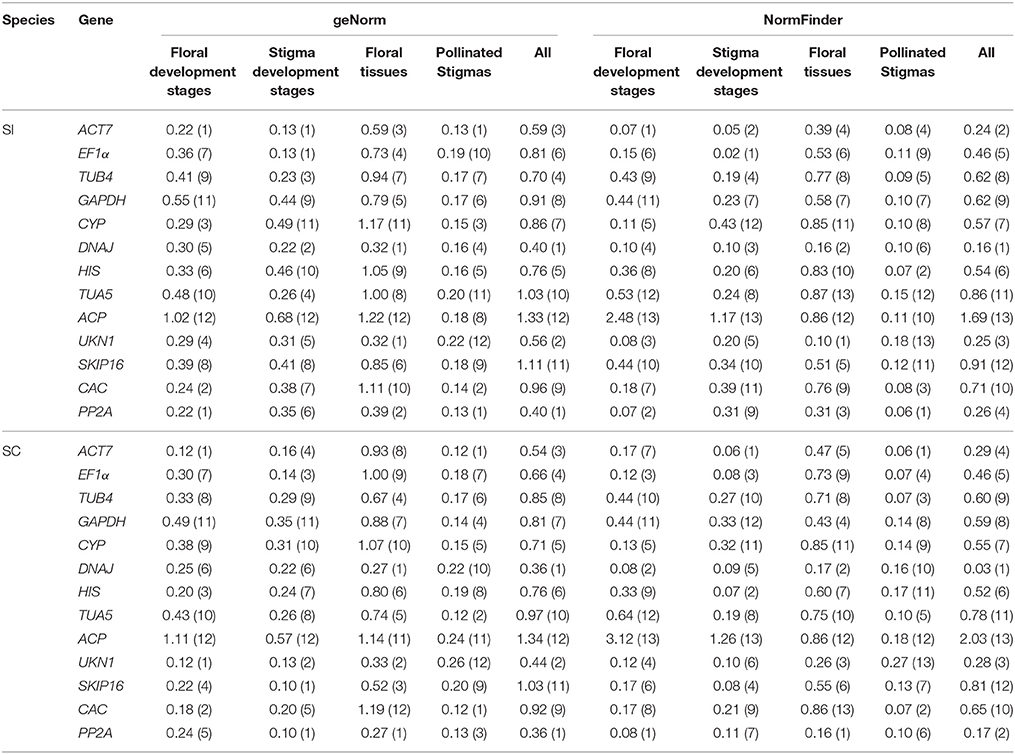
Table 3. Gene expression stability under individual sample sets in single line calculated by geNorm and NormFinder.
Minimum Number of Reference Genes for Optimal Normalization
The pairwise variation Vn/Vn+1 (n ≥ 2) of geNorm software, which views the effect of increasing number of genes on the normalization factor (Pfaffl et al., 2004), was used to determine the minimal number of reference genes required for accurate normalization in all 15 sample sets. Results showed that only two sample sets, the 96 samples group and the 48 SC line samples group, had a V2∕3 value higher than 0.15 (Figure 3). Thus, four and three reference genes were needed for gene expression normalization in the 96 samples and the 48 SC line samples, respectively. For other 13 conditions, two reference genes are sufficient for normalizing gene expression.
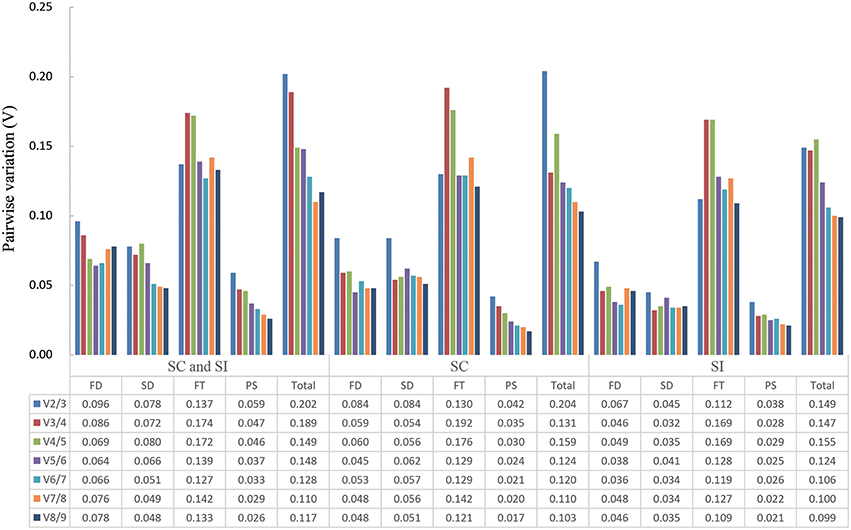
Figure 3. Determination of the optimal number of reference genes required for effective normalization. Pairwise variation (Vn/n + 1) analysis of 13 candidate reference genes in 15 sample sets. FD, different floral development stages; SD, different stigma development stages; FT, different floral tissues; PS, pollinated stigmas; Total, all samples.
Reference Gene Validation
To validate the reference genes confirmed above, the relative expression profiles of SRK, which is expressed specifically in stigma (Stein et al., 1996) and Exo70A1, which was reported to be without significant difference in expressions level between compatible and incompatible floral tissues (Wang et al., 2014b) were measured and normalized with three sets of reference genes according to the rankings of reference genes mentioned above. Briefly, the most stable reference genes (ACT7 and EF1α for stigma samples of SI at different developmental stages, DNAJ and UKN1 for different floral tissues of SI samples and SC-SI mixed samples) either alone or combination, and the least stable reference gene (ACP for stigma samples of SI at different developmental stages, CYP for different floral tissues of SI samples and SC-SI mixed samples), were used as reference genes for RT-qPCR analysis.
As shown in Figure 4, SRK transcripts increased during stigma maturation and reached a maximum at 1 day before flowering in SI plant, showed similar change patterns with slight difference when using ACT7 alone and the combination of ACT7 + EF1α as reference gene(s) for normalization (Figure 4A). SRK expressed mainly in stigma, rather than in anther, ovary, petal and sepal, with the normalization of DNAJ alone and the combination of DNAJ + UKN1 (Figure 4B). However, the expression patterns were completely obscured during normalization using the least stable reference gene ACP in stigma or CYP in different floral tissues.
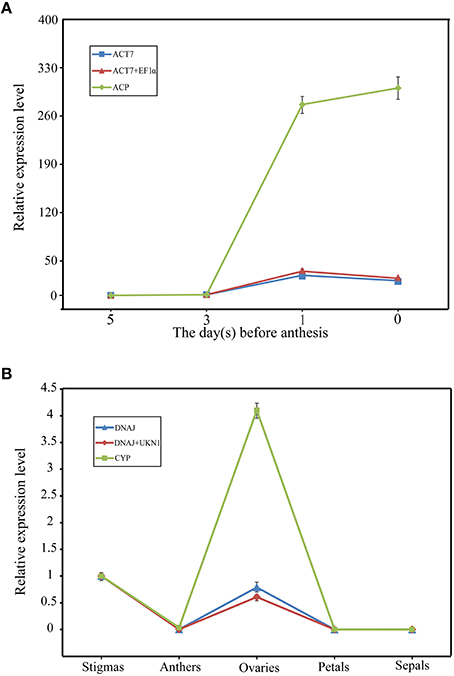
Figure 4. Relative quantification of SRK gene expression using validated reference genes for normalization under different experimental conditions. (A) The validated reference gene(s) used as normalization factors were one (ACT7) or two (ACT7 + EF1α) most stable reference genes, and the most unstable one (ACP) in different stigma development stages sample sets of SI plant. (B) The validated reference gene(s) used as normalization factors were one (DNAJ) or two (DNAJ +UKN1) most stable reference gene(s), and the most unstable one (CYP) in different floral tissues sample sets of SI plant. Vertical bars indicate the standard deviations (SD).
To further explore the stability of these reference genes, the expression levels of Exo70A1 was also investigated in different floral tissues of SI and SC lines. Exo70A1 is a component of the exocyst complex that is known to regulate polarized secretion (Samuel et al., 2009). Mutations of Exo70A1 led to aberrant development, producing dwarfed and nearly sterile (Li et al., 2013). As shown in Figure 5, when using DNAJ alone and the combination of DNAJ + UKN1for normalization, Exo70A1 expressed in all floral tissues of SI and SC lines(Figures 5A,B); however, when the least stable gene CYP was used for normalization, the expression patterns was absolutely different. Exo70A1 had high expression level in SI line and almost had no expression in SC line (Figure 5C).
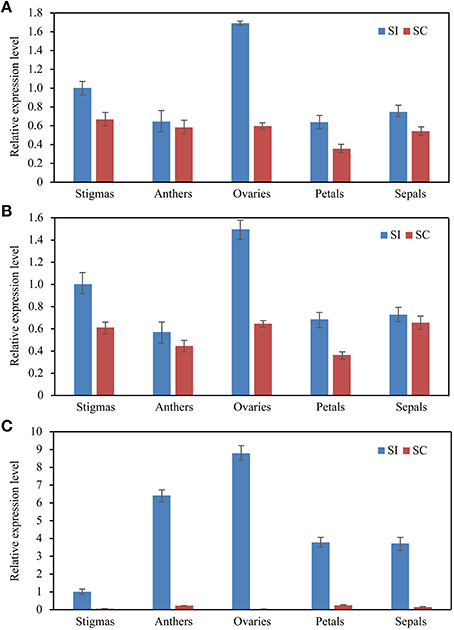
Figure 5. The expression level of the Exo70A1 in floral tissue sample sets. DNAJ (A) or DNAJ + UKN1 (B) were used for normalization as one or two most stable reference genes, CYP (C) was used as worst stable reference gene.
Discussion
Non-heading Chinese cabbage is an ideal model plant for self-incompatibility research and is also an important Brassica crop. Analysis of the expression of genes involved in the signaling systems regulating compatible and self-incompatible responses would aid our understanding of the molecular mechanism of SI in Brassica. Due to the high throughput, sensitivity and accuracy, RT-qPCR has become a powerful approach for quantification studies at transcript levels (Artico et al., 2010). The expression stability of reference genes is an elementary prerequisite for reliable RT-qPCR analysis. However, no single reference gene can be universal under all experimental situations, even the most stable reference gene(s) reported in a species may react badly in other species or in a different experiment (Kim et al., 2003; Argyropoulos et al., 2006; Fu et al., 2013; Niu et al., 2015). Therefore, it is required to perform normalization studies with multiple candidate genes under particular experimental conditions prior to applying them to normalization, instead of using reference genes published previously. In this study, we performed a systematic evaluation of 13 reference genes in four strategic groups in compatible and self-incompatible lines of non-heading Chinese cabbage, and ranked them according to their stability calculated by geNorm and NormFinder. The present study was the first attempt to validate the reference genes direct at SI in Brassica.
Previous study has suggested that amplification-specificity of primers should be validated with direct experimental evidence (agarose gel electrophoresis, melting profile, sequencing etc.; Bustin et al., 2009; Chen et al., 2011). In the present work, all 13 genes were cloned from non-heading Chinese cabbage and confirmed through sequencing. Primer pairs were designed for the 13 candidate reference genes, and their specificity was confirmed by agarose gel electrophoresis (Figure S1), melting curves analysis (Figure S2), and sequencing of the amplicons. Subsequently, the PCR amplification efficiency was calculated according to corresponding standard curves, which ranged from 95.4 to 110.1%. Other factors that may affect the reliability of the data were also carefully controlled during our experiments, such as DNAse I treatment, RNA quality control, biological replicates and correction raw results. Our results confirmed that all materials used in this study were appropriate for qPCR-based quantification.
Our analysis based on geNorm and NormFinder algorithms showed DNAJ, UKN1, and PP2A were overall the most stable candidates for the normalization of target gene expression across total 96 samples. But different sample sets had their own most stable reference genes (Tables 2, 3). As show in the Table 2, EF1α, DNAJ, and TUA5 were the most stable genes in stigma at different development stages, whereas GAPDH and HIS ranked higher than EF1α, DNAJ, and TUA5 when studying stigmas samples after self-pollination. DNAJ, UKN1, and PP2A appeared to be the most stable reference genes in different floral tissues samples, while UKN1 and PP2A ranked lower in stigma samples at different developmental stages. For the most stable reference genes in single inbred line, all 10 samples sets had their own most stable reference genes (Table 3). As a whole, our results indicated that different experimental condition tested demands different reference genes, emphasized the importance of reference genes identification before RT-qPCR analysis. Earlier studies also reported similar results in other species, including peanut (Chi et al., 2012), lettuce (Borowski et al., 2014), and watermelon (Kong et al., 2014). More importantly, our result showed that the choice of reference genes for normalization should be line-specific. Even the samples belong to same type and is from same species (but belong to different lines), they may have different set of reference genes when they were analyzed alone or together. For instance, for samples from stigma at different developmental stages, ACT7 and EF1α were the most stable reference genes in SI plant, SKIP16 was the most stable gene in SC plant, whereas EF1α, DNAJ, and TUA5 were the most stable reference genes when analyzed together. This result suggested that different experimental condition tested demands different set of reference genes, even when samples come from very closely related lines.
In the study of different flower developmental stages, ACT7 and PP2A were the two best reference genes in SI plant, while UKN1 and PP2A were selected as the two best reference genes in SC plant. Similar studies were also conducted in other species, such as Chinese cabbage (Xu et al., 2014), Petunia hybrid (Mallona et al., 2010), Chrysanthemum lavandulifolium (Fu et al., 2013) and a combination analysis of Chrysanthemum lavandulifolium and Chrysanthemum morifolium (Qi et al., 2016). In Chinese cabbage, one of the most stable reference gene was determined as GAPDH (Xu et al., 2014), which was one of the least stable reference genes in both SI and SC line in our study. In P. hybrid (Mallona et al., 2010), EF1a and CYP were determined as the most stable reference genes in two different lines, respectively. While this two genes didn't perform well in both SI and SC lines in our study. SKIP16 were selected as one of the most stable reference gene in C. lavandulifolium (Fu et al., 2013), but this gene ranked very low in our study. For the combination analysis of C. lavandulifolium and C. morifolium, PP2A was determined as the least stable reference gene in most of their condition (Qi et al., 2016), but this gene was the most stable gene in both SC and SI lines in our study. These results highlight the fact that there is not a “common” reference gene which could be used in all similar studies. Reference gene should selected according to different experimental condition, rather than using them published elsewhere.
ACP and CYP are two commonly accepted reference genes for gene expression analysis in many plant species (Mallona et al., 2010; Chandna et al., 2012), due to the fact that they were used for many years in RT-qPCR assays. However, recently study have demonstrated that these two gene are not always stable under different experimental conditions (Chen et al., 2011; Chandna et al., 2012; Chi et al., 2012; Wei et al., 2013). For example, Wei et al. demonstrated that CYP appeared to be the worst gene to use as reference gene during the ABA treatments. This could be explained partly by the fact that reference genes are implicated in multiple cell metabolism. In this study, for all combined analysis of SI and SC sample sets, CYP ranked as the least stable gene for all sample set, which due to it had a significantly expressive discrepancy between SI samples and SC samples (Figure 2). Our validation experiment showed that the use of CYP as reference gene in different floral tissues of SI and SC plant leaded to misinterpretation of the Exo70A1 expression level (Figures 5A–C). For ACP, it was found as the most unstable reference genes when was compared in flower and stigma at different developmental stages in SI plant, as ACP had a lower expression at 0 and 1 days before anthesis than 3 and 5 days before anthesis in both flowers (flower buds) and stigmas (Figure 2). The using of ACP for normalization also led to misinterpretation of the SRK expression level. Based on above information, we will not suggest these two genes. Especially, we should pay special attention to genes like CYP, which showed significant differential expression between SI and SC plant. The use of such reference genes in closely related lines without prior verification of their expression stability would lead to inaccurate data interpretation and thus generate incorrect results (Figures 5A–C). On the other hand, our results further confirmed the importance of reference genes evaluation prior to experimental applications, and no single reference gene was observed with constant expression in all the tested conditions.
Some studies that exploited both geNorm and NormFinder have showed minor differences in gene ranking and in the evaluation of the most stable ones (Cruz et al., 2009; Boava et al., 2010; Lee et al., 2010), while others have reported distinct discrepancies (Paolacci et al., 2009; Li et al., 2011). In the present work, although the ranking orders of gene stability generated by geNorm and NormFinder were not exactly the same, but the least stable genes recommended by the two methods were the same in all the samples set. In addition, only few differences were observed if the gene sets only considered the most stable ones. For instance, ACT7, PP2A, UKN1, and DNAJ were the most stably expressed genes in different floral development stages in SI plant when calculated using NormFinder, whereas in geNorm analysis, also ACT7, PP2A, and UKN1 were identified as the three most stable genes, but DNAJ was been gave different output for ranking five. The discrepancies between these two methods were expected because they are established on distinct statistical approach. geNorm selects two genes displaying a low intra-group variation and approximately the same non-vanishing inter-group variation (Pfaffl et al., 2004), whereas NormFinder selects the two most stable genes through using intra- and inter-group variations for normalization factor calculations (Andersen et al., 2004).
In summary, the current study evaluated the expression stability of 13 candidate genes across 96 given samples through two commonly used applications. Our results suggested that appropriate reference genes for normalization should be identified according to special experimental conditions. The expression analysis of SRK and Exo70A1 emphasized the importance of selecting proper reference genes for RT-qPCR analysis. Our study is the first attempt to validate the reference genes direct at self-incompatibility in Brassica for the normalization of gene expression analysis. Nevertheless, it provides a preliminary exploration on validation of reference genes for SI study and lays the foundation for the similar study in other species.
Author Contributions
CW, YL conceived and designed the experiments; CW, HC, and TH performed the experiments and collected the data; YL, XH obtained funding and XH contributed reagents/materials/analysis tools; CW, TL analyzed the data; CW wrote the paper; CW, YL revised the paper.
Conflict of Interest Statement
The authors declare that the research was conducted in the absence of any commercial or financial relationships that could be construed as a potential conflict of interest.
Acknowledgments
We thank professor Daphne R. Goring (Department of Cell & Systems Biology, University of Toronto, Toronto, Canada) for her good suggestions and revising. This work is supported by the Specialized Research Fund for the Doctoral Program of Higher Education (SRFDP, BO201300666), National Basic Research Program of China (973 Program, 2012CB113903), the National Natural Science Foundation of China (31471886) and the Jiangsu Province Natural Science Foundation (BK20130673).
Supplementary Material
The Supplementary Material for this article can be found online at: http://journal.frontiersin.org/article/10.3389/fpls.2016.00811
Figure S1. Amplification results of candidate genes with cDNA and genomic DNA of non-heading Chinese cabbage, respectively. Lane 1 ACT7, 2 EF1α, 3TUB4, 4 GAPDH, 5 CYP, 6 DNAJ, 7 HIS, 8 TUA5, 9 ACP, 10 UKN1, 11 SKIP16, 12 CAC, 13 PP2A. (A) The amplification results of 13 candidate genes with cDNA as templates. (B) The amplification results of 13 candidate genes with genomic DNA as templates. M: DL 2000 Plus DNA Marker (from up to low, 2000 bp, 1500 bp, 1000 bp, 750 bp, 500 bp, 250 bp, 100 bp).
Figure S2. Melting curve analysis of 13 reference genes with the single peak.
Table S1. Raw Cq values in non-heading Chinese cabbage. FD, different floral development stages; SD, different stigma development stages; FT, different floral tissues; PS, pollinated stigmas.
Table S2. Raw Cq values of SRK, Exo70A1 and reference genes under different conditions, as determined by RT-qPCR. SD, different stigma development stages; FT, different floral tissues.
References
Andersen, C. L., Jensen, J. L., and Ørntoft, T. F. (2004). Normalization of real-time quantitative reverse transcription-PCR data: a model-based variance estimation approach to identify genes suited for normalization, applied to bladder and colon cancer data sets. Cancer Res. 64, 5245–5250. doi: 10.1158/0008-5472.CAN-04-0496
Argyropoulos, D., Psallida, C., and Spyropoulos, C. G. (2006). Generic normalization method for real-time PCR. FEBS J. 273, 770–777. doi: 10.1111/j.1742-4658.2006.05109.x
Artico, S., Nardeli, S. M., Brilhante, O., Grossi-de-Sa, M. F., and Alves-Ferreira, M. (2010). Identification and evaluation of new reference genes in Gossypium hirsutum for accurate normalization of real-time quantitative RT-PCR data. BMC Plant Biol. 10:49. doi: 10.1186/1471-2229-10-49
Boava, L. P., Laia, M. L., Jacob, T. R., Dabbas, K. M., Gonçalves, J. F., Ferro, J. A., et al. (2010). Selection of endogenous genes for gene expression studies in Eucalyptus under biotic (Puccinia psidii) and abiotic (acibenzolar-S-methyl) stresses using RT-qPCR. BMC Res. Notes 3:43. doi: 10.1186/1756-0500-3-43
Borowski, J. M., Galli, V., da Silva Messias, R., Perin, E. C., Buss, J. H., dos Anjos e Silva, S. D., et al. (2014). Selection of candidate reference genes for real-time PCR studies in lettuce under abiotic stresses. Planta 239, 1187–1200. doi: 10.1007/s00425-014-2041-2
Bustin, S. (2002). Quantification of mRNA using real-time reverse transcription PCR (RT-PCR): trends and problems. J. Mol. Endocrinol. 29, 23–39. doi: 10.1677/jme.0.0290023
Bustin, S. A., Benes, V., Garson, J. A., Hellemans, J., Huggett, J., Kubista, M., et al. (2009). The MIQE guidelines: minimum information for publication of quantitative real-time PCR experiments. Clin. Chem. 55, 611–622. doi: 10.1373/clinchem.2008.112797
Cao, S., Hou, X., and Hao, X. M. (2002). Studies on breeding and seed reproduction technique of Aijiaohuang self-incompatible line in non-heading Chinese cabbage. J. Nanjing Agric. Univ. 25, 111–113. doi: 10.7685/j.issn.1000-2030.2002.01.027
Chandna, R., Augustine, R., and Bisht, N. C. (2012). Evaluation of candidate reference genes for gene expression normalization in Brassica juncea using real time quantitative RT-PCR. PLoS ONE 7:e36918. doi: 10.1371/journal.pone.0036918
Chang, E., Shi, S., Liu, J., Cheng, T., Xue, L., Yang, X., et al. (2012). Selection of reference genes for quantitative gene expression studies in Platycladus orientalis (Cupressaceae) using real-time PCR. PLoS ONE 7:e33278. doi: 10.1371/journal.pone.0033278
Chen, L., Zhong, H. Y., Kuang, J. F., Li, J. G., Lu, W. J., and Chen, J. Y. (2011). Validation of reference genes for RT-qPCR studies of gene expression in banana fruit under different experimental conditions. Planta 234, 377–390. doi: 10.1007/s00425-011-1410-3
Chen, X., Truksa, M., Shah, S., and Weselake, R. J. (2010). A survey of quantitative real-time polymerase chain reaction internal reference genes for expression studies in Brassica napus. Anal. Biochem. 405, 138–140. doi: 10.1016/j.ab.2010.05.032
Chi, X., Hu, R., Yang, Q., Zhang, X., Pan, L., Chen, N., et al. (2012). Validation of reference genes for gene expression studies in peanut by quantitative real-time RT-PCR. Mol. Genet. Genomics 287, 167–176. doi: 10.1007/s00438-011-0665-5
Cruz, F., Kalaoun, S., Nobile, P., Colombo, C., Almeida, J., Barros, L. M., et al. (2009). Evaluation of coffee reference genes for relative expression studies by quantitative real-time RT-PCR. Mol. Breed. 23, 607–616. doi: 10.1007/s11032-009-9259-x
Czechowski, T., Stitt, M., Altmann, T., Udvardi, M. K., and Scheible, W. R. (2005). Genome-wide identification and testing of superior reference genes for transcript normalization in Arabidopsis. Plant Physiol. 139, 5–17. doi: 10.1104/pp.105.063743
De Nettancourt, D. (2001). Incompatibility and Incongruity in Wild and Cultivated Plants. Berlin; Heidelberg; New York, NY: Springer.
Delporte, M., Legrand, G., Hilbert, J. L., and Gagneul, D. (2015). Selection and validation of reference genes for quantitative real-time PCR analysis of gene expression in Cichorium intybus. Front. Plant Sci. 6:651. doi: 10.3389/fpls.2015.00651
Derveaux, S., Vandesompele, J., and Hellemans, J. (2010). How to do successful gene expression analysis using real-time PCR. Methods 50, 227–230. doi: 10.1016/j.ymeth.2009.11.001
Die, J. V., Román, B., Nadal, S., and González-Verdejo, C. I. (2010). Evaluation of candidate reference genes for expression studies in Pisum sativum under different experimental conditions. Planta 232, 145–153. doi: 10.1007/s00425-010-1158-1
Fu, J., Wang, Y., Huang, H., Zhang, C., and Dai, S. (2013). Reference gene selection for RT-qPCR analysis of Chrysanthemum lavandulifolium during its flowering stages. Mol. Breed. 31, 205–215. doi: 10.1007/s11032-012-9784-x
Imai, T., Ubi, B. E., Saito, T., and Moriguchi, T. (2014). Evaluation of reference genes for accurate normalization of gene expression for real time-quantitative PCR in Pyrus pyrifolia using different tissue samples and seasonal conditions. PLoS ONE 9:e86492. doi: 10.1371/journal.pone.0086492
Indriolo, E., Safavian, D., and Goring, D. R. (2014). The ARC1 E3 ligase promotes two different self-pollen avoidance traits in Arabidopsis. Plant Cell. 26, 1525–1543. doi: 10.1105/tpc.114.122879
Jin, X., Fu, J., Dai, S., Sun, Y., and Hong, Y. (2013). Reference gene selection for qPCR analysis in cineraria developing flowers. Sci. Horticult. 153, 64–70. doi: 10.1016/j.scienta.2013.01.023
Kim, B. R., Nam, H. Y., Kim, S. U., Kim, S. I., and Chang, Y. J. (2003). Normalization of reverse transcription quantitative-PCR with housekeeping genes in rice. Biotechnol. Lett. 25, 1869–1872. doi: 10.1023/A:1026298032009
Kong, Q., Yuan, J., Gao, L., Zhao, S., Jiang, W., Huang, Y., et al. (2014). Identification of suitable reference genes for gene expression normalization in qRT-PCR analysis in watermelon. PLoS ONE 9:e90612. doi: 10.1371/journal.pone.0090612
Kozera, B., and Rapacz, M. (2013). Reference genes in real-time PCR. J. Appl. Genet. 54, 391–406. doi: 10.1007/s13353-013-0173-x
Lee, J. M., Roche, J. R., Donaghy, D. J., Thrush, A., and Sathish, P. (2010). Validation of reference genes for quantitative RT-PCR studies of gene expression in perennial ryegrass (Lolium perenne L.). BMC Mol. Biol. 11:8. doi: 10.1186/1471-2199-11-8
Li, H., Qin, Y., Xiao, X., and Tang, C. (2011). Screening of valid reference genes for real-time RT-PCR data normalization in Hevea brasiliensis and expression validation of a sucrose transporter gene HbSUT3. Plant Sci. 181, 132–139. doi: 10.1016/j.plantsci.2011.04.014
Li, S., Chen, M., Yu, D., Ren, S., Sun, S., Liu, L., et al. (2013). EXO70A1-mediated vesicle trafficking is critical for tracheary element development in Arabidopsis. Plant Cell. 25, 1774–1786. doi: 10.1105/tpc.113.112144
Libault, M., Thibivilliers, S., Bilgin, D., Radwan, O., Benitez, M., Clough, S., et al. (2008). Identification of four soybean reference genes for gene expression normalization. Plant Genome 1, 44–54. doi: 10.3835/plantgenome2008.02.0091
Livak, K. J., and Schmittgen, T. D. (2001). Analysis of relative gene expression data using real-time quantitative PCR and the 2−ΔΔCT method. Methods 25, 402–408. doi: 10.1006/meth.2001.1262
Loraine, A. E., McCormick, S., Estrada, A., Patel, K., and Qin, P. (2013). RNA-seq of Arabidopsis pollen uncovers novel transcription and alternative splicing. Plant Physiol. 162, 1092–1109. doi: 10.1104/pp.112.211441
Mallona, I., Lischewski, S., Weiss, J., Hause, B., and Egea-Cortines, M. (2010). Validation of reference genes for quantitative real-time PCR during leaf and flower development in Petunia hybrida. BMC Plant Biol. 10:4. doi: 10.1186/1471-2229-10-4
Matsuda, T., Matsushima, M., Nabemoto, M., Osaka, M., Sakazono, S., Masuko-Suzuki, H., et al. (2014). Transcriptional characteristics and differences in Arabidopsis stigmatic papilla cells pre-and post-pollination. Plant Cell Physiol. 56, 663–673. doi: 10.1093/pcp/pcu209
Nakashima, A., Tanimura-Ito, K., Oshiro, N., Eguchi, S., Miyamoto, T., Momonami, A., et al. (2013). A positive role of mammalian Tip41-like protein, TIPRL, in the amino-acid dependent mTORC1-signaling pathway through interaction with PP2A. FEBS Lett. 587, 2924–2929. doi: 10.1016/j.febslet.2013.07.027
Nasrallah, M. E., Liu, P., and Nasrallah, J. B. (2002). Generation of self-incompatible Arabidopsis thaliana by transfer of two S locus genes from A. lyrata. Science 297, 247–249. doi: 10.1126/science.1072205
Niu, X., Qi, J., Zhang, G., Xu, J., Tao, A., Fang, P., et al. (2015). Selection of reliable reference genes for quantitative real-time PCR gene expression analysis in Jute (Corchorus capsularis) under stress treatments. Front. Plant Sci. 6:848. doi: 10.3389/fpls.2015.00848
Paolacci, A. R., Tanzarella, O. A., Porceddu, E., and Ciaffi, M. (2009). Identification and validation of reference genes for quantitative RT-PCR normalization in wheat. BMC Mol Biol. 10:11. doi: 10.1186/1471-2199-10-11
Pfaffl, M. W. (2001). A new mathematical model for relative quantification in real-time RT–PCR. Nucleic Acids Res. 29, e45. doi: 10.1093/nar/29.9.e45
Pfaffl, M. W., Tichopad, A., Prgomet, C., and Neuvians, T. P. (2004). Determination of stable housekeeping genes, differentially regulated target genes and sample integrity: BestKeeper–Excel-based tool using pair-wise correlations. Biotechnol. Lett. 26, 509–515. doi: 10.1023/B:BILE.0000019559.84305.47
Qi, J., Yu, S., Zhang, F., Shen, X., Zhao, X., Yu, Y., et al. (2010). Reference gene selection for real-time quantitative polymerase chain reaction of mRNA transcript levels in Chinese cabbage (Brassica rapa L. ssp. pekinensis). Plant Mol. Biol. Rep. 28, 597–604. doi: 10.1007/s11105-010-0185-1
Qi, S., Yang, L., Wen, X., Hong, Y., Song, X., Zhang, M., et al. (2016). Reference gene selection for RT-qPCR analysis of flower development in Chrysanthemum morifolium and Chrysanthemum lavandulifolium. Front. Plant Sci. 7:287. doi: 10.3389/fpls.2016.00287
Ramakers, C., Ruijter, J. M., Deprez, R. H., and Moorman, A. F. (2003). Assumption-free analysis of quantitative real-time polymerase chain reaction (PCR) data. Neurosci. Lett. 13, 62–66. doi: 10.1016/S0304-3940(02)01423-4
Samuel, M. A., Chong, Y. T., Haasen, K. E., Aldea-Brydges, M. G., Stone, S. L., and Goring, D. R. (2009). Cellular pathways regulating responses to compatible and self-incompatible pollen in Brassica and Arabidopsis stigmas intersect at Exo70A1, a putative component of the exocyst complex. Plant Cell. 21, 2655–2671. doi: 10.1105/tpc.109.069740
Štajner, N., Cregeen, S., and Javornik, B. (2013). Evaluation of reference genes for RT-qPCR expression studies in hop (Humulus lupulus L.) during infection with vascular pathogen verticillium albo-atrum. PLoS ONE 8:e68228. doi: 10.1371/journal.pone.0068228
Stein, J. C., Dixit, R., Nasrallah, M. E., and Nasrallah, J. B. (1996). SRK, the stigma-specific S locus receptor kinase of Brassica, is targeted to the plasma membrane in transgenic tobacco. Plant Cell. 8, 429–445. doi: 10.1105/tpc.8.3.429
Vandesompele, J., De Preter, K., Pattyn, F., Poppe, B., Van Roy, N., De Paepe, A., et al. (2002). Accurate normalization of real-time quantitative RT-PCR data by geometric averaging of multiple internal control genes. Genome Biol. 3:research0034. doi: 10.1186/gb-2002-3-7-research0034
Wang, L., Peng, H., Ge, T., Liu, T., Hou, X., and Li, Y. (2014a). Identification of differentially accumulating pistil proteins associated with self-incompatibility of non-heading Chinese cabbage. Plant Biol. 16, 49–57. doi: 10.1111/plb.12016
Wang, L., Wang, C., Ge, T., Wang, J., Liu, T., Hou, X., et al. (2014b). Expression analysis of self-incompatibility-associated genes in non-heading Chinese cabbage. Genet. Mol. Res. 13, 5025–5035. doi: 10.4238/2014.July.4.18
Watanabe, M., Hatakeyama, K., Takada, Y., and Hinata, K. (2001). Molecular aspects of self-incompatibility in Brassica species. Plant Cell Physiol. 42, 560–565. doi: 10.1093/pcp/pce075
Watanabe, M., Suwabe, K., and Suzuki, G. (2012). Molecular genetics, physiology and biology of self-incompatibility in Brassicaceae. Proc. Jpn Acad. B Phys. Biol. Sci. 88:519. doi: 10.2183/pjab.88.519
Wei, L., Miao, H., Zhao, R., Han, X., Zhang, T., and Zhang, H. (2013). Identification and testing of reference genes for Sesame gene expression analysis by quantitative real-time PCR. Planta 237, 873–889. doi: 10.1007/s00425-012-1805-9
Xiao, D., Zhang, N. W., Zhao, J. J., Bonnema, G., and Hou, X. L. (2012). Validation of reference genes for real-time quantitative PCR normalisation in non-heading Chinese cabbage. Funct. Plant Biol. 39, 342–350. doi: 10.1071/FP11246
Xiao, X., Ma, J., Wang, J., Wu, X., Li, P., and Yao, Y. (2014). Validation of suitable reference genes for gene expression analysis in the halophyte Salicornia europaea by real-time quantitative PCR. Front. Plant Sci. 5:788. doi: 10.3389/fpls.2014.00788
Xu, X., Yang, Z., Sun, X., Zhang, L., and Fang, Z. (2014). Selection of reference genes for quantitative real-time PCR during flower bud development in CMS7311 of heading Chinese cabbage (Brassica rapa L. ssp. pekinensis). Acta Physiol. Plant. 36, 809–814. doi: 10.1007/s11738-013-1437-0
Zhang, W., Wei, X., Meng, H. L., Ma, C. H., Jiang, N. H., Zhang, G. H., et al. (2015). Transcriptomic comparison of the self-pollinated and cross-pollinated flowers of Erigeron breviscapus to analyze candidate self-incompatibility-associated genes. BMC Plant Biol. 15:248. doi: 10.1186/s12870-015-0627-x
Keywords: RT-qPCR, Brassica rapa, flowers, reference genes, self-incompatibility, geNorm, NormFinder
Citation: Wang C, Cui H-M, Huang T-H, Liu T-K, Hou X-L and Li Y (2016) Identification and Validation of Reference Genes for RT-qPCR Analysis in Non-Heading Chinese Cabbage Flowers. Front. Plant Sci. 7:811. doi: 10.3389/fpls.2016.00811
Received: 01 April 2016; Accepted: 24 May 2016;
Published: 10 June 2016.
Edited by:
Fabio Marroni, Istituto di Genomica Applicata, ItalyReviewed by:
Milena Petriccione, CREA-Unità di Ricerca per la Frutticoltura, ItalySylvain Dumez, University Lille 2, France
Bas Dekkers, Wageningen University, Netherlands
Copyright © 2016 Wang, Cui, Huang, Liu, Hou and Li. This is an open-access article distributed under the terms of the Creative Commons Attribution License (CC BY). The use, distribution or reproduction in other forums is permitted, provided the original author(s) or licensor are credited and that the original publication in this journal is cited, in accordance with accepted academic practice. No use, distribution or reproduction is permitted which does not comply with these terms.
*Correspondence: Ying Li, yingli@njau.edu.cn