 Wanni Xu1,2,3†
 Jianshe Shi4†
 Yunling Lin5
 Chao Liu1,2,3Weifang Xie1,2,3Huifang Liu4Siyu Huang1Daxin Zhu1,2,3Lianta Su1,3Yifeng Huang5
 Yuguang Ye1,2,3*
 Jianlong Huang1,2,3*
- 1Department of Mathematics and Computer Science, Quanzhou Normal University, Quanzhou, China
- 2Fujian Provincial Key Laboratory of Data Intensive Computing, Quanzhou, China
- 3Key Laboratory of Intelligent Computing and Information Processing, Fujian Province University, Quanzhou, China
- 4Department of General Surgery, Huaqiao University Affiliated Strait Hospital, Quanzhou, China
- 5Department of Diagnostic Radiology, Huaqiao University Affiliated Strait Hospital, Quanzhou, China
Background and Objective: Cardiovascular disease is a high-fatality health issue. Accurate measurement of cardiovascular function depends on precise segmentation of physiological structure and accurate evaluation of functional parameters. Structural segmentation of heart images and calculation of the volume of different ventricular activity cycles form the basis for quantitative analysis of physiological function and can provide the necessary support for clinical physiological diagnosis, as well as the analysis of various cardiac diseases. Therefore, it is important to develop an efficient heart segmentation algorithm.
Methods: A total of 275 nuclear magnetic resonance imaging (MRI) heart scans were collected, analyzed, and preprocessed from Huaqiao University Affiliated Strait Hospital, and the data were used in our improved deep learning model, which was designed based on the U-net network. The training set included 80% of the images, and the remaining 20% was the test set. Based on five time phases from end-diastole (ED) to end-systole (ES), the segmentation findings showed that it is possible to achieve improved segmentation accuracy and computational complexity by segmenting the left ventricle (LV), right ventricle (RV), and myocardium (myo).
Results: We improved the Dice index of the LV to 0.965 and 0.921, and the Hausdorff index decreased to 5.4 and 6.9 in the ED and ES phases, respectively; RV Dice increased to 0.938 and 0.860, and the Hausdorff index decreased to 11.7 and 12.6 in the ED and ES, respectively; myo Dice increased to 0.889 and 0.901, and the Hausdorff index decreased to 8.3 and 9.2 in the ED and ES, respectively.
Conclusion: The model obtained in the final experiment provided more accurate segmentation of the left and right ventricles, as well as the myocardium, from cardiac MRI. The data from this model facilitate the prediction of cardiovascular disease in real-time, thereby providing potential clinical utility.
1 Introduction
Currently, in the medical domain, various medical imaging techniques and advanced equipment are utilized (Hu et al., 2019), including computed tomography, X-ray, and magnetic resonance imaging. As a new medical imaging diagnostic technology, MRI has developed very rapidly in recent years. MRI not only provides more information compared to many other imaging techniques but also has significant potential advantages in disease diagnosis. Improvement in medical imaging technology is closely related to advancements in computer technology (Lou et al., 2020). The use of computer technology in the domain of medical imaging enables doctors to see pathological tissue structures more easily, improves the efficiency of disease analysis, and provides more accurate medical reports, thereby greatly reducing the rate of misdiagnosis (Olaf et al., 2015).
We have proposed a series of methods for cardiac image segmentation based on our deep-learning algorithm. Avendi et al. (2016) proposed a method to combine an algorithm and a learning deformation model for the segmentation of the left ventricle. Because the left ventricle tends to contract easily and is sensitive to initialization, this method automatically uses the convolutional neural network to detect the left ventricular chamber. The accuracy of the segmentation is increased by using the stacked automatic encoder to determine the left ventricular chamber based on the data model and the combination of the anticipated shape to develop the formable model. van der Geest and Reiber (1999) provided a method for segmenting the left ventricle using a deep learning model along with several level sets. Based on the shape and appearance of the training set, it required less training data, but it had limitations when the region of interest in the training set was modeled differently. The authors combined the benefits of both methods to achieve left ventricular segmentation using deep learning, thereby simulating this shift with less annotated training sets, yet usually involving regularization to enhance the generalization ability (Sulaiman et al., 2018).
Segmentation accuracy has improved through the use of deep learning-based models compared with traditional methods for dividing heart images (Geert et al., 2017). However, the models still lack the capability to completely differentiate the left and right ventricles from the myocardium, and the training complexity is high. To enhance the performance of the neural network, this study adopted the improved U-Net network in a fully convolutional neural network to conduct cardiac segmentation. Our study also demonstrates the addition of batch normalization (BN) and the adoption of different loss functions. Finally, we conducted an experimental evaluation of the data set and achieved superior segmentation results compared to previous work by applying the batch normalization layer and the combination weighted loss function.
2 Materials and methods
2.1 Network topology
In this study, the network adhered to the traditional U-Net network (Sulaiman et al., 2018) encoding and decoding structure (Olaf et al., 2015), and Figure 1 depicts the network model structure (Wong et al., 2020). The network learned how to encode the image characteristics in the training set along the encoding route.
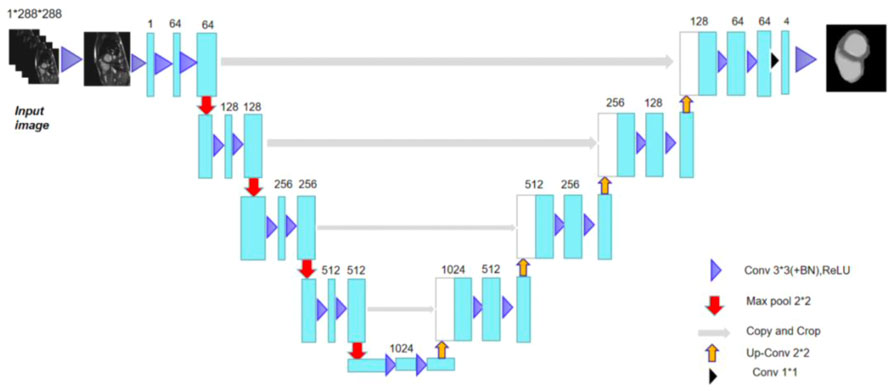
FIGURE 1. Classic U-network structure for the purpose of cardiac MRI image segmentation.
The network obtained image characteristics from the acquired encoding characteristics in the decoding route (Shi et al., 2021) and reconstructed the images. The cascade between the outputs of each stage and the inputs of the decoding path defined the U-Net network topology. The convolution network of the decoding path was where these cascade operations identified the high spatial resolution information on the image. Therefore, using these data as a foundation, a more accurate result was produced. The encoding route had two identical sets of 33 convolutions at each stage. Improvement of the U-Net (Zhang et al., 2018) could be achieved by adding every 33 convolutions and a rectified linear unit (ReLU) (Li et al., 2020) of the network. Each layer was used for subsampling to a maximum pooling layer with 22 convolution steps of 2. The network predetermined 64 feature channels to be the starting number. The image size was reduced by half and the number of feature channels was doubled following the subsampling of each layer (Wong et al., 2017).
There were two identical 33 convolutions included in each step of the upsampled decoding method. Similar to this, a batch normalizing layer and a ReLU were applied after each convolution. With 22 convolution upsampling, the number of feature channels was halved and the upsampled feature images cascaded with the feature images from the encoded path. A total of 64 feature maps could be mapped to the four classes of heart segmentation by adding an additional 11 convolution layers to the final layer (the left ventricle, myocardium, right ventricle, and background). In other words, the output of the last layer suggested that one of the four classes following the softmax classifier was where the pixels belonged.
2.2 Function of batch normalization
To create a Gaussian distribution with a mean of 0 and a variance of 1, normalization (Anwar et al., 2018) was used to change the input data. The normalized layer has the capacity to return the output data distribution of the preceding layer to its initial state throughout the training cycle. To avoid forcing the network to adapt to a new data distribution, the processed data were fed into the network’s subsequent layer, which took the initial state’s data distribution as input (Su et al., 2019). High learning rates can be used during network training to hasten network convergence and reduce network overfitting. The batch normalization layer keeps each layer’s size constant and in line with the dimension. A batch of data is supplied into the training phase once the linear activation unit has been standardized, where m is the amount of data.
As the first step, the data means for this batch were calculated as follows:
Then, the variance was given by
After standard processing,
Here, for an integer with very small values, we needed to avoid the value of
The data distribution was only allowed to follow a Gaussian distribution after standardization processing, while the data distribution for some layers was not. The capacity of the network for learning will be impacted by such standardization operations. With the addition of new scaling parameters γ and translation parameters β,
The newly added parameters, γ and β, are a pair of learnable parameters that take part in network training and can restore the distribution of features that the original network needs to learn.
2.3 Training the loss function with the network model hyperparameters
In this study, three loss functions to train improved U-Net networks were used. To compute the difference between background and foreground class, each pixel was individually inspected for class prediction compared to the target vector encoded by one-hot using the pixel-wise cross-entropy loss function (Diederik and Jimmy, 2014).
In the experiment, the network training incorporated the Dice coefficient with the aim of obtaining a relatively stable gradient. When calculating the Dice loss in the training network softmax output layer, the Dice was reduced by 1, and the coefficient obtained by the Dice loss function was
where B represents the outcome after output through the softmax layer, which is a constant set close to 0, i.e.,
When training multi-class targets, the following pixel-level loss function L is often introduced:
where M is the number of categories, Pj is the jth value of the output P of softmax (j = 1, …, M) that indicates the probability that the sample falls into class j, and yj is the correct label (using one-hot, when j is a certain class, the index value of the correct label in yj is 1, and the others are 0).
This study combines pixel-level loss function and Dice loss function as follows:
where L is the pixel-level loss function, Ldiceloss is the Dice loss function, and α and β are the respective weights, α = 1 and β = 0.2.
We utilized the Adaptive Moment Estimation (ADAM) optimizer and implemented a batch size (one set of training data) of 4, 18 epochs (training rounds), and a learning rate of 0.001 to decrease the loss function.
2.4 Experimental data acquisition
The short-axis cardiac MRI experimental data were obtained from the Huaqiao University Affiliated Strait Hospital. All patients in this study had given written consent for participation in the study. Ethical approval was granted by the review committee of our institutional board. The medical image dataset had a total of 275 MRI scans of hearts that consisted of two stages, which pertain to the end-diastole and end-systole. The spatial resolution range of this dataset was 0.70 mm × 0.70 mm–1.92 mm × 1.92 mm. We divided the data into training and test sets using an 8:2 ratio.
The gold standard image contained three-pixel regions: green representing the left ventricle; red, the left ventricular myocardium; and blue, the right ventricle. Figure 2 shows the original image of a patient’s heart section and the corresponding gold standard. The number of images in the data set needed to be increased. The data enhancement method was adopted to expand the number of experimental images by random cropping, rotation, and flipping operations. The data enhancement operation was carried out in the network training to reduce data storage (Olaf et al., 2015; Hao et al., 2017; Ye et al., 2021).
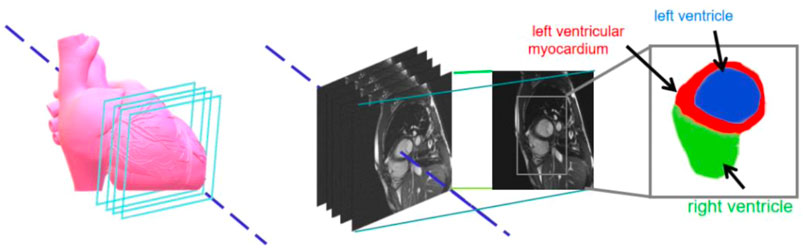
FIGURE 2. Sample datasets pertaining to cardiac images and magnetic resonance images with respective enlargements.
2.5 Evaluation indicators
Three assessment coefficients [Dice coefficient, Hausdorff distance (HD) (Khened et al., 2019), and average symmetric surface distance (ASSD)], which are frequently employed to gauge the effectiveness of segmentation, were utilized to assess the similarity of segments and label the images.
The degree of similarity between the two segmentation results and the reference image was gauged by the Dice coefficient, which is given by
where A represents the true value and B represents the following range pertaining to the softmax structure’s output, which is based on the heart image segmented by the network structure and measures the similarity between the two segmentation outputs and the reference image. The Dice coefficient is a number between 0 and 1. When the Dice value is close to 1, it indicates that the heart image has been segmented well; when it is close to 0, it indicates that the heart image has been poorly segmented and there is little overlap with the gold standard image.
The Hausdorff distance is the greatest distance between two points in another set and is calculated as follows:
where A stands for the idealized image, B for the segmented image, and d (a, b) for the Euclidean distance.
The average symmetric surface distance is a metric based on the surface distance, referring to the distance between the surface pixel S (A) of the gold standard A and the surface pixel S (B) of the segmentation result B, and calculated as follows:
where A represents the standard image, B represents the model results, and S (A) and S (B) represent the set of surface pixels of A and B, respectively. d (SA, S (B)) is a representation of the shortest Euclidean distance between each point on S (A) and all other points on S.
3 Results
3.1 Comparison of test results for networks trained using different loss functions
The network was trained with different kinds of loss functions, and left ventricle, right ventricle, and myocardium segmentation results were evaluated with the Dice coefficient and average symmetric surface distance. After averaging the two phases, we reached the final evaluation shown in Table 1. The least accurate experimental results were obtained using a Dice loss function, and the best were obtained using a weighted combined loss function combining Dice loss with a pixel-level loss function. Usually, the Dice loss function will have a negative effect on backpropagation, which renders the training unstable but allows learning from the smaller classes in the image; the pixel-level cross entropy function is used for multiple classification tasks, but it is susceptible to the categories with more pixels, thereby making it difficult to learn the characteristics of categories with fewer pixels. Thus, merging both advantages, this combined weighted loss function has been considered as the best performing loss function for experimental network training. The test results from networks trained using a combined weighted loss function network are presented in Table 1.
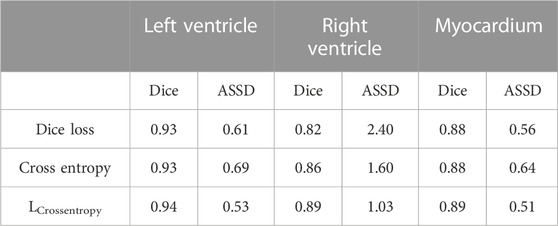
TABLE 1. Comparison of mean segmentation accuracy of three loss functions based on improved U-Net network.
3.2 Test results from networks trained using a combined weighted loss function network
The improved U-Net network (Zhao et al., 2020) used a new combined weighted loss function, and the resulting network model was used to distinguish the left ventricle and right ventricle from the ED stage to the ES stage. The statistical segmentation accuracy values and statistical results are presented in Table 2. The data shows that the highest value for the left ventricle occurred in the ES stage and the lowest in the ES stage.
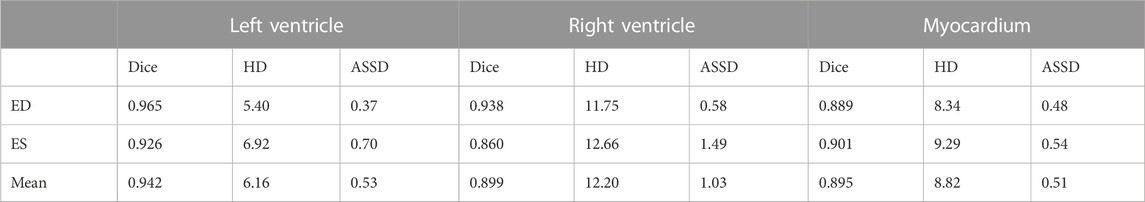
TABLE 2. Comparison of segmentation accuracy values based on improved U-Net network.
We selected three representative sections from the data for demonstration, as shown in Figure 3. From left to right, we obtained sections of the lower heart, middle heart, and upper heart, which are depicted as Slice 1, Slice 2, and Slice 3, respectively. Figure 4 shows the segmentation results of our modified U-Net network in the test set. From upper to lower in position, the rows represent the original image, segmentation result, and corresponding true value. Figure 5 shows the segmentation predicted from stage ED to stage ES. The red area represents the right ventricle, the green area represents the myocardium, and the blue area represents the left ventricle. The second row reveals that the method showed more accurate segmentation results in the analysis of the data set representing the middle of the slice, but the segmentation of the base and the top of the slice was poor due to the top of the heart slice containing very few ventricular pixels, resulting in the ventricular boundary being too difficult to confirm as ventricular density was close to tissue interference, etc.
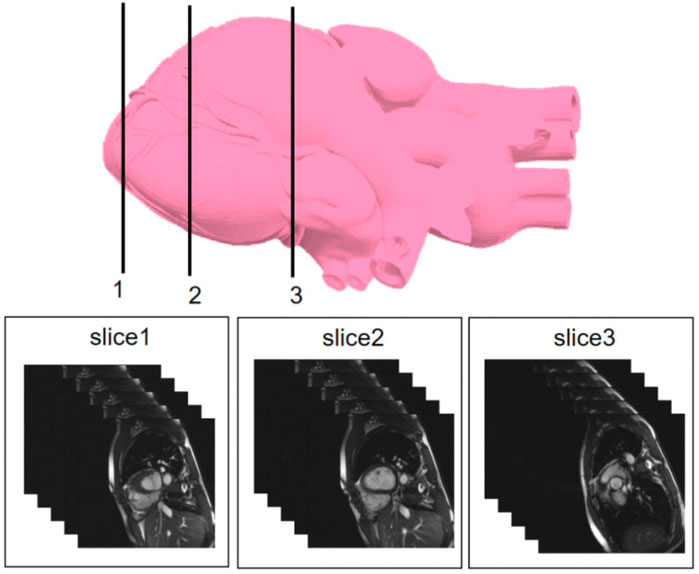
FIGURE 3. Cardiac MRI sampling locations included in this study.
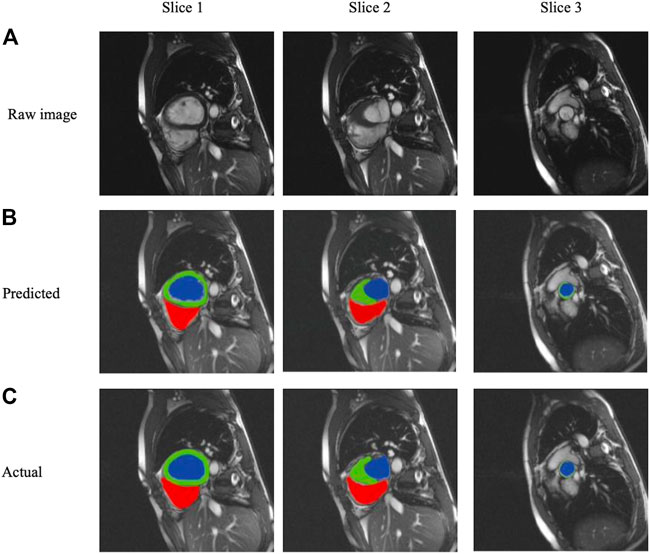
FIGURE 4. Segmentation results from analysis of the three slice heart samples based on (A) raw images, (B) Predicted segmentation images, and (C) Actual gold standard segmentation images; red areas represent the right ventricle, green areas represent the myocardium, and blue areas represent the left ventricle.
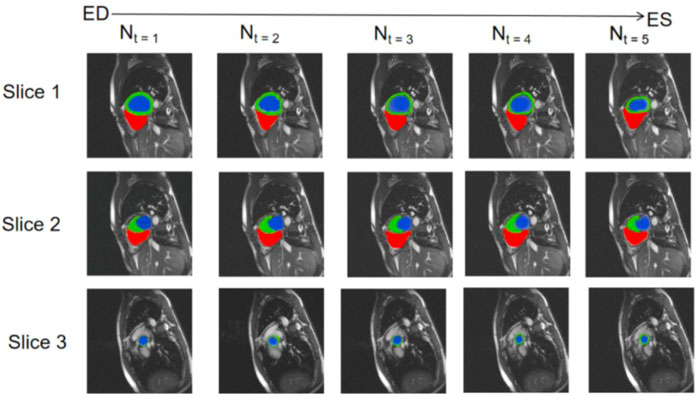
FIGURE 5. Predicted segmentation from stage ED to stage ES; red areas represent the right ventricle, green areas represent the myocardium, and blue areas represent the left ventricle.
3.3 Comparison of results by other methods
The experimental method was compared with different segmentation methods (Simonyan and Zisserman, 2014), whereby each method of heart data set segmentation was evaluated using the Dice coefficient and Hausdorff distance. Segmentation results of the left and right ventricular and myocardial accuracy values based on the two evaluation indices are presented in Table 3. From the experimental segmentation results compared with other methods, the Hausdorff distance value was the lowest, and the best performance occurred in the segmentation of the myocardium in the ED stage, demonstrating that the Hausdorff distance value was the lowest. These data show that the experimental training network improved the network segmentation, which indicates that this experimental method has certain advantages and results in much-improved segmentation of the heart.
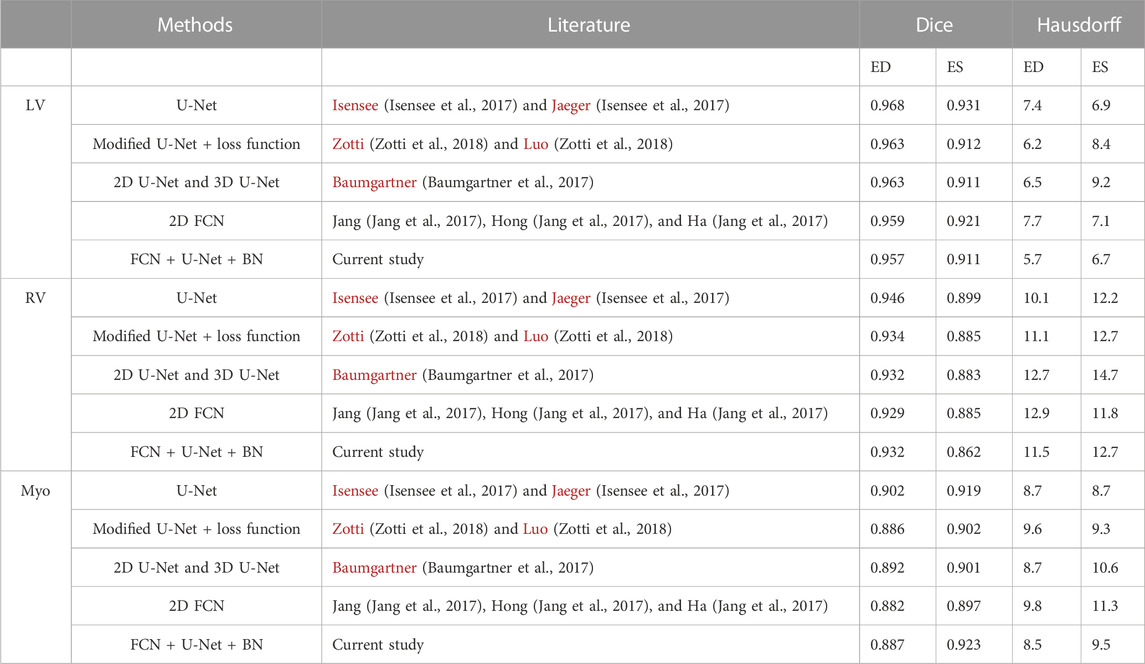
TABLE 3. Segmentation accuracy statistics of different segmentation methods.
4 Discussion
We trained a new model for cardiac segmentation from MRI data learning and effectively improved experimental results by adding batch normalization layers to the neural network and using different loss functions. Compared with the existing deep learning segmentation method (Olaf et al., 2015; Avendi et al., 2016), we used the improved U-Net network in the FCN Network for cardiac MRI segmentation, added BN, and selected different loss functions to improve the neural network performance. Good segmentation results were obtained by combining the batch normalization layer and the integrated weighted loss function. At the same time, due to the tendency of the heart to contract easily, the method is sensitive to initialization and other problems. Research using myocardial cell models or cardiac-related cells of the ventricular structures has combined analytics to measure intimate cellular interactions (Wong, 2017), such as those at the apical segment, which have been found to have a strong influence on dynamical changes or even thickening of the ventricular wall; these data may provide new insights into cardiovascular structure dynamics. We referred to the convolutional neural network detailed in existing research (Su et al., 2019) to automatically detect the left ventricle in the dataset and, at the same time, the stacked autoencoder was used to judge the left ventricular chamber. The method of merging these aspects into a formable model solved a series of problems, including detail extraction. However, we have not yet been able to achieve complete segmentation of the heart ventricle and the atrium (Chen et al., 2020; Zhu et al., 2021; Wong et al., 2022), or that of the aorta (Wong et al., 2006; Chen et al., 2022), which will be the focus of our upcoming research directions toward future implementation.
5 Conclusion
Through our experiments, we trained a deep learning model with the capacity to achieve heart segmentation based on MRI data by adding a batch-normalized layer to the neural network and using different loss functions and numbers, which improved the experimental results. The model described in this study has been improved in the algorithmic sense. In subsequent studies, other network structures may be added to the U-Net network’s downsampling process to obtain a better network downsampling structure. Additionally, the loss function selected by the network greatly influenced the experimental results; therefore, the design of a new loss function may further improve experimental accuracy.
Data availability statement
The original contributions presented in the study are included in the article/Supplementary Material, further inquiries can be directed to the corresponding authors.
Ethics statement
The studies involving human participants were reviewed and approved by the Ethics Review Committee of the Huaqiao University Affiliated Strait Hospital. The patients/participants provided their written informed consent to participate in this study.
Author contributions
Conceptualization, WX, JS, and YL; investigation, WX, HL, and SH; methodology, WX, DZ, and LS; project administration, YH and YY; visualization, JS, CL, YY, and JH; writing—original draft, WX and YY; writing—review and editing, WX, JS, and JH.
Funding
The Science and Technology Program of Quanzhou funded this research (No. 2021CT0010).
Acknowledgments
The authors also thank the Fujian Provincial Big Data Research Institute of Intelligent Manufacturing, Fujian University Laboratory of Intelligent Computing and Information Processing, and Fujian Provincial Key Laboratory of Data-Intensive Computing for their assistance. The Huaqiao University Affiliated Strait Hospital is specifically acknowledged for contributing the medical data that were used in this work.
Conflict of interest
The authors declare that the research was conducted in the absence of any commercial or financial relationships that could be construed as a potential conflict of interest.
Publisher’s note
All claims expressed in this article are solely those of the authors and do not necessarily represent those of their affiliated organizations, or those of the publisher, the editors, and the reviewers. Any product that may be evaluated in this article, or claim that may be made by its manufacturer, is not guaranteed or endorsed by the publisher.
References
Isensee, F., Jaeger, P., Full, P. M., Wolf, I., Engelhardt, S., and Maier-Hein, K. H. (2017). “Automatic cardiac disease assessment on cine-MRI via time-series segmentation and domain specific features,” in International workshop on statistical atlases and computational models of the heart (Quebec, Canada: Springer), 120–129.
Anwar, S. M., Majid, M., Qayyum, A., Awais, M., Alnowami, M., Khan, M. K., et al. (2018). Medical image analysis using convolutional neural networks: A review. J. Med. Syst. 42 (11), 226. doi:10.1007/s10916-018-1088-1
Avendi, M. R., Kheradvar, A., and Jafarkhani, H. (2016). A combined deep-learning and deformable-model approach to fully automatic segmentation of the left ventricle in cardiac MRI. Med. Image Anal. 30, 108–119.
Baumgartner, C. F., Koch, L. M., Pollefeys, M., and Konukoglu, E., (2017). “An exploration of 2D and 3D deep learning techniques for cardiac MR image segmentation,” in International workshop on statistical atlases and computational models of the heart (Quebec, Canada: Springer), 111–119.
Chen, C., Chen, Q., Huaqi, Q., Tarroni, G., Duan, J., Bai, W., and Rueckert, D., (2020). Deep learning for cardiac image segmentation: A review. Front. Cardiovasc. Med. 7, 1–33. doi:10.3389/fcvm.2020.00025
Chen, W., Huang, H., Huang, J., Wang, K., Qin, H., and Wong, K. K. L. (2022). Deep learning-based medical segmentation of the aorta using XR-MSF-U-Net. Comput. Methods Programs Biomed. 225, 107073. doi:10.1016/j.cmpb.2022.107073
Diederik, P. K., and Jimmy, B. (2014). Adam: A method for stochastic optimization. https://arxiv.org/abs/1412.6980.
Geert, L., Thijs, K., Babak, E. B., Arnaud, A. A. S., Ciompi, F., Ghafoorian, M., et al. (2017). A survey on deep learning in medical image analysis. Med. image Anal. 42, 60–88. doi:10.1016/j.media.2017.07.005
Hao, D., Guang, Y., Fangde, L., Yuanhan, M., and Yike, G. (2017). “Automatic brain tumor detection and segmentation using U-Net based fully convolutional networks,” in Annual conference on medical image understanding and analysis (Edinburgh, Scotland: Springer), 506–517.
Hu, S., Gao, R., Liu, L., et al. (2019). Summary of the 2018 report on car diovascular diseases in China. Chin. Circulation Journal 34 (3), 209–220.
Jang, Y., Hong, Y., Ha, S., Kim, S., and Chang, H. J., (2017). “Automatic segmentation of LV and RV in cardiac MRI,” in International workshop on statistical atlases and computational models of the heart (Quebec, Canada: Springer), 161–169.
Khened, M., Kollerathu, V. A., and Krishnamurthi, G. (2019). Fully convolutional multi-scale residual DenseNets for cardiac segmentation and automated cardiac diagnosis using ensemble of classifiers. Med. Image Anal. 51, 21–45.
Li, L., Wu, F., Yang, G., Xu, L., Wong, T., Mohiaddin, R., et al. (2020). Atrial scar quantification via multi-scale CNN in the graph-cuts framework. Med. image Anal. 60, 101595. doi:10.1016/j.media.2019.101595
Lou, A., Guan, S., and Loew, M. (2020). “DC-U-Net: Rethinking the U-net architecture with dual channel efficient CNN for medical images segmentation,” in Proceedings of the Medical Imaging 2021 Image Processing, Perth, WA. Australia, 2020. doi:10.1117/12.2582338
Olaf, R., Fischer, P., and Brox, T. (2015). “U-Net: Convolutional networks for biomedical image segmentation,” in Medical image computing and computer-assisted intervention (Heidelberg, Germany: Springer), 234–241.
Shi, J., Ye, Y., Zhu, D., Su, L., Huang, Y., and Huang, J. (2021). Automatic segmentation of cardiac magnetic resonance images based on multi-input fusion network. Comput. Methods Programs Biomed. 209. 106323. doi:10.1016/j.cmpb.2021.106323
Simonyan, K., and Zisserman, A. (2014). Very deep convolutional networks for large-scale image recognition. https://arxiv.org/abs/1409.1556.
Su, X., Wang, L., Nie, S., et al. (2019). New progress in right ventricle segmentation based on short-axis movie images of cardiac magnetic resonance. Journal Spectrosc. 36 (3), 377–391.
Sulaiman, V., Ravikumar, N., and Maier, A. (2018). “Dilated convolutions in neural networks for left atrial segmentation in 3D gadolinium enhanced-MRI,” in Statistical atlases and computational models of the heart. Atrial segmentation and LV quantification challenges (Heidelberg, Germany: Springer), 319–328.
van der Geest, R. J., and Reiber, J. H. (1999). Quantification in cardiac MRI. J. Magnetic Reson. Imaging 10 (5), 602–608.
Wong, K. K. L., Fortino, G., and Abbott, D. (2020). Deep learning-based cardiovascular image diagnosis: A promising challenge. Future Gener. Comput. Syst. 110, 802–811. doi:10.1016/j.future.2019.09.047
Wong, K. K. L., Kuklik, P., Kelso, R. M., Worthley, S. G., Sanders, P., Mazumdar, J., et al. (2006). “Blood flow assessment in the aortic heart valve based on magnetic resonance images using optical flow analysis,” in Proceedings of the XVth International Conference on Mechanics in Medicine and Biology (15th ICMMB), Singapore, 2006, 15, 74–76.
Wong, K. K. L. (2017). Three-dimensional discrete element method for the prediction of protoplasmic seepage through membrane in a biological cell. J. Biomechanics 8 (65), 115–124. doi:10.1016/j.jbiomech.2017.10.023
Wong, K. K. L., Wang, D., Mazumdar, J., Le, T., and Ghista, D. (2017). Computational medical imaging and hemodynamics framework for functional analysis and assessment of cardiovascular structures. Biomed. Eng. OnLine 16 (35), 35. doi:10.1186/s12938-017-0326-y
Wong, K. K. L., Zhang, A. A., and Yang, K. (2022). GCW-UNet segmentation of cardiac magnetic resonance images for evaluation of left atrial enlargement. Comput. Methods Programs Biomed. 221. 106915. doi:10.1016/j.cmpb.2022.106915
Ye, Y., Shi, J., Huang, Y., Zhu, D., Su, L., and Huang, J. (2021). Management of medical and health Big data based on integrated learning-based health care system: A review and comparative analysis. Comput. Methods Programs Biomed. 209, 106293. doi:10.1016/j.cmpb.2021.106293
Zhang, J., Jin, Y., Xu, J., Xu, X., and Yanchun, Z. (2018). MDU-Net: Multi-scale Densely Connected U-Net for biomedical image segmentation. https://arxiv.org/abs/1812.00352.
Zhao, M., Wei, Y., Lu, Y., and Wong, K. K. L. (2020). A novel U-Net approach to segment the cardiac chamber in magnetic resonance images with ghost artifacts. Comput. Methods Programs Biomed. 196, 105623. doi:10.1016/j.cmpb.2020.105623
Zhu, X., Wei, Y., Lu, Y., Zhao, M., Yang, K., Wu, S., et al. (2021). Comparative analysis of active contour and convolutional neural network in rapid left-ventricle volume quantification using echocardiographic imaging. Comput. Methods Programs Biomed. 199, 105914. doi:10.1016/j.cmpb.2020.105914
Keywords: cardiac MRI, image segmentation, U-Net, batch normalization layer, physiological analysis
Citation: Xu W, Shi J, Lin Y, Liu C, Xie W, Liu H, Huang S, Zhu D, Su L, Huang Y, Ye Y and Huang J (2023) Deep learning-based image segmentation model using an MRI-based convolutional neural network for physiological evaluation of the heart. Front. Physiol. 14:1148717. doi: 10.3389/fphys.2023.1148717
Received: 20 January 2023; Accepted: 22 February 2023;
Published: 21 March 2023.
Edited by:
Yubing Shi, Shaanxi University of Chinese Medicine, ChinaReviewed by:
Ruizheng Shi, Xiangya Hospital, Central South University, ChinaXiliang Zhu, Zhengzhou University, China
Copyright © 2023 Xu, Shi, Lin, Liu, Xie, Liu, Huang, Zhu, Su, Huang, Ye and Huang. This is an open-access article distributed under the terms of the Creative Commons Attribution License (CC BY). The use, distribution or reproduction in other forums is permitted, provided the original author(s) and the copyright owner(s) are credited and that the original publication in this journal is cited, in accordance with accepted academic practice. No use, distribution or reproduction is permitted which does not comply with these terms.
*Correspondence: Yuguang Ye, chinaye@qztc.edu.cn; Jianlong Huang, robotics@qztc.edu.cn
†These authors have contributed equally to this work