 Nibaldo Avilés-Rojas
 Daniel E. Hurtado
- 1Department of Structural and Geotechnical Engineering, School of Engineering, Pontificia Universidad Católica de Chile, Santiago, Chile
- 2Institute for Biological and Medical Engineering, Schools of Engineering, Medicine and Biological Sciences, Pontificia Universidad Católica de Chile, Santiago, Chile
Mechanical ventilation has been a vital treatment for Covid-19 patients with respiratory failure. Lungs assisted with mechanical ventilators present a wide variability in their response that strongly depends on air-tissue interactions, which motivates the creation of simulation tools to enhance the design of ventilatory protocols. In this work, we aim to create anatomical computational models of the lungs that predict clinically-relevant respiratory variables. To this end, we formulate a continuum poromechanical framework that seamlessly accounts for the air-tissue interaction in the lung parenchyma. Based on this formulation, we construct anatomical finite-element models of the human lungs from computed-tomography images. We simulate the 3D response of lungs connected to mechanical ventilation, from which we recover physiological parameters of high clinical relevance. In particular, we provide a framework to estimate respiratory-system compliance and resistance from continuum lung dynamic simulations. We further study our computational framework in the simulation of the supersyringe method to construct pressure-volume curves. In addition, we run these simulations using several state-of-the-art lung tissue models to understand how the choice of constitutive models impacts the whole-organ mechanical response. We show that the proposed lung model predicts physiological variables, such as airway pressure, flow and volume, that capture many distinctive features observed in mechanical ventilation and the supersyringe method. We further conclude that some constitutive lung tissue models may not adequately capture the physiological behavior of lungs, as measured in terms of lung respiratory-system compliance. Our findings constitute a proof of concept that finite-element poromechanical models of the lungs can be predictive of clinically-relevant variables in respiratory medicine.
1 Introduction
With more than 550 million cases and 6 million deaths to date, the Covid-19 pandemic continues to be one of the most urgent health problems in the world (Worldometers, 2022). The most concerning complication of Covid-19 is acute respiratory failure, whose treatment demands invasive mechanical ventilation (MV) in up to 89.9% of patients admitted to intensive care units (Wunsch, 2020). Despite being the standard of care for many decades, there is still no consensus about optimal settings during MV treatment, as the respiratory response of patients presents high variability that can compromise the clinical outcome (Chiew et al., 2018; Morton et al., 2020; Grasselli et al., 2021). From this perspective, predictive patient-informed simulations of respiratory mechanics during MV and other pulmonary conditions arise as a unique opportunity to personalize care in critical and respiratory medicine, as they provide a safe framework to design, prototype, and test individualized ventilation protocols and interventions in silico (Chase et al., 2018; Zhou et al., 2021), with the aim of optimizing treatment and improving clinical outcomes.
Modeling the mechanics of the respiratory system has been traditionally approached from an engineering systems perspective (Bates, 2009). Compartment models have been proposed in the literature, where the respiratory system is represented as an interconnected network of elastic deformable elements (lungs/lobes) and resistive conduits (airways) (Maury, 2013; Arunachalam et al., 2020). This approach has the advantage of directly considering clinically-relevant variables such as airway pressure, volume, and flow, all of which can be tracked in real-time on patients undergoing mechanical ventilation with current monitoring technologies (Major et al., 2018; Morton et al., 2018). Single-compartment lung models are widely employed in the analysis of respiratory mechanics waveforms, as they are fitted to these physiological signals to estimate key lung parameters such as respiratory-system compliance, airway resistance, and expiratory time constants. These parameters are very relevant in clinical practice, supporting medical diagnosis in respiratory medicine and guiding clinical decisions in intensive care units (Hess, 2014).
Understanding regional ventilation mechanisms in the lung has motivated the extension of compartment models to represent the complex geometry of the airways. Fractal lumped models have been created using a flow dynamics simulations on reconstructions of the airway tree that connect at the terminals with acini (Tawhai and Bates, 2011; Swan et al., 2012; Roth et al., 2017a; Roth et al., 2017b; Pozin et al., 2017). While these models have been successful in the estimation of 3D distributions of ventilation and alveolar pressure, they fail, by construction, to seamlessly couple the interaction between deformation of alveolar tissue and air flow in the lung. This mechanical coupling is needed to establish a direct and accurate relation between regional lung ventilation and deformation, which motivates the creation of continuum approximations that consider both the solid and gas phases in the lung.
The tight interaction between the alveolar (porous) structure and the air pressure acting on the alveolar wall highlights the inherent poromechanical nature of lung function (Sarabia-Vallejos et al., 2021). The first attempts to model the transitional and respiratory regions of the lung using poroelastic continuum theory on idealized geometries was carried out by Kowalczyk (1993). Berger et al. (2016) extended this poroelastic formulation to create a 3D computational simulations of a lung under idealized spontaneous breathing. Using a Neo-Hookean material to represent the contribution of alveolar tissue, they were able to model the local coupling between alveolar pressure and tissue deformation in the lung. More recently, anatomical 3D finite-element simulations of the lungs have been developed to study their quasi-static poromechanical response (Patte et al., 2022b). The impact of material parameters on the pleural pressure arising from the interaction of the lungs with the thoracic cage was studied under static conditions. These contributions constitute a proof of concept that 3D poromechanical models of human lungs can be constructed, and that they deliver mechanically-consistent results. However, their applicability to clinically-relevant conditions, such as lungs under mechanical ventilation, remains unexplored.
Predictive mechanical simulations of whole organs necessitate accurate constitutive models of the underlying tissue. The non-linear mechanical response of the lung parenchyma has been described using several phenomenological hyperelastic constitutive laws, which include exponential strain energy densities (Fung, 1974; Tawhai et al., 2009; Ma et al., 2013), polynomials models (Berger et al., 2016; Yoshihara et al., 2017), and linear combinations of the former (Rausch et al., 2011; Birzle et al., 2018; Birzle et al., 2019). These phenomenological approximations require the determination of material constants for experimental data, which has been approached from uniaxial tensile experiments (Rausch et al., 2011; Bel-Brunon et al., 2014), biaxial stretching (Gao et al., 2006) and volumetric expansion tests (Birzle et al., 2018; Birzle et al., 2019). Despite the wide range of constitutive laws and experimental data available for lung tissue mechanics, only simple material models have been included in whole-lung simulations (Tawhai et al., 2009; Berger et al., 2016).
In this work, we formulate a continuum seamlessly coupled framework to construct anatomical computational models of the lungs, and explore its potential for clinically-relevant applications. Our guiding question is: Can we construct high-fidelity poromechanical lung models that capture the distinctive features of respiratory mechanics of lungs under mechanical ventilation? In addition, a second question that arises is: What is the impact of the choice of constitutive model on the large-scale organ response? To answer these questions, in Section 2 we develop a continuum finite-deformation poroelastic framework suitable for the construction of dynamic finite-element models of patient-specific geometries of the lungs and review two clinical applications in respiratory medicine, namely mechanical ventilation and the supersyringe method for quasi-static lung mechanics characterization. We further discuss the necessary modeling considerations adopted in this work to resemble these procedures. The numerical simulations of these two applications, along with the study of simulations under different constitutive models are reported in Section 3. We end by discussing the ability of our simulations to capture the behavior of mechanically-ventilated lungs, their comparison with clinical parameters reported in the literature, and the impact of the choice of constitutive models on our simulations in Section 4.
2 Materials and methods
2.1 Dynamic continuum poroelastic formulation of lung respiratory mechanics
In the following, we adopt a continuum approach to porous materials as described in Coussy (2004). To this end, the lung is represented by a continuum, whose microstructure is composed by a gas and a solid phase, see Figure 1. We will refer to the gas phase as the alveolar air, and to the solid as the alveolar tissue. Let Ω0 be the domain of the lung in the Material (reference) configuration, and Ω = φ(Ω0, t) the deformed domain in the spatial (current) configuration that results from applying the deformation mapping
Let
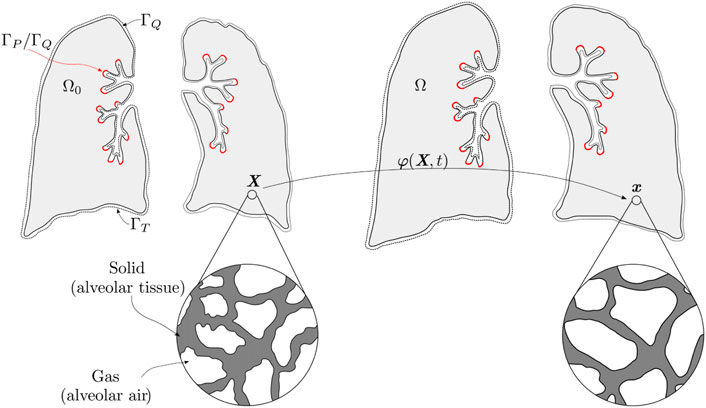
FIGURE 1. Material and spatial configuration of the lung continuum with porous composite idealization. The red color indicates the airway boundary, where it prescribes pressure or flow depending on the application; the complement of the surface is a null prescribed flow boundary. In addition, traction is prescribed on the whole surface.
Within the composite porous medium that represents the lung functional domain, also termed lung parenchyma, alveolar gas and alveolar tissue coexist, and are mechanically coupled by means of conservation laws (MacMinn et al., 2016). We note that, in simplifying the analysis, other components found in the lung parenchyma such as blood and blood vessels, among other, are assumed to be part of the tissue phase (Berger et al., 2016). In the absence of sources or sink terms, the local form of mass conservation for alveolar air and tissue compartments can be expressed by
where
The linear momentum balance for the porous composite (parenchyma) takes the form (Coussy, 2004; Vuong et al., 2015)
where
Following Berger et al. (2016), we neglect inertial terms and viscous stresses, and assume the incompressibility of both gas and tissue phases. These assumptions imply that both ρa and ρt are constant fields. We note that these conditions do not prevent the tissue phase to deform, as gas can enter or exit the composite domain during deformation, rearranging the pore structure and changing the local porosity field (MacMinn et al., 2016). Under these assumptions, Eqs 2, 3, 5 can be rewritten as
with ρ = (1 − ϕ)ρt + ϕρa the spatial composite density.
We will be interested in expressing the balance laws defined above in terms of Material fields defined on the Reference configuration Ω0. To this end, we consider the Material alveolar airflow field
Further, we consider the first Piola-Kirchhoff stress tensor field
Using these definitions, and via pull-back of the spatial balance expressions, it can be shown that the Material form of the gas mass conservation reads (Coussy, 2004; MacMinn et al., 2016)
and the Material linear momentum balance for the composite reads
where R≔J(ρ◦φ) is the Material composite density and B = b◦φ is the Material body force density field.
2.2 Constitutive models for alveolar tissue and airflow
Based on standard arguments of the mixture theory of porous media, we consider the composite (parenchyma) Cauchy stress tensor to be
where
where
where
we consider the deformation invariants
And we note that I3 ≡ J2. Since all constitutive models considered in this work assume an isotropic solid, their strain energy densities can be written in terms of these three invariants, as reported in Table 1.
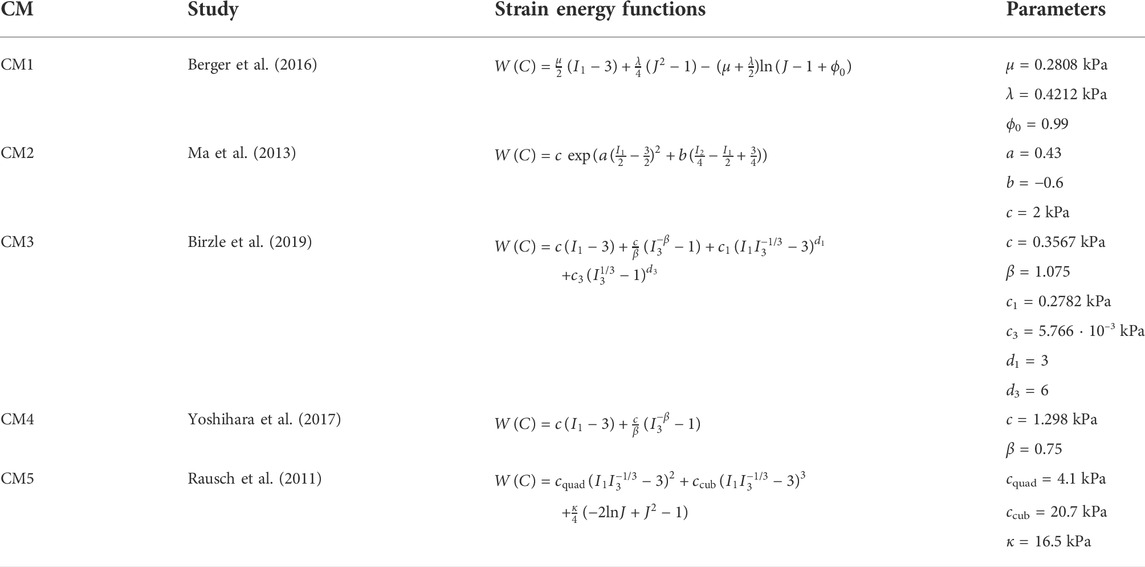
TABLE 1. Constitutive models for lung parenchyma: expressions for strain-energy densities and material parameters.
Alveolar airflow inside the porous parenchyma is assumed to follow Darcy’s law, which in the case of a Newtonian fluid takes the form (Choo, 2018)
or equivalently, in Material form, reads
where
2.3 Strong and weak formulations, and computational model construction
Let Γ0 be the boundary of the reference configuration Ω0. We assume that Γ0 admits the partition (Li et al., 2004; Sun et al., 2013; Vuong et al., 2015)
where Γφ, ΓT, ΓP and ΓQ are the boundaries of prescribed deformation mapping, tractions, alveolar pressures, and alveolar airflow, respectively. Considering these boundary conditions, initial conditions on the unknown fields, and governing Eqs 11, 12, the strong Material poroelastic formulation of the lung mechanics problem can be stated as
Find
where P y Q are given by constitutive Eqs 14, 21,
Considering that water content in parenchymal tissue, which includes intracellular, interstitial, and blood water, can represent up to 80% of its mass (Lange and Schuster, 1999), we assume the tissue phase to be incompressible (Kowalczyk, 1993; Berger et al., 2016; Yoshihara et al., 2017). Further, we note that tissue incompressibility implies that (Coussy, 2004)
where Φ0 is the initial Material porosity field.
To construct the weak formulation of the lung mechanics problem, we define the spaces of trial functions
Following a standard Galerkin approach, we multiply governing Eqs 24, 25 by test functions
Find
Spatio-temporal discretization of the weak formulation was carried out using a backward-Euler time integration scheme and a standard Galerkin finite-element (FE) discretization, which yields a dynamic multi-field FE formulation (Hurtado et al., 2017a; Hurtado and Zavala, 2021). The computational implementation was performed using the FEniCS library (Alnaes et al., 2012), considering a Taylor-Hood (P2-P1) element technology.
2.4 Lung domain discretization and implementation of boundary conditions
The domain of the whole-lung computational model was determined from a 3D computed-tomography (CT) image of the thorax of a normal human subject previously reported in the literature (Hurtado et al., 2017b), see Figure 2A. The CT image was acquired during the end of expiration (resting condition), which we assumed to be the Reference configuration of the lung. To create the FE lung mesh, we processed the image as described in previous contributions (Hurtado et al., 2016). In brief, the lung domain was identified from the original CT image dataset using the image segmentation tools included in the ITK Snap library (version 3.6.0) (Yushkevich et al., 2006). Based on this segmented mask image, a tetrahedral mesh was generated using the Computational Geometry Algorithms Library (Fabri and Pion, 2009), see Figure 2B for a graphical representation of the resulting lung mesh.The boundary of the lung domain was partitioned into the airways surface and the visceral pleura surface that lines the remaining lung surface. The airways boundary was determined by considering the surface encompassing bifurcations from the mediastinal surface down to the lobar bronchi. Smaller airways in subsequent branches were considered to be part of the lung parenchyma domain. The visceral pleura surface was defined as the complement of the airways surface. The following boundary conditions were considered:
1) Inflation and deflation: The air is supplied or expelled by a prescribed pressure condition
2) Chest-wall effect: To model the mechanical interaction of the lung with the chest wall and mediastinum as well as the interaction between the airway wall and lung tissue, we considered spring elements acting in the direction normal to the surface over the visceral pleural surface and on the airway surface, see Figure 2C. The boundary traction was determined following a Robin boundary condition of the form
with Ks a stiffness density constant, whose value is chosen to be Ks = 80 ⋅ 10–3 kPa/mm, which delivers a physiological response of the lung. We chose this value to represent an approximate chest-wall compliance value of 200 ml/cm H2O for any constitutive model used, which corresponds to values observed in normal subjects (Lumb, 2017). A discussion of this choice is presented later (see Figure 9 and the corresponding discussion).
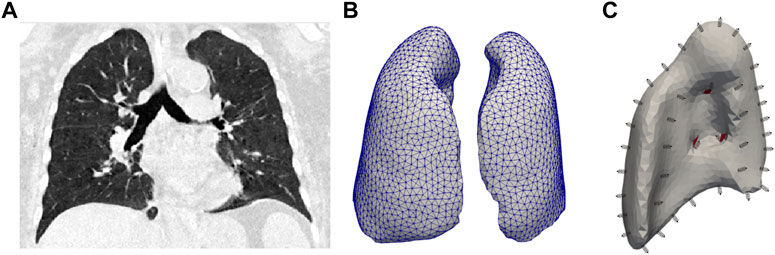
FIGURE 2. (A) CT image of the lung considered as the reference configuration. (B) Mesh for the finite element model. (C) Boundaries considered for right lung. The airways boundary is shown in red.
In addition, we note that since this study focuses on analyzing the interaction between the lung and the ventilator using suitable boundary conditions, the body force field B is set equal to zero, i.e., the influence of gravity is neglected in our simulations.
2.5 Modeling the lung response to pressure-controlled ventilation
Invasive mechanical ventilation is a lifesaving treatment for acute respiratory distress syndrome patients. During mechanical ventilation, the lungs of a patient are connected via an endotracheal tube to a ventilator device that performs the respiratory function (Walter et al., 2018). The ventilator controls the air pressure applied to the airways or the amount of air that is pumped in every breath cycle. In this work, we consider two standard modes of invasive mechanical ventilation: pressure-controlled ventilation (PCV) and volume-controlled ventilacion (VCV).
The PCV mode is a pressure-targeted, time-cycled mode of operation, where the ventilator provides all the work of breathing, and the airflow and volume are dynamically adjusted to achieve the target airway pressure levels (Ashworth et al., 2018). During the inspiratory phase of PCV, air flows into the lung until a peak inspiratory pressure (PIP) value is reached, and then a flat pressure profile (square wave) is maintained for the rest of the inspiratory time (McKibben and Ravenscraft, 1996; Nichols and Haranath, 2007). After this, during the expiratory phase, the pressure is rapidly reduced to a set level of positive end-expiration pressure (PEEP) (Singer and Corbridge, 2011), which without loss of generality is assumed to be zero from here on.
To resemble this setup, in our finite-element simulations, we prescribe a pressure
Once the finite-element lung simulations are carried out, the volume difference from the resting volume, i.e. the volume signal, is determined as
with
The simulated flow signal
which, in view of Eqs 25, 31, and 32, can be rewritten as
Further, we note that in our PCV simulations, the airway pressure signal is defined as
2.6 Modeling the lung response to volume-controlled ventilation
In VCV mode, in each machine breath, a target amount of tidal volume (Vtidal) is delivered using the same predetermined inspiratory flow–time profile, with the constant inspiratory flow being the most widely used breath delivery mode (Koh, 2007). In the conventional VCV, the expiratory valve is opened immediately after delivering the tidal volume. Modern ventilators allow an end-inspiratory pause to be included before expiration, where the ventilator sets the inspiratory flow to zero without opening the expiratory valve (Ball et al., 2015).
To simulate this ventilation mode, we consider that the Vtidal is supplied during the inspiratory phase by a constant prescribed airflow condition as
where Tinsp is the duration of inspiration and Aaw is the area of the airways boundary obtained as the surface integral over this boundary. Then, null airflow is imposed as
For the VCV mode, the ventilation signals can also be predicted by our model. During inspiration and pause, the volume is given simply as the integration of airflow over time
the flow signal is the prescribed airflow
and the airway pressure signal is computed given as then average pressure on the airways boundary as
For the expiratory phase, in which airway pressure is prescribed, the simulated signals can be predicted by Eqs 40–44.
2.7 Estimation of respiratory-system compliance and resistance
In the clinical setup, and in particular for the management of patients under mechanical ventilation, the lung response is analyzed using the concepts of respiratory-system compliance and airway resistance (Hess, 2014). To this end, the response of the respiratory system is assumed to follow a single-compartment equation of motion, which reads (Bates, 2009)
where
The equation of motion can be used to estimate Crs and R. To this end, for given ventilation signals Vsim(t),
Then, defining for convenience the respiratory-system elastance as Ers = 1/Crs and using a least squares fitting approach, the minimization problem to solve is
and can be shown that it is equivalent to solving the linear equation system
from which the values Crs = 1/Ers and R describing the simulated respiratory system are obtained.
2.8 Modeling the supersyringe method: Construction of quasi-static pressure-volume lung curves
Quasi-static pressure-volume (P-V) curves are a gold-standard method to study lung mechanics in respiratory physiology research (West, 2012). The supersyringe method is used to construct these curves and consists of inflating the lung using controlled-volume incremental steps. In general, 50–100 ml of air are delivered into the lung in each step by moving a piston, with 2–3 s pauses between two successive inflations to reach quasi-static conditions. A similar procedure is used to construct deflation curves. Volume and pressure data are recorded, from which the P-V curves are then constructed (Harris, 2005; Stenqvist et al., 2008).
To simulate this standard technique in our lung model, we inflate the lung using a prescribed flow condition
2.9 Estimation of chest-wall compliance
The compliance of the respiratory system, Crs, considers the contribution of the lung and the chest wall, whose relationship is given by (Hess, 2014)
where Cl is the lung compliance and Ccw is the chest wall compliance. In our simulations, the mechanical interaction between the chest wall and the lung was materialized by springs elements acting on lung surface. To assess the relation between the chest-wall compliance Ccw and the spring stiffness coefficient Ks, we performed simulations that assumed a range of values, starting with the case of an unrestrained lung (Ks = 0). This last case allow us to determine the lung compliance Cl. Then, from simulations using non-zero values of Ks we obtained the corresponding Crs, and from Eq. 53 we determined the corresponding Ccw. These simulations were performed considering the PCV mode.
3 Results
Figure 3 shows the airway pressure, flow and volume signals predicted by the poroelastic model of the lung during PCV simulations. In this case, the airway pressure signal is prescribed and equal for all cases considered. The response of the lung model using the different constitutive laws described in Table 1 show significant variations in the volume and flow signals. In particular, the classical NeoHookean model (CM1) results in the highest peak flow and volume values. In contrast, the combined phenomenological model (CM5) displays the lowest peak lung flow and volume values. The cases of CM1 and CM5 form an envelope for all the other cases with different constitutive models. Further, we observe in the flow signals that different constitutive models can result in different exponential decays (time constants), with CM1 having the largest time constant, and CM5 the shortest.
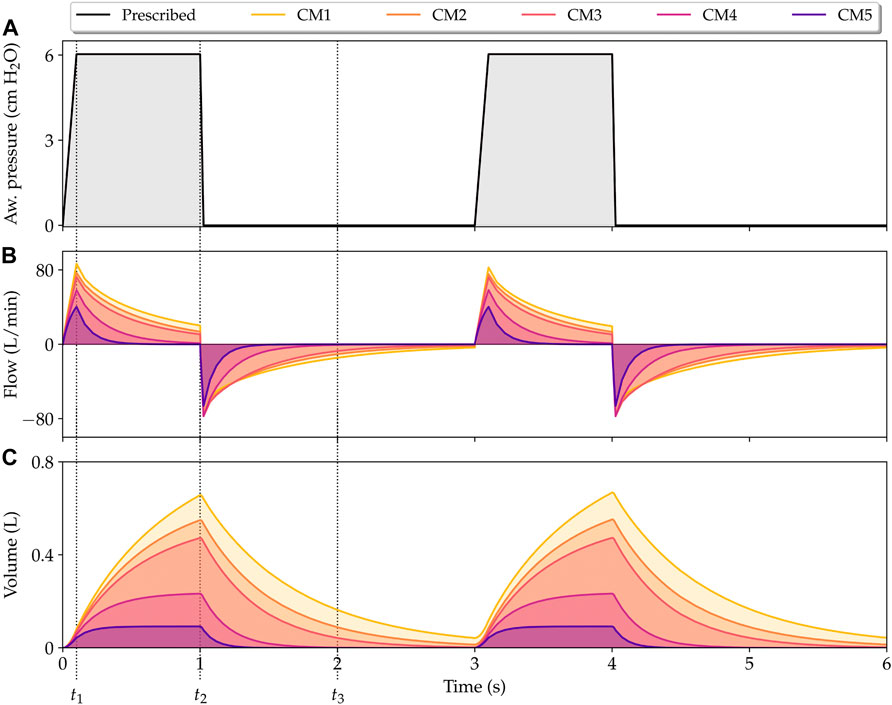
FIGURE 3. Simulation of lungs under pressure-controlled mechanical ventilation. Physiological signals that describe the time evolution of airway pressure (A), flow (B), and volume (C) are shown for all constitutive models considered in this work. t1, t2, and t3 represent the time instants for peak flow, peak volume, and half expiratory time, respectively.
Table 2 reports the respiratory system compliance and resistance for the five constitutive models studied obtained from fitting the equation of motion to the PCV finite-element simulations. The respiratory system compliance displays a strong dependence on the constitutive model choice, with the highest values being associated to the CM1 model. We also note that the CM5 model results in a compliance that is one order of magnitude smaller than that of CM1. In the case of the resistance, small variations are observed among the constitutive models studied.
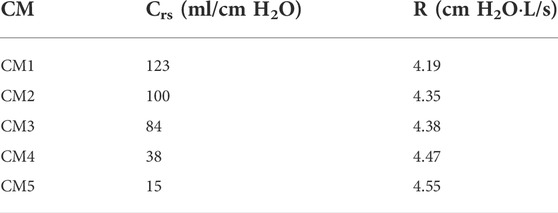
TABLE 2. Respiratory system compliance and resistance for each model from the adjustment of the equation of motion to the computed waveforms.
The predictions of lung respiratory signals generated by our finite-element model using the CM3 constitutive law were compared with those predicted by a single-compartment lung model described by Eq. 49 and Crs and R given by Table 2, see Figure 4.
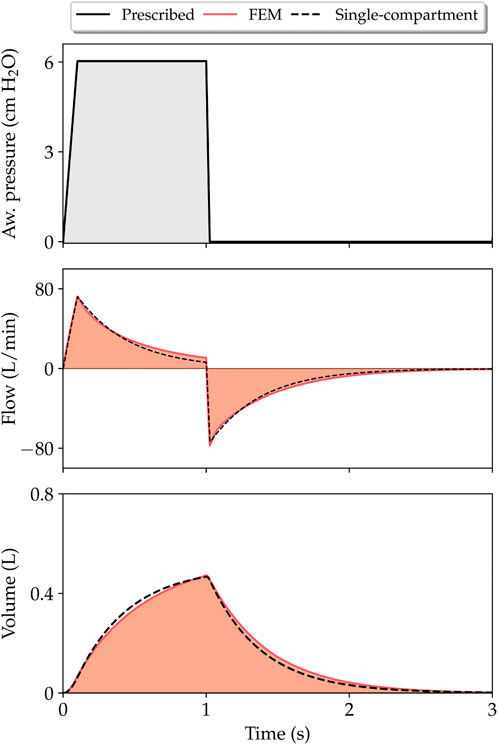
FIGURE 4. Comparison of respiratory variable evolution as predicted by finite-element simulations (CM3 model) and single-compartment model.
The temporal evolution of the jacobian and alveolar pressure fields during PCV respiratory cycle for all the constitutive models considered is reported in Figure 5. We studied three key time instants to make comparisons between the models analyzed: time of peak flow (t1 in Figure 3), time of peak volume/end of inspiration (t2 in Figure 3), and time when half of the expiration subcycle has passed (t3 in Figure 3). For the same time instant, significant differences in the amplitude and distribution of these fields are observed. In the case of jacobian fields, which give an account of the local volumetric changes occurring in the lung, we note that during peak lung volume instant t2, the largest values are achieved for the CM1 model, and the smallest values for the case of CM5, see Figure 5A. In contrast, the highest levels of alveolar pressure are achieved by CM5 during the peak lung volume, whereas the lowest magnitudes at the same time instants are achieved by the CM1 simulation.
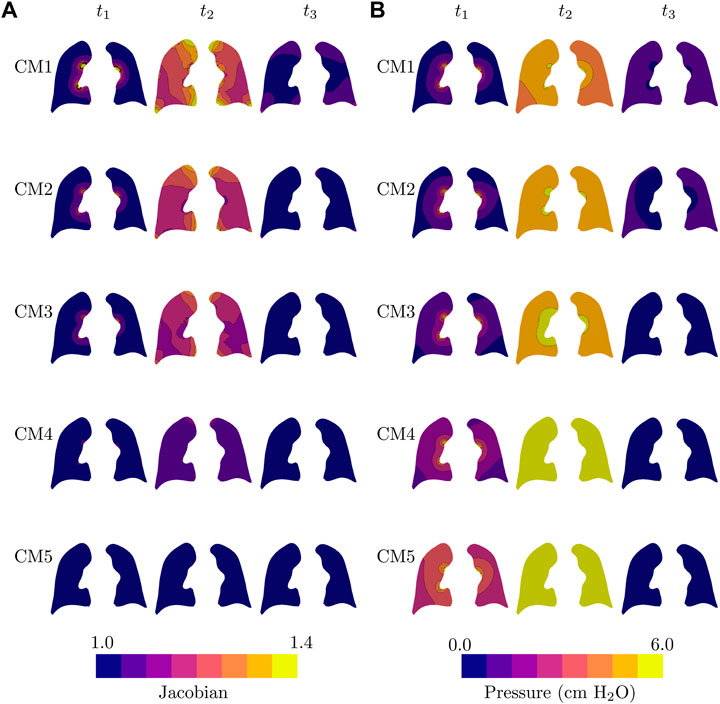
FIGURE 5. Temporal evolution of all lung models during one respiratory cycle of pressure-controlled mechanical ventilation: (A) jacobian field, and (B) alveolar pressure field. Fields are plotted in the current configuration.
To study the evolution of stress fields in our lung simulations, we considered the effective hydrostatic and von Mises stress tensor invariants (Sarabia-Vallejos et al., 2019; Álvarez-Barrientos et al., 2021)
and
with
Figure 6A reports the temporal evolution of the (effective) hydrostatic stress fields. Interestingly, at the time of peak volume (t1) we observe a significant variability in the levels of hydrostatic stress in the simulations considering different constitutive models, with CM5 resulting in the highest values. All the models present negligible hydrostatic stress in half of the expiration. Figure 6B shows the evolution of the (effective) von Mises stress. Simulations using CM1, CM2, CM3, and CM4 models predict heterogeneous distributions at peak lung volume, while CM5 does not display significant variations in the von Mises stress during the whole respiratory cycle.
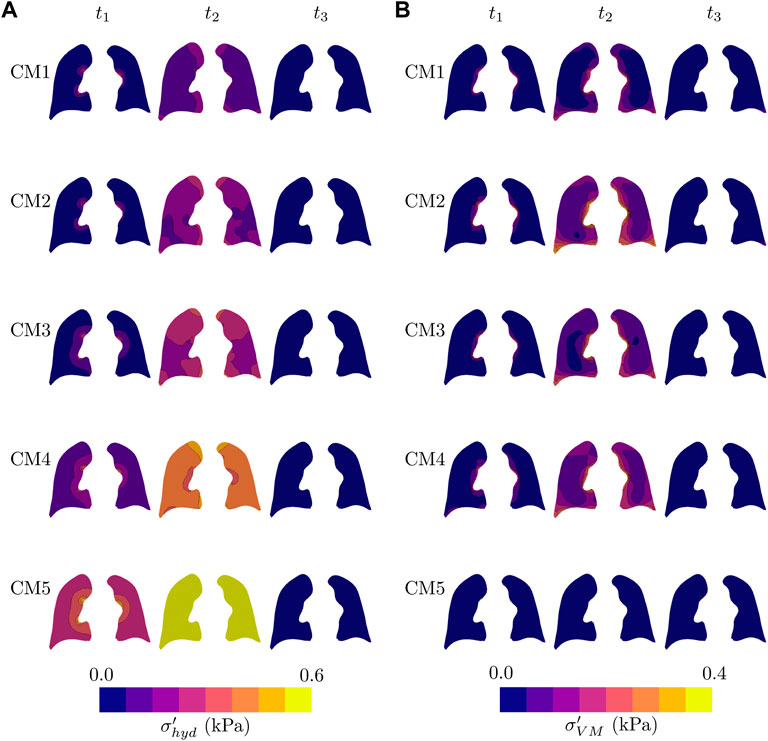
FIGURE 6. Temporal evolution of all lung models during one respiratory cycle of pressure-controlled mechanical ventilation: (A) Hydrostatic stress field, and (B) von Misses stress field. Fields are plotted in the current configuration.
The performance of our finite element model was also evaluated by predicting signals in the VCV mode. Figure 7 shows the airway pressure, flow, and volume signals for all the studied models. For this ventilation mode, the pressure during inspiration is not controlled by the mechanical ventilator, so its behavior is different for each constitutive model, with CM5 reaching the highest peak inspiratory pressure. During expiration, significant differences in flow and volume are observed between the constitutive models as a consequence of setting the pressure to zero.
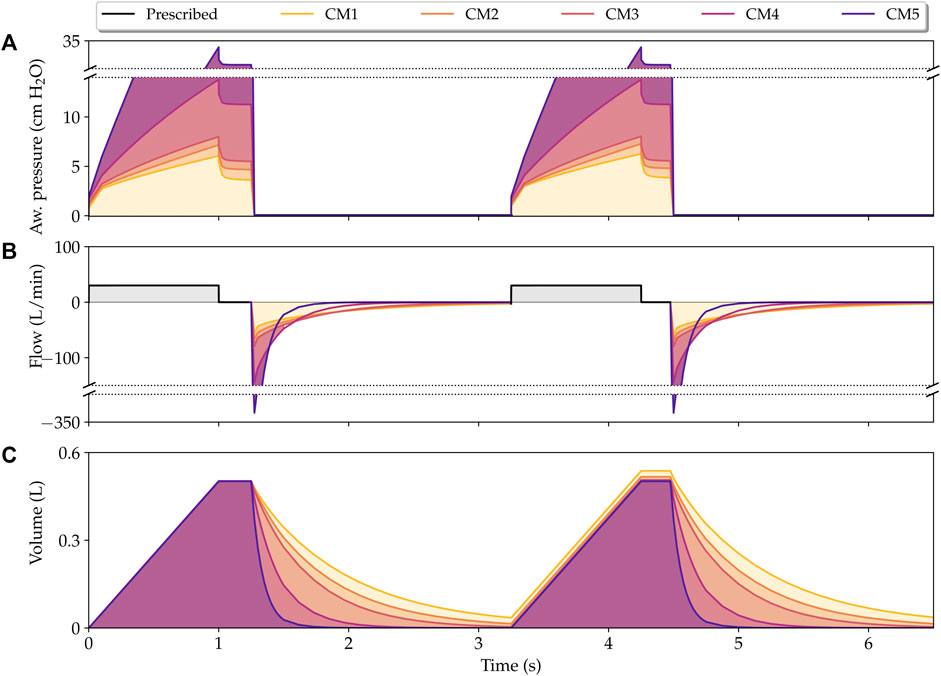
FIGURE 7. Simulation of lungs under volume-controlled mechanical ventilation. Physiological signals that describe the time evolution of airway pressure (A), flow (B), and volume (C) are shown for all constitutive models considered in this work. The y-axis was broken for the clarity of the plot.
Figure 8 shows the results from simulations of the supersyringe method. The time evolution of the airway pressure as a response to increments of inspiratory volume is shown in Figure 8A. We note that the CM5 simulation results in airway pressure increments that are significantly higher than the increments observed for other constitutive models. The CM1 simulation displays the smallest pressure increments, and together with the CM5 case they form an envelope for all other constitutive models. Figure 8B shows the P-V lung curves for all models analyzed. The case of the CM1 simulation results in the highest static compliance (highest slope of the P-V curve), while the CM5 simulation results in the lowest static compliance.
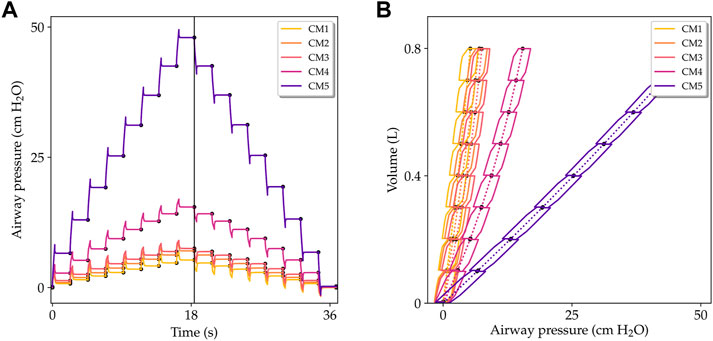
FIGURE 8. Simulation of lungs being studied with the supersyringe method. (A) Airway pressure versus time during the volume-controlled inflation-deflation protocol. (B) Pressure-volume curves for inflation and deflation processes. Solid lines show the pressure-volume evolution during the dynamic process. Dotted lines indicate the resulting quasi-static P-V curves for each constitutive model considered.
The lung compliance Cl obtained using different constitutive models is reported in Table 3. The highest and lowest lung compliances are delivered by CM1 and CM5, respectively. These extreme compliance values differ by on order of magnitude. The influence of the spring stiffness density on the compliance of the respiratory system and of the chest wall is shown in Figure 9. For the CM1 simulation, we observe a strong inverse relation between Crs and Ks. In contrast, in the case of the CM5 simulation we observe a weak dependence between these two parameters, as the Crs seems unaffected by changes in Ks. For all constitutive models considered, the chest-wall compliance displays roughly the same inverse relation with respect to the spring stiffness constant.
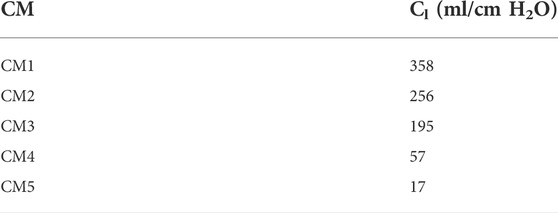
TABLE 3. Lung compliance for each model (unrestrained lung).
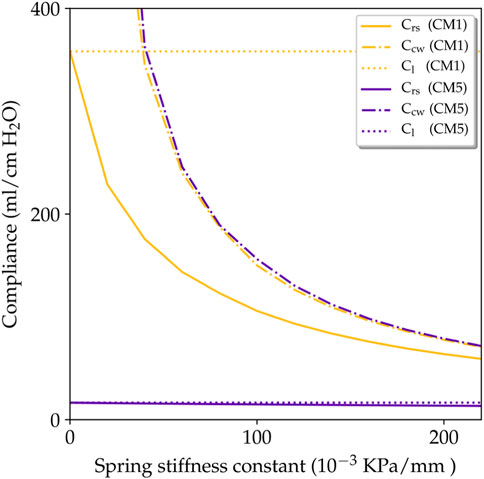
FIGURE 9. Influence of spring stiffness on the respiratory-system compliance Crs and chest-wall compliance Ccw.
4 Discussion
In this work, we present a continuum poroelastic framework for the construction of high-fidelity subject-specific lung mechanics simulations. A distinctive advantage of our formulation is that, by construction, it seamlessly couples gas flow and local tissue deformation. We show that our computational lung model is suitable for simulations of the interaction between a mechanical ventilator on a PCV mode and the lungs of a patient, for which we recover key physiological signals such as the flow and volume, see Figure 3. Remarkably, as we discuss below, the simulation signals predict the waveform and many of the distinctive features typically observed in signals from real patients connected to a ventilator, see (Hess, 2014; Major et al., 2018) for a complete review on mechanical ventilation from a clinical perspective. During the inspiratory phase, the pressure imposed by the ventilator rapidly reaches a prescribed pressure level, which translates into a peak flow that is captured by our simulations, see time instant t1 in Figure 3. After reaching the prescribed pressure, the airway pressure is maintained to a constant level by the ventilator, which causes a gradual reduction and decelerated flow until the end of inspiration in patients (Rittayamai et al., 2015). This behavior is also predicted by our model, see time interval [t1, t2] in Figure 3. After the inspiratory phase, the ventilator abruptly releases the airway pressure during expiration, which quickly triggers a negative flow peak caused by the passive elastic recoil forces produced by the lung that eventually reaches a resting condition (zero flow) (Rittayamai et al., 2015). This expiratory process is also captured by our simulations, see the evolution after t2 in Figure 3. Interestingly, at the end of the expiratory phase, the CM1 model is not able to empty the lung volume, trapping small volumes of air, which can be observed in the volume signal at time instants 3 and 6 s. The opposite occurs with CM4 and CM5, which reach a zero flow before 2 s. CM2 and CM3 reach a null flow at the end of expiration, resulting in predictions that correspond well to the behavior of a normal lung under mechanical ventilation. These results suggest that CM1 may not be an adequate model to capture the lung elastic recoil mechanism, which is critical during the expiration phase.
To compare our simulations to clinical conditions, we determined key physiological parameters that are typically assessed in patients undergoing mechanical ventilation, such as the respiratory-system compliance and resistance, see Table 2. Regarding the prediction of respiratory-system compliance, we remark that all five constitutive models studied in this work deliver very different estimates, which may differ by an order of magnitude. Previous clinical studies indicate that acceptable values for Crs range between 50 and 100 ml/cm H2O for MV patients (Hess, 2014). Taking these values as a reference, we conclude that for whole-lung simulations of a normal lung, the CM1 constitutive model delivers an abnormally soft mechanical response (too compliant). In contrast, the CM5 constitutive model results in an overly stiff behavior of the lung. Further, we conclude that lung tissue models CM2 and CM3 deliver respiratory-system compliance values that are in the reasonable range of normal compliance values. Regarding resistance, studies in normal human lungs connected to MV suggest that resistance is generally less than 10 cm H2O⋅L/s (Pham et al., 2017). The resistance values reported in Table 2 fall within this range. Interestingly, while the choice of constitutive model markedly affects the respiratory-system compliance, its impact on the resistance is low, as it can induce variations of less than 10%. This weak dependence is explained by the fact that in the continuum framework, alveolar flow is strongly driven by pressure gradients and modulated mainly by the permeability tensor, see Eq. 20. As an additional validation step, the lung flow and volume variables predicted by finite-element simulations were compared with traditional single-compartment models based on solving Eq. 49, see Figure 4. Interestingly, for a prescribed airway pressure signal, flow and volume waveforms and peak values predicted by these two models were very similar. This agreement confirms that the proposed poromechanical continuum framework captures the overall lung mechanical behavior that has long been represented by traditional single-compartment models, at the same time that it offers a connection between whole-organ response and regional mechanisms as we discuss next.
One of the salient features of our continuum framework is its ability to predict 3D fields of relevant physical quantities. The local volume change, represented by the jacobian field in Figure 5A, shows that CM1, CM2, and CM3 simulations predict for the end of inspiration (t2) a very non-uniform distribution of volumetric change, presenting the apical segments, and the areas near to the costophrenic and cardiophrenic angles the most significant deformations. In contrast, the CM5 simulation results in roughly no volumetric deformations during the ventilation cycle, as the Jacobian field at t1, t2 and t3 are homogeneous and close to 1.0 everywhere. The Jacobian of CM4 is also quite uniform, with small increases in the apical segment in t2. These observations are in line with the peak lung volumes observed in Figure 3. We remark that spatial heterogeneity in volumetric strain fields has been reported in human lungs using image-based strain analysis methods (Amelon et al., 2011; Hurtado et al., 2017b). However, a direct comparison may be inconsistent, as these studies were carried out in subjects breathing spontaneously and in maximal effort, which physiologically differs from lungs connected to MV. In the case of alveolar pressure, less heterogeneity is observed in the distribution predicted by the different constitutive models, see Figure 5B. For CM5, the alveolar pressure almost immediately after the ventilator pressure rise, reaching in t1 values close to half of the peak inspiratory pressure in much of the coronal view presented, while in t2 the maximum pressure is uniformly reached. A similar distribution in t2 is achieved by CM4, even though its values in t1 are lower than those in CM5. In contrast, CM1, CM2, and CM3 present a non-uniform alveolar pressure distribution in t2. From this, we note that the choice of the constitutive model also affects the pressure field distribution, although its effects seem to be less than the impact on the volume change.
The time evolution of stress fields was also studied in this work, see Figure 6. We observe that during peak lung flow (t1), the hydrostatic stress displays a radial gradient, with the area near the airways boundary presenting the highest values of hydrostatic stress, see Figure 6A. At the end of inspiration, a heterogeneous distribution is reached, with the zones with the most significant tension being the areas with bigger volumetric change (see Figure 5A). Interestingly, the stiffest model (CM5) achieves the highest hydrostatic stress, being highly uniform en t2. Also, in the midtime of the expiratory phase (t3), all the models present negligible hydrostatic stress in the coronal view reported. An analysis of the evolution of the von Mises stress shows a rise and fall in stress levels for all models during the respiratory cycle, with the notable exception of the highly rigid CM5, for which the deviatoric component of stress seems to be negligible and insensitive of the MV stimulus, see Figure 6B. The areas with the most significant values are those close to the lung surface; see the zones near to the edges in the coronal view at t2. From the above, we conclude that our model can capture not only the stresses related to volumetric changes in the lung but also the existence of shear-related stresses. However, for a healthy lung, these values appear to be less than the stresses associated with volumetric changes.
The interaction between the mechanical ventilator in VCV mode and the lungs of a patient was also analyzed by constructing the key physiological signals such as the airway pressure, flow, and volume, as shown in Figure 7. During the inspiratory phase, a fast rise in pressure is caused by the square wave of flow during the first few moments of inspiration, followed by a quasi-linear increase in airway pressure until it reaches the peak inspiratory pressure. Remarkably, the PIP reached by CM5 is extremely large compared to the other models, reaching more than 30 cm H2O, a value that, in previous studies (Vasilyev et al., 1995; Yang et al., 2011; Walter et al., 2018) has been associated with an upper limit of pressure for a protective mechanical ventilation. In this context, CM5 also does not seem to be a suitable model to model a healthy human lung in VCV as it requires very high pressures to be able to enter a (normal) tidal volume of 500 ml. Although the other models reach lower peak pressures, there are also considerable differences between them, which is justifiable given the difference in stiffness of each constitutive model, which can be represented in the form of compliance as shown in Table 2. After reaching PIP, thanks to flow restriction during the inspiratory pause, the lung comes to a quasi-static state, as observed in clinical mechanically ventilated patients (Ball et al., 2015). This quasi-static state is characterized by the decrease in peak inspiratory pressure to a steady state value known as plateau pressure (Pplat). Interestingly, the drop from PIP to Pplat is similar for all constitutive models, despite the differences in stiffness and pressures achieved. According to clinical studies (Hess, 2014), this decrease is attributed to resistance. As previously noted, in this work, the resistance has mainly been taken into account through the permeability tensor, which has been chosen as a constant for all the constitutive models, explaining the same drop pressure. Also, we emphasize that in the VCV simulation, the system respiratory compliance and airway resistance can be estimated using the value of the pressure, flow, and volume variables during the inspiratory pause (see for example Singer and Corbridge (2009)) or employing the least squares fit approach presented. At the end of the inspiratory pause, the expiratory valve is open, and a negative peak flow is reached, which, consistent with the PIP value, is exceptionally high for CM5. Then, the volume reduces exponentially, with CM4 and CM5 being the fastest models to expel inspired air. In contrast, due to the elastic recoil discussed previously, CM1 traps air volumes at the expiration’s end, which results in an increase in volume during the second respiratory cycle. On the other hand, CM2 and CM3 seem to represent better the behavior of a normal human lung under the VCV conditions considered.
Our lung model was also studied in the simulation of traditional assessment techniques in respiratory physiology such as the supersyringe method for the construction of P-V curves (West, 2012). We remark that the simulation of airway pressure during the volume-controlled inflation and deflation phases shown in Figure 8 recovers many features observed in experimental setups (Harris, 2005; Ganzert et al., 2009). For example, during each inflation step, the airway pressure rapidly peaks, followed by an asymptotic decrease that reaches a steady-state airway pressure value, see Figure 8A. An opposite trend is observed during the deflation process. P-V curves resulting from this simulated experiment are collected in Figure 8B for all the constitutive models studied. The steady-state P-V curve, constructed by joining all the points that correspond to steady-state pressure, is shown in dotted line. We readily observe marked differences in static compliance, defined as the slope of steady-state P-V curves, that depends on the constitutive model employed. Similarly to the MV case, the CM1 simulation results in the most compliant (softest) case, whereas the CM5 model delivers the least compliant (stiffest) response. We further note that, in contrast to experimental P-V curves, the quasi-static curves of inflation and deflation are the same, and the simulated response does not capture the quasi-static hysteretic response of normal lungs (Escolar and Escolar, 2004; Steimle et al., 2011). This result is to be expected, as constitutive models considered in our poromechanical framework are hyperelastic, and no dissipative stress contributions have been included in the model. This represents an important limitation of the current contribution that should be addressed in future developments.
Figure 9 shows the relationship between the spring stiffness constant and the different compliance parameters, as predicted by our simulations. For the case of CM1, an inverse relation between Ks and Crs was found, suggesting that the stiffness provided by the thoracic cage modulates the global elastic response of the respiratory system. In high contrast, the case of CM5 results in a respiratory-system compliance that is independent of the value of Ks. This may be understood by examining Eq. 53, where a very low lung compliance, as that reported in Table 3, dominates over the chest-wall compliance. This in turn, forces Crs respiratory-system to approach Cl, which is indeed what we recover in Figure 9. Despite these large differences caused by the choice of constitutive model, we highlight that the chest-wall compliance Cw is not affected by the choice of constitutive model, see the dash-dotted lines in Figure 9. This independence allows to define the patient-specific chest-wall compliance only through the Ks parameter, which simplifies the personalization of lung models. Chest-wall compliance can be highly variable depending on the underlying pathology of each patient. For example, chest-wall compliance values of 200 ml/cm H2O have been reported for normal subjects (Lumb, 2017), while obese subjects have presented chest-wall compliance of 77 ml/cm H2O (Naimark and Cherniack, 1960). Our model can recover both cases using a value of Ks close to 80 ⋅ 10–3 kPa/mm and 200 ⋅ 10–3 kPa/mm, respectively.
This contribution represents a definite proof of concept that computational models of the lung can be used to simulate clinically-relevant procedures in respiratory medicine. Our work has several limitations that offer key opportunities for improvement and future developments. First, our framework models the interaction of the lung with surrounding structures by using distributed spring elements with the same stiffness. It is important to note that around the lung different muscles, organs, and bone structures will have different stiffness. In addition, our model does not consider the lubricating effect of the pleural fluid that lies in the pleural cavity between the lung and the chest wall. Recent works in the literature have modeled this interaction under quasi-static conditions by means of sliding contact elements (Patte et al., 2022b), which may constitute future additions to our lung model to account for the sliding mechanism. Second, in modeling the lung we have considered a stress-free reference configuration constructed from CT images of resting lungs. However, real lungs in resting conditions bear residual stresses that are caused by the transpulmonary pressure necessary to avoid alveolar collapse (Suki et al., 2011). Introducing residual stresses has been approached in former contributions (Tawhai et al., 2009; Berger et al., 2016; Patte et al., 2022b), but the validity of these approaches remains to be confirmed, as a definite experimental study of residual stresses in real lungs remains unexplored. Third, our simulations only consider hyperelastic constitutive models that neglect the hysteretic behavior of lung tissue due to alveolar surfactant (Andreassen et al., 2010). We note that surface-tension effects have been previously incorporate into micromechanical model of single alveolus (Denny and Schroter, 2000; Wiechert et al., 2009). Future developments may upscale these alveolar models into continuum formulations to account for surface-tension effects in the whole-lung response (Concha et al., 2018; Concha and Hurtado, 2020). Further, constitutive parameters were set constant throughout the lung, an assumption that may not adequate to capture the variability observed in clinical conditions. To further personalized the proposed model, parameter values and their spatial distribution could be estimated from available clinical data and image information using inverse-analysis techniques (Patte et al., 2022a). Fourth, while our model has been validated by comparing global parameters such as respiratory compliance and resistance to values reported in the literature, regional values of strain and stress predicted by our simulations remain to be validated. To the best of our knowledge, there are currently no studies that report regional deformation in normal lungs connected to mechanical ventilation. An interesting approach would be to simulate spontaneous breathing triggered by diaphragmatic motion and compare our model predictions to strain fields in normal human lungs determined from image registration (Amelon et al., 2011; Hurtado et al., 2017b). This poses the challenge of determining accurate boundary conditions for uncontrollable breathing efforts. Additional validation efforts may also consider the evolution of regional ventilation, which can be approximated by the porosity field. Finally, we note that our work has focused on clinical conditions where the respiratory activity is highly controllable. Future developments should study the applicability of our lung model to other respiratory conditions, e.g., spontaneous breathing. Given the uncontrolled nature of spontaneous breathing, extending our model to this case will required precise measurements of the dynamic boundary conditions acting on the lung surface, such as the pleural, diaphragmatic, and abdominal pressures. One promising approach to reaching this objective may be the use of organosynthetic lung simulators, which have been recently reported in the literature and enable precise measurements of these important physiological variables that are difficult to monitor in vivo (Horvath et al., 2020).
Data availability statement
The raw data supporting the conclusion of this article will be made available by the authors, without undue reservation.
Author contributions
NA-R and DH designed and developed the theoretical framework, numerical schemes, computer algorithms, and numerical experiments. NA-R coded the implementation and ran simulations. NA-R and DH wrote the manuscript draft. DH reviewed the final version of the manuscript.
Funding
This work received financial support from the Chilean National Agency for Research and Development (ANID) through grant FONDECYT Regular #1220465. NA-R acknowledges the support of the graduate fellowship ANID BECAS/DOCTORADO NACIONAL 21212320.
Conflict of interest
The authors declare that the research was conducted in the absence of any commercial or financial relationships that could be construed as a potential conflict of interest.
Publisher’s note
All claims expressed in this article are solely those of the authors and do not necessarily represent those of their affiliated organizations, or those of the publisher, the editors and the reviewers. Any product that may be evaluated in this article, or claim that may be made by its manufacturer, is not guaranteed or endorsed by the publisher.
References
Álvarez-Barrientos F., Hurtado D. E., Genet M. (2021). Pressure-driven micro-poro-mechanics : A variational framework for modeling the response of porous materials. Int. J. Eng. Sci. 169, 103586. doi:10.1016/j.ijengsci.2021.103586
Amelon R. E., Cao K., Ding K., Christensen G. E., Reinhardt J. M., Raghavan M. L. (2011). Three-dimensional characterization of regional lung deformation. J. Biomech. 44, 2489–2495. doi:10.1016/j.jbiomech.2011.06.009
Andreassen S., Steimle K. L., Mogensen M. L., Serna J. B. D. L., Rees S., Karbing D. S. (2010). The effect of tissue elastic properties and surfactant on alveolar stability. J. Appl. Physiol. 109, 1369–1377. doi:10.1152/japplphysiol.00844.2009
Arunachalam G. R., Chiew Y. S., Tan C. P., Ralib A. M., Nor M. B. M. (2020). Patient asynchrony modelling during controlled mechanical ventilation therapy. Comput. Methods Programs Biomed. 183, 105103. doi:10.1016/j.cmpb.2019.105103
Ashworth L., Norisue Y., Koster M., Anderson J., Takada J., Ebisu H. (2018). Clinical management of pressure control ventilation: An algorithmic method of patient ventilatory management to address “forgotten but important variables”. J. Crit. Care 43, 169–182. doi:10.1016/j.jcrc.2017.08.046
Ball L., Dameri M., Pelosi P. (2015). Modes of mechanical ventilation for the operating room. Best. Pract. Res. Clin. Anaesthesiol. 29, 285–299. doi:10.1016/j.bpa.2015.08.003
Bates J. H. (2009). Lung mechanics: an inverse modeling approach. Cambridge: Cambridge University Press.
Bel-Brunon A., Kehl S., Martin C., Uhlig S., Wall W. (2014). Numerical identification method for the non-linear viscoelastic compressible behavior of soft tissue using uniaxial tensile tests and image registration–application to rat lung parenchyma. J. Mech. Behav. Biomed. Mat. 29, 360–374. doi:10.1016/j.jmbbm.2013.09.018
[Dataset] Bellani G. (2022). Mechanical ventilation from pathophysiology to clinical evidence. Cham, Switzerland: Springer.
Berger L., Bordas R., Burrowes K., Grau V., Tavener S., Kay D. (2016). A poroelastic model coupled to a fluid network with applications in lung modelling. Int. J. Numer. Method. Biomed. Eng. 32, e02731. doi:10.1002/cnm.2731
Birzle A. M., Martin C., Uhlig S., Wall W. A. (2019). A coupled approach for identification of nonlinear and compressible material models for soft tissue based on different experimental setups–exemplified and detailed for lung parenchyma. J. Mech. Behav. Biomed. Mat. 94, 126–143. doi:10.1016/j.jmbbm.2019.02.019
Birzle A. M., Martin C., Yoshihara L., Uhlig S., Wall W. A. (2018). Experimental characterization and model identification of the nonlinear compressible material behavior of lung parenchyma. J. Mech. Behav. Biomed. Mat. 77, 754–763. doi:10.1016/j.jmbbm.2017.08.001
Chapelle D., Moireau P. (2014). General coupling of porous flows and hyperelastic formulations—From thermodynamics principles to energy balance and compatible time schemes. Eur. J. Mech. - B/Fluids 46, 82–96. doi:10.1016/j.euromechflu.2014.02.009
Chase J. G., Preiser J.-C., Dickson J. L., Pironet A., Chiew Y. S., Pretty C. G., et al. (2018). Next-generation, personalised, model-based critical care medicine: A state-of-the art review of in silico virtual patient models, methods, and cohorts, and how to validation them. Biomed. Eng. Online 17, 24–29. doi:10.1186/s12938-018-0455-y
Chiew Y. S., Tan C. P., Chase J. G., Chiew Y. W., Desaive T., Ralib A. M., et al. (2018). Assessing mechanical ventilation asynchrony through iterative airway pressure reconstruction. Comput. Methods Programs Biomed. 157, 217–224. doi:10.1016/j.cmpb.2018.02.007
Choo J. (2018). Large deformation poromechanics with local mass conservation: An enriched galerkin finite element framework. Int. J. Numer. Methods Eng. 116, 66–90. doi:10.1002/nme.5915
Concha F., Hurtado D. E. (2020). Upscaling the poroelastic behavior of the lung parenchyma: A finite-deformation micromechanical model. J. Mech. Phys. Solids 145, 104147. doi:10.1016/j.jmps.2020.104147
Concha F., Sarabia-Vallejos M., Hurtado D. E. (2018). Micromechanical model of lung parenchyma hyperelasticity. J. Mech. Phys. Solids 112, 126–144. doi:10.1016/j.jmps.2017.11.021
Denny E., Schroter R. (2000). Viscoelastic behavior of a lung alveolar duct model. J. Biomech. Eng. 122, 143–151. doi:10.1115/1.429644
Escolar J. D., Escolar A. (2004). Lung histeresis: A morphological view. Histol. Histopathol. 19 (1), 159–166. doi:10.14670/HH-19.159
Fung Y.-C. (1974). A theory of elasticity of the lung. J. Appl. Mech. 41, 8–14. doi:10.1115/1.3423281
Ganzert S., Möller K., Steinmann D., Schumann S., Guttmann J. (2009). Pressure-dependent stress relaxation in acute respiratory distress syndrome and healthy lungs: An investigation based on a viscoelastic model. Crit. Care 13, R1999. doi:10.1186/cc8203
Gao J., Huang W., Yen R. (2006). Mechanical properties of human lung parenchyma. Biomed. Sci. Instrum. 42, 172–180.
Grasselli G., Cattaneo E., Florio G., Ippolito M., Zanella A., Cortegiani A., et al. (2021). Mechanical ventilation parameters in critically ill Covid-19 patients: A scoping review. Crit. Care 25, 115. doi:10.1186/s13054-021-03536-2
Harris R. S. (2005). Pressure-volume curves of the respiratory system. Respir. Care 50, 78–98; discussion 98-99.
Hess D. R. (2014). Respiratory mechanics in mechanically ventilated patients. Respir. Care 59, 1773–1794. doi:10.4187/respcare.03410
Horvath M. A., Hu L., Mueller T., Hochstein J., Rosalia L., Hibbert K. A., et al. (2020). An organosynthetic soft robotic respiratory simulator. Apl. Bioeng. 4, 026108. doi:10.1063/1.5140760
Hurtado D. E., Castro S., Madrid P. (2017a). Uncertainty quantification of 2 models of cardiac electromechanics. Int. J. Numer. Method. Biomed. Eng. 33, e2894. doi:10.1002/cnm.2894
Hurtado D. E., Villarroel N., Andrade C., Retamal J., Bugedo G., Bruhn A. R. (2017b). Spatial patterns and frequency distributions of regional deformation in the healthy human lung. Biomech. Model. Mechanobiol. 16, 1413–1423. doi:10.1007/s10237-017-0895-5
Hurtado D. E., Villarroel N., Retamal J., Bugedo G., Bruhn A. (2016). Improving the accuracy of registration-based biomechanical analysis: A finite element approach to lung regional strain quantification. IEEE Trans. Med. Imaging 35, 580–588. doi:10.1109/TMI.2015.2483744
Hurtado D. E., Zavala P. (2021). Accelerating cardiac and vessel mechanics simulations : An energy-transform variational formulation for soft-tissue hyperelasticity. Comput. Methods Appl. Mech. Eng. 379, 113764. doi:10.1016/j.cma.2021.113764
Koh S. O. (2007). Mode of mechanical ventilation: Volume controlled mode. Crit. Care Clin. 23, 161–167. doi:10.1016/j.ccc.2006.11.014
Kowalczyk P. (1993). Mechanical model of lung parenchyma as a two-phase porous medium. Transp. Porous Media 11, 281–295. doi:10.1007/bf00614816
Lange N. R., Schuster D. P. (1999). The measurement of lung water. Crit. Care 3, R19–R24. doi:10.1186/cc342
Li C., Borja R. I., Regueiro R. A. (2004). Dynamics of porous media at finite strain. Comput. methods Appl. Mech. Eng. 193, 3837–3870. doi:10.1016/j.cma.2004.02.014
Alnaes M. S., Blechta J., Hake J., Johansson A., Kehlet B., Logg A., et al. (2015). The FEniCS project version 1.5. Arch. Numer. Software 3 (100). doi:10.11588/ans.2015.100.20553
Lumb A. B. (2017). “Elastic forces and lung volumes,” in Nunn's Applied Respiratory Physiology. 8th Edn, Editor A. B. Lumb. (Elsevier), Chap. 2, 17–32.e1. doi:10.1016/B978-0-7020-6294-0.00002-2 Available at: https://www.sciencedirect.com/science/article/pii/B9780702062940000022
Ma B., Breen B., Bates J. H. (2013). Influence of parenchymal heterogeneity on airway-parenchymal interdependence. Respir. Physiol. Neurobiol. 188, 94–101. doi:10.1016/j.resp.2013.06.005
MacMinn C. W., Dufresne E. R., Wettlaufer J. S. (2016). Large deformations of a soft porous material. Phys. Rev. Appl. 5, 044020. doi:10.1103/physrevapplied.5.044020
Major V. J., Chiew Y. S., Shaw G. M., Chase J. G. (2018). Biomedical engineer’s guide to the clinical aspects of intensive care mechanical ventilation. Biomed. Eng. Online 17, 169. doi:10.1186/s12938-018-0599-9
McKibben A. W., Ravenscraft S. A. (1996). Pressure-controlled and volume-cycled mechanical ventilation. Clin. Chest Med. 17, 395–410. doi:10.1016/s0272-5231(05)70323-3
Morton S. E., Dickson J., Chase J. G., Docherty P., Desaive T., Howe S. L., et al. (2018). A virtual patient model for mechanical ventilation. Comput. Methods Programs Biomed. 165, 77–87. doi:10.1016/j.cmpb.2018.08.004
Morton S. E., Knopp J. L., Tawhai M. H., Docherty P., Heines S. J., Bergmans D. C., et al. (2020). Prediction of lung mechanics throughout recruitment maneuvers in pressure-controlled ventilation. Comput. Methods Programs Biomed. 197, 105696. doi:10.1016/j.cmpb.2020.105696
Naimark A., Cherniack R. (1960). Compliance of the respiratory system and its components in health and obesity. J. Appl. Physiol. 15, 377–382. doi:10.1152/jappl.1960.15.3.377
Nichols D., Haranath S. (2007). Pressure control ventilation. Crit. Care Clin. 23, 183–199. doi:10.1016/j.ccc.2006.12.005
Patte C., Brillet P.-Y., Fetita C., Bernaudin J.-F., Gille T., Nunes H., et al. (2022a). Estimation of regional pulmonary compliance in idiopathic pulmonary fibrosis based on personalized lung poromechanical modeling. J. Biomech. Eng. 144, 091008. doi:10.1115/1.4054106
Patte C., Genet M., Chapelle D. (2022b). A quasi-static poromechanical model of the lungs. Biomech. Model. Mechanobiol. 21, 527–551. doi:10.1007/s10237-021-01547-0
Pham T., Brochard L. J., Slutsky A. S. (2017). Mechanical ventilation: State of the art. Mayo Clin. Proc. 92, 1382–1400. Elsevier. doi:10.1016/j.mayocp.2017.05.004
Pozin N., Montesantos S., Katz I., Pichelin M., Vignon-Clementel I., Grandmont C. (2017). A tree-parenchyma coupled model for lung ventilation simulation. Int. J. Numer. Method. Biomed. Eng. 33, e2873. doi:10.1002/cnm.2873
Rausch S., Martin C., Bornemann P., Uhlig S., Wall W. (2011). Material model of lung parenchyma based on living precision-cut lung slice testing. J. Mech. Behav. Biomed. Mat. 4, 583–592. doi:10.1016/j.jmbbm.2011.01.006
Rittayamai N., Katsios C. M., Beloncle F., Friedrich J. O., Mancebo J., Brochard L. (2015). Pressure-controlled vs volume-controlled ventilation in acute respiratory failure: A physiology-based narrative and systematic review. Chest 148, 340–355. doi:10.1378/chest.14-3169
Roth C. J., Ismail M., Yoshihara L., Wall W. A. (2017a). A comprehensive computational human lung model incorporating inter-acinar dependencies: Application to spontaneous breathing and mechanical ventilation. Int. J. Numer. Method. Biomed. Eng. 33, e02787. doi:10.1002/cnm.2787
Roth C. J., Yoshihara L., Ismail M., Wall W. A. (2017b). Computational modelling of the respiratory system: Discussion of coupled modelling approaches and two recent extensions. Comput. Methods Appl. Mech. Eng. 314, 473–493. doi:10.1016/j.cma.2016.08.010
Sarabia-Vallejos M. A., Ayala-jeria P., Hurtado D. E. (2021). Three-Dimensional whole-organ characterization of the regional alveolar morphology in normal murine lungs. Front. Physiol. 12, 755468. doi:10.3389/fphys.2021.755468
Sarabia-Vallejos M. A., Zuñiga M., Hurtado D. E. (2019). The role of three-dimensionality and alveolar pressure in the distribution and amplification of alveolar stresses. Sci. Rep. 9, 8783. doi:10.1038/s41598-019-45343-4
Singer B. D., Corbridge T. C. (2009). Basic invasive mechanical ventilation. South. Med. J. 102, 1238–1245. doi:10.1097/SMJ.0b013e3181bfac4f
Singer B. D., Corbridge T. C. (2011). Pressure modes of invasive mechanical ventilation. South. Med. J. 104, 701–709. doi:10.1097/SMJ.0b013e31822da7fa
Steimle K. L., Mogensen M. L., Karbing D. S., de la Serna J. B., Andreassen S. (2011). A model of ventilation of the healthy human lung. Comput. Methods Programs Biomed. 101, 144–155. doi:10.1016/j.cmpb.2010.06.017
Stenqvist O., Odenstedt H., Lundin S. (2008). Dynamic respiratory mechanics in acute lung injury/acute respiratory distress syndrome: Research or clinical tool? Curr. Opin. Crit. Care 14, 87–93. doi:10.1097/MCC.0b013e3282f3a166
Suki B., Stamenovic D., Hubmayr R. (2011). Lung parenchymal mechanics. Compr. Physiol. 1, 1317–1351. doi:10.1002/cphy.c100033
Sun W., Ostien J. T., Salinger A. G. (2013). A stabilized assumed deformation gradient finite element formulation for strongly coupled poromechanical simulations at finite strain. Int. J. Numer. Anal. Methods Geomech. 37, 2755–2788. doi:10.1002/nag.2161
Swan A. J., Clark A. R., Tawhai M. H. (2012). A computational model of the topographic distribution of ventilation in healthy human lungs. J. Theor. Biol. 300, 222–231. doi:10.1016/j.jtbi.2012.01.042
Tawhai M. H., Bates J. H. (2011). Multi-scale lung modeling. J. Appl. Physiol. 110, 1466–1472. doi:10.1152/japplphysiol.01289.2010
Tawhai M. H., Nash M. P., Lin C.-L., Hoffman E. A. (2009). Supine and prone differences in regional lung density and pleural pressure gradients in the human lung with constant shape. J. Appl. Physiol. 107, 912–920. doi:10.1152/japplphysiol.00324.2009
Fabri A., Pion S. (2009). “CGAL: The computational geometry algorithms library,” in Proceedings of the 17th ACM SIGSPATIAL international conference on advances in geographic information systems, 538–539.
Vasilyev S., Schaap R. N., Mortensen J. (1995). Hospital survival rates of patients with acute respiratory failure in modern respiratory intensive care units: An international, multicenter, prospective survey. Chest 107, 1083–1088. doi:10.1378/chest.107.4.1083
Vuong A.-T., Yoshihara L., Wall W. (2015). A general approach for modeling interacting flow through porous media under finite deformations. Comput. Methods Appl. Mech. Eng. 283, 1240–1259. doi:10.1016/j.cma.2014.08.018
Walter J. M., Corbridge T. C., Singer B. D. (2018). Invasive mechanical ventilation. South. Med. J. 111, 746–753. doi:10.14423/SMJ.0000000000000905
West J. B. (2012). Respiratory physiology: The essentials. ninth edition edn. Philadelphia: Lippincott Williams & Wilkins.
Wiechert L., Metzke R., Wall W. A. (2009). Modeling the mechanical behavior of lung tissue at the microlevel. J. Eng. Mech. 135, 434–438. doi:10.1061/(asce)0733-9399(2009)135:5(434)
[Dataset] Worldometers D. (2022). Coronavirus update. Available at: https://www.worldometers.info/coronavirus/(Accessed June 29, 2022).
Wunsch H. (2020). Mechanical ventilation in COVID-19: interpreting the current epidemiology. Am. J. Respir. Crit. Care Med. 202 (1), 1–4. doi:10.1164/rccm.202004-1385ED
Yang M., Ahn H. J., Kim K., Kim J. A., Chin A. Y., Kim M. J., et al. (2011). Does a protective ventilation strategy reduce the risk of pulmonary complications after lung cancer surgery?: A randomized controlled trial. Chest 139, 530–537. doi:10.1378/chest.09-2293
Yoshihara L., Roth C. J., Wall W. A. (2017). Fluid-structure interaction including volumetric coupling with homogenised subdomains for modeling respiratory mechanics. Int. J. Numer. Method. Biomed. Eng. 33, e2812. doi:10.1002/cnm.2812
Yushkevich P. A., Piven J., Cody Hazlett H., Gimpel Smith R., Ho S., Gee J. C., et al. (2006). User-guided 3D active contour segmentation of anatomical structures: Significantly improved efficiency and reliability. Neuroimage 31, 1116–1128. doi:10.1016/j.neuroimage.2006.01.015
Keywords: mechanical ventilation, lung modeling, respiratory mechanics, poroelasticity, pressure-volume curve
Citation: Avilés-Rojas N and Hurtado DE (2022) Whole-lung finite-element models for mechanical ventilation and respiratory research applications. Front. Physiol. 13:984286. doi: 10.3389/fphys.2022.984286
Received: 01 July 2022; Accepted: 12 September 2022;
Published: 04 October 2022.
Edited by:
Soroush Safaei, The University of Auckland, New ZealandReviewed by:
Haribalan Kumar, The University of Auckland, New ZealandCong Zhou, Northwestern Polytechnical University, China
Copyright © 2022 Avilés-Rojas and Hurtado. This is an open-access article distributed under the terms of the Creative Commons Attribution License (CC BY). The use, distribution or reproduction in other forums is permitted, provided the original author(s) and the copyright owner(s) are credited and that the original publication in this journal is cited, in accordance with accepted academic practice. No use, distribution or reproduction is permitted which does not comply with these terms.
*Correspondence: Daniel E. Hurtado, dhurtado@ing.puc.cl