
- 1 Department of Information Engineering, Second University of Naples, Aversa, Italy
- 2 Institute Computational Physics for Engineering Materials, Eidgenössische Technische Hochschule, Zürich, Switzerland
- 3 Departamento de Física, Universidade Federal do Ceará, Fortaleza, Brazil
Neuronal avalanches are a novel mode of activity in neuronal networks, experimentally found in vitro and in vivo, and exhibit a robust critical behavior: these avalanches are characterized by a power law distribution for the size and duration, features found in other problems in the context of the physics of complex systems. We present a recent model inspired in self-organized criticality, which consists of an electrical network with threshold firing, refractory period, and activity-dependent synaptic plasticity. The model reproduces the critical behavior of the distribution of avalanche sizes and durations measured experimentally. Moreover, the power spectra of the electrical signal reproduce very robustly the power law behavior found in human electroencephalogram (EEG) spectra. We implement this model on a variety of complex networks, i.e., regular, small-world, and scale-free and verify the robustness of the critical behavior.
1. Introduction
The activity in neuronal networks consists in one or more action potentials in a single neuron or an ensemble of neurons. The first case is typical for small networks, as some experimental systems in vitro, where isolated spikes can be observed. The presence of a number of action potentials in an ensemble of neurons not always is a consequence of an external stimulus. Neuronal systems exhibit an intense spontaneous activity, known since a long time, whose relation with the response to stimulation is not fully understood yet. It is however well established that spontaneous activity cannot be simply reduced to a background noise uncorrelated to the system response. Indeed, experimental results for the cat visual cortex (Arieli et al., 1996) have shown that the intensity of the response to an external stimulus is roughly proportional to the intensity of the spontaneous activity state of the system when the stimulus is applied. The variability in the response provided to the repeated application of the same stimulus is therefore caused by the different levels of ongoing activity. A similar analysis has been performed at the intracellular level on the same system, confirming that the spatio-temporal structure of the spontaneous activity influences the response signal (Azouz and Gray, 1999).
The typical form of spontaneous activity consists in the almost synchronous emission of action potentials in a large number of neurons, followed by periods of substantial inactivity. These high activity events, named bursts, are observed both during development and in mature systems and can last from a few to several hundreds milliseconds. Conversely, the quiet periods can last seconds and have been attributed to a variety of mechanisms: The decrease in the available neurotransmitter (Stevens and Tsujimoto, 1995; Staley et al., 1998); the presence of an inhibitory factor leading to a disabilitation of the neurotransmitter release (Stevens and Tsujimoto, 1995; Staley et al., 1998); the inactivation, or remodulation of the response, of the glutamate receptors (Maeda et al., 1995). An alternative form of temporal organization is slow oscillations between high activity and low activity states with a typical frequency of 0.3–1 Hz. The temporal organization of this spontaneous activity has been characterized by the distribution of inter-times, i.e., the temporal intervals between successive bursts or successive spikes (Segev et al., 2002).
In 2003 Beggs and Plenz have identified a novel form of spontaneous activity, neuronal avalanches (Beggs and Plenz, 2003, 2004). Coronal slices of rat somatosensory cortex were placed onto a 8 × 8 multielectrode array (MEA) and spontaneous activity was induced by bath perfusion with the glutamate receptor agonist NMDA in combination with a dopamine receptor agonist. The intrinsic activity of the system was monitored by measuring the potential at each electrode. This local field potential (LFP) integrates the electrical activity of neurons placed in the region surrounding the electrode: negative peaks in the LFP measure the influx of positive ions and therefore the cumulative membrane potential variation of the neurons in the region. Experimental data show that before 6 days in vitro activity is mainly composed of sparse activations but during the second week simultaneous activations occur in several electrodes. The novel idea was to examine this electrophysiological signal on a finer temporal scale, which was able to evidence a complex spatio-temporal structure. Indeed, activity starting at one electrode may involve more, non-necessarily neighboring, electrodes. Binning time in cells of duration δt, allows to create a spatio-temporal grid reporting the active electrodes in each temporal cell. A neuronal avalanche is therefore defined as a sequence of successively active electrodes between two temporal bins with no activity. The total number of active electrodes, or alternatively the sum of all LFPs, is defined as the size s of an avalanche and the time interval with ongoing activity as its duration T.
The striking result is that both size and duration have no characteristic value, i.e., their distributions exhibit a power law behavior. The analysis at a finer temporal scale is then able to enlighten the non-synchronous character of the bursts. The exponents of these power law distributions depend on the choice for the temporal bin δt. Indeed larger bins make active electrodes belonging to different avalanches to merge into the same larger event, leading to a smaller exponent. In order to identify the appropriate value of δt, Beggs and Plenz (2003) verified that if δt is equal to the average value of the time delay between two successive LFPs in the culture, the exponent does not depend any longer on the specific culture. They were then able to identify the universal scaling behavior.
The power law behavior for the size distribution is followed by an exponential cut-off due to the finite size of the system, whereas for the duration distribution it extends over about one decade and the exponential cut-off sets in at about 10 ms.
The results in vitro have been confirmed by extended studies in vivo on anesthetized rats during development (Gireesh and Plenz, 2008) and awake rhesus monkeys (Petermann et al., 2009). Spontaneous neuronal activity recorded by MEA placed in the rat cortical layer 2/3 at the beginning and the end of the second week postnatal, shows higher frequency (up to 100 Hz) oscillations nested into lower frequency (4–15 Hz) oscillations. At the end of the first week postnatal, bursts start to organize into high frequency oscillations and become more synchronized during the second week. Synchronous activity in the bursts exhibits the same scaling behavior found for neuronal avalanches in vitro [equation (1)]. This similarity between in vitro and in vivo experiments supports the idea that the emergence of nested oscillations reflects the development of layer 2/3 in the cortex. Ongoing activity measured in the primary motor and premotor areas of two awake monkeys, sitting with no behavioral task, nor under particular stimulus, exhibits also neuronal avalanches. Their organization is independent of the detection threshold and exhibits scale invariance. Power laws for the size and duration distributions confirm the scaling behavior in equation (1) and suggest that in large neuronal networks a wide variety of avalanche sizes is possible, including clusters percolating throughout the system. This indicates that the largest cluster is solely controlled by the system size and not by the dynamics. This result also generalizes avalanche dynamics across species and different cortical areas. Criticality can be therefore considered as a generic property of spontaneous cortical activity, which may indicate that networks with a larger response repertoire were selected over others throughout evolution. A flexible spontaneous activity could then underlie and optimize important cortical functions as learning and memory.
The investigation on the spontaneous activity has been performed also for dissociated neurons from different networks as rat hippocampal neurons (Mazzoni et al., 2007), rat embryos (Pasquale et al., 2008), or leech ganglia (Mazzoni et al., 2007). Neurons are mechanically dissociated by trituration through fine-tipped pipettes and placed onto a MEA, pre-coated with adhesion promoting molecules, in a nutrient medium. Under fixed conditions of humidity and temperature, neurons start to develop a network of synaptic connections and, after a variable period in vitro, exhibit spontaneous electrical activity. The electrodes of the MEA in these experiments record the spikes, rather than the LFPs, due to individual neurons attached to them. As a consequence, the temporal scale for the data analysis has to take into account this difference in order to properly characterize the neuronal response. Choosing the average inter-spike time at a single electrode as the temporal scale for data binning, the spontaneous activity is monitored during the development and in mature cultures. Different behaviors are observed. Only those systems exhibiting a medium level of synchronization between random spikes and synchronized bursts exhibit critical behavior. For those cultures the scaling behavior is very robust and in agreement with equation (1). In particular, the emergence of a critical state has been found to be strongly related to the aging of the system, namely after the first few weeks in vitro, where the behavior of the system is subcritical, some cultures may self-organize, and reach the critical state as they mature (Pasquale et al., 2008).
In real brain neurons are known to be able to develop an extremely high number of connections with other neurons, that is a single cell body may receive inputs from even a hundred thousand pre-synaptic neurons. One of the most fascinating questions is how an ensemble of living neurons self-organizes, developing connections to give origin to a highly complex system. The dynamics underlying this process might be driven both by the aim of realizing a well connected network leading to efficient information transmission, and the energetic cost of establishing very long connections. The morphological characterization of a neuronal network grown in vitro has been studied (Shefi et al., 2002) by monitoring the development of neurites in an ensemble of few hundred neurons from the frontal ganglion of adult locusts. After few days the cultured neurons have developed an elaborated network with hundreds of connections, whose morphology and topology has been analyzed by mapping it onto a connected graph. The short path length and the high clustering coefficient measured indicate that the network belongs to the category of small-world networks (Watts and Strogatz, 1998), interpolating between regular and random networks. In classical small-world networks the majority of sites have a number of connections close to the average value in the network. Real neuronal networks behave quite differently, since neurons with quite diverse number of connections are observed. Indeed, the properties of the functionality network have been measured experimentally in human adults (Eguiluz et al., 2005). Functional magnetic resonance imaging has shown that this network has universal scale-free properties, namely it exhibits a distribution of out-going connection number, kout, which follows a power law, i.e.,  independent of the different tasks performed by the patients. This behavior suggests that in the network few neurons are highly connected and act as hubs with respect to information transmission. Small-world features have been also measured for functionality networks in healthy humans, whereas they are not present in patients affected by neurological diseases: Alzheimer patients have longer path lengths (as in regular networks; Stam et al., 2007) whereas schizophrenic patients show a more random architecture of the underlying network (Rubinov et al., 2009). Epileptic patients exhibit a more ordered neuronal network during seizures (Ponten et al., 2007), whereas brain tumor patients a more random one (Bartolomei et al., 2006).
2. The Model
2.1. Connectivity Networks
The first step to develop a model simulating neuronal dynamics is the choice of the specific network of connections. The simplest choice is a regular lattice, i.e., a square lattice for a two-dimensional system. However, following recent experimental results, we allow neurons to develop long range connections: Starting from a regular lattice, a small fraction of bonds, from 0 to 10%, is rewired, namely one of the two connected neurons is chosen at random in the system. This procedure originates long range connections and gives rise to a small-world network (Watts and Strogatz, 1998; Shefi et al., 2002), which more realistically reproduces the connections in the real brain.
In a small-world networks the number of connections for different neurons is close to an average number. In order to reproduce the experimental data on the connectivity distribution in functionality networks, we implement also scale-free networks. More precisely, we set N neurons at random positions in two-dimensional space and to each neuron we assign an out-going connectivity degree, kout, according to the distribution measured by fMRI measurements of ongoing activity in humans (Eguiluz et al., 2005). Each neuron has a degree equal to a random number between  according to the probability distribution
  The two neurons are chosen according to a distance dependent probability, p(r) ∝ e−r/5<r>, where r is their spatial distance (Roerig and Chen, 2002).
In order to consider a network with both features, small-world and scale-free, we also implement the Apollonian network. This has been recently introduced (Andrade et al., 2005) in a simple deterministic version starting from the problem of space-filling packing of spheres according to the ancient Greek mathematician Apollonius of Perga. In its classical version the network associated to the packing gives a triangulation that physically corresponds to the force network of the sphere packing. One starts with the zero-th order triangle of corners P1, P2, P3, places a fourth site P4 in the center of the triangle and connects it to the three corners (n = 0). This operation will divide the original triangle in three smaller ones, having in common the central site. The iteration n = 1 proceeds placing one more site in the center of each small triangle and connecting it to the corners (Figure 1). At each iteration n, going from 0 to N, the number of sites increases by a factor 3 and the coordination of each already existing site by a factor 2. More precisely, at generation N there are

vertices, with connectivity degree

respectively, where the two last values correspond to the site P4 and the three corners P1, P2, P3. The maximum connectivity value then is the one of the very central site P4, kmax = 3 × 2N, whereas the sites inserted at the N-th iteration will have the lowest connectivity 3.
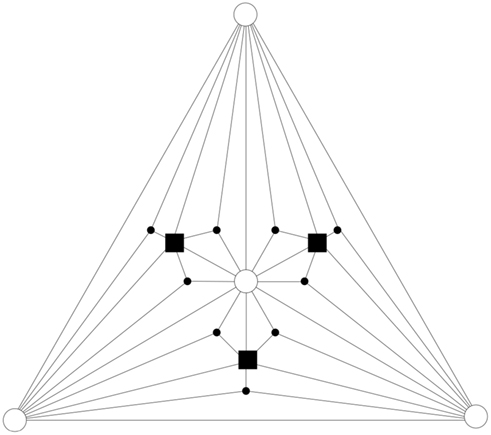
Figure 1. Apollonian network for N = 2: iterations n = 0, 1, 2 are symbols ◯, ■, •, respectively.
The important property of the Apollonian network is that it is scale-free. In fact, it has been shown (Andrade et al., 2005) that the discrete cumulative distribution of connectivity degrees P(k) = Σk′≥km(k, N)/NN, where NN= 3 + (3(N+1) − 1)/2 is the total number of sites at generation N, can be fitted by a power law. More precisely, P(k) ∝ k1−γ, with γ = ln3/ln2∼1.585. Moreover the network has small-world features. This implies (Watts and Strogatz, 1998) that the average length of the shortest path l behaves as in random networks and grows slower than any positive power of N, i.e., l ∝ (lnN)3/4. Furthermore the clustering coefficient C is very high as in regular networks (C = 1) and contrary to random networks. For the Apollonian network C has been found to be equal to 0.828 in the limit of large N. On this basis, the Apollonian network appears to have all the new features that we would like to investigate: small-world property found experimentally (Shefi et al., 2002) and possibility of a very high connectivity degree (scale-free). Moreover it also presents sites connecting bonds of all lengths. Also this last feature can be found in real neuronal networks, where the length of an axon connecting the pre-synaptic with the post-synaptic neuron can vary over several orders of magnitude, from micrometers to centimeters. Finally, most studies in the literature consider the case of a fully connected network, where each neuron is connected to every other neuron. Even if not completely realistic, we consider also this last case.
2.2. Neuronal Dynamics
We here discuss a neuronal network model based on self-organized criticality ideas (Bak, 1996). The model implements several physiological properties of real neurons: a continuous membrane potential, firing at threshold, synaptic plasticity, and pruning. In order to define the model we need to specify the behavior of the single neuron under different conditions, the dynamics then determines the system behavior (de Arcangelis et al., 2006a; Pellegrini et al., 2007; de Arcangelis and Herrmann, 2010). We consider N neurons at the nodes of the chosen network, characterized by their potential vi. The neuron positions will then be ordered in space for regular lattices and small-world networks, organized in a hierarchical manner for the Apollonian network and randomly chosen in two dimensions for the scale-free and fully connected networks. Once the network of output connections is established, we identify the resulting degree of in-connections,  for each neuron j. To each synaptic connection we assign an initial random strength gij, where gij ≠ gji, and to each neuron randomly either an excitatory or an inhibitory character, with a fraction pin of inhibitory synapses. Whenever at time t the value of the potential at a site i is above a certain threshold vi≥ vmax, the neuron sends action potentials which arrive to each of the
  pre-synaptic buttons and lead to a total production of neurotransmitter proportional to vi. As a consequence, the total charge that could enter into connected neurons is proportional to
  Each of them receives charge in proportion to the strength of the synapses gij

where the sum is extended to all out-going connections of i. In equation (2) the membrane potential variation is obtained by dividing the received charge by the surface of the soma of the post-synaptic neuron, proportional to the number of in-going terminals  The plus or minus sign in equation (2) is for excitatory or inhibitory synapses, respectively. In regular networks neurons have about the same number of in-going and out-going connections, therefore equation (1) reduces to the simpler expression
  The same consideration holds for small-world networks.
The firing rate of real neurons is limited by the refractory period, i.e., the brief period after the generation of an action potential during which a second action potential is difficult or impossible to elicit. The practical implication of refractory periods is that the action potential does not propagate back toward the initiation point and therefore is not allowed to reverberate between the cell body and the synapse. In our model, once a neuron fires, it remains quiescent for one time step and it is therefore unable to accept charge from firing neighbors. This ingredient indeed turns out to be crucial for a controlled functioning of our numerical model. In this way an avalanche of charges can propagate far from the input through the system. The initial values of the neuron potentials are uniformly distributed random numbers and the value of vmax is fixed equal to 6 in all simulations. Moreover, a small fraction (10%) of neurons is chosen to be output sites, i.e., an open boundary, with a zero fixed potential, playing the role of sinks for the charge. They model neurons connected to neurons not belonging to the slice and avoid that an excess to charge influx would lead to supercritical behavior. Each time neuronal activity stops in the network, an external stimulus is necessary to trigger further activity, which therefore mimics the nutrients from the bath needed to keep a real neuronal network alive. This stimulus consists in increasing the potential of a random neuron by a random quantity uniformly distributed between 0 and vmax.
During the propagation of an avalanche according to equation (2), we identify the bonds connecting two successively active neurons, namely neurons whose activity is correlated. The strength of their connections is increased proportionally to the activity of the synapse, namely the membrane potential variation of the post-synaptic neuron induced by the pre-synaptic neuron

where iij(t) is the current through that synaptic connection and α a dimensionless parameter. Once an avalanche of firings comes to an end, the strength of all inactive synapses is reduced by the average strength increase per bond

where Na is the number of bonds active in the previous avalanche. Here α is the only parameter controlling both the strengthening and the weakening rule in the Hebbian plasticity and represents the ensemble of all possible physiological factors influencing synaptic plasticity. By implementing these rules, our neuronal network “memorizes” the most used paths of discharge by increasing their strength, whereas the less solicited synapses slowly atrophy. Indeed, once the strength of a bond is below an assigned small value gt= 10−4, we remove it, i.e., set its strength equal to zero, which corresponds to the so-called pruning.
We implement synaptic plasticity rules during a series of Np stimuli in order to modify the synaptic strengths, initially set at random. In this way we do not impose a strength configuration but let the system activity tune their values. Once a percentage of bonds is pruned, we stop plastic adaptation and we perform our measurements, by applying a new sequence of stimuli without modifying the synaptic strengths. The extension of the plastic adaptation procedure then represents the level of experience, or age, of the system, whose response we monitor over a time-scale much shorter than the one needed for structural adaptation. All data presented in this manuscript are averaged over long temporal sequences in several initial network configurations. More precisely, for regular and small-world networks we average data on 10 different initial configurations with a sequence of 10000 avalanches per configuration. On the Apollonian network we average over 100 different initial configurations and a sequence of 30000 avalanches per configuration. For scale-free and fully connected networks we average over 60 different initial configurations and a sequence of 50000 stimulations per configuration.
3. Pruning
The total number of pruned bonds at the end of each avalanche, Npb, in general depends on the initial conductance g0, therefore it is interesting to investigate the two cases of either all initial conductances equal to 0.25, or being uniformly distributed between 0 and 1. First the case of equal initial conductances is analyzed. The strength of the parameter α, controlling both the increase and decrease of synaptic strength, determines the plasticity dynamics in the network. This homeostatic mechanism implies that the more the system learns strengthening the used synapses, the more the unused connections will weaken. For large values of α the system strengthens more intensively the synapses carrying current but also very rapidly prunes the less used connections, reaching after a short transient a plateau where it prunes very few bonds. On the contrary, for small values of α the system takes more time to initiate the pruning process and slowly reaches a plateau (Figure 2). The inset of the figure shows the asymptotic value of the fraction of surviving bonds, calculated as the total number of bonds in the unpruned network minus the asymptotic number of pruned bonds, as function of α. The number of unpruned bonds asymptotically reaches its largest value at the value α ≃ 0.03 for different networks. This could be interpreted as an optimal value for the system with respect to plastic adaptation.
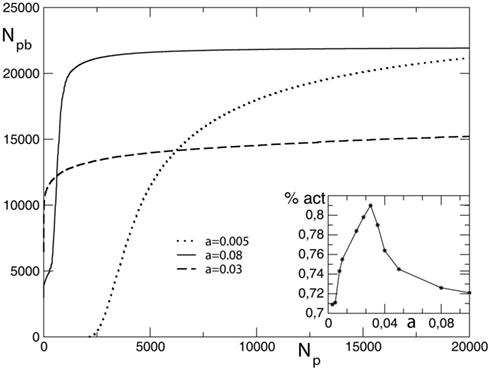
Figure 2. Average number of pruned bonds Npb as function of the number of external stimuli Np for a square lattice of linear size L = 100, equal initial conductances, and different values of α. In the inset we show the asymptotic value of the percentage of surviving bonds as function of α.
For the Apollonian network it is interesting to investigate if pruning acts in the same way on bonds created at different iterations n, n = 0, …, N, or rather tends to eliminate bonds of some particular iteration. The probability to prune bonds of different n is evaluated, that is the number of pruned bonds over the total number of bonds for each iteration stage, as function of the number of applied stimuli. Figure 3 shows that the plateau is reached at about the same value of Np and the shape of the curve is similar for each n. However the probability to prune bonds with large n is higher: These are the bonds created in the last iterations and therefore embedded in the interior of the network. This suggests that the most active bonds are the long range ones (small n), which therefore support most of the information transport through the network. It is also interesting to notice that, since the total number of bonds depends exponentially on n, the gaps between the asymptotic values of the probability for successive generations depend exponentially on n. In the inset of Figure 3 we show the asymptotic number of pruned bonds per generation on a semi-log scale, this quantity is well fitted by the exponential behavior Npb ≃ exp n.
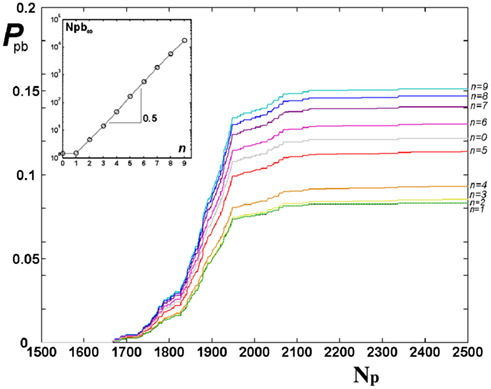
Figure 3. Probability of pruning for bonds of different iterations n of Apollonian networks, from bottom n = 0 to top n = 9, as function of the number of external stimuli Np for equal initial synaptic strengths. In the inset, the asymptotic Npb (after 5000 stimuli) is shown as function of n with the exponential fit Npb ≃ exp 0.5n.
The same analysis has been performed for random initial conductances between 0 and 1. The results are similar to the previous case. It can be noticed that pruning starts already at Np= 1, since conductances close to zero are present, and the plateau is reached after about 1000 stimuli. The value of α which optimizes the number of active bonds is about 0.030 also for the Apollonian network. In this case, the pruning behavior for different iterations is similar to the previous case, with the pruning probability exponentially increasing with n, as Npb ≃ exp n.
The effect of pruning on the connectivity degree of the network is an interesting quantity to monitor on scale-free networks. On Apollonian networks we evaluate the number of sites with a number of out-going connections kout as function of kout in the initial network and after application of a given number of external stimuli (Figure 4). After the application of few external stimuli, i.e., for a short plastic adaptation, the distribution n(kout) shows the same scaling behavior of the original Apollonian network. As the pruning process goes on, sites exhibit varying connectivity degree, and new values of kout appear. The result is that the scaling behavior is progressively lost, as well as the scale-free character of the network, since there is a generalized decrease of the connectivity in the network.
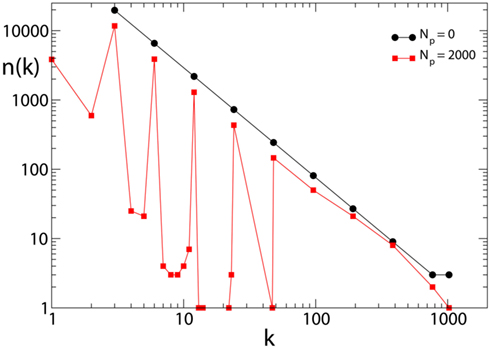
Figure 4. Connectivity degree distribution n(kout) at different pruning stages Np for Apollonian networks with equal initial synaptic strengths and α = 0.020. As soon as pruning starts to eliminate bonds, new connectivity degrees appear, not present in the original network. Conversely, two out of the three corner sites, which for the generation N = 9 have initially a connectivity degree 1025, may loose bonds because of pruning and, as a result, n(1025) = 1.
4. Avalanche Statistics
After “aging” the system applying plasticity rules during Np external stimuli, we submit the system to a new sequence of stimuli with no modification of synaptic strengths. The response of the system to this second sequence models the spontaneous activity of a trained neuronal network with a given level of experience. We analyze this activity by measuring the avalanche size distribution n(s) and the time duration distribution n(T).
The avalanche size distribution n(s) consistently exhibits power law behavior for different values of model parameters. Figure 5 shows the avalanche size distribution for different networks and values of Np, including also the case Np= 0 (no plasticity adaptation), for random initial conductances and the optimal value of α. The value of the exponent is obtained by regression of the log-binned data and found to be σ = 1.5 ± 0.1 for all networks, except the Apollonian network where τ = 1.8 ± 0.2. The exponent is stable with respect to variations of the parameters for both equal and random initial conductances. More accurate methods, as maximum likelihood fitting, should verify the stability of these values (Clauset et al., 2009).
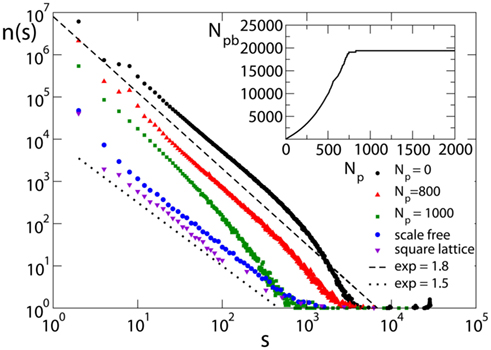
Figure 5. Avalanche size distribution for different networks with pin= 0.05: the square lattice (N = 106, α = 0.03); the scale-free network (N = 4000); and the Apollonian network for different values of Np (9th generation with α = 0.030). Initial synaptic strengths are randomly distributed. Data are logarithmically binned. In the inset, the corresponding behavior of the number of pruned bonds for the Apollonian network is shown.
It is interesting to stress the importance of noise: Indeed, by applying the external stimulation not at random but at a fixed neuron, the scaling exponent becomes σ = 1.2 ± 0.1 (de Arcangelis et al., 2006a). We notice that, for fixed size s, increasing Np decreases the number of avalanches of that size, suggesting that strong plasticity remodeling decreases activity. The exponent appears to be independent of Np, as long as the number of pruned bonds, Npb, is far from the plateau (see inset in Figure 5). Similar results are found for equal initial conductances. The dependence of the critical behavior on synaptic strengths has been recently investigated in networks of integrate-and-fire neurons (Levina et al., 2007). The value of the exponent is compatible within error bars with the value found in the experiments of Beggs and Plenz (2003), 1.5 ± 0.4. However, one has to notice that experimental results for neuronal avalanches were obtained for local field potentials, i.e., the underlying events correspond to local population spikes, whereas the numerical events are single neuronal spikes. The slightly larger value of the exponent, found on the Apollonian network, suggests that the peculiar hierarchical structure of the network may reduce the probability of very large avalanches but does not change substantially the electrical activity. For larger Np, the distribution exhibits an increase in the scaling exponent and finally looses the scaling behavior for very large Np values, in the plateau regime for the number of pruned bonds.
In order to investigate the role of plastic modifications on the production of very large avalanches, simulations are performed for fully connected networks which undergo plastic adaptation routines of different length. All networks exhibit supercritical behavior, namely an excess of very large avalanches, due to the high level of connectivity in the system (Figure 6). Very large avalanches involve almost all neurons and their large number hinders pruning, namely there are only very few synapses in the system repeatedly inactive which progressively weaken and atrophy. This behavior is independent of the extension of the plastic adaptation. No pruning is observed even following the application of hundred thousand stimuli. Very large avalanches therefore seem to be sustained by the high connectivity in the system and apparently do not depend on the synaptic strengths. The analysis of the effect of pruning on very large avalanches confirms this observation. Plastic adaptation of different duration is now applied to scale-free networks, leading to pruning of synapses. Supercritical behavior, that appears in the unpruned networks, survives when only few percentage of the synapses is removed. Conversely, a more extended pruning strongly affects connectivity and hampers the development of very large avalanches.
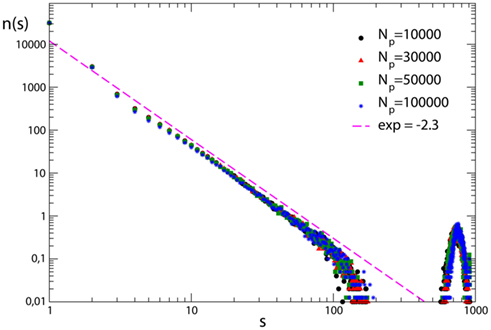
Figure 6. Avalanche size distribution for 100 configurations of fully connected networks with N = 1000 neurons with pin= 0.05. The different curves correspond to different durations of the plastic adaptation period Np.
At time t = 0 a neuron is activated by an external stimulus initiating the avalanche. This will continue until no neuron is at or above threshold. The number of avalanches lasting a time T, n(T), as function of T also exhibits power law behavior (Figure 7) followed by an exponential cut-off. The scaling exponent is found to be τ = 2.1 ± 0.2 for all networks and equal and random initial conductances. Only for the fully connected networks the distribution exhibits a bump at long durations, due to the excess of large avalanches which all contribute to the tail of the distribution. The value of the exponent is found to be stable with respect to different parameters, provided that the number of pruned bonds Npb is lower than the plateau for that value of α. Finally this value agrees within error bars with the value 2.0, exponent found experimentally by Beggs and Plenz(2003, 2004).
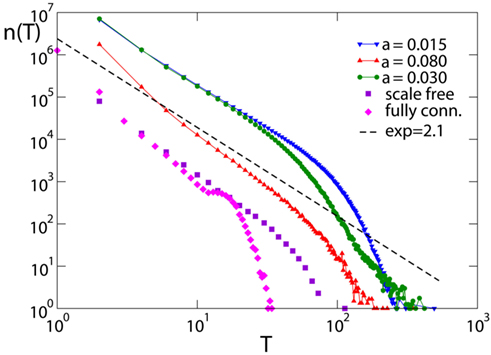
Figure 7. Avalanche duration distribution for different networks with pin= 0.05: the scale-free network (N = 4000); the fully connected network with Np= 50000; the Apollonian networks for different values of α (9th generation, Np= 500). Data are logarithmically binned. The dotted line has slope 2.1.
5. Power Spectrum
The power spectrum of the time signal for the overall electrical activity can be calculated. The aim is to compare the scaling behavior of the numerical spectrum with the power law observed usually in medical data (Novikov et al., 1997; Freeman et al., 2000). For this purpose, the number of active neurons is monitored as function of time, which recalls the experimental condition in which electrodes are placed on the scalp in order to study the patient’s spontaneous electrical activity. In neuronal networks neuronal activity consists in avalanches of all sizes generated in response to the external stimulus. Here the unit time is the time for the avalanche to propagate from one neuron to the next one. The power spectrum is calculated as the squared amplitude of the time Fourier transform as function of frequency, averaged over many initial configurations. Because of the definition of the numerical time unit, the frequency unit does not correspond to the experimental one in Hertz.
Figure 8 shows the spectrum for different networks and different values of Np. We also show the magnetoelectroencephalography (similar to EEG) obtained from channel 17 in the left hemisphere of a male subject resting with his eyes closed, as measured in Novikov et al. (1997), having the exponent 0.795. For Np= 0, i.e., without plasticity adaptation, the spectrum has a 1/f behavior, characteristic of SOC. For values of Np different from zero, but before the Npb plateau, one can distinguish two different regimes: a power law behavior with exponent β = 0.8 ± 0.1 at high frequency, followed by a crossover toward white noise at low frequency. The difference between β = 1 for Np= 0 and β ; 0.8 for higher Np, suggests that plasticity reduces the relevance of small frequencies in the power spectrum, in better agreement with experimental EEG spectra (Novikov et al., 1997; Freeman et al., 2000). The stability of the exponent with respect to α has also been verified, finding consistently β = 0.8 ± 0.1 at high frequency. The stability of the spectrum exponent suggests that an universal scaling characterizes a large class of brain models and physiological signal spectra for brain controlled activities. Medical studies of EEG focus on subtle details of a power spectrum (e.g., shift in peaks) to discern between various pathologies. These detailed structures however live on a background power law spectrum that shows universally an exponent of about 0.8, as measured for instance in Freeman et al. (2000) and Novikov et al. (1997). A similar exponent was also detected in the spectral analysis of the stride-to-stride fluctuations in the normal human gait which can directly be related to neurological activity (Hausdorff et al., 2001). The measured value for the power spectra exponent is in agreement with the expected relation β = 3 − τ, being the scaling exponent of the avalanche duration distribution τ > 1 (Jensen, 1998).
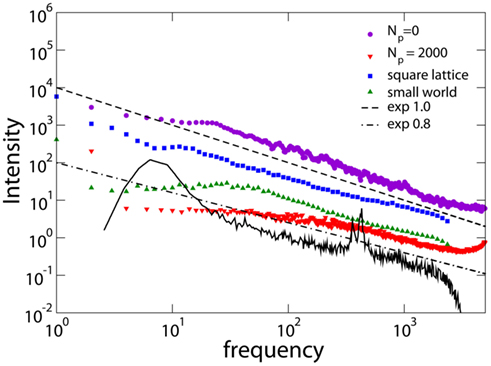
Figure 8. Power spectra obtained for different networks: square lattice (N = 106, α = 0.03, Np= 10); small-world networks (N = 106, α = 0.05, Np= 1000, 1% rewired bonds); Apollonian networks for different Np (9th generation, α = 0.020). The experimental data (black line) are from Novikov et al. (1997) with frequency in Hertz. Experimental data are shifted in order to be in the same frequency range of numerical data.
The scaling behavior of the power spectrum can be interpreted in terms of a stochastic process resulting from the superposition of multiple inputs taking Gaussian distributed random values (Hausdorff and Peng, 1996). The output signal sum of different and uncorrelated superimposed processes is characterized by a power spectrum with power law regime, crossing over to white noise at low frequencies and to brown noise to high frequencies. The low crossover frequency is related to the inverse of the longest characteristic time among the superimposed processes. 1/f noise characterizes a superposition of processes of different frequencies with similar amplitudes. In our case the scaling exponent is smaller than unity, suggesting that processes with high characteristic frequency are more relevant than processes with low frequency in the superposition (Hausdorff and Peng, 1996).
6. Discussion
Several experimental evidences suggest that the brain behaves as a system acting at a critical point. This statement implies that the collective behavior of the network is more complex than the functioning of the single components. Moreover, the emergence of self-organized neuronal activity, with the absence of a characteristic scale in the response, unveils similarities with other natural phenomena exhibiting scale-free behavior, as earthquakes or solar flares (de Arcangelis et al., 2006b). For a wide class of these phenomena, self-organized criticality has indeed become a successful interpretive scheme. As in self-organized criticality, the threshold dynamics ensures time-scale separation (slow external drive and fast internal relaxation). This dynamics leads to criticality and therefore power law behavior (Jensen, 1998). The model belongs to the class of non-conservative models, since output neurons can drive charge outside the system. However the model presents a number of different features: The propagation of charge from one neuron to the connected one is non-uniform and non-isotropic. Moreover the connectivity network is not static but dynamically evolves following activity. In this scenario the plastic rules introduce a homeostatic regulatory mechanism between excitation and inhibition leading to critical behavior. The ensemble of these new ingredients is at the origin of the measured exponents, different from the typical exponents found in SOC models. It is interesting to notice that in fully connected networks the excess of very large avalanches hampers the synaptic depression mechanisms and therefore alters the self-organized regulation between excitation and inhibition. As a consequence, supercritical behavior is observed.
Extensive simulations of this activity-dependent model are derived for regular, small-world, scale-free, and fully connected lattices. The results are compared with experimental data. The first result is that an optimal value of the plasticity strength α exists with respect to the pruning process, optimizing information transmission. This remark could be interpreted as the evidence of a homeostatic mechanism between strengthening and weakening processes in the adaptation of real synapses. Moreover the avalanche size and duration distributions exhibit a power law behavior with stable exponents compatible with the values experimentally found for neuronal avalanches. These values appear to be independent of the model parameters and the specific connectivity network. This universal behavior is also in agreement with experimental results, which provide the same exponents for very different systems (dissociated neurons, cortex slices, and networks in vivo), evidently characterized by connectivity networks with different complexity. Solely the fully connected networks consistently exhibit supercritical behavior due to the high connectivity level which sustains large avalanche activity. The stability of the spectrum exponent suggests that a universal scaling characterizes a large class of brain models and physiological signal spectra for brain controlled activities. This work may open new perspectives to study pathological features of EEG spectra by including further realistic details into the neuron and synapse behavior.
Conflict of Interest Statement
The authors declare that the research was conducted in the absence of any commercial or financial relationships that could be construed as a potential conflict of interest.
References
Andrade, J. S., Herrmann, H. J., Andrade, R. F. S., and da Silva, L. R. (2005). Apollonian networks: simultaneously scale-free, small world, Euclidean, space filling, and with matching graphs. Phys. Rev. Lett. 94, 018702.
Arieli, G. A., Sterkin, A., and Aertsen, A. (1996). Dynamics of ongoing activity: explanation of the large variability in evoked cortical responses. Science 273, 1868–1871.
Azouz, R., and Gray, C. M. (1999). Cellular mechanisms contributing to response variability of cortical neurons in vivo. J. Neurosci. 19, 2209–2223.
Bartolomei, F., Bosma, I., Klein, M., Baayen, J. C., Reijneveld, J. C., Postma, T. J., Heimans, J. J., van Dijk, B. W., de Munck, J. C., de Jongh, A., Cover, K. S., and Stam, C. J. (2006). Disturbed functional connectivity in brain tumour patients: evaluation by graph analysis of synchronization matrices. Clin. Neurophysiol. 117, 2039–2049.
Beggs, J. M., and Plenz, D. (2003). Neuronal avalanches in neocortical circuits. J. Neurosci. 23, 11167–11177.
Beggs, J. M., and Plenz, D. (2004). Neuronal avalanches are diverse and precise activity patterns that are stable for many hours in cortical slice cultures. J. Neurosci. 24, 5216–5229.
Clauset, A., Shalizi, C. R., and Newman, M. E. J. (2009). Power-law distributions in empirical data. SIAM Rev. 51, 661.
de Arcangelis, L., and Herrmann, H. J. (2010). Learning as a phenomenon occurring in a critical state. Proc. Natl. Acad. Sci. U.S.A. 107, 3977.
de Arcangelis, L., Perrone Capano, C., and Herrmann, H. J. (2006a). Self-organized criticality model for brain plasticity. Phys. Rev. Lett. 96, 028107.
de Arcangelis, L., Godano, C., Lippiello, E., and Nicodemi, M. (2006b). Universality in solar flare and earthquake occurrence. Phys. Rev. Lett. 96, 051102.
Eguiluz, V. M., Chialvo, D. R., Cecchi, G. A., Baliki, M., and Apkarian, A. V. (2005). Scale-free brain functional networks. Phys. Rev. Lett. 94, 0181021–0181024.
Freeman, W. J., Rogers, L. J., Holmes, M. D., and Silbergeld, D. L. (2000). Spatial spectral analysis of human electrocorticograms including the alpha and gamma bands. J. Neurosci. Methods 95, 111.
Gireesh, E. D., and Plenz, D. (2008). Neuronal avalanches organize as nested theta- and beta/gamma-oscillations during development of cortical layer 2/3. Proc. Natl. Acad. Sci. U.S.A. 105, 7576–7581.
Hausdorff, J. M., Ashkenazy, Y., Peng, C. K., Ivanov, P. C., Stanley, H. E., and Goldberger, A. L. (2001). When human walking becomes random walking: fractal analysis and modeling of gait rhythm fluctuations. Physica A 302, 138.
Hausdorff, J. M., and Peng, C. K. (1996). Multiscaled randomness: a possible source of 1/f noise in biology. Phys. Rev. E 54, 2154.
Levina, A., Herrmann, J. M., and Geisel, T. (2007). Dynamical synapses causing self-organized criticality in neural networks. Nat. Phys. 3, 857.
Maeda, E., Robinson, H. P., and Kawana, A. (1995). The mechanisms of generation and propagation of synchronized bursting in developing networks of cortical neurons. J. Neurosci. 15, 6834–6845.
Mazzoni, A., Broccard, F. D., Garcia-Perez, E., Bonifazi, P., Ruaro, M. E., and Torre, V. (2007). On the dynamics of the spontaneous activity in neuronal networks. PLoS ONE 5, e439. doi:10.1371/journal.pone.0000439
Novikov, E., Novikov, A., Shannahoff-Khalsa, D., Schwartz, B., and Wright, J. (1997). Scale-similar activity in the brain. Phys. Rev. E 56, R2387.
Pasquale, V., Massobrio, P., Bologna, L. L., Chiappalone, M., and Martinoia, S. (2008). Self-organization and neuronal avalanches in networks of dissociated cortical neurons. Neuroscience 153, 1354–1369.
Pellegrini, G. L., de Arcangelis, L., Herrmann, H. J., and Perrone Capano, C. (2007). Modelling the brain as an Apollonian network. Phys. Rev. E 76, 016107.
Petermann, T., Thiagarajan, T. C., Lebedev, M. A., Nicolelis, M. A., Chialvo, D. R., and Plenz, D. (2009). Spontaneous cortical activity in awake monkeys composed of neuronal avalanches. Proc. Natl. Acad. Sci. U.S.A. 106, 15921–15926.
Ponten, S. C., Bartolomei, F., and Stam, C. J. (2007). Small-world networks and epilepsy: graph theoretical analysis of intracerebrally recorded mesial temporal lobe seizures. Clin. Neurophysiol. 118, 918.
Roerig, B., and Chen, B. (2002). Relationships of local inhibitory and excitatory circuits to orientation preference maps in ferret visual cortex. Cereb. Cortex 12, 187–198.
Rubinov, M., Knock, S. A., Stam, C. J., Michelojannis, S., Harris, A. W. F., Williams, L. M., and Breakspear, M. (2009). Small-world properties of nonlinear brain activity in schizophrenia. Hum. Brain Mapp. 30, 403.
Segev, R., Benveniste, M., Hulata, E., Cohen, N., Palevski, A., Kapon, E., Shapira, Y., and Ben-Jacob, E. (2002). Long term behavior of lithographically prepared in vitro neuronal networks. Phys. Rev. Lett. 88, 118102.
Shefi, O., Golding, I., Segev, R., Ben-Jacob, E., and Ayali, A. (2002). Morphological characterization of in vitro neuronal networks. Phys. Rev. E 66, 021905.
Staley, K. J., Longacher, M., Bains, J. S., and Yee, A. (1998). Presynaptic modulation of CA3 network activity. Nat. Neurosci. 1, 201–209.
Stam, C. J., Jones, B. F., Nolte, G., Breakspear, M., and Sceltens, P. H. (2007). Small-world networks and functional connectivity in Alzheimer’s disease. Cereb. Cortex 17, 92.
Stevens, C. F., and Tsujimoto, T. (1995). Estimates for the pool size of releasable quanta at a single central synapse and for the time required to refill the pool. Proc. Natl. Acad. Sci. U.S.A. 92, 846–849.
Keywords: neuronal model, complex networks, self-organized criticality
Citation: de Arcangelis L and Herrmann HJ (2012) Activity-dependent neuronal model on complex networks. Front. Physio. 3:62. doi: 10.3389/fphys.2012.00062
Received: 11 January 2012; Accepted: 03 March 2012;
Published online: 28 March 2012.
Edited by:
Tjeerd W. Boonstra, University of New South Wales, AustraliaReviewed by:
John M. Beggs, Indiana University, USAMichael Muskulus, Norwegian University of Science and Technology, Norway
Copyright: © 2012 de Arcangelis and Herrmann. This is an open-access article distributed under the terms of the Creative Commons Attribution Non Commercial License, which permits non-commercial use, distribution, and reproduction in other forums, provided the original authors and source are credited.
*Correspondence: Lucilla de Arcangelis, Department of Information Engineering, Second University of Naples, via Roma 29, Aversa, 81031 Caserta, Italy. e-mail: lucilla.dearcangelis@unina2.it