Characterization of mesenchymal stromal cells physical properties using acoustic radiation force
 Ludovic Bellebon1,2*†
  Hugo R. Sugier2,3† Jérôme Larghero4
  Juliette Peltzer5
  Christophe Martinaud6 Mauricio Hoyos1
  Jean-Luc Aider1*
- 1Laboratoire PMMH, UMR7636 CNRS, ESPCI Paris—PSL, Paris Sciences Lettres, Sorbonne Université, Paris, France
- 2Aenitis Technologies, Paris, France
- 3Institut André Lwoff, INSERM UMR-MD 1197, Villejuif, France
- 4Centre d’investigation clinique de Biothérapies CBT501, Assistance Publique-Hôpitaux de Paris, Hôpital Saint-Louis, Unité de Thérapie Cellulaire, INSERM U976, Université de Paris, Paris, France
- 5Institut de Recherche Biomédicale des Armées (IRBA), Clamart, France
- 6Centre de Transfusion Sanguine des Armées (CTSA), Clamart, France
Microfluidics-based technologies are emerging solutions towards cell separation process. They rely on various physical principles, such as dielectrophoretic force, hydrodynamic force, and acoustic force. In order to take advantage of these approaches for cell sorting, it is crucial to characterize cell biophysical properties, i.e. size, density, compressibility or acoustic contrast factor in the case of acoustophoresis. Various techniques exist to measure those features, including acoustofluidics methods. However, previously described approaches do not allow the determination of all the physical parameters of a given cell. For this study, a 330 μm deep acoustic cavity has been designed, together with an optical technique, to measure the size, the acoustic contrast factor and the density of cells to finally determine their compressibility. A defocusing technique is used to assess the velocity of sedimentation and acoustic focusing of individual cells which can lead to their physical properties using the analytic expression of the Acoustic Radiation Force. This method is used to investigate the evolution of the biophysical properties of Mesenchymal Stromal Cells (MSCs), isolated from two different tissues from different donors, from one passage to the other. Our results highlighted an important heterogeneity of acoustic contrast factor and compressibility among cells from a same donor but also inter-donor. Nevertheless, from passage to passage, the acoustic contrast factor and compressibility of MSCs converge and homogenize at the fourth passage. On the other hand, the density of MSCs remains homogenous from passage to passage and between different donors. Using this technique, it was possible to successfully assess the different biophysical properties of mesenchymal stromal cells using a single setup based on acoustic levitation. The results confirm the necessity to use such a technique to measure the cells properties. It also demonstrates the large heterogeneity of donor/patient-derived cells, in contrast with cultured cells whose properties homogenize during the successive cultures. As a consequence, cell separation processes will be more complex for patient/donor derived cells than for cultured cells.
1 Introduction
The rise of biophysics during the last two decades led to various techniques of manipulations of cells, which are more difficult to control when the physical or mechanical properties of the cells are unknown. This is especially the case when the objective is to sort the cells upstream of specific processes. One can find many examples in biomedical research [1, 2], clinical diagnostic [3, 4] and bioproduction field [5, 6]. The common principles for cell separation are based either on the density differences or on specific biological membrane markers. For instance, Magnetic-Activated Cell Sorting (MACS) and Fluorescence-Activated Cell Sorting (FACS) are effective techniques to separate cells based on cell surface markers [7, 8] making the cells sensitive to either magnetic force or specific illumination. However, both techniques depend on cell labelling with antibodies, making them invasive and expensive. Another classic approach to separate cells is to take advantage of a density difference between the cells and the suspending medium and to centrifuge the heterogenous population within a density gradient [9]. However, this technique requires a large volume of sample and the manipulation by an operator, which makes it difficult to integrate in an automatized bioprocess.
To overcome these drawbacks, microfluidic-based cell separation technologies have emerged as promising solutions. They can be based on many different physical principles, coupling a force to a microfluidic flow. Depending on the application, one can use elastic force [10, 11], dielectrophoretic force [12, 13], magnetic force [14, 15], inertial lift force [16, 17], hydrodynamic force [18–20], optical force [21], and acoustic force [22, 23]. Yet, to adequately exploit these mechanisms for cell separation, it is necessary to characterize the physical properties of the cells, namely their size, density, and compressibility.
Another major issue related to the mechanical properties of cells is the relation that exists between these properties, the state of the cells and possible health issues. For instance, malignant cells like cancer cells go through a transformation of their cytoskeleton from a rather ordered and rigid structure to a more irregular and compliant state. These transformations lead to a modification of the mechanical properties of the cells (becoming “softer” in this case) [24]. The stiffness of human Mesenchymal Stromal Cells (hMSCs) can also be used as an indicator of stem cell differentiation and differentiation potential [25]. For instance, it was shown, even if not well understood, that hMSC stiffness can change during osteoblast differentiation [26].
In many situations (stem cell biology, tissue engineering, hematology, cancer biology), analyzing the averaged properties of a large number of cells may not yield the proper result because the cells of interest may be hidden by the majority. For instance, stem cell populations exhibit inherently heterogeneous and asynchronous differentiation states, which would require single-cell analysis [27]. It also becomes very important to find single-cell relationships between mechanical properties and traditional biomarkers in order to evaluate how individual differentiation biomarkers parameters can be related to the state of differentiation. The objective of the present study is to develop a new, non intrusive, experimental approach to single cell measurements of mechanical properties using acoustofluidics.
While the size can be easily measured by direct observation with a microscope or with a particle counter (Coulter counter for instance [28]), different methods exist to determine the density. We can mention the density gradient centrifugation [29], the use of nanomechanical resonators [30], or the use of magnetic force [31]. However, the measure of cell compressibility or acoustic contrast factor is much more challenging, which is the reason why these data are poorly documented in the literature, while size and density of the most known cells such as red blood cells are well-documented [32–34].
This is where the interest of acoustofluidics lies. Indeed, as will be detailed in the following section, the Acoustic Radiation Force (ARF) used to move the particles or cells depends directly on their physical properties. It is then possible to derive the acoustic contrast factor or even the compressibility just by measuring the particles or cells trajectories. This has already been done for several cell types. We can quote measurements of compressibility of white blood cells and prostate cancer cells [35], cells from a human embryonic ventral mesencephalic cell line as well as these same cells differentiated in a specific medium 4 days later [36], breast cancer cells and colon cancer cells [37], or head and neck cancer cell lines [38]. Another method has been developed by Cushing et al. [39] They measured the density of particles with neutrally buoyant samples and their compressibility by measuring the sound velocity in the medium depending the particles volume fraction. Other studies implementing cell characterization is iso-acoustic focusing (IAF) [40]. This method allows to measure the acoustic impedance of individual cells. IAF is independent from the cell diameter and in consequence allows to characterize and separate cells with same size distribution but with different mechanical properties due to their specific molecular content and structure.
MSCs are nonhematopoietic stromal cells that can be isolated from various tissues including bone marrow and adipose tissue [41]. Since the first human trial in 1995, MSCs have become the most clinically studied cell type with over a thousand clinical trials in various conditions, including neurological diseases, joint diseases, cardiovascular diseases, and graft vs. host diseases [42]. However, their isolation and processing remain a challenge towards high-scale production [43]. By characterizing their physical properties, we aim to provide to the cell therapy community an insight about the feasibility of MSCs acoustic-based processing.
In the following, we will first present a single acoustic and optical setup, based on an acoustic resonant cavity. Using an optical aberration, we will show that it is possible to measure cell-by-cell their size, their acoustic contrast factor and their density. Finally, from these measurements the compressibility of a population of particles or cells can be obtained. This method is first validated on well-known particles before being used to characterize the mechanical properties of hMSCs and their evolutions as a function of the number of passages.
2 Materials and methods
2.1 Acoustic radiation force
To create an Acoustic Radidation Force field, the first step consists in emiting an acoustic wave inside a resonant cavity containing a suspension of particles or cells in a fluid. One of the walls allows the transmission of the acoustic wave while the opposite wall allows its reflexion in order to create a stationary wave, resulting from the superposition of the incident and reflected waves (Figure 1) [44, 45].
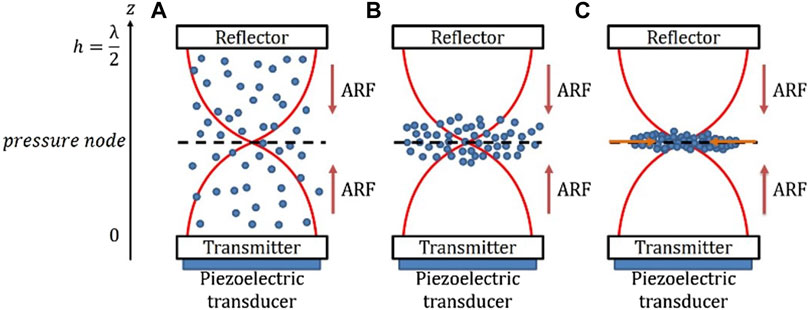
FIGURE 1. Schematic of a suspension under the effect of ARF in a BAW setup (A). The acoustic radiation force moves the particles towards the focusing plane near the nodal plane (B). Once they have reached the focusing plane, the particles aggregate in the centre of the cavity due to the radial component of the ARF (C).
Usually, the ultrasonic wave is emitted using a piezoelectric at the bottom of a cavity of height h. The acoustic wave, with a wavelength λac, is then transmitted through the lower wall, travels through the cavity, before being reflected by the upper wall. It finally forms a standing wave, with a pressure node at mid-height of the cavity, if the resonance condition
If the particles or objects are spherical (which is the case for most of cells in dilute suspensions, without interactions with walls or other cells), compressible and in a dilute suspension in a compressible fluid, the ARF can be written as [46]:
where dp is the particle diameter, z its axial position in the cavity and
with λac the acoustic wavelength defined as
with ρf the density of the fluid and βf the compressibility of the fluid. We define the speed of sound in the particles as:
with ρp and βp the density and compressibility of the particles or cells. The compressibility of polystyrene beads is βp = 2.20 0.10−10Pa−1 [47].
This equation is normally only valid for fluids and not for solids, the speed of sound in a solid being dependent on its density, its Poisson’s ratio and its Young’s modulus. This will give slightly different values of compressibility than in reality. However, we keep this form because we will study the compressibility of cells, which are composed of an intracellular fluid surrounded by a membrane.
Finally, G is the Acoustic Contrast Factor (ACF) of the single object (cell or particle). It quantifies the reaction of the given object to the acoustic wave relative to the surrounding medium. In this term, we find the properties of the particle and the fluid (e.g., density, compressibility). These mechanical properties, linked to the size of the objects, allow to quantify the acoustic impact on a given particle or cell. It is a key property that will be used in the following to characterize the cells. G is written as follows:
The ACF is essential for the sorting process and will be different for each type of particle or cell. Depending on the values of G, the objects will move faster or slower towards the acoustic pressure node. If G > 0 the objects will reach the pressure node while if G < 0 the objects will move towards the antinode. The ACF is a quantitative criterion to separate cells populations based on their respective densities and compressibilities. Olofsson et al. used this property to separate living cells from dead cells in a high density medium [48]. While dead cells are moving toward the pressure node, living cells are focsuing toward the antinode. It allows to establish a separation process between these two populations which were mixed initially. In the present study, we will see that it can also be considered as an interesting parameter that can be used to characterize the mechanical properties of single cells.
2.2 Acoustic focusing velocity of a single particle
Let’s consider a dilute suspension, in whichh the particles or cells do not interact with any other particle or cells. If a particle moves towards the pressure node under the effect of the ARF, it also undergoes the Stokes force Fs and the buoyancy. For the case of a spherical particle, the Stokes force is written as:
with vp the velocity of the particle in a fluid of viscosity μ. The buoyancy PA is defined as:
with Δρ = ρp − ρf the density difference between the particle and the fluid. For polystyrene particles (ρp = 1050 kg.m−3) in water (ρf = 1000 kg.m−3) the buoyancy is FB = 8.8 × 10⁻¹⁴ N for dp = 7 μm. For standard conditions, the ARF on a 7 μm is around 10−12 N, so that the buoyancy can be neglected.
The fundamental principle of dynamics then gives the following expression for the acoustic focusing velocity uF(z) of a given particle:
The axial velocity profile in the channel is maximal at
If the size and density of a given particle as well as the acoustic frequency are known, then one can see that the only unknown is the acoustic energy, which depends on each setup (acoustic source and the different layers). The first step consists in measuring the axial acoustic focusing velocity uF(z) of a well-known bead to deduce the acoustic energy
Once the acoustic energy density has been measured, one can measure the acoustic focusing velocity of a particle or a cell whose properties are unknown to deduce its ACF, also using Eq. 8. As we are interested in the cell properties, nonetheless the ACF is needed, but also its density and compressibility. If the density is known, then one can deduce the compressibility using the definition of the ACF (Eq. 5). The second step is then to measure precisely the density of the unknown cell.
2.3 Sedimentation velocity of a single particle
We can use the same protocol to measure the sedimentation velocity of a given cell as for measuring the acoustic focusing velocity. The particle or cell is also considered isolated so that there is no interaction with any other object. Knowing the sedimentation velocity, we can easily deduce the density of the given cell. Indeed, the equilibrium between the Stokes force and the buoyancy
We then deduce the sedimentation velocity:
Finally, we obtain the density of a particle:
Measuring us therefore allows us to deduce the density of the particle or cell. The same issue as for the measurement of the acoustic focusing velocity has to be faced: we have to measure the axial velocity, along the optical axis of the objective of the microscope. In both cases, a defocusing optical technique will be used.
2.4 Experimental methods
2.4.1 Axial velocity and optical defocusing technique
The defocusing technique is based on the optical properties of fluorescent particles moving away from the focal plane. This technique had already been implemented by Dron & Aider [49] to measure the acoustic energy density.
When a particle is observed with a microscope in the focal plane of the microscope, the particle is a sharp well-defined dot. If the particle is in another plane away from the observation plane, then its image becomes blurred. If a fluorescent particle is used, then a ring pattern appears when the particles moves away from the focal plane (Figure 2). This ring is called “Airy ring”. Its diameter depends directly on the distance to the focal plane: the further the particle is from the observation plane, the larger the diameter of the ring (Figure 2).
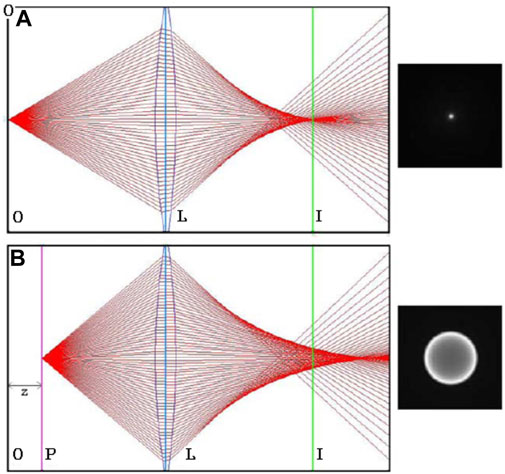
FIGURE 2. Optical diagrams with the corresponding resulting images of a fluorescent MSC cell. L is the lens, I the imaginary plane, P the plane where the particle is located and O the observation plane linked to the imaginary plane via the lens. In case (A) the observation plane and the particle are superimposed while in case (B) this is not the case. Consequently a ring is is observed. Adapted from Ref. 49 ([66]).
This observation leads to a defocusing technique linking the axial position of the particle and the ring diameter [50]. The principle is to use the optical properties of fluorescent particles or cells marked with a fluorophore.
Olsen et al. [51] proposed a relation between the effective diameter of the ring De, the axial position of the particle z and the optical properties of the assembly:
with λfluo the optical emission wavelength of the fluorescent particles, M the magnification and Da the aperture diameter of the lens. f♯ is the focal number of the lens and is written as:
with F the focal length. We also define the numerical aperture (NA) as:
Finally, s is the distance between the lens and the observation plane and is written as follows:
The first term of Eq. 12 corresponds to the size of the image in the focal plane according to geometric optics. The second term applies a correction due to the diffraction of the lens. The third term corresponds to objects that are outside the observation plane.
To use the equation Eq. 12, we must respect several assumptions:
• All particles have the same diameter.
• The illumination of the field of view is homogeneous.
• The light emitted by fluorescent particles is isotropic.
• The three terms have a Gaussian distribution in the wave plane.
The distance between the lens and the observation plane s is much larger than the distance z between the particle position and the focusing plane. We can therefore consider s ≫ z and by taking Eq. 12, we deduce:
This relation allows the determination of the axial position of the particle from the measurement of the diameter of the Airy ring De. If this measurement is made during the acoustic focusing of a particle, we will have the trajectory of the particle z(t) and therefore, by derivation, its velocity. There is no difference between a particle moving towards or away from the focusing plane. They’ll have the same Airy ring if they are the same distance from the focusing plane, no matter their direction. One should also be careful to run experiments with dilute suspension to avoid any overlap between two Airy rings of particles or cells close to each other.
Calibration method is generally used to determine the position of a particle along the optical axis [52]. However this technique works only for objects with the same diameter. In our case we study cells which have various diameters even from a same type and a same donor. In consequence, a calibration method cannot be applied and we choose to use the Olsen theoretical model.
2.4.2 Fluorescence microscopy
Characterization of cells acoustic properties using the measurement of their acoustic focusing velocities towards a pressure node requires a clear optical access. It is also necessary to ensure the best contrast with the medium by using a fluorescent marker to exploit the defocusing technique. To carry out such measurements, we used a fluorescence microscope (Olympus™ BX 51) equipped with Olympus™ lens (5X, 10X, 20X and 50X), optical filters, and a broadband LED source (CoolLed™ pE-4000-F-SYS-ZZ) allowing to generate the wavelength adapted to the targeted fluorophore (Figure 3).
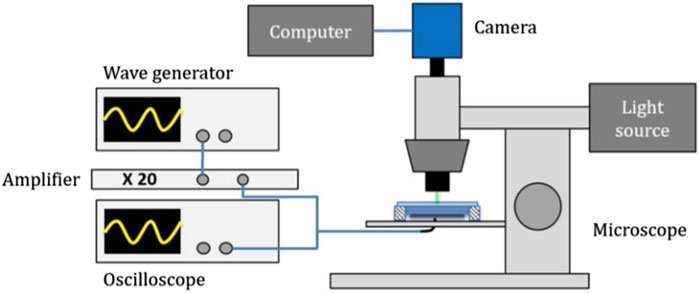
FIGURE 3. Experimental setup used to track the axial position of the cells as a function of time for both acoustic focusing and sedimentation measurements. Piezoelectric is driven by a wave generator and an amplifier while the camera on the microscope is driven by computer. A light source allows to enlight the cavity with various monochromatic wavelengths.
2.4.3 Resonant cavity
To follow the motion of particles or cells moved by acoustic force, we worked in a closed cavity, without flow. In this perspective, a dedicated assembly has been designed. We manufactured a cylindrical aluminum cavity (Figure 4C) with a diameter of 25 mm and a thickness of 330 μm, fixed with a mylar sheet between the two aluminum pieces (Figure 4A). A silicon disk of 25 mm diameter and 500 μm thickness was placed at the bottom of the cavity while a quartz disk of 30 mm diameter and 1 mm thickness was used to seal the cavity (Figures 4A,B) and reflecting the acoustic wave, leading to the creation of a standing wave inside the cavity. The volume of the cavity is 200 μL.
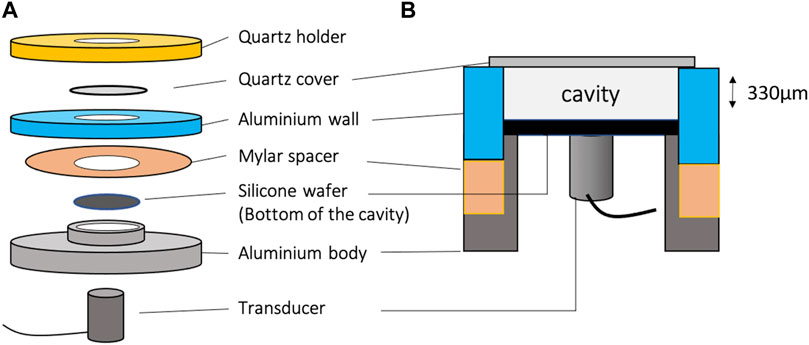
FIGURE 4. Exploded view (not to scale) (A) and side view (B) of the cavity used to follow the dynamics of acoustic focusing or sedimentation of isolated particles or cells. The cylindrical cavity has a diameter of 25 mm for a thickness of 330 μm, i.e. a total volume of 200 μL.
The quartz cover, in addition to being a good acoustic reflector, also allowed a clear optical access from the top of the cavity. It was thus perfectly adapted to fluorescence microscopy.
The silicon bottom has been made perfectly flat, without any surface defect, transmitting very well the acoustic waves and offering a very good optical contrast, thus improving the quality of the observations by reflection microscopy, in particular, when cells with low optical contrast were observed.
The ultrasounds were generated by a 8 mm diameter Signal Processing™ cylindrical packaged transducer placed under the cavity, in contact with the silicone wafer. The piezoelectric element is a disk of 5 mm diameter. The transducer was driven by a TiePie™ signal generator controlled by a computer.
2.4.4 Axial velocity measurement through image analysis
In practice, stacks of snapshots were recorded using a fast and highly sensitive Back Illuminated camera (PCO™ Panda Bi) controlled by a computer using the Camware 64 software.
Once the snapshots had been transferred to the computer hard disk, the successive snapshots were then post-processed to measure at each time step the diameter of the Airy ring, leading to the axial position of the particle or cell. Then image analysis and velocity computations have been processed using a dedicated in-house MATLAB (RRID: SCR_001622) code. To detect the ring at each snapshot, the MATLAB code used the “Regionprops” function, which detects lines of white pixels which are defined by a high grey intensity value over a black background (Figure 5).
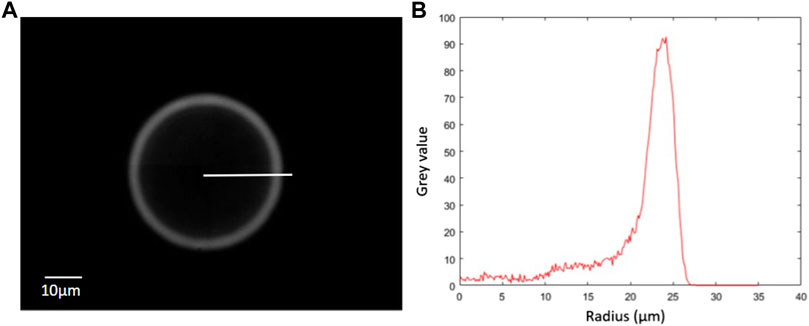
FIGURE 5. (A) Typical Airy ring corresponding to an out-of-focus fluorescent particle. (B) Radial evolution of the intensity along the profile shown on the left-side picture. The peak of intensity can then be automatically found to measure the radius of the Airy ring, which can be related to the axial postion of the particle.
The results obtained with an MSC driven towards the pressure node are shown in Figure 7. First, the evolution of the radius of the Airy ring as a function of time re(t) has been computed (Figure 7A), leading to the evolution of the axial position of the cell as a function of time (Figure 7B). Taking the derivatives of z(t) we obtained the evolution of the acoustic focusing velocity of the cell (Figure 7C) and then the axial evolution of the acoustic focusing velocity (Figure 7D).
It is important to state here an experimental limitation. Indeed, one has to choose at the begining of the recording the acquisition frequency. The acoustic focusing setp is much faster than the sedimentation step. As a consequence the sampling frequency was high (80 Hz) to follow the evolution of the Airy ring during the acoustic focusing. The sedimentation being much slower, it was not possible to continue the recording with the same sampling frequency. As a consequence, we had to measure first the acoustic focusing of a given set of cells, before running experiments on another set of cells for the sedimentation.
Another constraint was to work with dilute suspensions to allow analysis of isolated particles or cells and to avoid ring overlapping, or particle-particle (or cell-cell) interactions. Furthermore, particles and cells are moving in the center of the cavity, far from the borders in the (x,y) plane. The only cell-wall interaction is at the very end of a sedimentation. There is no cell-wall interaction at the beginning of a focusing displacement, if the cell is too close to the bottom of the cavity, it will not move towards the pressure node while the acoustic is turned on.
2.4.5 Measurement of the acoustic energy density
Firstly, we measured the acoustic energy density in the cavity with particles whose properties are known. We used polystyrene beads of three different radius (5 μm, 10 and 15 μm). To simplify the study, we ran our experiments with the energy corresponding to 5 V, i.e.
Knowing the acoustic energy density, we then could run the same process to evaluate the ACF of particles or cells. To verify the validity of the approach we repeated velocity measurements of the polystyrene beads, for the three different radius. Using the acoustic energy as an input, we could estimate the ACF of the particles.
The results are shown in Figure 6, resulting from at least 20 measurements for each diameter. One can see that the measured mean values were very close to the theoretical value G = 0.573. The best estimate were obtained with the 10 μm particles for which the mean value (0.577) fitted with the theoretical value. The value obtained with the 5 μm particles (0.592) were also very close to the expected value, but slightly overestimated, while the ACF was a little underestimated for the larger particles (0.532). This discrepancy for the larger particles could be explained afterward. Indeed, we measured their diameters with a LUNA-FL Cell Counter. While the supplier indicates 15 μm diameter, we measured an average diamter of 11 μm. This significant difference of diameter is the reason why the ACF is lower for 15 μm particles. Particles have a lower diameter than expected which leads to a higher ACF (0.569) much closer to the theoretical value. We checked the diameter for 5 and 10 μm particles and in both cases, the real diameter matches with the theoretical one.
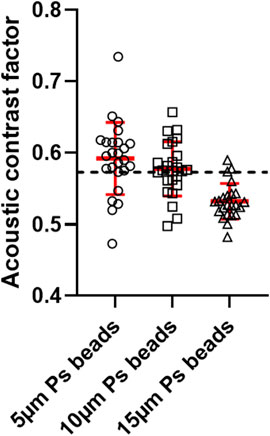
FIGURE 6. Acoustic contrast factor of 5, 10 and 15 μm polystyrene particles. The dotted red line corresponds to their theoretical value: G = 0.573.
2.4.6 Measurement of the cell’s acoustic contrast factor
Once the acoustic energy inside the cavity and the acoustic focusing velocity of the cells have been measured, it becomes possible to estimate the cell’s ACF using Eq. 8. An example of axial displacement and axial velocity measurement of a single MSC focusing towards the levitation plane is shown on Figure 7. As expected, the velocity increases during the first part of the focusing before reaching the maximum velocity at h/4. Then, the velocity decreases before reaching the levitation plane (h/2) where the axial velocity is zero by definition.
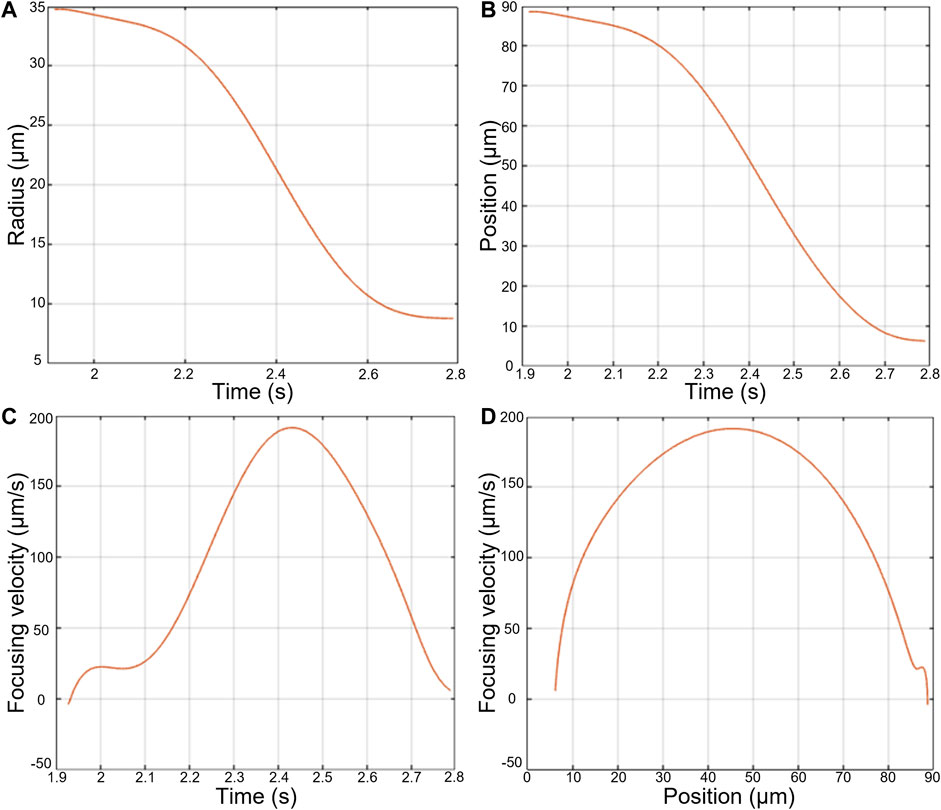
FIGURE 7. Measurements made during the focusing of an AD-MSC cell towards the focusing plane in an acoustic cavity. (A) Radius of the Airy ring as a function of time, (B) Position of the cell with respect to the focusing plane over time, (C) Focusing speed of the cell over time, (D) Focusing speed of the cell as a function of its position with respect to the focusing plane.
2.4.7 Measurement of the cell’s sedimentation velocity
As explained in the previous section, it is possible to use the ARF as an acoustic tweezer. A cell can be drawn and maintained in the acoustic levitation plane before being “dropped” by turning off the ultrasound. It is then possible to use the defocusing technique to monitor the axial position of the cells as a function of time (increase instead of decrease of radius of the Airy ring), leading to the sedimentation velocity along the height of the half channel.
In practice, the first step conisted in placing the cell or particle in the levitation/observation plane using the ARF. Then, at t = 0, the ultrasound was switched-off. The particle or cell could then sediment from the levitation plane towards the bottom wall. We therefore first observed a well-focused object before monitoring the growth of the Airy ring as the cell moved away from the levitation plane to finally settle at the bottom of the cavity. We used the same MATLAB code as before to compute the Airy ring diameter leading to the axial position of the cell as a function of time.
The results for a single MSC sedimentation are shown in Figure 8. The cell quickly reaches its maximum velocity, the Stokes velocity, sedimenting at constant speed before slowing down progressively as it approaches the wall.
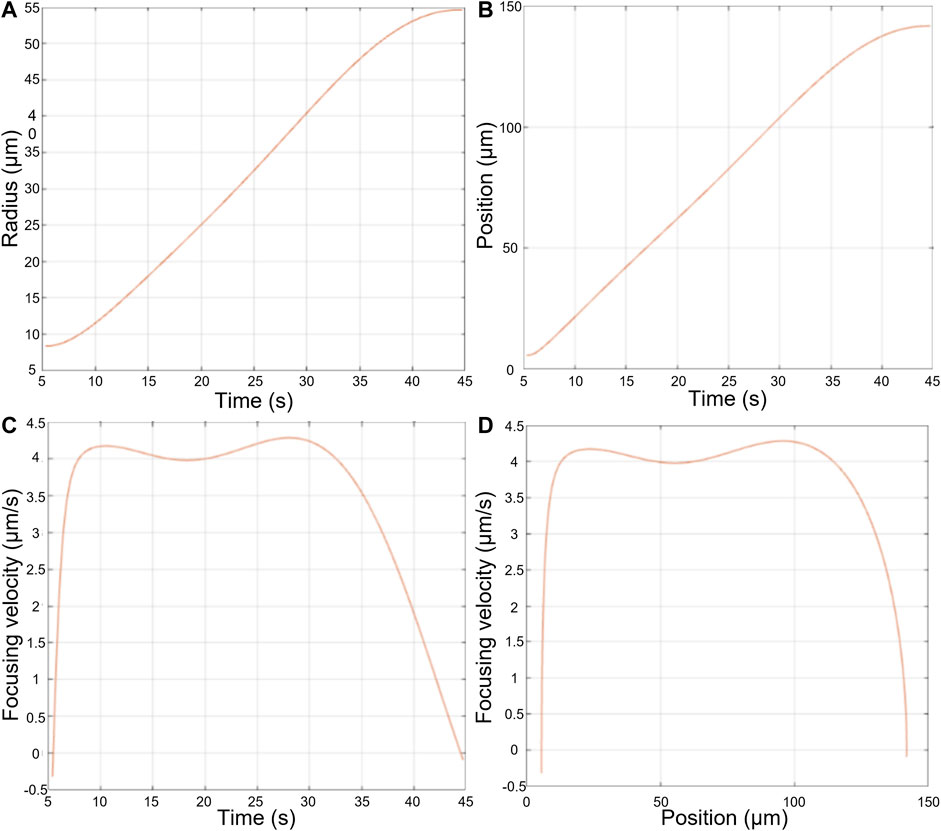
FIGURE 8. Measurements made during the sedimentation of an AD-MSC cell dropped from the levitation plane towards the bottom of the cavity. (A) Radius of the Airy ring as a function of time, (B) Position of the cell with respect to the focusing plane over time, (C) Sedimentation speed of the cell over time, (D) Sedimentation speed of the cell as a function of its position with respect to the focusing plane.
2.4.8 Computation of the cell’s compressibility
Due to the limitations of the camera and the workstation the measures of both sedimentation and the ACF of a given single cell were not possible. Indeed, the acoustic focusing step required a large acquisition frequency to track the cell during its fast motion toward the pressure node. To measure the density of the same cell requires that the video acquisition is not interrupted when the acoustic is turned off, so that the cell can be tracked during the sedimentation. The sedimentation being much slower, we could not record all the snapshots with the same high acquisition frequency. The compressibility was then deduced using Eq. 5 with the mean of ACF measured for one set of cells and the mean of density of another set of cells. As we were handling cells, it was important to run a large number of replicates to derive an averaged value of the cell properties. In the following, at least 20 acoustic focusing and sedimentation velocities have been be measured for each passage of each type of cell.
The protocol previously presented to measure cell’s properties is summarized in Figure 9.
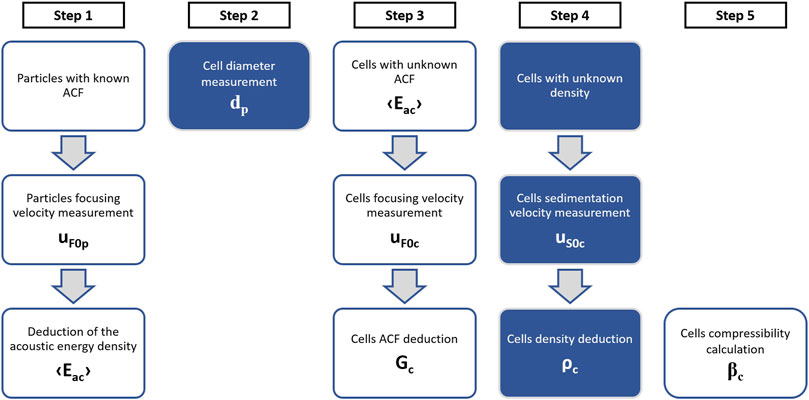
FIGURE 9. Methodology for deducing the acoustic properties of cells. (Step 1) By using particles with known properties we measure their focusing velocity uF to deduce the acoustic energy density
2.5 hMSCs
2.5.1 Isolation and culture
Healthy donors bone marrow was obtained from residual samples in the context of allogeneic hematopoietic stem cell graft, after signed informed consent, according to the French regulation. Bone marrow cells were plated at 100 000 nucleated cells.cm−2 in MEM-α (Biological Industries) supplemented with 5% pooled human platelet lysate (French military blood center) and 0.5% Ciprofloxacine (Cipro), and were incubated at 37°C and 5% CO2. After 24 h, non-adherent cells were discarded to isolate adherent Bone Marrow-derived MSCs (BM-MSCs). When 80% confluence was reached, cells were detached with trypsin (TrypZean™ Solution, 1×, Sigma-Aldrich®) for the first passage (P1). After P1, cells were plated at 4000 cells.cm−2 and harvested when confluence reached 80%.
Adipose tissue-derived MSCs (AD-MSCs) were collected from consenting donors undergoing a liposuction (Percy Military Medical Center). Adipose tissue was washed 3 times with DPBS (Corning) and enzymatically digested for 45 mn at 37°C under agitation with 0.075 mg/100 ml of collagenase type I (Sigma-Aldrich). Enzymatic digestion was stopped with 50% MEM-α and 50% albumin (Vialebex 200 mg ml−1). Cells were centrifuged and cell pellet was subsequently filtered at 100 and 30 μm. The resulting cells compose the stromal vascular fraction (SVF) which contain AD-MSCs. SVF was plated at 20 000 nucleated cells.cm−2 in MEM-α (Biological Industries) supplemented with 5% pooled human platelet lysate (French military blood center) and 0.5% Ciprofloxacine (Cipro) and were incubated at 37°C and 5% CO2. After 24 h, non-adherent cells were discarded to isolate adherent AD-MSCs. When 80% confluence was reached, cells were detached with trypsin (TrypZean™ Solution, 1×, Sigma-Aldrich®) for P1. After P1, cells were plated at 4000 cells.cm−2 and harvested when confluence reached 80%.
For each passage, MSCs surface antigen phenotype was confirmed by flow cytometry (Data not shown), following the minimum criteria defined by the International Society for Cellur Therapy [41].
2.5.2 Staining and measure
In order to use the defocusing technique to monitore cell position, we stained MSCs with antibodies coupled to fluorochromes, usually used for flow cytometry, to make the plasma membrane fluorescent. After MSCs harvest, cells were washed and stained with the following antibodies: CD29-PE (BD Pharmingen, Cat# 555443, RRID: AB_395836), CD44-PE (BD Pharmingen, Cat# 561858, RRID: AB_395871), and CD90-PE (BD Pharmingen, Cat# 555596, RRID: AB_395970). Cells were incubated for 30 mn, at 4°C, in the dark. Then the cells were washed trice and resuspended in physiological serum (Fresenius Kabi) at a final concentration of 100 000 cells/mL. This concentration was low enough to avoid Airy rings overlapping when running the video recordings. Then, the cells were immediately injected into the cavity, at 20°C. The measurement of ACF or sedimentation of a single cell was about one minute.
2.5.3 Statistical analysis
Mann-Whitney test or Kurskal-Wallis test were performed with GraphPad Prism 8, RRID:SCR_002798.
3 Results
3.1 Acoustic contrast factor of hMSCs
We first measured the ACF of BM-MSCs isolated from 3 different donors (HD1, HD2, and HD3). The cells were cultured and characterized from P1 to P3. Due to technical issues, we were not able to analyze the results of the cells from donor HD1 at P1 and from donor HD3 at P3.
The results are displayed in the Figures 10A–C. One can notice the heterogeneity of the ACF of the different cells from the same donor and passage, as for example with cells from donor HD2 at passage 2 (Figure 10B). Moreover, we observe significant differences between cells of different donors at the same passage. For instance, at P2 there is a significant difference between the ACF of HD1 (mean = 0.1133 ± 0.0863) and HD2 (mean = 0.3282 ± 0.2057) (pvalue = 0.0020) (Figure 10B). We dicerned a significant difference at P3, between the ACF of cells from HD1 (mean = 0.1259 ± 0.0904) and HD2 (mean = 0.2118 ± 0.1036) (pvalue = 0.0093). As we are dealing with primary cells from different donors, such an heterogeneity was expected and illustrate the importance of running single cell measurements.
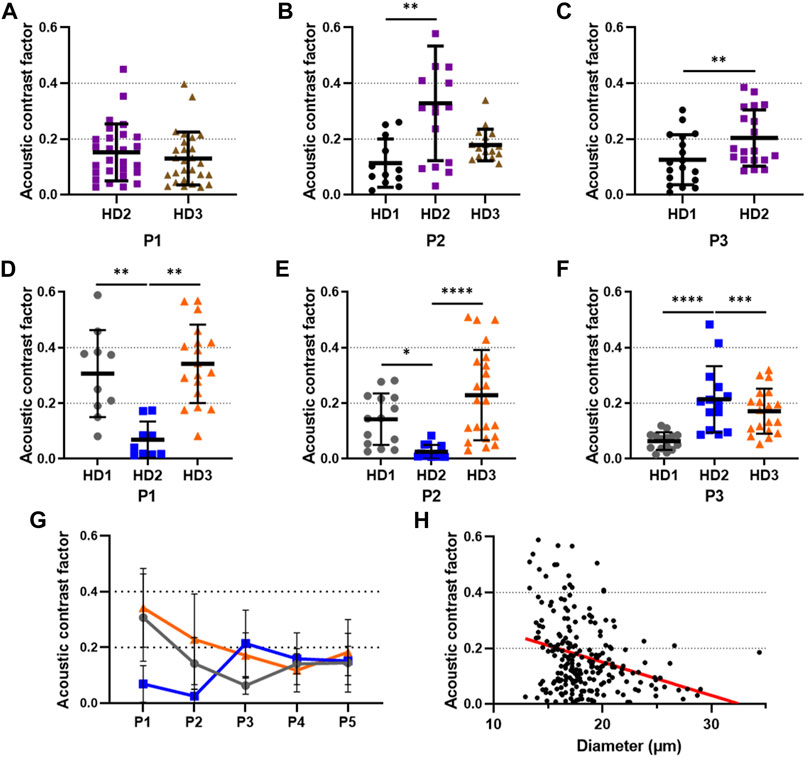
FIGURE 10. Variability of the acoustic contrast factor of cultured MSCs isolated from different donors. The acoustic contrast factor of BM-MSCs isolated from 3 different donors (HD1, HD2, and HD3) has been measured, via the acoustic focusing velocity, during cell culture at (A) passage 1 (P1), (B) P2, and (C) P3. The acoustic contrast factor of AD-MSCs isolated from 3 different donors (HD1, HD2, and HD3) has been measured during cell culture at (D) P1, (E) P2, and (F) P3. (G) Evolution of the acoustic contrast factor from P1 to P5 of AD-MSCs isolated from 3 donors. The grey line corresponds to HD1, the blue line to HD2, and the orange line to HD3. (H) Pearson correlation between the size and the acoustic contrast factor of AD-MSCs isolated from donors HD1, HD2, and HD3 at P1 to P5, R2 = 0.09155. The lines of the scatter dot plot correspond to the mean with standard deviation (SD). Statistical analysis was performed using Mann-Whitney test for passages with 2 donors and Kruskal–Wallis test for passages with 3 donors. **, ***, and **** stand for Pvalue < 0.01,
We then measured the ACF of AD-MSCs also isolated from 3 different donors (HD1, HD2, and HD3). This time, the cells could be cultured and characterized from P1 to P5. The results are shown in Figures 10D–F). As with our previous results with BM-MSCs, we observed major differences between cells from the same passage and same donor, as with the cells from HD1 at P1 (Figure 10D). We also observe differences between the cells at the same passage with different donors (Figures 10D–F).
Interestingly, while we note an important heterogeneity between donors of AD-MSCs from P1 to P3, the averaged ACF of all donors converged around 0.15 at P4 and P5 (Figure 10G). These results suggest that over the passages, the ACF of AD-MSCs from different donors become more and more homogenous passage after passage.
Finally, we observe a significant correlation between the size of AD-MSCs and their ACF (pvalue
3.2 Density of hMSCs
We assessed the single-cell density of MSCs isolated from bone marrow (Figures 11A–C) and adipose tissue (Figures 11D–F). Strikingly, the density of both BM-MSCs and AD-MSCs from P1 to P3 are similar, with a mean density of 1043 kg m−3 and 1044 kg m−3, respectively. Furthermore, the density of AD-MSCs from P1 to P5 remains constant (Figure 11G). Taken together, these results demonstrate that the density of MSCs isolated from both bone marrow and adipose tisue are very close to each other and remains constant over the passages. This is an important result as it suggests that the density is an intrinsic properties, independant of the donor and passages. The main difference relies then in the mechanical properties of the cells, in this case, the ACF.
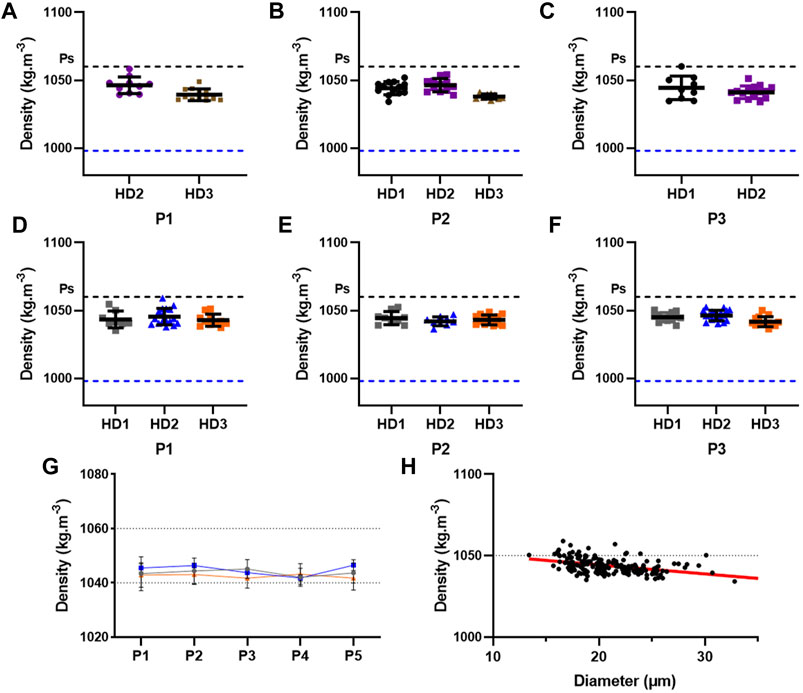
FIGURE 11. Measure of the density of cultured MSCs isolated from different donors. The density of BM-MSCs isolated from 3 different donors (HD1, HD2, and HD3) has been measured, via the sedimentation velocity, during cell culture at (A) P1, (B) P2, and (C) P3. The density of AD-MSCs isolated from 3 different donors (HD1, HD2, and HD3) has been measured during cell culture at (D) P1, (E) P2, and (F) P3. (G) Evolution of the density from P1 to P5 of AD-MSCs isolated from 3 donors. The grey line corresponds to HD1, the blue line to HD2, and the orange line to HD3. (H) Pearson correlation between the size and the density of AD-MSCs isolated from donors HD1, HD2, and HD3 at P1 to P5, R2 = 0.1951. The doted blue line corresponds to the density of the water at 20°C. Ps stands for the density of polystyrene. The lines of the scatter dot plot correspond to the mean with SD.
Ultimately, we observe a significant correlation between the size of AD-MSCs from P1 to P5 with their density (pvalue
3.3 Compressibility of hMSCs
To calculate the compressibility of MSCs, we used the Eq. 5 exploiting the mean of ACF and the mean density density for each donor and for each passage previously measured. As explained in the previous sections, it was not possible to perform single-cell measurements, in a single acquisition on a given cell, of the acoustic focusing step and the sedimentation step. In the present study, only the mean values of the compressibility could be measurend. From P1 to P3, the compressibility of BM-MSCs varied from 3.2473 0.10−10Pa − 1 to 4.1059 0.10−10Pa−1 (Figures 12A–C). However, no clear trends seemed to emerge from these results. Nevertheless, if we look at the full evolution of the compressibility of AD-MSCs from P1 to P5, than we can see that the mean value converges toward a nearly constant value, around 4 0.10−10Pa−1 (Figure 12D).
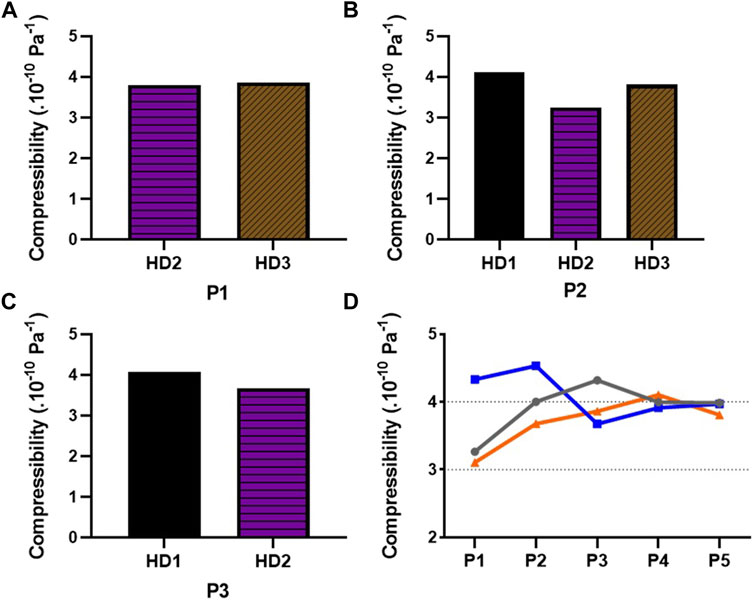
FIGURE 12. Determination of the compressibility of cultured MSCs isolated from different donors. The compressibility of BM-MSCs isolated from 3 different donors (HD1, HD2, and HD3) has been calculated, with the mean of acoustic contrast factor and density previously measured via the Eq. 5, during cell culture at (A) P1, (B) P2, and (C) P3. (D) Evolution of the compressibility from P1 to P5 of AD-MSCs isolated from 3 donors (HD1, HD2, and HD3). The grey line corresponds to the donor A, the blue line to the donor B, and the orange line to the donor C.
All results presented previously are summarized in Table 1.
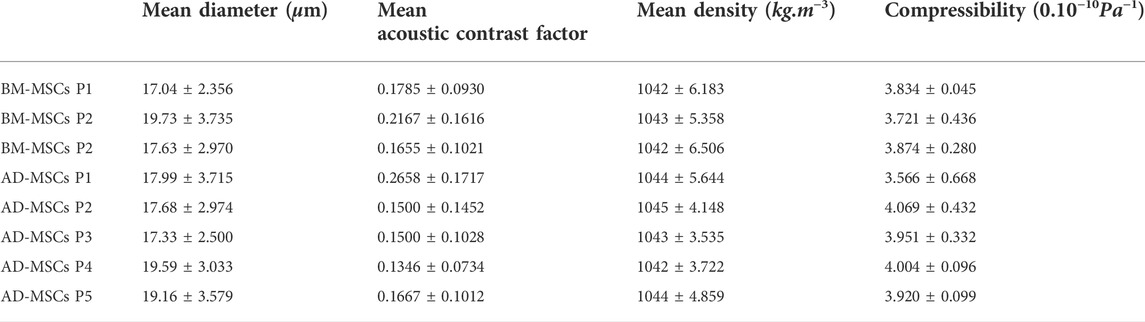
TABLE 1. Table of acoustic contrast factor, density and compressibility of all MSCs and passages measured.
4 Discussion
In this work, we developed a new method, based on the ARF and optical defocusing, to measure cell-by-cell the size, density, and ACF of various MSCs. From the distribution of single cell properties of different sets of cells, we could derive the average compressibility of the different population of cells. Our protocol has been applied to numerous MSCs isolated from two different tissues, i.e., bone marrow and adipose tissue, and from passage to passage.
Other ACF measurement methods based on the acoustic force have been developed. Commonly, the setups are designed to allow a direct observation of the cell migration towards the acoustic pressure node and therefore, the direct measurement of the acoustic focusing velocity. For instance, Hartono & al. [37] measured the ACF of normal breast cells, breast cancer cells, liver cancer cells, colon cancer cells and fibroblasts. They obtained ACF values ranging between 0.14 and 0.25. They also measured the compressibility of these cells, but unlike us, they did not measure the density directly but rather used data available in the literature. The compressibility values vary between 3.77 and 4.22 .10−10Pa−1. Wang & al. [53] measured the ACF of three breast cancer cell lines and one breast epithelial cell line. Values vary between 0.116 and 0.175. Furthermore, they observed the same tendency as we observed, with a decrease of the ACF for increasing cell diameter. Finally, Augusston & al. [36] measured the ACF of undifferentiated and four-days differentiated cells from human embryonic ventral mesencephalic cell line. The ACF obtained is expressed as Φ, with 3Φ = G. The ACF obtained are Φ = 0.04 and Φ = 0.07 respectively. Taken together, these studies found ACF and compressibility measurements in the same order of magnitude than ours.
It is known that MSCs isolated from distinct individuals present different biological properties (e.g., secretion, proliferation rate, and immunomodulatory properties) [54, 55]. This variance depends on various factors such as age [56], diseases [57], and obesity [58]. Moreover, small MSCs have been described to proliferate faster, to reach senescence at later passages, and to be more prone to differentiation [59–61]. In a similar fashion, our results with AD-MSCs showed a wide heterogeneity of ACF between the different donors. Moreover, the ACF of AD-MSCs was heterogenous until P4 while the density of cells remains stable.
Our results suggest that the evolution of the ACF of MSCs is due to an evolution of the compressibility of cells from passage to passage. This change in compressibility could be explained by a change in protein content into cells. Indeed, it has been reported that the proteome, i.e. the entire set of proteins expressed by a cell, of MSCs change from passage to passage. Madeira et al. [62] have shown a decrease of various structural components and cellular cytoskeleton expressions, among them vimentin, from P3 to P7 in BM-MSCs. The evolution of cell content and compressibility have been observed by Fu et al. [63] with two cancer cell lines, MCF7 and A549, during an induced epithelial-mesenchymal transition. After the induction of epithelial-mesenchymal transition by growth factors, cell morphology changed and as well as the expression of different adhesion proteins and vimentin. Finally, the compressibility and the ACF of AD-MSCs trended to converge to similar values between donors. This observation could be explained by the fact that the culture from passage to passage of MSCs trends to a clonal selection, as demonstrated by Selich et al. [64] with MSCs isolated from umbilical cord, resulting in less cell heterogeneity.
From a general point of view, our results confirm the importance of single-cell characterization. It gives access to the distribution of size, density and ACF of a population, highlighting possible evolution and/or correlation of these properties. In our case, we found out that the density was a rather well-defined and intrinsic properties of the cells, independant of the donors or the passages. On the contrary, we found out that the ACF depends strongly on the donor and/or the passages. This dependancy was also found in the compressibility, but it suggests that the ACF of cells can be considered as a proper mechanical characteristic to evaluate the state of the cells, comparable to the stiffness considered in many previous studies [25]. Finally, we could also find a correlation between the ACF and the size of the cells. Such a correlation could only be found because of the single-cell measurements.
If the objective is to find a criterium to sort the cells, the isolation of MSCs before P4 appears to be difficult due to the inter and intra-donor heterogeneity. Nevertheless, acoustophoresis could be exploited to accurately manipulate MSCs from the homogenization observed at P4.
However, the determination of cells properties using our method cannot be applied to any cell types, the theory having some limitations. The Yosioka model (and the Gor’kov model, which is the most used) is only valid for spherical objects. In most cases, this is a reasonable assumption, as cells in suspension tend to adopt a spherical, isotropic shape, as long as they do not interact with a solid wall or with other cells. Nevertheless, some cells can be elongated or non-spherical, like red blood cells which have a biconcave shape. In this case, the model used is no longer valid and must be changed with another one, as the model proposed by Awatani [65].
From the experimental point-of-view, some improvements are needed to be able to apply this technique on larger cells populations. One of the limitation is related to the video recording. Ideally, one should be able to measure for every single cells their ACF, density and compressibility. It requires an automation of the video acquisition to change the recording frequency between the acoustic focusing step and the sedimentation step. We should also work with an open cavity connected to a syringe pump to mix the suspension after each measurements to avoid that all cells sediment after a single acquisition, which was also a strong limitations due to the limited number of cells available.
5 Conclusion
In this study we developed an original methodology based on the ARF to measure three physical properties of individual cells: the acoustic contrast factor, the density and the compressibility. These properties are of great interest for the biophysicits in general.
The principle consists in using the ARF as an acoustic tweezer. First, the ARF forces an isolated cell to move towards the acoustic levitation plane. Measuring the acoustic focusing velocity of a single cell allows the measurement of its ACF. The second step consists in using the ARF to trap a cell in the levitation plane before “dropping” it from the levitation plane just by turning-off the ultrasounds. Measuring its sedimentation velocity gives access to the given cell’s density. Due to experimental limiations, we could not run the two steps for the same cell so that we could not measure the compressibility of a single cell. Instead we used averaged values obtain for different sets of cells to deduce the averaged cells compressibility.
We validated this approach on well-known particles before applying it to two types of hMSCs. We found out that the density of hMSCs is relatively well-defined and constant, independant of the donors and of the number of passages, even at the first passage. On the contrary, the ACF and compressibility are highly dependant on the donor and on the number of passages. Interestingly, if the ACF is highly heterogenous at the very first passage, its mean value converges toward a relatively homogenous well-defined values after at least 4 passages. It demonstates that it will be highly difficult to process (sorting, washing) hMSCs just after their isolation from the donor’s tissue. It will become feasible only after at least 3 successive passages. It also indicates that the ACF of cells may be a new relevant mechanical properties that could be used to characterize the state of the cells. It would be interesting to run similar experiments on cancer cells, whose stiffness is different from healthy cells. One can expect that they will exhibit also a different ACF.
From a general point of view, this methodology can be applied to every cells, which can be marked with a fluorecent marker and which can be considered are roughly spherical. It has, for instance, already been applied succesfully to N2A and HepaRG cells.
Some improvements are needed and planned to make this approach more user-friendly and to apply it to a large number of different cell types. It may also be useful to evaluate the state of a cell and discrimimate between healthy or non-health cells. We think it should be helpful to any biologist or biophysicist needing the knowledge of these fundamental physcal properties of cells.
6 Nomenclature
6.1 Resource Identification Initiative
To take part in the Resource Identification Initiative, please use the corresponding catalog number and RRID in your current manuscript. For more information about the project and for steps on how to search for an RRID, please click here.
6.2 Life Science Identifiers
Life Science Identifiers (LSIDs) for ZOOBANK registered names or nomenclatural acts should be listed in the manuscript before the keywords. For more information on LSIDs please see Inclusion of Zoological Nomenclature section of the guidelines.
Data availability statement
The raw data supporting the conclusion of this article will be made available by the authors, without undue reservation.
Author contributions
All authors listed have made a substantial, direct, and intellectual contribution to the work and approved it for publication.
Acknowledgments
The authors wish to acknowledge Aenitis Technologies and the French ANRT (Agence Nationale pour la Recherche Technologique—French National Agency for Technological Research) for their financial support (Cifre PhD thesis of L. Bellebon). The Direction Générale de l’Armement (French Directorate General of Armaments) and the Agence Innovation Défense (French Innovation Defense Agency) are also acknowledge for the financial support to HR Sugier in the context of the Régime d’APpui à l’Innovation Duale (RAPID) program. The authors express their thanks to Dr. Faivre and to the plastic and reconstructive surgery unit of Percy military Hospital (Clamart) for the providing of the human samples.
Conflict of interest
LB and HS were employed by the company Aenitis Technologies.
The remaining authors declare that the research was conducted in the absence of any commercial or financial relationships that could be construed as a potential conflict of interest.
The handling editor declared a past co-authorship with the authors [MH, JLA].
Publisher’s note
All claims expressed in this article are solely those of the authors and do not necessarily represent those of their affiliated organizations, or those of the publisher, the editors and the reviewers. Any product that may be evaluated in this article, or claim that may be made by its manufacturer, is not guaranteed or endorsed by the publisher.
References
1. Notta F, Doulatov S, Laurenti E, Poeppl A, Jurisica I, Dick JE, et al. Isolation of single human hematopoietic stem cells capable of long-term multilineage engraftment. Science (2011) 333:218–21. doi:10.1126/science.1201219
2. Brooks AE, Iminitoff M, Williams E, Damani T, Jackson-Patel V, Fan V, et al. Ex vivo human adipose tissue derived mesenchymal stromal cells (asc) are a heterogeneous population that demonstrate rapid culture-induced changes. Front Pharmacol (2020) 10:1695. doi:10.3389/fphar.2019.01695
3. Bankó P, Lee SY, Nagygyörgy V, Zrínyi M, Chae CH, Cho DH, et al. Technologies for circulating tumor cell separation from whole blood. J Hematol Oncol (2019) 12:48. doi:10.1186/s13045-019-0735-4
4. Descamps L, Le Roy D, Deman AL. Microfluidic-based technologies for ctc isolation: a review of 10 years of intense efforts towards liquid biopsy. Int J Mol Sci (2022) 23:1981. doi:10.3390/ijms23041981
5. Dagur PK, McCoy JP. Collection, storage, and preparation of human blood cells. Curr Protoc Cytom (2015) 73:1–5. doi:10.1002/0471142956.cy0501s73
6. François P, Rusconi G, Arnaud L, Mariotta L, Giraudo L, Minonzio G, et al. Inter-center comparison of good manufacturing practices-compliant stromal vascular fraction and proposal for release acceptance criteria: a review of 364 productions. Stem Cel Res Ther (2021) 12:373. doi:10.1186/s13287-021-02445-z
7. Fong CY, Peh GS, Gauthaman K, Bongso A. Separation of ssea-4 and tra-1–60 labelled undifferentiated human embryonic stem cells from a heterogeneous cell population using magnetic-activated cell sorting (macs) and fluorescence-activated cell sorting (facs). Stem Cel Rev Rep (2009) 5:72–80. doi:10.1007/s12015-009-9054-4
8. Geens M, Van de Velde H, De Block G, Goossens E, Van Steirteghem A, Tournaye H, et al. The efficiency of magnetic-activated cell sorting and fluorescence-activated cell sorting in the decontamination of testicular cell suspensions in cancer patients. Hum Reprod (2007) 22:733–42. doi:10.1093/humrep/del418
9. Cao TM, Kusnierz-Glaz C, Valone F, Stockerl-Goldstein KE, Hu WW, Johnston L, et al. Rapid engraftment after allogeneic transplantation of density-enriched peripheral blood cd34+ cells in patients with advanced hematologic malignancies. Cancer (2001) 91:2205–13. doi:10.1002/1097-0142(20010615)91:12<2205::aid-cncr1250>3.0.co;2-q
10. Yuan D, Zhang J, Sluyter R, Zhao Q, Yan S, Alici G, et al. Continuous plasma extraction under viscoelastic fluid in a straight channel with asymmetrical expansion–contraction cavity arrays. Lab Chip (2016) 16:3919–28. doi:10.1039/c6lc00843g
11. Nam J, Lim H, Kim D, Jung H, Shin S. Continuous separation of microparticles in a microfluidic channel via the elasto-inertial effect of non-Newtonian fluid. Lab Chip (2012) 12:1347. doi:10.1039/c2lc21304d
12. Kim U, Qian J, Kenrick SA, Daugherty PS, Soh HT. Multitarget dielectrophoresis activated cell sorter. Anal Chem (2008) 80:8656–61. doi:10.1021/ac8015938
13. Pommer MS, Zhang Y, Keerthi N, Chen D, Thomson JA, Meinhart CD, et al. Dielectrophoretic separation of platelets from diluted whole blood in microfluidic channels. Electrophoresis (2008) 29:1213–8. doi:10.1002/elps.200700607
14. Pamme N, Manz A. On-chip free-flow magnetophoresis: Continuous flow separation of magnetic particles and agglomerates. Anal Chem (2004) 76:7250–6. doi:10.1021/ac049183o
15. Furlani E. Magnetophoretic separation of blood cells at the microscale. J Phys D Appl Phys (2007) 40:1313–9. doi:10.1088/0022-3727/40/5/001
16. Park JK, Song S, Jung H. Continuous focusing of microparticles using inertial lift force and vorticity via multi-orifice microfluidic channels. Lab Chip (2009) 9:939–48. doi:10.1039/b813952k
17. Smith KJ, Jana JA, Kaehr A, Purcell E, Opdycke T, Paoletti C, et al. Inertial focusing of circulating tumor cells in whole blood at high flow rates using the microfluidic ctckeyTM device for ctc enrichment. Lab Chip (2021) 21:3559–72. doi:10.1039/d1lc00546d
18. Giddings JC. Field-flow fractionation: analysis of macromolecular, colloidal, and particulate materials. Science (1993) 260:1456–65. doi:10.1126/science.8502990
19. Jiang Y, Miller ME, Hansen ME, Myers MN, Williams PS. Fractionation and size analysis of magnetic particles using FFF and SPLITT technologies. J magnetism Magn Mater (1999) 194:53–61. doi:10.1016/s0304-8853(98)00577-0
20. Vig AL, Kristensen A. Separation enhancement in pinched flow fractionation. Appl Phys Lett (2008) 93:203507. doi:10.1063/1.3028652
21. MacDonald MP, Spalding GC, Dholakia K. Microfluidic sorting in an optical lattice. Nature (2003) 426:421–4. doi:10.1038/nature02144
22. Shi J, Huang H, Stratton Z, Huang Y, Huang TJ. Continuous particle separation in a microfluidic channel via standing surface acoustic waves (ssaw). Lab Chip (2009) 9:3354. doi:10.1039/b915113c
23. Lenshof A, Magnusson C, Laurell T. Acoustofluidics 8: Applications of acoustophoresis in continuous flow microsystems. Lab Chip (2012) 12:1210. doi:10.1039/c2lc21256k
24. Guck J, Schinkinger S, Lincoln B, Wottawah F, Ebert S, Romeyke M, et al. Optical deformability as an inherent cell marker for testing malignant transformation and metastatic competence. Biophys J (2005) 88:3689–98. doi:10.1529/biophysj.104.045476
25. Bongiorno T, Kazlow J, Mezencev R, Griffiths S, Olivares-Navarrete R, McDonald JF, et al. Mechanical stiffness as an improved single-cell indicator of osteoblastic human mesenchymal stem cell differentiation. J Biomech (2014) 47:2197–204. doi:10.1016/j.jbiomech.2013.11.017
26. Yu H, Tay CY, Leong WS, Tan SCW, Liao K, Tan LP, et al. Mechanical behavior of human mesenchymal stem cells during adipogenic and osteogenic differentiation. Biochem Biophys Res Commun (2010) 393:150–5. doi:10.1016/j.bbrc.2010.01.107
27. Di Carlo D, Tse HTK, Gossett DR. Introduction: Why analyze single cells? Totowa, NJ: Humana Press (2012). p. 1–10. doi:10.1007/978-1-61779-567-1_1
28. Coulter WH. High speed automatic blood cell counter and cell size analyzer. Proc Natl Electron Conf (1956) 12:1034.
29. Brakke MK. Density gradient centrifugation: A new separation technique1. J Am Chem Soc (1951) 73:1847–8. doi:10.1021/ja01148a508
30. Grover WH, Bryan AK, Diez-Silva M, Suresh S, Higgins JM, Manalis SR, et al. Measuring single-cell density. Proc Natl Acad Sci U S A (2011) 108:10992–6. doi:10.1073/pnas.1104651108
31. Durmus NG, Tekin HC, Guven S, Sridhar K, Yildiz AA, Calibasi G, et al. Magnetic levitation of single cells. Proc Natl Acad Sci U S A (2015) 112:E3661–8. doi:10.1073/pnas.1509250112
32. Hoppe-Seyler F, Hoppe-Seyler F, Thierfelder , Lang K, Lehnartz E, Siebert G. Handbuch der physiologisch-und pathologisch-chemischen analyse: Untersuchung der organe körperflüssigkeiten und ausscheidungen. Springer (1953).
33. Danon D, Marikovsky Y. Determination of density distribution of red cell population. J Lab Clin Med (1964) 64:668–74.
34. Brinke MT, Regt J. 51cr-half life time of heavy and light human erythrocytes. Scand J Haematol (1970) 7:336–41. doi:10.1111/j.1600-0609.1970.tb01911.x
35. Barnkob R, Augustsson P, Magnusson C, Lilja H, Laurell T, Bruus H. Measuring density and compressibility of white blood cells and prostate cancer cells by microchannel acoustophoresis. In: Proceedings of the 15th MicroTAS; 2011 October 2-6; Seattle, Washington D.C 26. Seattle, WA, USA (2011).
36. Augustsson P, Barnkob R, Grenvall C, Deierborg T, Brundin P, Bruus H, et al. Measuring the acoustophoretic contrast factor of living cells in microchannels. In: Proceedings of 14th MicroTAS; 2010 October 3-7; Groningen, The Netherlands 14 (2010).
37. Hartono D, Liu Y, Tan PL, Then XYS, Yung LYL, Lim KM, et al. On-chip measurements of cell compressibility via acoustic radiation. Lab Chip (2011) 11:4072. doi:10.1039/c1lc20687g
38. Wang H, Liu Z, Shin DM, Chen ZG, Cho Y, Kim YJ, et al. Single-cell compressibility quantification for assessing metastatic potential of cancer cells through multi-frequency acoustophoresis. Microfluid Nanofluidics (2018) 22:68. doi:10.1007/s10404-018-2081-1
39. Cushing KW, Garofalo F, Magnusson C, Ekblad L, Bruus H, Laurell T, et al. Ultrasound characterization of microbead and cell suspensions by speed of sound measurements of neutrally buoyant samples. Anal Chem (2017) 89:8917–23. doi:10.1021/acs.analchem.7b01388
40. Augustsson P, Karlsen JT, Su HW, Bruus H, Voldman J. Iso-acoustic focusing of cells for size-insensitive acousto-mechanical phenotyping. Nat Commun (2016) 7:11556. doi:10.1038/ncomms11556
41. Dominici M, Le Blanc K, Mueller I, Slaper-Cortenbach I, Marini F, Krause D, et al. Minimal criteria for defining multipotent mesenchymal stromal cells. The international society for cellular therapy position statement. Cytotherapy (2006) 8:315–7. doi:10.1080/14653240600855905
42. Kabat M, Bobkov I, Kumar S, Grumet M. Trends in mesenchymal stem cell clinical trials 2004-2018: is efficacy optimal in a narrow dose range? Stem Cell Transl Med (2020) 9:17–27. doi:10.1002/sctm.19-0202
43. Adlerz K, Patel D, Rowley J, Ng K, Ahsan T. Strategies for scalable manufacturing and translation of msc-derived extracellular vesicles. Stem Cel Res (2020) 48:101978. doi:10.1016/j.scr.2020.101978
44. Leibacher I, Schatzer S, Dual J. Impedance matched channel walls in acoustofluidic systems. Lab Chip (2014) 14:463–70. doi:10.1039/c3lc51109j
45. Garbin A, Leibacher I, Hahn P, Le Ferrand H, Studart A, Dual J, et al. Acoustophoresis of disk-shaped microparticles: a numerical and experimental study of acoustic radiation forces and torques. J Acoust Soc America (2015) 138:2759–69. doi:10.1121/1.4932589
46. Yosioka K, Kawasima Y. Acoustic radiation pressure on a compressible sphere. Acustica (1955) 5:167–73.
47. Hay AE, Burling R. On sound scattering and attenuation in suspensions, with marine applications. J Acoust Soc America (1982) 72:950–9. doi:10.1121/1.388176
48. Olofsson K, Hammarström B, Wiklund M. Acoustic separation of living and dead cells using high density medium. Lab Chip (2020) 20:1981–90. doi:10.1039/d0lc00175a
49. Dron O, Aider JL. Acoustic energy measurement for a standing acoustic wave in a micro-channel. Europhysics Lett (2012) 97:44011. doi:10.1209/0295-5075/97/44011
50. Adrian RJ. Image shifting technique to resolve directional ambiguity in double-pulsed velocimetry. Appl Opt (1986) 25:3855. doi:10.1364/ao.25.003855
51. Olsen MG, Adrian RJ. Out-of-focus effects on particle image visibility and correlation in microscopic particle image velocimetry. Experiments Fluids (2000) 29:S166–74. doi:10.1007/s003480070018
52. Barnkob R, Kähler CJ, Rossi M. General defocusing particle tracking. Lab Chip (2015) 15:3556–60. doi:10.1039/c5lc00562k
53. Wang H, Liu Z, Shin DM, Chen ZG, Cho Y, Kim YJ, et al. A continuous-flow acoustofluidic cytometer for single-cell mechanotyping. Lab Chip (2019) 19:387–93. doi:10.1039/c8lc00711j
54. Phinney DG. Functional heterogeneity of mesenchymal stem cells: Implications for cell therapy. J Cel Biochem (2012) 113:2806–12. doi:10.1002/jcb.24166
55. Costa LA, Eiro N, Fraile M, Gonzalez LO, Saá J, Garcia-Portabella P, et al. Functional heterogeneity of mesenchymal stem cells from natural niches to culture conditions: Implications for further clinical uses. Cell Mol Life Sci (2021) 78:447–67. doi:10.1007/s00018-020-03600-0
56. Choudhery MS, Badowski M, Muise A, Pierce J, Harris DT. Donor age negatively impacts adipose tissue-derived mesenchymal stem cell expansion and differentiation. J Transl Med (2014) 12:8. doi:10.1186/1479-5876-12-8
57. Kastrinaki MC, Sidiropoulos P, Roche S, Ringe J, Lehmann S, Kritikos H, et al. Functional, molecular and proteomic characterisation of bone marrow mesenchymal stem cells in rheumatoid arthritis. Ann Rheum Dis (2008) 67:741–9. doi:10.1136/ard.2007.076174
58. Oñate B, Vilahur G, Ferrer-Lorente R, Ybarra J, Díez-Caballero A, Ballesta-López C, et al. The subcutaneous adipose tissue reservoir of functionally active stem cells is reduced in obese patients. FASEB J (2012) 26:4327–36. doi:10.1096/fj.12-207217
59. Kim M, Bae YK, Um S, Kwon JH, Kim GH, Choi SJ, et al. A small-sized population of human umbilical cord blood-derived mesenchymal stem cells shows high stemness properties and therapeutic benefit. Stem Cell Int (2020) 2020:1–17. doi:10.1155/2020/5924983
60. Liu Z, Screven R, Yu D, Boxer L, Myers MJ, Han J, et al. Microfluidic separation of canine adipose-derived mesenchymal stromal cells. Tissue Eng C Methods (2021) 27:445–61. doi:10.1089/ten.tec.2021.0082
61. Olm F, Lim HC, Schallmoser K, Strunk D, Laurell T, Scheding S, et al. Acoustophoresis enables the label-free separation of functionally different subsets of cultured bone marrow stromal cells. Cytometry A (2021) 99:476–87. doi:10.1002/cyto.a.24171
62. Madeira A, da Silva CL, dos Santos F, Camafeita E, Cabral JM, Sa-Correia I. Human mesenchymal stem cell expression program upon extended ex-vivo cultivation, as revealed by 2-de-based quantitative proteomics. PLoS One (2012) 7:e43523. doi:10.1371/journal.pone.0043523
63. Fu Q, Zhang Y, Huang T, Liang Y, Liu Y. Measurement of cell compressibility changes during epithelial–mesenchymal transition based on acoustofluidic microdevice. Biomicrofluidics (2021) 15:064101. doi:10.1063/5.0072126
64. Selich A, Daudert J, Hass R, Philipp F, von Kaisenberg C, Paul G, et al. Massive clonal selection and transiently contributing clones during expansion of mesenchymal stem cell cultures revealed by lentiviral rgb-barcode technology. Stem Cell Transl Med (2016) 5:591–601. doi:10.5966/sctm.2015-0176
65. Awatani J. Studies on acoustic radiation pressure. ii.(radiation pressure on a circular disk). J Acoust Soc America (1955) 27:282–6. doi:10.1121/1.1907515
Keywords: acoustic radiation force, cell mechanical properties, cell acoustic contrast factor, cell compressibility, cell density, mesenchymal stromal cells
Citation: Bellebon L, Sugier HR, Larghero J, Peltzer J, Martinaud C, Hoyos M and Aider J-L (2022) Characterization of mesenchymal stromal cells physical properties using acoustic radiation force. Front. Phys. 10:921155. doi: 10.3389/fphy.2022.921155
Received: 15 April 2022; Accepted: 08 July 2022;
Published: 23 August 2022.
Edited by:
Glauber T. Silva, Federal University of Alagoas, BrazilReviewed by:
Martin Wiklund, Royal Institute of Technology, SwedenXiang Wang, Changzhou University, China
Copyright © 2022 Bellebon, Sugier, Larghero, Peltzer, Martinaud, Hoyos and Aider. This is an open-access article distributed under the terms of the Creative Commons Attribution License (CC BY). The use, distribution or reproduction in other forums is permitted, provided the original author(s) and the copyright owner(s) are credited and that the original publication in this journal is cited, in accordance with accepted academic practice. No use, distribution or reproduction is permitted which does not comply with these terms.
*Correspondence: Ludovic Bellebon, ludovic.bellebon@orange.fr; Jean-Luc Aider, jean-luc.aider@espci.psl.eu
†These authors have contributed equally to this work and share first authorship