Multimodal Analysis of Central Nervous System Tumor Tissue Endogenous Fluorescence With Multiscale Excitation
 Fanny Poulon1
  Audrey Chalumeau1
  Frederic Jamme2
  Johan Pallud3,4,5 Pascale Varlet4,5,6
  Hussein Mehidine1,7 Marjorie Juchaux1 Bertrand Devaux3,5
  Matthieu Refregiers2
  Darine Abi Haidar1,7*
- 1IMNC Laboratory, UMR 8165-CNRS/ IN2P3, Paris-Saclay University, Orsay, France
- 2DISCO Beamline, Synchrotron SOLEIL, Gif-sur-Yvette, France
- 3Neurosurgery Department, Sainte-Anne Hospital, Paris, France
- 4IMA BRAIN, INSERMU894, Centre de Psychiatrie et de Neurosciences, Paris, France
- 5Paris Descartes University, Paris, France
- 6Neuropathology Department, Sainte-Anne Hospital, Paris, France
- 7Paris Diderot University, Sorbonne Paris Cité, Paris, France
The primary therapeutic approach for high-grade brain tumor is surgical resection. However, identifying tumor margins in vivo remains a major challenge. Biopsy analysis remains the standard diagnostic technique on tumor margins. This ex vivo analysis is time consuming and delays treatment. The aim of this study is tissue discrimination using label free autofluorescence and application in intraoperative optical probe for optical biopsy. Biopsy samples from 51 patients who underwent brain tumor surgery (21 metastasis tumors, 17 glioblastoma tumors, GBM, and 13 control samples) were included in this study. The samples underwent a multiscale and multi-contrast optical analysis. The excitation were performed with a deep-UV synchrotron beam, at 275 nm, and a near-infrared Ti:sapphire pulsed laser, from 690 to 1,040 nm. The detection modalities were fluorescence imaging, spectroscopy and fluorescence lifetime. Using deep-UV excitation, and combining three molecular ratios (tyrosin-tryptophan, tryptophan-collagen, tryptophan-NADH) resulted in discrimination with a sensitivity of 90% and a specificity of 73%. Using a two-photon excitation, and combining average lifetime, NADH-FAD ratio and Porphyrin-NADH ratio, resulted in discrimination with a sensitivity of 97% and a specificity of 100%. A multiscale algorithm resulted in an overlap of only 1.8% between control and tumor samples.
Introduction
Many Central Nervous System (CNS) tumors, such as glioblastoma and metastasis both primary and secondary, are infiltrating. Surgical resection is the main course of treatment for such tumors. The outcome and life expectancy after these operations is very low and their improvements is one of the major challenges in modern medicine. In recent years many new technologies such as intraoperative ultrasound [1], intraoperative magnetic resonance imaging (MRI) [2], confocal endoscopy [3] have been brought into the operating room to help guide surgeons in resecting tumors. However none of these tools has been able to discriminate infiltrating tumors margins (ITMs). These techniques have failed to offer cellular-level resolution, and to detect the low concentrations of tumor cells in infiltrating regions. As a consequence, the chosen surgical approach is to maximize the extent of tumor removal while minimizing intrusion on the eloquent brain area [4]. And while resection improves the outcome and life expectancy of the patient, the surgeon still operates “blind” on the true nature of margins. To meet the challenge of discriminating ITM's intraoperatively, there has been a boom in developing surgical medical imaging tools that can contrast brain tissues and discriminate cell types. Examining tissue autofluorescence with optical microscopy techniques is one answer to the demand for intraoperative ITM discrimination. Several molecules produce an endogenous fluorescence signal in the brain [5] and this signal can change from one type of tissue to another. This difference can be used to distinguish tumoral regions from healthy ones (6–8). Following that direction, our group miniaturized two-photon microscopy into a fibered configuration for intraoperative purpose. This endomicroscope enables two imaging contrasts: two-photon autofluorescence emission (TPEF) and second harmonic generation(SHG), with an excitation in the near infrared (NIR). The NIR excitation lies in the tissue therapeutic window, resulting in less photodamage and a better penetration depth. In our set-up we also choose to include several types of measurements: full field imaging, micro-spectroscopy and fluorescence lifetime to provide the most reliable and reproducible response. To validate this technical approach we built, in parallel, an optical database of the autofluorescence response from brain tissues which will be used to develop and test robust algorithms to automatically discriminate tissue and validate automatic tissue analysis, potentially eliminating subjective reading of images by a human operator. Multimodal study of endogenous fluorescence on human tissue is relatively new and, according to the literature, only a few tissue types have been explored. Our lab focused on brain tissue endogenous fluorescence by partnering with (1) the Saint-Anne hospital (Paris, France) who provided biopsy samples and medical knowledge, and (2) Synchrotron SOLEIL who provided access to a deep UV imaging platform at DISCO beamline, while the IMNC, performed two-photon microscopy with a benchtop microscope.
This study searched for an objective optical marker to discriminate tumor from healthy tissue, and to discriminate primary from secondary tumors. A large study on fixed biopsy tissue of primary (glioblastoma), secondary (metastasis) tumor and control cortex was performed, with large scale excitation ranging from deep-UV (DUV) to near infrared (NIR), and several modalities of detection from qualitative, fluorescence and lifetime imaging, to quantitative, spectral and lifetime measurements. Finding a discriminating optical marker was made possible by exploiting multiple contrast and building 2D and 3D discriminative algorithms for the DUV and NIR excitations individually, and then in combination. Discrimination specificity and sensitivity were in the 70–100% range, highlighting the power of optical analysis to discriminate the nature of tissue with enough precision to be clinically useful. The qualitative results of our study were also used to compare optical microscopy technology to the gold standard H&E staining. This comparison highlighted discriminative histological structure in the optical images, and a “blind” pathologic analysis was then performed directly on our images.
Materials and Methods
Study Design
The samples were excited in the deep-ultraviolet (DUV) and the near infrared (NIR) range on two different platforms. The design of the study is presented in Figure 1. On both platforms an excitation emission matrix was performed to highlight the different excited components and to select the optimal wavelengths for our study. Under DUV excitation we chose 275 nm as the optimal wavelength, being the most efficient in set-up, and in exciting four components simultaneously: Tyrosin (Tyr), Tryptophan (Trp), Collagen crosslinks (Col), and NADH [6, 7].
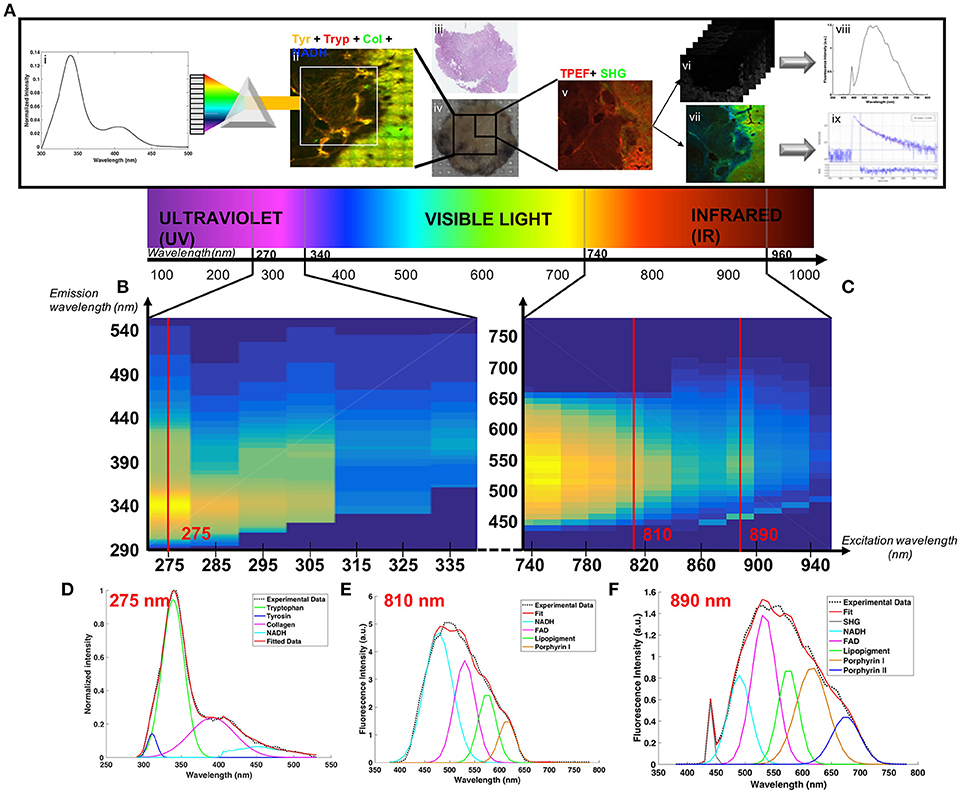
Figure 1. (A) Schematic of the acquisition-analysis protocol from deep-UV to infrared excitation (B) Deep-UV excitation-emission matrix. (C) Two-photon (NIR excitation) excitation-emission matrix. The bottom line present how were fitted tyrosin, tryptophan, collagen crosslinks and NADH at 275 nm (D), NADH, FAD, lipopigments, porphyrin I and porphyrin II at 810 nm (E) and SHG, NADH, FAD, lipopigments, porphyrin I and porphyrin II at 890 nm (F).
In the NIR range we chose two excitation wavelengths: 810 and 890 nm. Four molecules and SHG were tracked: NADH, FAD, Lipopigments, Porphyrin [6, 7]. At 810 nm excitation NADH was optimally detected and at 890 nm we obtained the best tradeoff between SHG and emitted fluorescence [8]. Samples (Figure 1Aiv) underwent the following process: (1) large mosaic at 275 nm in the four detection channel (Tyr, Tryp, Col, NADH) (Figure 1Aii) (2) selection of a region of interest and spectral measurements at 275 nm (Figure 1Ai) (3) Large mosaic at 890 nm (Figure 1Av) (4) selection of the same region of interest as in DUV to perform spectral (Figure 1Avi) and FLIM measurements (Figure 1Avii) at 810 and 890 nm. Once data acquisition was completed, analysis followed: (i) spectral fitting of the data at each wavelength using homemade Matlab program (Figures 1Ai,viii) (ii) Fitting of the lifetime data with Symphotime software (Figure 1Aix) (iii) Phasor analysis of the lifetime data (iv) construction of discriminative algorithm combining the different analysis results and (v) comparison with the gold standard histology (Figure 1Aiii).
Sample Preparation
A collaboration with the anatomopathology and neurology departments of the Saint-Anne Hospital (Paris, France) provide a large cohort of human biopsy samples. The protocol of experimentation was approved by the Institutional Review Board of Sainte Anne Hospital (Ref CPP S.C.3227). Fifty-one individuals (31 males, 20 females; age average 54.1 ± 17 year-old) were included and an informed written consent was obtained from all patients prior to enrollment. Frozen human brain tissues, conserved at −80°C, were obtained from two types of tumor (21 metastasis samples, Meta; 17 glioblastoma samples, GBM) and Control specimens (13 patients with no history of tumor) selected from epileptic surgery. The metastases were originated from lung, breast, bladder and skin. The characteristics of the cohort are summarized in Table 1.
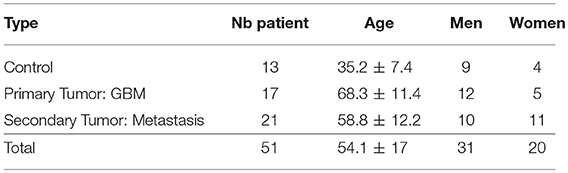
Table 1. Description of samples.
A dedicated transport (360°, France) brought the selected cohort to the IMNC laboratory (Orsay, France). Samples were conserved at −80°C, before being transferred to a −20° freezer 24 h before being cut with a cryostat (Leica CM 1950). Ten-micron slices were deposited on quartz coverslips and microscope slides, and fixed with an ethanol solution (100%). The quartz coverslips were brought to the Synchrotron in a dedicated box, and the microscope slides were used for H&E staining and two-photon imaging on the PIMPA platform.
Histological Process: Hematoxylin and Eosin Staining
A gold standard Hematoxylin and Eosin (H&E) staining was performed on one of the microscope slices following the Sainte-Anne hospital protocol [9] whose steps are hydration, H&E staining, dehydration, and toluene fixation. Once stained the samples were imaged in a Digital Slide Scanner NanoZoomer 2.0 (Hamamatsu Photonics K.K, Hamamatsu, Japan).
Deep-Ultraviolet Imaging and Spectral Measurements
The Deep-Ultraviolet (DUV) measurements were performed on the DISCO beamline at the Synchrotron SOLEIL [10]. Two set-ups, a full-field microscope (Zeiss Axio-observer Z-1) and a microspectrofluorimeter (Olympus IX71), were used for this study. The samples were excited with the continuous emittance from the DISCO beamline bending magnet between 275 and 335 nm. The details of the set-up have been presented in other studies [11, 12].
A large mosaic of the sample was made under the full field microscope with an excitation wavelength of 275 nm and four emission filters (307–323, 323–357, 408–438, and 435–455 nm, Semrock, USA) in front of a detector (CCD camera, Pixis BUV, Princeton Instrument, USA). Regions of interest were then selected in this mosaic and spectral measurements were done with the microspectrofluorimeter at the same excitation wavelength. One second integration time and a 10 microns lateral step size were applied. An Excitation-Emission matrix was also measured using the microspectrofluorimeter. An emission spectrum was acquired for each excitation wavelength from 275 to 335 nm every 10 nm.
Two-Photon Imaging and Quantitative Measurements
A two-photon benchtop microscope (TCS SP8 MP microscope, Leica Microsystems, Wetzlar, Germany) combined with a Ti:sapphire laser source (Mai Tai DeepSee, Spectra-Physics, Santa Clara, USA) was used to perform fluorescence imaging (TPEF), emission spectra and fluorescence lifetime imaging (FLIM). The set-up and acquisition methods are described thoroughly in our previous work [8, 13]. The measurements were recorded on the same region of the sample as the one imaged with the DUV excitation. On each region TPEF and SHG image were recorded using 890 nm excitation wavelength. Then spectral and FLIM analyses were performed using 810 and 890 nm excitation wavelength. Excitation-Emission matrices were also measured by acquiring a spectral stack at excitation wavelengths between 740 and 940 nm every 20 nm.
Data Analysis
DUV Analysis
DUV full-field images were processed, using Image J, to create a merged image of the fourth detection filter and to visually identify any difference between tissue regions. The spectral results were analyzed using lab-written Matlab script and the PLS toolbox (Eigenvector Research Inc., WA, United-States). Two types of analyses were performed on the data. First was a cluster analysis to extract spectral signature of tumoral region, and second was a fitting analysis to compare tissues at a molecular scale.
In the first method, the data were first preprocessed using lab-written scripts developed by SOLEIL and IMNC teams, in order to: (1) reduce the noise, (2) suppress dead pixels, (3) set-up a baseline, and (4) normalize to the maximum of the cohort. Then a discriminative cluster analysis (DCA, K-Means) was applied to all the pixels of every images using the PLS toolbox. The number of input clusters was chosen iteratively looking at the results, and fixed at five in our case.
The second analysis applied on the spectral data was a spectral fitting of the different molecular contributions. The fit was performed using a lab-written Matlab script previously used on visible and near infrared autofluorescence data 15, 20 and adapted to the DUV data.
The results of the fit were used to compare different molecular ratios. The ratio between tryptophan and collagen crosslinks was given a particular attention, but tyrosin/tryptophan and tryptophan/NADH ratio were also computed to build a robust discriminative marker.
Two-Photon Analysis
TPEF images were processed using Image J, in order to produce both a good quality and scaled image of the merged TPEF-SHG signal. The images were then compared with H&E images. After highlighting the histological structure on the TPEF images, a neuropathologist was asked to perform a blind analysis. The analysis was done on paired TPEF and H&E images from 25 samples (10 metastases, 8 glioblastomas, 7 controls). First, a senior neuropathologist, blind to the TPM results, performed an initial histopathological analysis. No specimen was excluded due to lack of histopathological representativeness. Then, 6 months later, we presented a web-based survey of the TPEF images (PNGTPEF/SHG images) and the participant was asked to classify the sampled tissue in four categories: (1) GBM; (2) Meta; (3) healthy tissue; or (4) unclassified. Although completely blind to the initial histological analysis, the participants had access along with the TPM images, to typical clinical data including patient's age, gender, clinical presentation, tumor location, and pre-operative MRI images. These results were then compared to initial histological analysis to calculate the accuracy of the diagnosis on TPEF images.
The spectral stacks were opened in Image J to extract five spectral region of interest (ROIs) in each of the 810 and 890 nm images, and then processed in Matlab. The obtained spectra were fitted using a lab-written Matlab script previously published and used on meningioma samples [8]. Five autofluorescent molecules were fitted: NADH, Flavin adenine dinucleotide (FAD), Lipopigments, Porphyrin I and Porphyrin II. The results of the fit were used to compute two indicators according to the literature [14, 15]. The oxydo-reduction ratio between NADH and FAD:
And the optical index ratio between NADH and porphyrin:
The NADH values were extracted from the emission spectrum using 810 nm excitation wavelength and the FAD and Porphyrin from the emission spectrum using 890 nm excitation wavelength. To be comparable, the spectra were normalized by the excitation power.
As with spectral data, the FLIM data were analyzed using two methods, fitting and non-fitting, which were developed. First, bi-exponential fitting—the method implemented in the acquisition software (Symphotime Vx64, Picoquant)—was used. On each image the same five ROI as for spectral measurements were selected, and on each ROI the fluorescence decay histogram was bi-exponentially fitted. The amplitude average lifetime was extracted from this fit using a method previously published on bladder tumor [16]. The second implemented method used a non-fitting process, called phasor analysis. We started with the time-correlated single-photon counting (TCSPC) detection of fluorescence decay curves at each pixel of a 3 * 3 mosaïc image. The intensity of a 32 * 32 pixel (a 28 μm-side) square was added together to obtain the decay I(t) at each reduced pixel.
In the phasor approach, the decay I(t) at each pixel is transformed into two coordinates in a Cartesian plot according to the following equations:
where, Si(ω) and Gi(ω) are the x and y coordinates of the phasor in the phasor plot, respectively; ω is the angular repetition frequency linked to the signal length (L) and the sampling period (Ts) by the relation: .
We stored for each pixel Si(ω), Gi(ω) and Mi – the normalized integration under the decay of each pixel to provide the phasor histogram of the 3*3 mosaic image. A global phasor histogram grouping the data of all the samples (n = 51) was plotted. Five areas were selected on this global phasor histogram and the images were reconstructed with a five colors-scale corresponding to selected area. Pixel colors criteria following Equation (5) were used to compare the data from each group.
Value of fluorescence lifetime was also determined in this analysis using an error ellipse method. An ellipse that should contain 95% of phasor counts in each area was fitted on the five areas of the global histogram. The two intersections between the major axis and the circle segment are linked to the two lifetimes and their contributions.
Statistical Analysis
The different computed ratios were compared statistically with t-test in Matlab to obtain a p-value with a criteria of significance at p < 0.5.
The representation in scatter plot and the blind analysis were evaluated by defining the sensitivity (Se) and specificity (Sp) of the discrimination criteria, following Equations (6, 7).
The variables were TP = True Positive, FP = False Positive, TN = True Negative and FN = False Negative, defined as: TP = Tumoral tissue classified as tumoral, FP = Control tissue classified as tumoral, TN = Control tissue classified as healthy and FN = Tumoral tissue classified as healthy.
Multiscale Discriminative Algorithm
In the various excitation ranges the three best indicators were chosen: (1) Porphyrin/NADH ratio using two-photon excitation, (2) Tryptophan/collagen crosslinks ratio at DUV excitation and (3) the average lifetime using 890 nm excitation. A region of interest measured in our protocol could be then represented in the 3D-scatter plot with these three indicators as its coordinate. The scatter cloud of a group was fitted by a Gaussian ellipsoid using the mean and the standard deviation as parameters for the covariance with the ellipse to cover 60% of the total probability mass. The percentage of overlap between the ellipses for each group was then calculated to assess of the performance of such algorithm.
Results
In this large study, we first look at the results under DUV excitation. The Figure 2 presents a summary of the analysis results and discrimination reached in this excitation range.
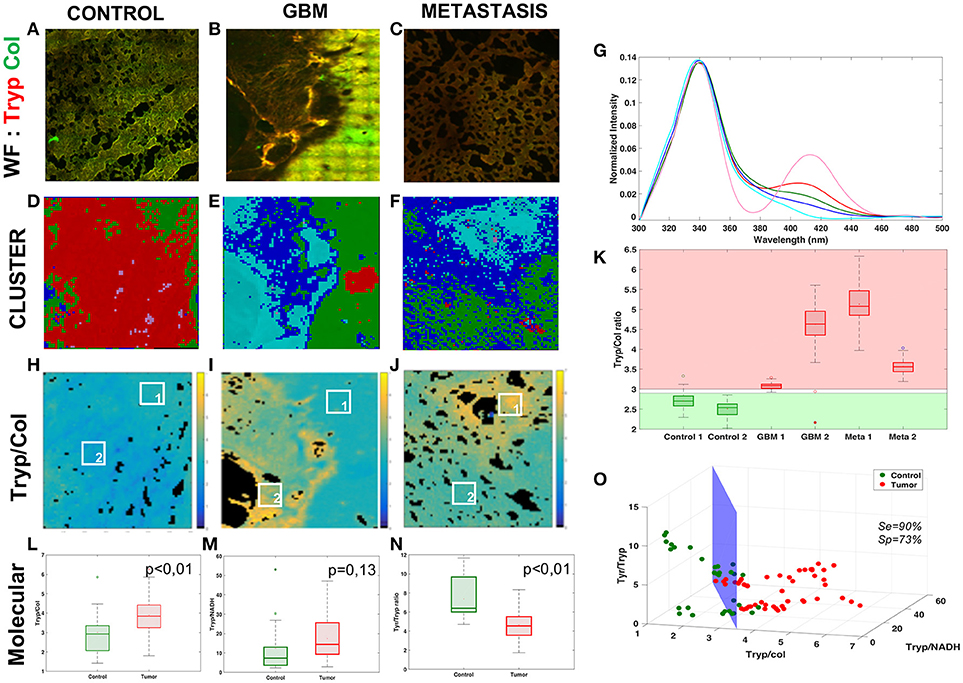
Figure 2. Analysis of the Deep-UV data. Comparison of the three tissue groups control (A,D,H), glioblastoma (B,E,I) and metastasis (C,F,J) with different analysis methods: wide-field(WF) imaging (A,B,C), spectral clustering (D,E,F) with a 5-cluster decomposition shown on a graph (G), map of the tryptophan/collagen ration (H,I,J) with comparison of selected ROIs (K). Molecular analysis of the tryptophan/collagen ratio (L), the tryptophan/NADH ratio (M) and the tyrosin/tryptophan ratio (N) combined in 3-D scatter discrimination plot (O).
Figures 2A–C shows an example of the superposition of the tryptophan (red) and collagen (green) channels of wide-field (WF) image in each group. The control image presents an homogeneous color, while in primary and secondary tumor some regions show a different color, exposing a variation in the tryptophan-collagen ratio in tumoral tissue. Based on this observation a method of clustering was applied to the spectral data to validate this hypothesis and to see if two types of spectral signatures were highlighted.
The Figures 2D–F shows the results of the spectral cluster analysis on the same region as the one on the WF images. The spectra corresponding to each color are superposed in the Figure 2G. The two dominant colors in control (red and pink) correspond to spectrum with a main peak in the tryptophan range and a secondary peak in the collagen crosslinks range, where the different dominant colors (blue and cyan) in tumor correspond to spectrum with only one main peak in the tryptophan range. These results led us to track the ratio between the two main peaks of the DUV spectral response, the Tryptophan/collagen ratio.
Figures 2H–J gives an example of the Tryptophan/collagen ratio in a tissue of each group, the ratio being higher in tumoral groups than in control group. The results of the selected regions of interest (ROI) are plotted in the Figure 2K. A threshold value distinguishes tissue type: below 2.8 the tissue is healthy, above 3 the tissue is tumoral. This discrimination, highlighted on a small set of data, was then validate statistically on a larger set of data in the Figure 2L. The Tryptophan/collagen ratio showed a significantly higher ratio in tumoral tissue than in control tissue (p < 0.01). Then new molecular ratios were tested. The results are shown in Figures 2M,N. The Tryptophan/NADH ratio also showed the same trend but with less statistical significance (p = 0.13). The third ratio, Tyrosine/Tryptophan, showed a lower value in tumoral tissue than control (p < 0.01). To find a discriminative algorithm with statistical significance, these three molecular ratios were extracted in five ROI in different types of tissue, and projected as the coordinate of the ROI in a 3D-scatter plot (Figure 2O). A discriminative cross-section could be drawn between tumoral tissue (red dots) and control tissue (green dots), with calculated algorithm specificity of 73% and sensitivity of 90%. This discriminative algorithm has a high sensitivity, making it a good diagnosis tool, ruling out tumor presence with precision. However it still gave a non-negligible level of false positives.
The data obtained in the NIR excitation range were tested with similar approaches. The results are shown in Figure 3.
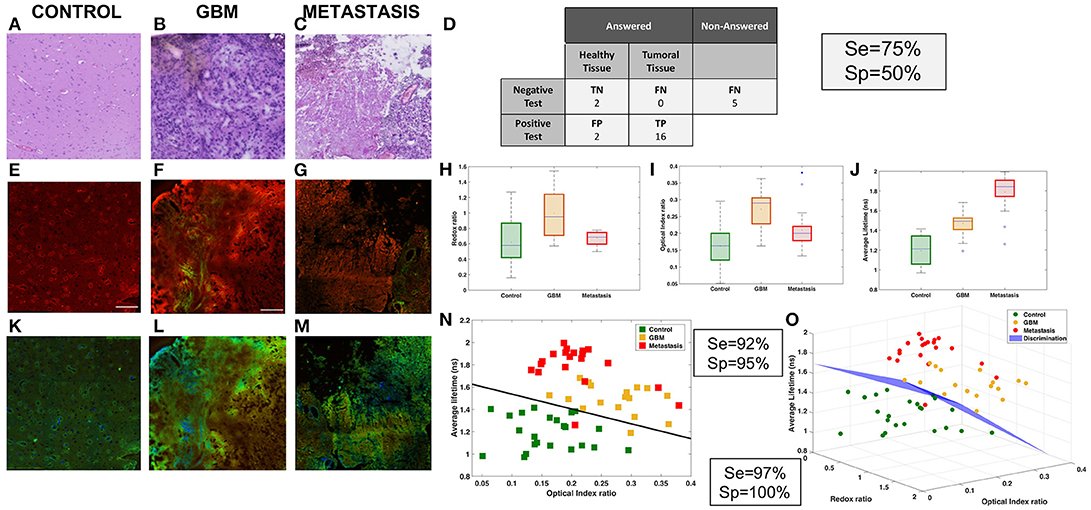
Figure 3. Analysis of NIR data. Comparison of three tissue groups: control (A,E,K), glioblastoma (B,F,L) and metastasis (C,G,M) with different imaging techniques H&E (A,B,C), TPEF imaging (A,F,G) and FLIM (K,L,M). Results of the “blind” analysis on TPEF for diagnosis (D). Boxplot of the spectral molecular analysis, redox ratio (H) and optical index (I), these results were combined in a scatter plot (N). Boxplot of the average lifetime (J). 3D-scatter of the two molecular indicators and the average lifetime to build a discriminative algorithm (O).
The first approach was to compare the TPEF images, Figures 3E–G, to the histological gold standard H&E images, Figures 3A–C, to find the structure used to discriminate tissues. The TPEF images are a merger of autofluorescence emission, red contrast, and SHG signal, green contrast. In the control, Figures 3A,E, typical cortical arrangement of neurons (dark violet triangular spot in H&E), showed a strong fluorescent spot on the TPEF images. In the glioblastoma, Figures 3B,F, large vessels, identified by light pink structures in H&E and filament in SHG green channel. The vessels are surrounded by a high density of tumor cells, identified with an intense signal in the fluorescence image. In the metastasis, Figures 3C,G, strong neovascularization with tumor cells entangled, light pink signal signal in H&E surrounded by high density of cells, were identified on the TPEF images by a strong SHG signal with bright fluorescent spots. Thereafter the TPEF were given to senior neuropathologist for blind diagnosis, Figure 3D, in order to evaluate the capability of direct diagnosis on TPEF images. The senior pathologist was able to discriminate tissues with a specificity of 50% and a sensitivity of 75%.
Next the quantitative results were analyzed on each TPEF image region. A spectral response with a 810 and 890 nm excitation was measured and different molecular indicators were calculated at different regions of interest for every tissue. The two spectral markers calculated were the redox ratio and the optical index. In Figure 3H, the redox tended to be higher in tumoral tissue and discriminative between tumor types (pcontrol−GBM < 0.01, pcontrol−meta = 0.06, pGBM−meta < 0.01). The optical index is also higher in tumoral tissue and can discriminate primary from secondary tumor (pcontrol−GBM < 0.01, pcontrol−meta = 0.01, pGBM−meta < 0.01). Complementary quantitative measurements were performed on the samples: extraction of the average lifetime using a fitting method applied on the various regions of interest, and boxplot comparison of different tissue types, as shown in Figure 3J. This method could discriminate the three types of tissue (pcontrol−GBM < 0.01, pcontrol−meta < 0.01, pGBM−meta < 0.01).
The results were combined to develop a discriminative algorithm. First we used the two most efficient indicators, optical index and average lifetime (Figure 3N). Results with specificity and sensitivity respectively of 92 and 95% are shown in a 2D-scatterplot. To improve the diagnostic algorithm, a third piece of information was added, the redox ratio to translate metabolic changes. This resulted in a 3D-representation of the data (Figure 3O). A cross-section was drawn to obtain a sensitivity of 97% and specificity of 100%.
The best method to directly discriminate tissue types was shown to be lifetime measurements. We decided to investigate it more in detail by implementing another analysis method, called the phasor approach [17] which helped to uncover a discriminative indicator without fitting of data. The results are shown in Figure 4.
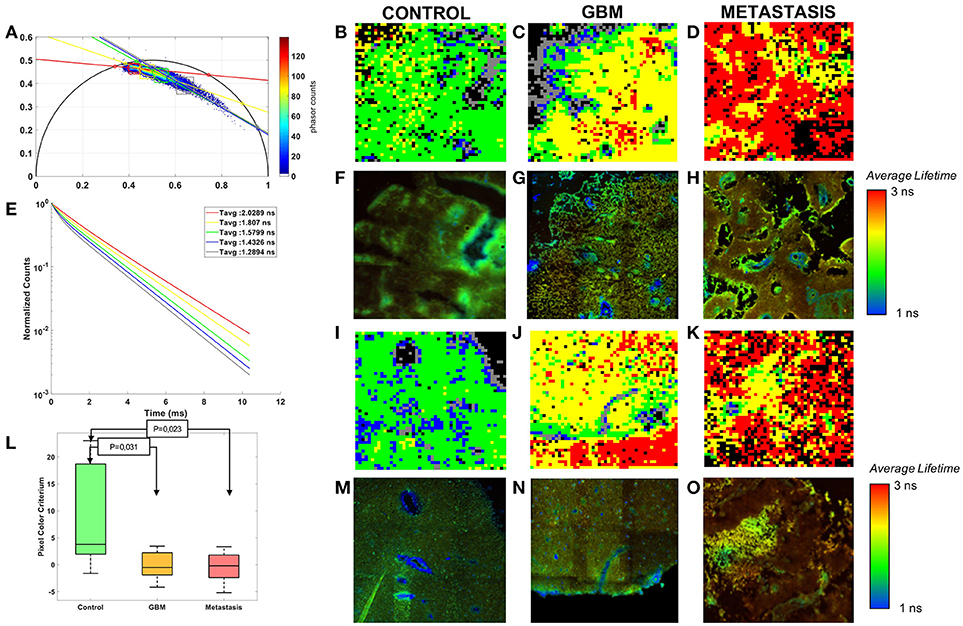
Figure 4. Phasor analysis of the FLIM: (A) Global phasor histogram with the selected zones and the error ellipses. (E) Average lifetime fluorescence decay calculated in each zones. (L) Boxplot of the pixel colors criterion with p-values of the control-tumor test. Comparison of three tissue groups control (B,F,I,M), glioblastoma (C,G,J,N) and metastasis (D,H,K,O) with rebuilt images of the phasor analysis (B,C,D,I,J) and Fast FLIM of the microscope (F,G,H,M,N,O).
Control, GBM and Metastasis decays were gathered on a global phasor counts, Figure 4A. In this phasor plot five local maximums of counts were observed and selected in order to assign a different color to pixels within each region. Each image using the phasor plot was displayed with this color code. Examples are shown in Figures 4B–D,I–K and compared to the fast FLIM images obtained by the microscope software. The images show green and blue dominant in control, while red and yellow are more present in tumoral tissue. To quantify this difference a color ratio was defined and calculated in each sample. The results, comparing the tissue groups, are presented in Figure 4L. Each tumor could be differentiated from the control tissue (Control-GBM: p = 0.03 and Control-Metastasis: p = 0.02). However it did not give a significant discrimination between primary and secondary tumor. The green and blue areas, occupying the majority of healthy tissue, had an average lifetime around 1.4–1.6 ns, while control had a mean average lifetime around 1.3 ns in the fitting method. Yellow and red areas, occupying the majority of tumoral tissue, had average lifetimes around 1.8–2 ns, while the GBM mean was around 1.6 ns and the metastasis mean around 1.9 ns in the fitting method.
From DUV to NIR, various interesting discriminative indicators were highlighted. To improve the capacity to discriminate not only control from tumor, but also tumor types from one another, the three most efficient indicators were combined for scatter plotting the groups in 3D space to highlight discrimination. The results with the indicators, Porphyrin-NADH ratio at two-photon excitation (Optical Index), Tryptophan collagen ration at DUV excitation (DUV ratio) and the average lifetime at 890 nm, are shown in the Figure 5.
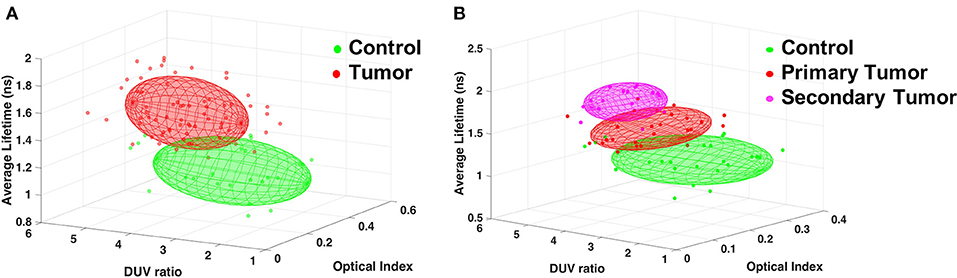
Figure 5. Discrimination of tissue types combining three indicators: Porphyrin/NADH ratio using two-photon excitation (Optical Index), Tryptophan/collagen ratio at DUV excitation (DUV ratio) and the average lifetime using 890 nm excitation. (A) Results comparing Control and any tumor types. (B) Results for Control, primary tumor (GBM) and secondary tumor (Metastasis).
This 3D algorithm was used to find an accurate discrimination between a healthy region and any tumoral region, Figure 5A, the points of each type were approximated by an ellipsoid giving an overlap of only 1.8%, resulting in high rate of tumor discrimination. This algorithm was also used to look for discrimination between tumor types, Figure 5B, primary tumors had only 6.7% overlap with secondary tumors. This second 3D-plot also showed that the secondary tumors could be unambiguously discriminated from the control tissue.
Discussion
In this study excitation ranging from DUV to NIR, various detection contrasts, and multiple methods of analysis were applied to biopsied brain tissue of three types: primary tumors (n = 17), secondary tumors (n = 21) and controls (n = 13). We demonstrated that: (1) Tumor could be discriminated from control in the DUV excitation range using molecular ratio. (2) The merged TPEF-SHG images revealed features similar to those seen in standard neuropathology, and could discriminate tumor from normal tissue. (3) Quantitative TPM signals also discriminated between tissue types combining molecular ratio and average lifetime. (4) Lifetime measurements analyzed with a phasor method gave a discriminating criteria significantly (p < 0.05) distinguishing control from tumor tissue. (5) A multiscale discriminative algorithm, could graphically separate the tissue types in a 3D plot.
First, using DUV spectral response and cluster analysis, we showed that a distinguishing spectral signature for tumoral vs. healthy tissues, quantified in the tryptophan and collagen peaks ratio calculated on all spectral mosaic, with < 2.8 being healthy, and >3 being tumoral. Few studies have exploited DUV excitation of Tryptophan. Pradhan et al. [18] studied Tryptophan/NADH and found a higher ratio in metastasis tissue, similar to our findings in ex vivo human brain tumor. The autofluorescence of collagen has also been studied in tumor with a UV excitation. Georgakoudi et al. looked at cervical lesions and Barett's esophagus and found lower collagen signal in high-grade dysplasic legions [19]. Pu et al. collagen emission in prostate cancer, and showed a decrease in tumor region. They looked at the NADH/collagen ratio for a robust quantitative indicator of tissue nature [20]. The actual state of art is often comparing one or two molecules to find discrimination. In order to improve these actual performances, we build here an analysis based on the fluorescence emission of four molecules. The 3D discriminative algorithm using three molecular ratios achieved specificity of 73% and sensitivity of 90% and thus could be used as diagnostic tool. However, low specificity indicates significant false-positives when a tumor is detected.
Secondly, we used the NIR images superposing two modalities: fluorescence emission and second harmonic generation, to highlight tissue structure comparable to the histological standard for tumor diagnosis. A neuropathologist was asked to perform a histological diagnosis blind to the H&E results. This test showed discrimination with a sensitivity of 75% and a specificity of 50%. Training neuropathologists on TPEF images could improve these results since this trial was a first time experience using this imaging modality. Blind analysis of TPEF-SHG images have never been performed before on brain tumor, but on other types of cancer, such as gallblader cancer [21], breast masses [22], and liver cancer [23]. In these analysis, they found even higher results than us with accuracy of discrimination around 90%, due to training of the neuropathologist on bigger sets of data. Analysis directly on TPEF images have advantages over staining technique, such as time management and tissue preservation, however it still requires a trained neuropathologist to diagnose based on visual observation. The real advantage of optical microscopy in our study is the capacity to provide more parameters and new quantitative measurements, feeding into data analysis and visualization that support automated distinguishing of tissues. Two-photon excitation provides other parameters besides fluorescence intensity: the fluorescence lifetime and SHG. We use the power of these techniques to achieve a better discrimination of the nature of tissue by combining the results of molecular analysis on emitted spectrum and the lifetime analysis of the same region. The combination in 3D-plot of: (1) the average lifetime, (2) the FAD/NADH ratio and (3) the Porphyrin/NADH gave the best discrimination with a 97% sensitivity and 100% specificity. This type of analysis were already published only with visible, one-photon excitation [24]. Other groups tried to build a 2D algorithm, using visible excitation: Liu et al. [14] studied redox ratio and spectral shape with a 89% sensitivity and a 97% specificity. Lin et al. [25] analyzed fluorescence intensity and reflectance at 337 nm, with a one-step algorithm yielding sensitivity and specificity under 85%. A two-steps algorithm gave them better results (sensitivity, 100%, specificity, 76%). However we can achieve similar results with a one-step algorithm, which is easier to implement in a clinical workflow.
Thirdly, using two photons imaging, only the fluorescence lifetime produced significant discrimination among the three types of tissue (p < 0.01). Due to their independence from concentration, fluorescence lifetime measurements have been the most popular technique. Several teams have tried to implement it with various analysis algorithms to answer the question of glioma margin resection. Sun et al. [26] used the Laguerre coefficient value and found a longer lifetime in GBM than normal tissue with a p-value < 0.05. They preferred this technique because there is no deconvolution process of the data, avoiding any assumption on the decay shape. Another non-fitting technique is the phasor approach [17]. This is the second method we tried, since it offers a very graphical representation of data. The phasor approach showed five distinct regions, with some being predominant in tumor and others in control tissue. From this a numerical indicator from region repartition was exploited and resulted in a significant difference between tissue types (0.023 < p-value < 0.031). However, compared to the exponential fitting, primary and secondary tumor could not be discriminate. Other exploitations of phasor plot exist [27], that could be implemented to improve these results.
We took advantage of our multiscale analysis and designed a graphical discriminating algorithm based on spectral DUV measurements, spectral NIR measurements, and lifetime NIR measurements. We distinguished an ellipsoid region for each type of tissue. Primary tumor and control had only 1.8% of overlap. Secondary tumor and control had 0% overlap and primary and secondary tumor had 6.7% overlap.
This study highlights the capability of discriminating brain tissue type from one another, tumoral from control, but also tumor types from one another. This was achievable by combining the different quantitative and qualitative measurements accessible with optical microscopy. The technique used in this study can be implemented in real-time in the operating room with fast and direct analysis. These results are bringing us closer to clinical use and could improve the surgical practice of tumor resection. The perspective of this study are to extend the work to fresh tissues and other tissue types to get information closer to the in vivo condition and improve the discriminating algorithm.
Data Availability Statement
The raw data supporting the conclusions of this manuscript will be made available by the authors, without undue reservation, to any qualified researcher.
Author Contributions
FP collected, analyzed the data and wrote the manuscript. AC and HM analyzed data and participated in writing. FJ supervised the UV experiment and discuss results. JP provided samples. PV performed histopathological analyses and participated in writing and BD provided samples and participated in writing. MJ participate to the sample preparation. MR analyzed data and participated in writing. DAH designed the research project, the protocols for experiments, supervised the work and participated in writing. Equally important, DAH provided necessary funds for all the experiments and measurements.
Conflict of Interest Statement
The authors declare that the research was conducted in the absence of any commercial or financial relationships that could be construed as a potential conflict of interest.
Acknowledgments
The authors thank their collaborators of the department of Neurosurgery and of Neuropathology of the Sainte-Anne Hospital, Paris Descartes University, Paris, France. We would like to thank Synchrotron SOLEIL for beamtime under project #20160206 and #20160978. Thanks also to PIMPA Platform partly funded by the French program Investissement d'Avenir run by the Agence Nationale pour la Recherche (grant Infrastructure d'avenir en Biologie Santé – ANR – 11-INBS-0006). This work is financially supportted by ITMO Cancer AVIESAN (Alliance Nationale pour les Sciences de la Vie et de la Santé, National Alliance for Life Sciences & Health) within the framework of the Cancer Plan for MEVO & IMOP projects, by CNRS with the Défi instrumental grant, by Ligue Nationale Contre le Cancer (LNCC) and the Institut National de Physique Nucléaire et de Physique des Particules (IN2P3).
References
1. Silas AM, Kruskal JB, Kane RA. Intraoperative ultrasound. Radiol Clin. (2001) 39:429–48. doi: 10.1016/S0033-8389(05)70290-6
2. Kubben PL, ter Meulen KJ, Schijns, OE, ter, Laak-Poort MP, van, Overbeeke JJ, van Santbrink H. Intraoperative MRI-guided resection of glioblastoma multiforme: a systematic review. Lancet Oncol. (2011) 12:1062–70. doi: 10.1016/S1470-2045(11)70130-9
3. Sanai N, Eschbacher J, Hattendorf G, Coons SW, Preul MC, Smith KA, et al. Intraoperative confocal microscopy for brain tumors: a feasibility analysis in humans. Neurosurgery (2011) 68:282–90. doi: 10.1227/NEU.0b013e318212464e
4. Hardesty DA, Sanai N. The value of glioma extent of resection in the modern neurosurgical era. Front. Neurol. (2012) 3:140. doi: 10.3389/fneur.2012.00140
5. Croce AC, Bottiroli G. Autofluorescence spectroscopy and imaging: a tool for biomedical research and diagnosis. Eur J Histochem. (2014) 58:2461. doi: 10.4081/ejh.2014.2461
6. Croce AC, Fiorani S, Locatelli D, Nano R, Ceroni M, Tancioni F, et al. Diagnostic potential of autofluorescence for an assisted intraoperative delineation of glioblastoma resection margins. Photochem Photobiol. (2003) 77:309–18. doi: 10.1562/0031-8655(2003)077<0309:DPOAFA>2.0.CO;2
7. Monici M. Cell and tissue autofluorescence research and diagnostic applications. Biotechnol Annu Rev. (2005) 11:227-56. doi: 10.1016/S1387-2656(05)11007-2
8. Zanello M, Poulon F, Varlet P, Chretien F, Andreiuolo F, Pages M, et al. Multimodal optical analysis of meningioma and comparison with histopathology. J Biophotonics (2016) 7:41724. doi: 10.1002/jbio.201500251
9. Fischer AH, Jacobson KA, Rose J, Zeller R. Hematoxylin and eosin staining of tissue and cell sections. Cold Spring Harb. Protoc. (2008) 2008:pdb.prot4986. doi: 10.1101/pdb.prot4986
10. Giuliani A, Jamme F, Rouam V, Wien F, Giorgetta J-L, Lagarde B, et al. DISCO: a low-energy multipurpose beamline at synchrotron SOLEIL. J Synchrotron Radiat. (2009) 16:835–41. doi: 10.1107/S0909049509034049
11. Jamme F, Kascakova S, Villette S, Allouche F, Pallu S, Rouam V, et al. Deep UV autofluorescence microscopy for cell biology and tissue histology: deep UV autofluorescence microscopy. Biol Cell (2013) 105:277–88. doi: 10.1111/boc.201200075
12. Poulon F, Zanello M, Ibrahim A, Zaylaa AJ, Varlet P, Devaux B, et al. Comparison between fresh and fixed human biopsies using spectral and lifetime measurements: fluorescence analysis using one and two photon excitations. In: 2015 International Conference on Advances in Biomedical Engineering (ICABME). Beirut (2015) p. 25–8. doi: 10.1109/ICABME.2015.7323242
13. Zanello M, Poulon F, Pallud J, Varlet P, Hamzeh H, Abi Lahoud G, et al. Multimodal optical analysis discriminates freshly extracted human sample of gliomas, metastases and meningiomas from their appropriate controls. Sci Rep. (2017) 7:41724. doi: 10.1038/srep41724
14. Liu Q, Grant G, Li J, Zhang Y, Hu F, Li S, et al. Compact point-detection fluorescence spectroscopy system for quantifying intrinsic fluorescence redox ratio in brain cancer diagnostics. J Biomed Opt. (2011) 16:037004. doi: 10.1117/1.3558840
15. Palmer S, Litvinova K, Dunaev A, Yubo J, McGloin D, Nabi G. Optical redox ratio and endogenous porphyrins in the detection of urinary bladder cancer: a patient biopsy analysis. J Biophotonics (2016) 10:1062–73. doi: 10.1002/jbio.201600162
16. Pradère B, Poulon F, Compérat E, Lucas I, Bazin D, Doizi S, et al. Two-photon optical imaging, spectral and fluorescence lifetime analysis to discriminate urothelial carcinoma grades. J Biophotonics (2018) 20180. doi: 10.1002/jbio.201800065. [Epub ahead of print].
17. Digman MA, Caiolfa VR, Zamai M, Gratton E. The phasor approach to fluorescence lifetime imaging analysis. Biophys J. (2008) 94:L14–6. doi: 10.1529/biophysj.107.120154
18. Pradhan A, Pal P, Durocher G, Villeneuve L, Balassy A, Babai F, et al. Steady state and time-resolved fluorescence properties of metastatic and non-metastatic malignant cells from different species. J Photochem Photobiol B (1995) 31:101–12. doi: 10.1016/1011-1344(95)07178-4
19. Georgakoudi I, Quinn KP. Optical imaging using endogenous contrast to assess metabolic state. Annu Rev Biomed Eng. (2012) 14:351–67. doi: 10.1146/annurev-bioeng-071811-150108
20. Pu Y, Tang GC, Wang WB, Savage HE, Schantz SP, Alfano RR. Native fluorescence spectroscopic evaluation of chemotherapeutic effects on malignant cells using nonnegative matrix factorization analysis. Technol Cancer Res Treat. (2011) 10:113–20. doi: 10.7785/tcrt.2012.500186
21. Hong Z, Chen Y, Chen J, Chen H, Xu Y, Zhu X, et al. Optical diagnosis of gallbladder cancers via two-photon excited fluorescence imaging of unstained histological sections. Lasers Med Sci. (2015) 30:225–33. doi: 10.1007/s10103-014-1652-y
22. Wu X, Chen G, Lu J, Zhu W, Qiu J, Chen J, et al. Label-free detection of breast masses using multiphoton microscopy. PLoS ONE (2013) 8:e65933. doi: 10.1371/journal.pone.0065933
23. Yan J, Zhuo S, Chen G, Wu X, Zhou D, Xie S, et al. Preclinical study of using multiphoton microscopy to diagnose liver cancer and differentiate benign and malignant liver lesions. J Biomed Opt. (2012) 17:026004. doi: 10.1117/1.JBO.17.2.026004
24. Butte PV, Fang Q, Jo JA, Yong WH, Pikul BK, Black KL, et al. Intraoperative delineation of primary brain tumors using time-resolved fluorescence spectroscopy. J Biomed Opt. (2010) 15:027008. doi: 10.1117/1.3374049
25. Lin W-C, Toms, SA, Johnson, M, Jansen, ED, Mahadevan-Jansen A. In vivo brain tumor demarcation using optical spectroscopy. Photochem Photobiol. (2001) 73:396–402. doi: 10.1562/0031-8655(2001)073<0396:IVBTDU>2.0.CO;2
26. Sun Y, Hatami N, Yee M, Phipps J, Elson DS, Gorin F, et al. Fluorescence lifetime imaging microscopy for brain tumor image-guided surgery. J Biomed Opt. (2010) 15:056022. doi: 10.1117/1.3486612
Keywords: deep-UV, synchrotron, Multi-photon, autofluorescence, brain tumor, phasor analysis, cluster, spectral analysis
Citation: Poulon F, Chalumeau A, Jamme F, Pallud J, Varlet P, Mehidine H, Juchaux M, Devaux B, Refregiers M and Abi Haidar D (2018) Multimodal Analysis of Central Nervous System Tumor Tissue Endogenous Fluorescence With Multiscale Excitation. Front. Phys. 6:109. doi: 10.3389/fphy.2018.00109
Received: 12 July 2018; Accepted: 10 September 2018;
Published: 09 October 2018.
Edited by:
Qiyin Fang, McMaster University, CanadaReviewed by:
Eleni Drakaki, National Technical University of Athens, GreeceOxana Semyachkina-Glushkovskaya, Saratov State University, Russia
Copyright © Poulon, Chalumeau, Jamme, Pallud, Varlet, Mehidine, Juchaux, Devaux, Refregiers and Abi Haidar. This is an open-access article distributed under the terms of the Creative Commons Attribution License (CC BY). The use, distribution or reproduction in other forums is permitted, provided the original author(s) and the copyright owner(s) are credited and that the original publication in this journal is cited, in accordance with accepted academic practice. No use, distribution or reproduction is permitted which does not comply with these terms.
*Correspondence: Darine Abi Haidar, abihaidar@imnc.in2p3.fr