Record breaking bursts in a fiber bundle model of creep rupture
 Zsuzsa Danku
 Ferenc Kun
- Department of Theoretical Physics, University of Debrecen, Debrecen, Hungary
We investigate the statistics of record breaking (RB) events in the time series of crackling bursts in a fiber bundle model of the creep rupture of heterogeneous materials. In the model fibers break due to two mechanisms: slowly accumulating damage triggers bursts of immediate breakings analogous to acoustic emissions in experiments. The rupture process accelerates such that the size of breaking avalanches increases while the waiting time between consecutive events decreases toward failure. Record events are defined as bursts which have a larger size than all previous events in the time series. We analyze the statistics of records focusing on the limit of equal load sharing (ELS) of the model and compare the results to the record statistics of sequences of independent identically distributed random variables. Computer simulations revealed that the number of records grows with the logarithm of the event number except for the close vicinity of macroscopic failure where an exponential dependence is evidenced. The two regimes can be attributed to the dominance of disorder with small burst sizes and to stress enhancements giving rise to efficient triggering of extended bursts, respectively. Both the size of records and the increments between consecutive record events are characterized by power law distributions with a common exponent 1.33 significantly different from the usual ELS burst size exponents of fiber bundles. The distribution of waiting times follows the same behavior, however, with two distinct exponents for low and high loads. Studying the evolution of records we identify a load dependent characteristic scale of the system which separates slow down and acceleration of RB as failure is approached.
1. Introduction
The fracture of heterogeneous materials proceeds in bursts generated by newly nucleating cracks or by intermittent propagation steps of crack fronts [1]. Measuring acoustic emissions of breaking bursts the fracture process can be decomposed into a time series of crackling events, which contains valuable information about the microscopic dynamics of fracture [2–4]. The analysis of crackling time series has usually been focused on the integrated statistics of events such as the probability distribution of the size (energy) and duration of bursts and of the waiting time between consecutive events. All these distributions are found to have power law functional form with exponents having a high degree of robustness with respect to materials' details [2–4].
In applications materials are often subject to constant sub-critical loads which may lead to failure in a finite time. Such creep rupture processes are typical for components of engineering constructions and they also play a crucial role in the emergence of natural catastrophes such as land slides, stone and snow avalanches, and earthquakes [5–14]. It is of high practical importance to understand how the creeping system approaches macroscopic failure using the data of acoustic monitoring [2, 5, 8, 13]. Computer simulations of discrete stochastic models of creep rupture are indispensable to analyze how the time series of crackling events evolves and to identify possible signatures of the imminent catastrophe. A unique feature of this evolution is that the rupture process is highly non-stationary, i.e., approaching failure larger and larger bursts are triggered while the process accelerates indicated by the decreasing waiting time between consecutive events [5, 8]. On the macro-scale, the strain rate has been found to exhibit time-to-failure power law behavior [2, 5, 6, 11] which is accompanied by the emergence of an Omori-type acceleration of the rate of bursts on the micro-scale [15].
In the present paper we investigate the evolution of the crackling time series of creep rupture by analyzing the statistics of record breaking (RB) bursts in a fiber bundle model (FBM) of creep failure. Records are bursts which have the largest size since the beginning of the time series, hence, their behavior involves extreme value statistics [16, 17]. Motivated mainly by climate research [18] and by the investigation of earthquake time series [19–22] interesting analytical results have recently been obtained for the RB statistics of sequences of independent identically distributed (IID) random variables. The statistics of records has proven useful to identify trends in time series of measurements and to infer correlations of events [19, 21]. Focusing on the limit of equal load sharing of our FBM we demonstrate that the record breaking statistics of crackling events provides novel insight into rupture phenomena. Comparing the outcomes of large scale computer simulations to the corresponding IID results on records we can identify regimes of the failure process dominated by the disorder of materials and by the enhanced triggering of breaking avalanches toward failure. The size distribution of records proved to have a power law form with a novel exponent of equal load sharing FBMs. Simulations revealed the emergence of a load dependent characteristic record rank which separates slow down and acceleration of RB when approaching failure.
2. Materials and Methods
To investigate the time series of breaking bursts we use a generic FBM of creep rupture introduced recently [15, 23–27]. We briefly summarize the main ingredients of the model construction emphasizing aspects most relevant for the present study.
2.1. Fiber Bundle Model with two Breaking Mechanisms
In the framework of the model the sample is discretized in terms of a bundle of parallel fibers which have a brittle response with identical Young modulus E. The bundle is subject to a constant external load σ0 below the fracture strength σc of the system parallel to the fibers' direction. Fibers are assumed to break due to two physical mechanisms: immediate breaking occurs when the local load σi on fibers exceeds their fracture strength σith, i = 1, …, N. Under a sub-critical load σ0 < σc this breaking mechanism would lead to a partially failed configuration with an infinite lifetime. Time dependence is introduced in such a way that those fibers, which remained intact, undergo an aging process accumulating damage c(t). The damage mechanism represents the environmentally induced slowly developing aging of materials such as corrosion cracking and thermally or chemically activated degradation [15, 23–26] similar to damage dynamics based models of rock fracture developed for instance in [28]. The rate of damage accumulation Δci is assumed to have a power law dependence on the local load
where a is a constant and the exponent γ controls the time scale of the aging process with 0≤ γ < +∞. The total amount of damage ci(t) accumulated up to time t is obtained by integrating over the entire loading history of fibers ci(t) = a∫t0 σi(t')γdt'. Fibers can tolerate only a finite amount of damage so that when ci(t) exceeds the local damage threshold cith the fiber breaks. Each breaking event is followed by a redistribution of load over the remaining intact fibers. Two limiting cases of load sharing are usually considered in FBMs: under equal load sharing (ELS) conditions all the intact fibers keep the same amount of load so that the load on a single fiber is σi = Nσ0/(N − i) after the breaking of i fibers. ELS realizes the mean field limit of FBMs where no stress heterogeneity can arise. In the opposite limit of localized load sharing (LLS) the load of broken fibers is equally redistributed solely over their intact nearest neighbors in the bundle. LLS leads to a high stress concentration around failed regions and it gives rise to the emergence of spatial correlations between consecutive breaking events. In the present study we consider only the ELS case where the homogeneous stress field hinders spatial correlation. In the model the quenched heterogeneity of materials is represented by the randomness of breaking thresholds σthi, cthi, i = 1, …, N. For simplicity, for both threshold values we assume uniform distributions between zero and one. Since under ELS the value of the exponent γ only controls the time scale of creep [15] the damage parameters were fixed to γ = 1 and a = 1.
When the load is put on the bundle, first some week fibers break immediately which may generate further breakings until a stable configuration is reached where all remaining intact fibers can sustain the elevated load. The time evolution of the creeping system starts from this partially failed configuration [23, 24]. The present setup of the model implies that the critical stress where immediate catastrophic failure occurs is equal to its static value σc = 0.25 [23–25]. In the presentation of the results the constant external load level will be characterized by the ratio σs = σ0/σc which can take values in the range 0 < σs ≤ 1.
2.2. Bursts Driven by Damage Sequences
The separation of time scales of the slow damage process and of immediate breaking leads to a highly complex time evolution in agreement with experiments [15, 24–27]: starting from the initial configuration damaging fibers break slowly one-by-one gradually increasing the load on the remaining intact fibers. After a certain number Δd of damage breakings the load increment becomes sufficient to induce the immediate breaking of a fiber which in turn triggers an entire burst of immediate breakings. As a consequence, the time evolution of creep rupture occurs as a series of bursts corresponding to the nucleation and propagation of cracks, separated by silent periods of slow damaging. The size of bursts Δ is defined as the number of fibers breaking in avalanches. The number of fibers breaking in a damage sequence and its duration determine the length of the damage sequence Δd and the physical waiting time T between consecutive events, respectively.
Figure 1 shows a representative example of the time series of bursts as the system evolves toward failure. In order to have a clear view on the details of the sequence of events we intentionally used a relatively small system of N = 105 fibers subject to the load σs = 0.001 which gave rise to 9793 bursts. The size Δ of bursts is shown in the figure as a function of the discrete time, i.e., order number or natural time n = 1, 2, … so that no information is presented about the physical waiting time T elapsed between the bursts. Strong fluctuations of the burst size Δ can be observed which is caused by the quenched disorder of fiber strength. The time series has a non-stationary behavior which is indicated by the increasing average size of bursts. Of course, the physical waiting time T decreases between consecutive events, however, this information is not visible in this representation. (The analysis of waiting times of the model can be found in [15, 24, 25].)
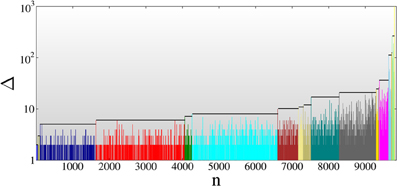
Figure 1. Time series of bursts in a mean field (ELS) simulation of the FBM of creep. For demonstration purposes a relatively small system N = 105 is presented at the load σs = 0.001 giving rise to 9793 avalanches. In order to have a clear view on the structure of the time series, sub-sequences starting at record breaking events are highlighted by different colors. The horizontal lines serve to demonstrate the increments between consecutive record bursts.
A record of the time series is a burst which has a size Δr larger than any previous events. Consecutive records are identified by their increasing rank k as k = 1, 2, 3, … which occurred as the nkth burst of the complete time series. The first burst n = 1 is by definition considered to be a record of rank k = 1 with n1 = 1. In the example of Figure 1 all together 18 RB events are identified Δkr (k = 1, …, 18), which are highlighted by using different colors for the consecutive smaller events. It can be observed that RB events form a sub-sequence of bursts with monotonically increasing size, however, both the record size and the number of avalanches between two consecutive records exhibit strong fluctuations. In order to characterize these features we introduce the size increment δk and the waiting time mk between two records with the definitions
respectively. Note that the catastrophic burst which breaks all remaining intact fibers and destroys the bundle is not included in the time series so that the last burst in the bundle may not be an RB event.
3. Results
To investigate the occurrence of RB events during the rupture process computer simulations were carried out for a system of size N = 107 fibers averaging over 104 realizations of the threshold disorders at each load value σs. The external load σs was varied over a broad range 0.001 ≤ σs ≤ 0.9, where the limits were set to have a sufficient number of bursts in the time series. We identify all RB avalanches Δkr that occur up to macroscopic failure of the bundle and carry out a detailed analysis of their statistics.
3.1. Number of Record Breaking Avalanches
An important feature of our system is that under low load values most of the fibers break due to slow damaging since the resulting load increments are too small to trigger extended bursts of immediate breakings. Figure 2A shows that the fraction of fibers breaking in avalanches 〈dburst〉 and due to damage 〈ddam〉 are monotonically increasing and decreasing functions of the external load σs, respectively. The two curves intersect each other at the characteristic load σ*s ≈ 0.48, which coincides with the position of the maximum of the average number of avalanches 〈NΔ〉. The result demonstrates that for σs < σ*s damage dominates the failure process, while the vicinity of catastrophic failure σs > σ*s is controlled by the bursting activity with large burst sizes Δ and a decreasing number NΔ of bursts (see also [25]).
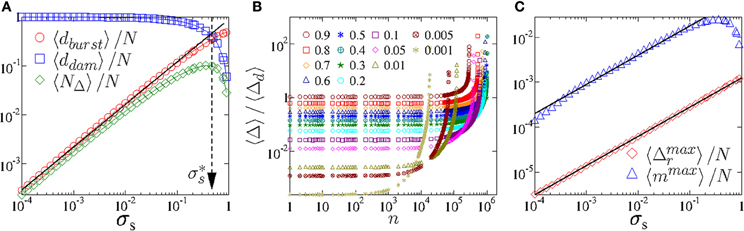
Figure 2. (A) Fraction of fibers breaking in bursts 〈dburst〉 and due to damage 〈ddam〉 as function of load σs together with the number of bursts 〈NΔ〉. The quantity 〈dburst〉 was calculated as the sum of the size of all bursts that occurred up to failure. The straight line has slope 0.87, furthermore, the vertical dashed line indicates the position of the characteristic load σ*s = 0.48. (B) Ratio of the average size of bursts 〈Δ〉 and of damage sequences 〈Δd〉 as a function of the order number n of bursts for several load values. (C) Average size of the largest record breaking event 〈Δmaxr〉 and the average value of the largest waiting time 〈mmax〉 between consecutive records as function of load. All quantities are normalized by the number of fibers N in the bundle. The upper and lower straight lines have slope 0.625 and 0.65, respectively.
Figure 3A presents the average number of records 〈Nn〉 that occurred until n avalanches have been generated in the time series at several load values. Due to the breaking dynamics described above at low loads avalanches remain small typically comprising a few breaking fibers, and hence, new records mainly occur close to macroscopic failure. For instance, at loads σs ≤ 0.01 the number of records has very low values 〈Nn〉 < 3 up to large n followed by a fast increase in the vicinity of the failure point. As σs increases the qualitative form of the 〈Nn〉 curves remains the same, they just shift to higher record numbers due to the more intensive triggering of larger bursts at high loads. The most important feature of the record number 〈Nn〉 is that it has a logarithmic dependence on n over a broad range, which is in agreement with the analytic prediction of the logarithmic dependence of record numbers of IIDs on the event number n [17, 21]. The result implies that except for the close vicinity of macroscopic failure disorder dominates the process of creep rupture, and the occurrence of breaking avalanches can be well approximated as a stochastic process of IIDs. However, close to failure the increase of the stress on single fibers results in enhanced triggering which in turn gives rise to a sudden increase of records. The complete curves of 〈Nn〉(n) can be characterized by the functional form
where the exponential term describes the rapid generation of high rank records close to catastrophic failure. It can be observed in Figure 3A that Equation (3) provides an excellent fit of the numerical data over the complete load range considered. The additive parameter A has the same value A = 0.38 for all loads, while the multiplication factor B increases from 0.16 to 0.87 in the load range considered (see Figure 3B). The shape of the 〈Nn〉 curves in the accelerating regime is controlled by the exponent ξ which is nearly constant ξ ≈ 1.5 for loads below σ*s then it decreases to 0.33 as σs increases in Figure 3B. The scale parameter D mainly sets the transition point between the two regimes dominated by disorder and by stress enhancement. It can be seen in Figure 3C that D increases with the external load and has a maximum in the vicinity of σ*s, which is consistent with the behavior of the total number of bursts 〈NΔ〉 in Figure 2A reflecting the overall dominance of damage and bursts in the failure process on the two sides of σ*s. To support the emergence of a characteristic event number D separating different regimes of bursting activity, Figure 2B presents the ratio of the average size of bursts 〈Δ〉(n) and the average size of the damage sequence 〈Δd〉(n) that initiated the nth event. At the beginning of the process a large number of fibers must break randomly one-by-one in damage sequences until a small burst of size 1–2 fibers is initiated giving rise to 〈Δ〉 / 〈Δd〉 < 1. Comparing to Figure 3A the onset of the rapid exponential increase of RB corresponds to the event number from where extended bursts are triggered by shorter damage sequences due to the effect of stress enhancements. As the consequence of the increasing burst size and shortening damage sequences it becomes more and more probable that a record gets broken after a fewer bursts leading to the exponential increase of the record number.
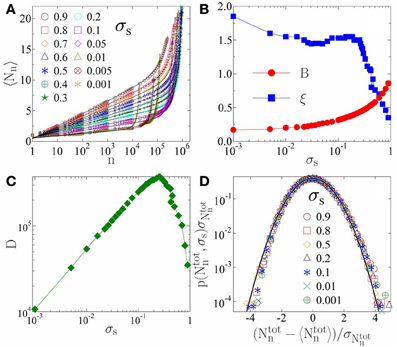
Figure 3. (A) Average number of records 〈Nn〉 as a function of the total number of avalanches n for several load values. For low record numbers logarithmic dependence is evidenced, which is followed by a faster exponential increase. The continuous black lines represent fits with Equation (3). (B,C) Fitting parameters B, ξ, and D of Equation (3) as function of the external load σs. (D) Probability distribution of the total number of records Ntotn occurred up to failure for several load values. The distributions obtained at different loads are rescaled with the corresponding average and standard deviation. The continuous line represents the standard Gaussian Equation (4).
Figure 3D shows that the probability distribution p(Ntotn, σs) of the total number of records accumulated up to failure has a Gaussian form. The distributions p(Ntotn, σs) obtained at different loads were rescaled by the corresponding average 〈Ntotn〉 and standard deviation σNtotn of the total number of records which results in a high quality collapse in the figure. The scaling function has a good agreement with the standard Gaussian
which has been predicted for RB sequences of IIDs [17, 21]. The Gaussian functional form prevails in spite of the complex effect of the acceleration of the occurrence of records toward failure. Deviations can be observed at the tails of the distribution which may indicate a slight right-handed asymmetry.
3.2. Statistics of Record Sizes and Waiting Times
Recently, it has been shown that in our model the size distribution of avalanches p(Δ) accumulating all crackling events up to failure during the creep process follows a power law distribution [24, 25]
where the value of the exponent τ coincides with the usual mean field exponent of FBMs τ = 5/2 [29]. As the external load approaches the critical value σs → to 1 a crossover is obtained to a lower exponent τ = 3/2 [25] in agreement with the mean field prediction of simple FBMs subject to a quasi-statically increasing load [30–32].
Figure 4A presents the size distribution p(Δr, σs) of RB bursts accumulating all records up to failure at different load values. The distributions can be well described by a power law followed by a finite size cutoff of exponential form. Since at higher loads larger avalanches are triggered the cutoff of the distributions shifts to higher values but the functional form remains the same for all loads. Figure 4B illustrates that rescaling the two axis in Figure 4A with appropriate powers of the external load a high quality data collapse can be achieved. The result implies that record size distributions obtained at different loads obey the scaling structure
where the exponent α controls the load dependence of the cutoff record
The power law dependence of the cutoff record size 〈Δmaxr〉 is also confirmed by Figure 2C, where the largest records Δmaxr of single simulations were directly averaged. Best fit is obtained with the exponent α = 0.65 which provides also the best collapse in Figure 4B. Note that due to the normalization of the distributions the scaling exponent used for the transformation along the vertical axis has to be equal to the product of τr and α which is explicitly indicated in Figure 4B. The size distribution exponent of record bursts τr = 1.33 ± 0.03 proved to be significantly smaller than the usual mean field burst size exponents of FBMs [24, 25, 29–31], which is the consequence of the relatively high frequency of large burst sizes in the RB sequence with respect to the complete time series. The short flat region for the smallest bursts occurs due to down sampling of small sized events in the RB sequence. To fit the scaling function in Figure 4B the cutoff function ϕ(x) was assumed to have a stretched exponential form ϕ(x) ~ exp(−(x/x0)β) with β = 0.65. It is important to emphasize that the distribution p(Δr, σs) has a homogeneous evolution with increasing external load, i.e., the exponent τr remains constant when the critical load is approached σs → to 1.
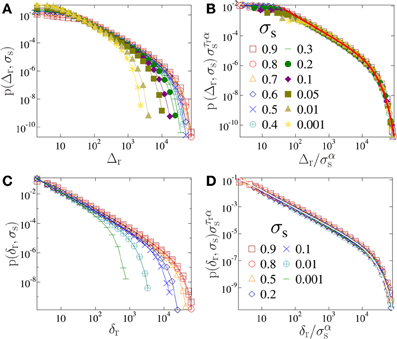
Figure 4. Size distribution of record breaking bursts (A) and their increments (C) for several load values. (B,D) demonstrate that rescaling the distributions with the external load high quality collapse of the curves can be achieved. The continuous lines in (B,D) represent fits with Equation (6).
For the advancement of the RB sequence of bursts during the evolution of the rupture process the size increments δk = Δk+1r − Δkr between consecutive records carry also interesting information. Figure 4C presents that the distribution p(δr, σs) of increments δr has a qualitatively similar behavior to record sizes p(Δr, σs), i.e., power laws are obtained followed by an exponential cutoff as described by Equation (6). Careful scaling analysis in Figure 4D shows that both the value of the exponent τr of the power law regime and the scaling exponent α of σs have the same values for the two distributions, the only difference is that the cutoffs of increments are smaller than the one of record sizes.
After a record occurred as the nkth avalanche of the time series it gets broken after a certain number of events by the nk+1th avalanche. The waiting time mk between RB avalanches defined by Equation (2) is an important characteristic quantity of the RB sequence of bursts. Figure 5A presents the accumulated statistics of waiting times m considering all records k in the RB sequence for several load values. Based on the statistics of extremes [16], for IIDs a power law behavior is expected p(m) ~ m−z with the exponent zIID = 1 [17]. It can be observed in the figure that our results are generally consistent with the IID prediction, however, distributions p(m, σs) obtained below and above σ*s form two groups of different power law exponents. Figures 5B,C demonstrate that rescaling m and the distributions p(m, σs) with appropriate powers of the external load σs, good quality data collapse can be achieved in both load regimes. The scaling structure is similar to Equation (6)
however, both exponents z and α proved to have different values below and above the characteristic load σ*s. In Figures 5B,C best collapse is obtained with the exponents z = 0.72, α = −1.45 (σ*s < σs) and z = 1.15, α = 0.625 (σ*s > σs). The value of z reflects an interesting aspect of the dynamics of the creep process: the low value of z < zIID at high loads shows that long waiting times more frequently occur than for IID. The reason is that due to the large bursts triggered under high external loads it takes longer for the system to break a record. At low loads the waiting time exponent z is slightly larger than the IID prediction implying an elevated frequency of short waiting times with respect to IIDs. Note that α has different signs in the two regimes corresponding to the increasing and decreasing behavior of the cutoff of the distribution with increasing load. An independent test of the load dependence of the cutoff waiting time 〈mmax〉 is shown in Figure 2C, where mmax was directly averaged over the simulations. A maximum is obtained at σ*s in agreement with the scaling behavior in Figures 5B,C. The flattening of the distributions p(m, σs) for low m values and the small bump close to the cutoff observed for low loads in Figure 5C are caused by the finite system size and by the distinct distribution of the time needed to break the first record, respectively.
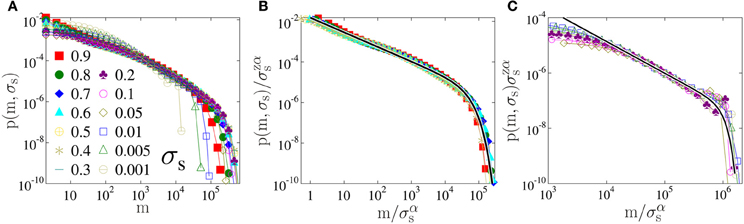
Figure 5. (A) Probability distribution of waiting times p(m, σs) between consecutive records for several values of the external load σs. In (B,C) the same distributions are presented after rescaling the two axis with powers of the external load σs separately above and below σ*s, respectively. The good quality data collapse demonstrates the validity of the scaling structure Equation (8).
3.3. Evolution of the Sequence of Records
The creeping system approaches macroscopic failure through an accelerating sequence of bursts of increasing size. In order to understand how RB events occur during this evolution we evaluated average values of the characteristic quantities of single records as a function of their rank k. In Figure 6A the average record size 〈Δkr〉 has the same generic form for all loads, i.e., a nearly exponential increase is obtained with a slight minimum of the derivative of the curves for intermediate ranks. Note that for a given value of k a record can have a higher value at low loads than at higher ones, e.g., at k = 15 the corresponding record burst is significantly larger at σs = 0.001 than at σs = 0.1 in spite of the two orders of magnitude higher external load in the second case. The reason is that for avalanche triggering the load on single fibers is the most relevant quantity, hence, at the generation of the kth record the creeping system can be closer to catastrophic failure at lower loads than at higher ones, which implies larger burst sizes. In order to gain information about the rate of increase of records, we determined the relative increments of consecutive RB events defined as the ratio δk/Δkr. Figure 6B shows that at the beginning of the rupture process the average 〈δk/Δkr〉 starts from a high value simply because the first record has size Δ1r = 1 and it gets typically broken by a burst of size Δ2r = 2 or Δ2r = 3. Then the relative increment rapidly decreases to the vicinity of 0.25. The remarkable result is that for records of the highest rank 〈δk/Δkr〉 tends to 1, which implies that as the system approaches macroscopic failure RBs occur by nearly doubling the size of the previous record. Hence, not only the record sizes but also the increments form a monotonically increasing sequence when approaching failure.
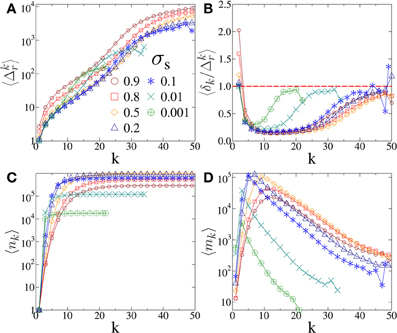
Figure 6. Characteristic quantities of single records: the average value of the size 〈Δkr〉 (A), and relative increments 〈δk/Δkr〉 of record breaking events (B). In (B) the horizontal dashed line highlights the limit value 1. Time of occurrence 〈nk〉 (C) and waiting time 〈mk〉 between consecutive records (D).
As the external load increases larger avalanches are triggered in the system and they occur with an increasing rate [15]. Based on this general tendency it could be expected that the average time 〈nk 〉 where the kth record appears is a decreasing function of the external load σs. Figure 6C shows that for low load values just the opposite happens: records of a given rank k occur later after a larger number of avalanches. The reason is that as the load increases early records get larger, and hence, they are more difficult to overcome. The situation changes at the characteristic load σ*s so that in the range σ > σ*s the average record time 〈nk 〉 decreases with increasing load.
The time series presented in Figure 1 does not contain information about the physical time elapsed between events. However, the acceleration of the system can still be inferred from the natural time n, because the number of bursts between RB events decreases when approaching catastrophic failure. Due to this acceleration the average waiting time 〈mk〉 is expected to decrease between consecutive records. It is interesting to note that for higher loads the decreasing branch of 〈mk〉 is preceded by a rapidly increasing regime indicating the slow down of RB before acceleration sets on. The maximum of 〈mk〉 already develops for the lowest loads with the position k* = 2 and it gradually shifts to k* = 13 for the highest ones. Comparing Figures 6B,D it can be seen that the record rank k* of the maximum of 〈mk〉 falls close to the position of the minimum of the relative increments 〈δk/Δkr〉. The result demonstrates the emergence of a characteristic time scale nk* of the system which separates slow down and acceleration of the dynamics of RB. This is also in agreement with the behavior of record numbers in Figure 3A so that nk* approximately coincides with the onset time of the exponential increase of 〈Nn〉.
4. Discussion
We investigated the statistics of records in a sequence of crackling avalanches which occur during the creep rupture of heterogeneous materials. Synthetic sequences of bursts were generated by computer simulations of a realistic fiber bundle model FBM where slowly developing damage triggers avalanches of immediate breaking of fibers. The bundle is subject to a constant external load below the fracture strength of the system. We analyzed the mean field limit of the model where all fibers keep the same load so that no spatial correlation develops between local failure events.
Record events are defined solely based on the burst size, i.e., a record is a bursts whose size is larger than that of all previous bursts. This way a monotonically increasing sub-sequence of crackling events is identified. Computer simulations revealed that during the evolution of the rupture process the average number of records increases logarithmically with the number of avalanches except for the close vicinity of macroscopic failure where an exponential form is evidenced. Additionally, the total number of records obtained up to failure at different load values has a Gaussian distribution. These findings are in agreement with the robust analytic predictions on the RB statistics of sequences of IID random variables which shows that the beginning of the creep process is mainly controlled by the quenched disorder of the system. The enhanced triggering close to failure due to the rapidly increasing load on single fibers is responsible for the exponential acceleration of record numbers.
The size of records proved to have a power law distribution with an exponent 1.33 significantly lower than the usual mean field exponents 5/2 and 3/2 of the burst sizes of FBMs. The size increments between consecutive records are found to have the same scaling structure and the value of exponents as the record size. To prove the independence of the exponents on the external load a careful data collapse analysis was performed. The probability distribution of waiting times between consecutive events has also a power law functional form, however, with different exponents below and above the characteristic load σ*s. In order to characterize the evolution of the sequence of records we studied the average value of the relative increment and of the waiting time between consecutive events as a function of the record rank. Both quantities show the emergence of a load dependent characteristic scale in the system: at the beginning a slow down of RB occurs with an increasing waiting time and decreasing relative increment. Beyond a characteristic record rank k* the approach to failure results in an acceleration of RB with decreasing waiting times and increasing relative increments. In our study the disorder of materials was represented by uniformly distributed failure thresholds. We repeated the complete RB analysis for Weibull distributed disorder varying the Weibull exponent. It has to be emphasized that the qualitative behavior of the results and the value of the exponents of the record size, increment and waiting time distributions all proved to be universal, only the characteristic load σ*s, furthermore, the scaling and cutoff exponents α and β depend on the disorder.
Recently, the RB statistics of driven threshold models of complex systems has been analyzed in [21]. These are cellular automata models of self organized criticality where the slow external driving leads to the emergence of a steady state characterized by intermittent avalanches of relaxation events. Comparing the statistics of records of the models to the corresponding results of IIDs the authors could point out correlations in the complex spatio-temporal evolution of avalanches. The most prominent deviation from IIDs was found for the Olami-Feder-Christensen model [33] where the number of records proved to increase as a power of the logarithm of the avalanche number. The main difference of the dynamics of our FBM and the above models is that during creep both the size and the rate of avalanches increase so that no steady state arises. Hence, the comparison to IIDs in our case helped to determine regimes controlled either by disorder or by the increasing stress level of intact fibers. Record breaking statistics of inter-event times in aftershock sequences of earthquakes has recently been studied in [19]. Based on the non-homogeneous Poissonian process describing the rate of events, a power law behavior of the record number was obtained following the logarithmic increase. Our study demonstrates that the investigation of the RB statistics of the time series of crackling events reveals also interesting novel aspects of rupture phenomena.
Conflict of Interest Statement
The authors declare that the research was conducted in the absence of any commercial or financial relationships that could be construed as a potential conflict of interest.
Acknowledgments
This research was supported by the European Union and the State of Hungary, co-financed by the European Social Fund in the framework of TÁMOP 4.2.4. A/2-11-1-2012-0001 “National Excellence Program.” This work was supported by the European Commissions by the Complexity-NET pilot project LOCAT and by NFÜ under the contract ERANET_HU_09-1-2011-0002. We also acknowledge the projects TAMOP-4.2.2.A-11/1/KONV-2012-0036 and OTKA K84157.
References
1. Alava M, Nukala PK, Zapperi S. Statistical models of fracture. Adv Phys. (2006) 55:349–476. doi: 10.1080/00018730300741518
2. Deschanel S, Vanel L, Godin N, Ciliberto S. Experimental study of crackling noise: conditions on power law scaling correlated with fracture precursors. J Stat Mech. (2009) 2009:P01018. doi: 10.1088/1742-5468/2009/01/P01018
3. Salminen LI, Tolvanen AI, Alava MJ. Acoustic emission from paper fracture. Phys Rev Lett. (2002) 89:185503. doi: 10.1103/PhysRevLett.89.185503
4. Rosti J, Koivisto J, Alava MJ. Statistics of acoustic emission in paper fracture: precursors and criticality. J Stat Mech. (2010) 2010:P02016. doi: 10.1088/1742-5468/2010/02/P02016
5. Nechad H, Helmstetter A, Guerjouma RE, Sornette D. Creep ruptures in heterogeneous materials. Phys Rev Lett. (2005) 94:045501. doi: 10.1103/PhysRevLett.94.045501
6. Nechad H, Helmstetter A, Guerjouma RE, Sornette D. Andrade and critical time to failure laws in fiber-matrix composites: experiments and model. J Mech Phys Solids (2005) 53:1099. doi: 10.1016/j.jmps.2004.12.001
7. Petri A, Paparo G, Vespignani A, Alippi A, Costantini M. Experimental evidence for critical dynamics in microfracturing processes. Phys Rev Lett. (1994) 73:3423. doi: 10.1103/PhysRevLett.73.3423
8. Garcimartin A, Guarino A, Bellon L, Ciliberto S. Statistical properties of fracture precursors. Phys Rev Lett. (1997) 79:3202. doi: 10.1103/PhysRevLett.79.3202
9. Main IG. A damage mechanics model for power-law creep and earthquake aftershock and foreshock sequences. Geophys J Int. (2000) 142:151. doi: 10.1046/j.1365-246x.2000.00136.x
10. Santucci S, Vanel L, Ciliberto S. Sub-critical statistics in rupture of fibrous materials: experiments and model. Phys Rev Lett. (2004) 93:095505. doi: 10.1103/PhysRevLett.93.095505
11. Deschanel S, Vanel L, Vigier G, Godin N, Ciliberto S. Statistical properties of microcracking in polyurethane foam under tensile test, influence of temperature and density. Int J Fract. (2006) 140:87–98. doi: 10.1007/s10704-006-0051-1
12. Santucci S, Cortet P, Deschanel S, Vanel L, Ciliberto S. Subcritical crack growth in fibrous materials. Europhys Lett. (2006) 74:595–601. doi: 10.1209/epl/i2005-10575-2
13. Kovács K, Nagy S, Kun F, Herrmann HJ, Pagonabarraga I. Critical ruptures in a bundle of slowly relaxing fibers. Phys Rev E (2008) 77:036102. doi: 10.1103/PhysRevE.77.036102
14. Ramos O, Cortet PP, Ciliberto S, Vanel L. Experimental study of the effect of disorder on subcritical crack growth dynamics. Phys Rev Lett. (2013) 110:165506. doi: 10.1103/PhysRevLett.110.165506
15. Danku Z, Kun F. Creep rupture as a non-homogeneous poissonian process. Sci Rep. (2013) 3:2688. doi: 10.1038/srep02688
18. Redner S, Petersen MR. Role of global warming on the statistics of record-breaking temperatures. Phys Rev E (2006) 74:061114. doi: 10.1103/PhysRevE.74.061114
19. Yoder MR, Turcotte DL, Rundle JB. Record-breaking earthquake intervals in a global catalogue and an aftershock sequence. Nonlin Proces Geophys. (2010) 17:169–76. doi: 10.5194/npg-17-169-2010
20. Davidsen J, Grassberger P, Paczuski M. Networks of recurrent events, a theory of records, and an application to finding causal signatures in seismicity. Phys Rev E (2008) 77:066104. doi: 10.1103/PhysRevE.77.066104
21. Shcherbakov R, Davidsen J, Tiampo KF. Record-breaking avalanches in driven threshold systems. Phys Rev E (2013) 87:052811. doi: 10.1103/PhysRevE.87.052811
22. Grob M, Schmittbuhl J, Toussaint R, Rivera L, Santucci S, Maloy KJ. Quake catalogs from the optical monitoring of an interfacial crack propagation. Pure Appl Geophy (2009) 166:777–799. doi: 10.1007/s00024-004-0496-z
23. Kun F, Costa MH, Filho RNC, Andrade JS Jr, Soares JB, Herrmann HJ. Fatigue failure of disordered materials. J Stat Mech. (2007) 2007:P02003. doi: 10.1088/1742-5468/2007/02/P02003
24. Kun F, Halász Z, Andrade JS, Herrmann HJ. Crackling noise in sub-critical fracture of heterogeneous materials. J Stat Mech. (2009) 2009:P01021. doi: 10.1088/1742-5468/2009/01/P01021
25. Kun F, Carmona HA, Andrade JS Jr, Herrmann HJ. Universality behind basquin's law of fatigue. Phys Rev Lett. (2008) 100:094301. doi: 10.1103/PhysRevLett.100.094301
26. Halász Z, Danku Z, Kun F. Competition of strength and stress disorder in creep rupture. Phys Rev E (2012) 85:016116. doi: 10.1103/PhysRevE.85.016116
27. Danku Z, Kun F. Temporal and spacial evolution of bursts in creep rupture. Phys Rev Lett. (2013) 111:084302. doi: 10.1103/PhysRevLett.111.084302
28. Turcotte DL, Newman WI, Shcherbakov R. Micro and macroscopic models of rock fracture. Geophys J Int. (2003) 152:718. doi: 10.1046/j.1365-246X.2003.01884.x
29. Kloster M, Hansen A, Hemmer PC. Burst avalanches in solvable models of fibrous materials. Phys Rev E (1997) 56:2615–2625. doi: 10.1103/PhysRevE.56.2615
30. Pradhan S, Hansen A, Chakrabarti BK. Failure processes in elastic fiber bundles. Rev Mod Phys. (2010) 82:499. doi: 10.1103/RevModPhys.82.499
31. Pradhan S, Hansen A, Hemmer PC. Crossover behavior in burst avalanches: signature of imminent failure. Phys Rev Lett. (2005) 95:125501. doi: 10.1103/PhysRevLett.95.125501
32. Raischel F, Kun F, Herrmann HJ. Local load sharing fiber bundles with a lower cutoff of strength disorder. Phys Rev E (2006) 74:035104. doi: 10.1103/PhysRevE.74.035104
Keywords: fracture, crackling noise, fiber bundle model, avalanche, record breaking statistics
Citation: Danku Z and Kun F (2014) Record breaking bursts in a fiber bundle model of creep rupture. Front. Physics 2:8. doi: 10.3389/fphy.2014.00008
Received: 03 November 2013; Accepted: 04 February 2014;
Published online: 25 February 2014.
Edited by:
Knut J. Måløy, Fysisk Institutt Universitetet i Oslo, NorwayReviewed by:
Haroldo V. Ribeiro, Universidade Estadual de Maringa, BrazilStephane Santucci, Centre National de la Recherche Scientifique, France
Anders Malthe-Sorenssen, University of Oslo, Norway
Copyright © 2014 Danku and Kun. This is an open-access article distributed under the terms of the Creative Commons Attribution License (CC BY). The use, distribution or reproduction in other forums is permitted, provided the original author(s) or licensor are credited and that the original publication in this journal is cited, in accordance with accepted academic practice. No use, distribution or reproduction is permitted which does not comply with these terms.
*Correspondence: Ferenc Kun, Department of Theoretical Physics, University of Debrecen, Bem ter 18/b, PO Box 5, Debrecen H-4010, Hungary e-mail: ferenc.kun@science.unideb.hu