 Leonov Rianto1,2
 Ika Agustina2
 Sofa D. Alfian1,3
 Aulia Iskandarsyah4
 Ivan Surya Pradipta1,3
 Rizky Abdulah1,3*
- 1Department of Pharmacology and Clinical Pharmacy, Faculty of Pharmacy, Universitas Padjadjaran, Bandung, Indonesia
- 2IKIFA College of Health Science, Jakarta, Indonesia
- 3Center of Excellence for Pharmaceutical Care Innovation, Universitas Padjadjaran, Bandung, Indonesia
- 4Department of Clinical Psychology, Faculty of Psychology, Universitas Padjadjaran, Bandung, Indonesia
Background: Medication non-adherence is a significant concern in tuberculosis (TB) treatment, requiring a precise understanding of the associated risk factors. However, there is a lack of appropriate means to assess the risk factors among TB patients in Indonesia, leading to the development and validation of a structured questionnaire for this purpose.
Method: This study unfolded in two distinct phases, namely, the first included questionnaire construction through framework development, item generation, item screening, and pretesting (in 50 patients). The second comprised questionnaire validation with 346 participants using confirmatory factor analysis (CFA) and structural equation modeling-partial least squares (SEM-PLS). Additionally, reliability testing was conducted using Cronbach’s alpha and composite reliability statistical techniques.
Results: In the development phase, 168 items were defined, consisting of sociodemographic characteristics (8 items) and risk factors for medication non-adherence (160 items). Expert evaluation reduced the number of items to 60, which decreased to 22 after performing a pilot study. Subsequent SEM-PLS modeling resulted in the identification of 14 valid items, representing five major risk factors, namely, socioeconomics (4 items), healthcare team (4 items), condition (3 items), therapy (2 items), and patient (1 item). Only condition-related factors were found to influence non-adherence, and all constructs showed good reliability based on Cronbach’s alpha (>0.6) and composite reliability (0.7) values.
Conclusion: The final 22 items that emerged from this rigorous process indicated a valid and robust questionnaire for assessing risk factors of medication non-adherence among pulmonary tuberculosis patients in Indonesia. The developed questionnaire was positioned to be a valuable tool for healthcare professionals, policymakers, and scientists in creating patient-centered strategies and interventions to address non-adherence.
1 Background
Tuberculosis (TB) is a significant public health concern, particularly in regions such as Asia and Africa, with the highest fatality rates emanating from infectious diseases worldwide (Zhu et al., 2022). In 2018, TB initiated greater mortality accounting for 1.5 million deaths, compared to HIV/AIDS (Harding, 2020). The complex, prolonged, and often poorly tolerated regimens for both drug-susceptible and resistant TB pose substantial challenges to treatment adherence (Alipanah et al., 2018; Pradipta et al., 2021; Pradipta et al., 2022a). Moreover, non-adherence to necessary medications increases the risk of negative outcomes, including treatment failure, elevated TB transmission, relapse, drug resistance emergence, as well as higher morbidity and mortality (Fang et al., 2019; Saha et al., 2022). Many patients fail to complete the full 6-month course of anti-TB medications, jeopardizing their health and contributing to the development of multidrug-resistant and extensively resistant. According to the World Health Organization (WHO), TB therapy adherence means the extent to which the prescribed pharmaceutical regimen is being followed. Several quantitative studies (El Sahly et al., 2004; Munro et al., 2007; Shargie and Lindtjørn, 2007) investigated risk variables linked to suboptimal treatment adherence, but only a few explored the relationship shared with socioeconomic factors. These sources showed that low education level, place of residence, financial constraints, comorbid chronic diseases, medication discontinuation, and anti-TB treatment frequency influence non-adherence (Alipanah et al., 2018; Zhu et al., 2022).
In the study conducted in rural and urban districts of the Democratic Republic of Timor-Leste, it was found that information about TB, its treatment, and the availability of incentives, such as transportation cost reimbursement or food support, positively influenced adherence (Ruru et al., 2018a). Four key determinants contribute to non-adherence, namely, structural (e.g., poverty and gender discrimination), social, and health service-related factors, as well as individual considerations (World Health Organization, 2003; Munro et al., 2007). An Indonesian study revealed that the most common reasons for non-adherence included patients feeling better, economic issues, and side effects of therapy. Other reasons were bad perceptions about the healthcare staff, treatment, and medication quality (Widjanarko et al., 2009). Recent investigations indicate the significance of socioeconomic challenges and the lack of adequate patient support in contributing to high rates of treatment discontinuation in Indonesia (Global, 2021). Effective adherence relies on social support, which may include the presence of a treatment observer and health education (Widjanarko et al., 2009; Ruru et al., 2018a; Pradipta et al., 2022b). Additional barriers to this consist of a preference for traditional medicine and economic and geographical problems (Ruru et al., 2018a; Pradipta et al., 2023).
Several existing questionnaires, such as the Morisky Medication 8-item Adherence Scale (MMAS-8) and MARS-5 Medication Adherence Report Scale-5 items (MARS-5) have been widely used to assess patient adherence to ongoing treatment (Lee et al., 2013; Rosyida, 2015; Naafi et al., 2016; Pradipta et al., 2020; Iranpour et al., 2022). However, their suitability for measuring non-adherence levels remains uncertain. There is no universally accepted gold standard questionnaire for evaluating non-adherence, specifically within the scope of TB. To address this gap, structural equation modeling-partial least squares (SEM-PLS) analysis was applied to develop a questionnaire that can be used to create a predictive model. The SEM-PLS approach comprised two distinct phases, i.e., the evaluation of measurement and structural models (Kono and Sato, 2022; Kori and Azmi, 2022).
Tuberculosis still poses a significant health challenge in Indonesia, necessitating interventions tailored to the diverse settings of the country (World Health Organization, 2003; Lestari et al., 2023). Therefore, this study presents a meticulously designed questionnaire for assessing the factors contributing to medication non-adherence among TB patients. Drawing inspiration from the five-dimensional framework established by WHO, the questionnaire was developed based on comprehensive systematic reviews and prior qualitative studies (DiMatteo, 2004; Munro et al., 2007). Importantly, before pilot testing, the initial development phase did not include direct patient input, instead, the primary focus was placed on capturing expert perspectives to refine item selection (World Health Organization, 2003). While the questionnaire yields statistically robust insights, its true value lies in practical applications. Considering the vast geographical and sociocultural differences in Indonesia, this tool is designed for flexible integration into various local contexts, facilitated through collaborations with local health entities (Lutge et al., 2014; Jimmy and Jose, 2011). Additionally, it is intended for use among TB patients in the early stages of treatment, capturing critical insights during this crucial period. The results can aid healthcare professionals in refining treatment adherence strategies and serve as a foundation for policymakers aiming to enhance TB management on a national scale (Stirratt et al., 2015).
2 Methods
2.1 Ethics approval
This study obtained approval from the ethics committees of Universitas Padjadjaran (No: 086/UN6. KEP/EC/2021), private hospitals (No: 1212/XIII/12/2020), and public hospitals (No: 13/KEPK-RSUPP/02/2021). Additionally, it was conducted in accordance with the Helsinki Declaration, and all participants provided informed consent.
2.2 Study design and sample size
The initial phase of questionnaire development constituted the engagement of a cohort of 50 patients, each with an extensive TB treatment regimen spanning a minimum of 6 months. This collective cohort participated in an inaugural assessment aimed at quantifying the efficacy of the measuring instrument in capturing the underlying construct. The construct validity assessment primarily focused on evaluating the ability of the questionnaire to measure the intended variables. Subsequently, a purposive sampling strategy was applied in the validation phase, targeting patients with a shorter TB treatment duration, ranging from one to 2 months.
For the validation phase, a representative sample was selected from the cohort of newly diagnosed patients in the Jakarta area between 2020 and 2021. Based on the Indonesian Health Profile report, published by the Ministry of Health, it was determined that Jakarta discovered a total of 28,125 cases in 2021 compared to the 24,274 recorded in 2020. This signified a discernible increment of 3,851 cases, which constituted the entire patient population scrutinized in this study.
The following two distinct methods were used to determine the optimal sample size: 1) The Krejcie and Morgan table in conjunction with the population parameters was deployed to obtain an optimal sample size ranging from 346 to 351 patients; 2) Alternatively, the Slovin formula, a well-established mathematical construct was applied for calculating sample size, with an error margin (e) of 5% (0.05). This included using the formula n = N/(1 + Ne^2), yielding a minimum sample size of 362 patients.
In summary, the methodological framework determined a required sample size ranging from 346 to 362. Consequently, the comprehensive patient cohort for this study comprised 396 individuals, out of which 50 were actively engaged in the developmental phase and the remaining 346 were allocated to the validation stage. A flow diagram indicating the development and validation of the questionnaire is presented in Figure 1.
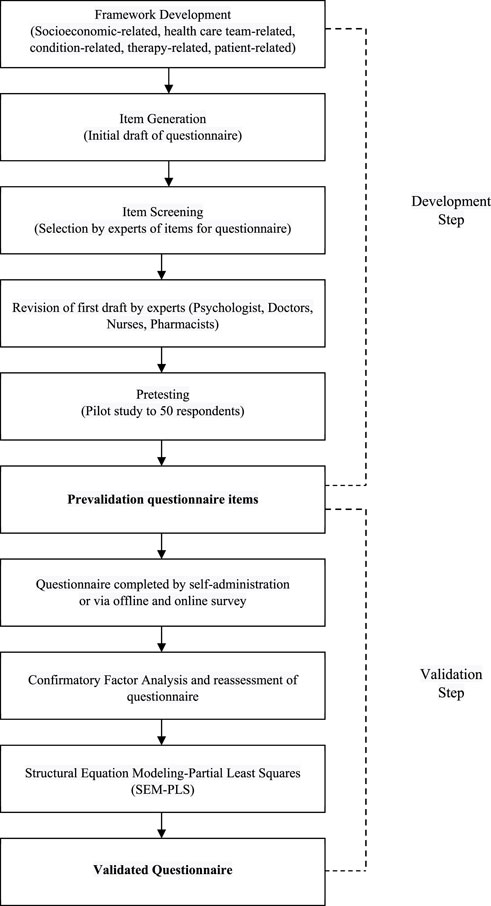
FIGURE 1. Flowchart of questionnaire development and validation.
2.3 Development of questionnaire items
2.3.1 Framework development
A systematic review and a qualitative study were initially conducted to identify relevant factors used to construct a questionnaire for predicting TB patient non-adherence. Subsequently, a framework that described the five factors influencing long-term medication adherence, namely, socioeconomic status, healthcare team, medical conditions, therapy, and patients, was adopted from the WHO (World Health Organization, 2003).
2.3.2 Item generation
Building upon the previously established framework, questionnaire items representing each dimension or variable to be measured were developed. Although the framework primarily pertained to adherence, this study adapted all the obtained dimensions to the context of non-adherence. Five items created for each indicator in the variable were assessed by TB treatment experts and analyzed by psychologists.
2.3.3 Item screening
A panel of experts, including a psychologist, three pulmonary specialists, two nurses, and three pharmacists, assessed the level of difficulty and adequacy of the questionnaire. This evaluation was based on qualitative study activities conducted before the questionnaire development. The experts participated in focus group discussions (FGD) regarding the factors influencing non-adherence and were selected according to the possession of at least 1 year of experience in TB medication. Specifically, psychologists were engaged in assessing the readability and comprehensibility of the items before the pretesting stage. Following this process, the initial selection of items was refined based on assigned the median total score. Items that received higher scores, as indicated by multiple experts, proceeded to the next stage.
2.3.4 Pretesting (pilot study)
After the panel of experts conducted a content validity assessment, a pilot questionnaire was pretested on 50 respondents in December 2021, as recommended by healthcare professionals. Criteria for participant selection included a history of medication non-adherence, age 18 years or older, a minimum of high school education, and willingness to provide informed consent. Respondents were recruited during hospital visits, and each completed a paper copy of the questionnaire. Trained assistants reviewed the self-administered questionnaires on-site before being delivered to the study team.
2.4 Validation of questionnaire items
The pilot study produced prevalidated questionnaire items that showed statistical validity and could be applied in a comprehensive validation process using SEM-PLS. The entire validation phase was conducted from January to March 2022 and respondents were selected through a purposive sampling technique. Selection criteria included sensitive TB patients recently placed on medication (1–2 months), aged 18 years or older, with a minimum of high school education, and willing to sign an informed consent. Questionnaires were distributed in one public and six private hospitals, as well as nine community health centers in Jakarta. An online Google survey was used for remote respondents registered as patients at the designated study location.
2.4.1 Confirmatory factor analysis (CFA)
Confirmatory factor analysis (CFA) is an integral component of SEM, valuable for the appropriateness of variable measurements concerning the number of factors. In CFA, factors can be considered as constructs, and this analysis represents an interdependence technique for determining the underlying structure in construct variables. High partial correlation in factor analysis holds practical and statistical significance, with the general rule of thumb suggesting values above 0.70 as conceptually valid (Lance and Vandenberg, 2002; Harrington, 2009; Brown and Moore, 2012). However, the Bartlett roundness test at a level of >0.05 indicates a sufficient correlation between construct variables for a single-factor analysis (Suhr, 2006; Hair et al., 2014a; Gatignon and Gatignon, 2014; Brown, 2015).
2.4.2 Structural equation modeling-partial least squares (SEM-PLS)
SEM is a statistical model that describes the relationships among several variables (Hair et al., 2014b). During the calculation process, SEM simultaneously examines the structural relationships expressed through a series of equations resembling multiple regression equations. These equations elucidate all the interconnections between analyzed constructs, comprising both dependent and independent variables. Constructs are unobservable and cannot be represented by numerous variables compared to those representing factors in CFA. Moreover, PLS-SEM is a causal-predictive method of SEM that stresses prediction in estimating statistical models aimed at providing causal explanations (Hair et al., 2019). In this study, each item used an ordinal Likert scale for measurement, with five potential response levels. Indicators with ordinal responses from at least four categories may be interpreted as intervals, or at the very least, as continuous variables. No two indicators for a construct must have the same scale type, and scale values need not be normalized (Hair et al., 2014b). The utility of a questionnaire as a study instrument is evaluated using the validity and reliability method. Validity refers to the extent to which observations accurately record the examined variables. Meanwhile, reliability relates to the consistency of observations, often determined by whether two (or more) observers or the same observers, monitoring the same event on successive occasions, reach similar conclusions (Sekaran and Bougie, 2016).
2.5 Statistical analysis
Data analysis was performed using SPSS Statistics for Windows (version 24.0) and SMART-PLS software (version 3.0) in an SEM-PLS environment. In the pretesting phase, bivariate Pearson correlation statistical analysis was applied to determine the validity of the items sorted by experts. Pearson correlation measures the relationship between observations from a population with two variants (bivariate), normally distributed. With the participation of 50 patients, items indicating a Pearson correlation value exceeding 0.278 proceeded to the validation phase, which used SEM. Besides, SEM-PLS incorporates a measurement model that evaluates the relationship between indicators and their latent variables, automatically presenting the factor load as an indicator of the validity of a factor or latent variable (Ghozali, 2014). Regarding the validity limits, indicators with factor loadings between 0.40 and 0.70 are considered for removal only when the scenario tends to enhance the composite reliability score. However, content validity factors must be considered during the elimination of these indicators. Indicators with factor loading values below 0.40 should be removed, and those between 0.40 and 0.70 may be retained supposing their presence does not adversely affect the average variance extracted (AVE) gain or composite reliability. In this study, the validity limit value used was 0.40, considering the applicable terms and conditions, as well as the significance of the coefficient at a 5% level (Hair et al., 2021). Composite reliability and Cronbach’s alpha were applied to assess the reliability of the study instruments. While these two methods use distinct calculation methodologies, both reveal the level of reliability for each latent or constructed variable. The minimum value required for optimal reliability is 0.60, with higher values indicating greater reliability (Hair et al., 2021). Computation analysis and validity-reliability testing were performed using SEM-PLS and SmartPLS 3 software (Hair et al., 2019). The value of composite reliability was assessed to test the reliability of each indicator on a variable, and >0.70 was considered the benchmark for high reliability. Specifically, reliability is essential for ensuring the precision and accuracy of measurements. Reliability testing was conducted by examining the value of Cronbach’s alpha to determine whether the data obtained from the instrument showed adequate internal consistency. Note that a study instrument is considered reliable once the Cronbach’s alpha value is >0.60 (Chin, 1998; Hair et al., 2014a; Ghozali, 2016).
3 Results
3.1 Development of questionnaire items
3.1.1 Framework development
The five-dimensional framework of WHO for adherence was adapted into the concept of non-adherence in this study. These five dimensions comprised the various causes and risk factors associated with non-adherence, based on the results of systematic reviews and qualitative studies conducted previously. Each dimension had specific indicators used for measuring its impact on medication non-adherence. A total of 32 indicators were successfully generated, with each contributing five items. As shown in Figure 2, the dimensions were as follows: socioeconomic (6 indicators; 30 items), healthcare team (8 indicators; 40 items), conditions (4 indicators; 20 items), therapy (9 indicators; 45 items), and patients (5 indicators; 25 items). This resulted in the generation of a total of 160 items in the subsequent stage.

FIGURE 2. Framework development for questionnaire items.
3.1.2 Item generation
The items generated for the questionnaire were adapted to local settings and divided into six main sections, as presented in Table 1. These included Demographic factors (5 items) which examined demographic and socioeconomic characteristics. Socioeconomic-related factors (30 items) constituting considerations such as economic priorities. In developing countries, patients with low socioeconomic status often face the challenge of balancing competing priorities. These competing priorities might require allocating limited resources to meet the needs of other family members, such as the children or parents catered for (Killewo, 2002; World Health Organization, 2003; Diniawati and Wibowo, 2018; Mahara et al., 2018). Healthcare team-related factors (40 items) explored the effects of the patient-provider relationship, and more investigations are needed concerning the impact of the healthcare team and system-related factors on non-adherence. While an excellent patient-provider relationship can increase adherence several factors have a negative effect. These are comprised of underdeveloped healthcare services, inadequate or nonexistent reimbursement by health insurance plans, poor drug distribution systems, and a lack of knowledge and training among healthcare providers in managing chronic diseases (World Health Organization, 2003; Do Peterson et al., 2012; Gugssa Boru et al., 2017). Condition-related factors (20 items) included demands, symptoms, and disease-specific issues targeted by healthcare professionals. Several conditional factors, such as patient geography and health status, influenced their willingness to complete medication (World Health Organization, 2003; Shargie and Lindtjørn, 2007; Tadesse et al., 2013; Woimo et al., 2017; Ruru et al., 2018b). Therapy-related factors (45 items) consisted of the main barriers to adherence found in intervention studies, such as dosing frequency and side effects. Collaboration between pharmaceutical companies, health professionals, and researchers is essential to address this issue. Health systems play an essential role in minimizing the impact of side effects (World Health Organization, 2003; Do Peterson et al., 2012; Gugssa Boru et al., 2017; Heuvelings et al., 2017). Patient-related factors (25 items) examined the primary barriers to compliance as described in the reviewed literature, namely, a lack of information and self-management skills, difficulties with motivation and self-efficacy, and inadequate support for behavioral change (Morisky et al., 1990; Chambers et al., 2010; Gugssa Boru et al., 2017). These barriers are specifically relevant for interventions aimed at changing habits and lifestyles, as well as influencing drug use. The WHO recognizes the need to support patient self-management efforts, and many researchers are working to develop, enhance, and disseminate self-management guidelines (World Health Organization, 2003; Gough and Kaufman, 2011; Van Den Boogaard et al., 2012; Chowdhury et al., 2015; Sahile et al., 2018).
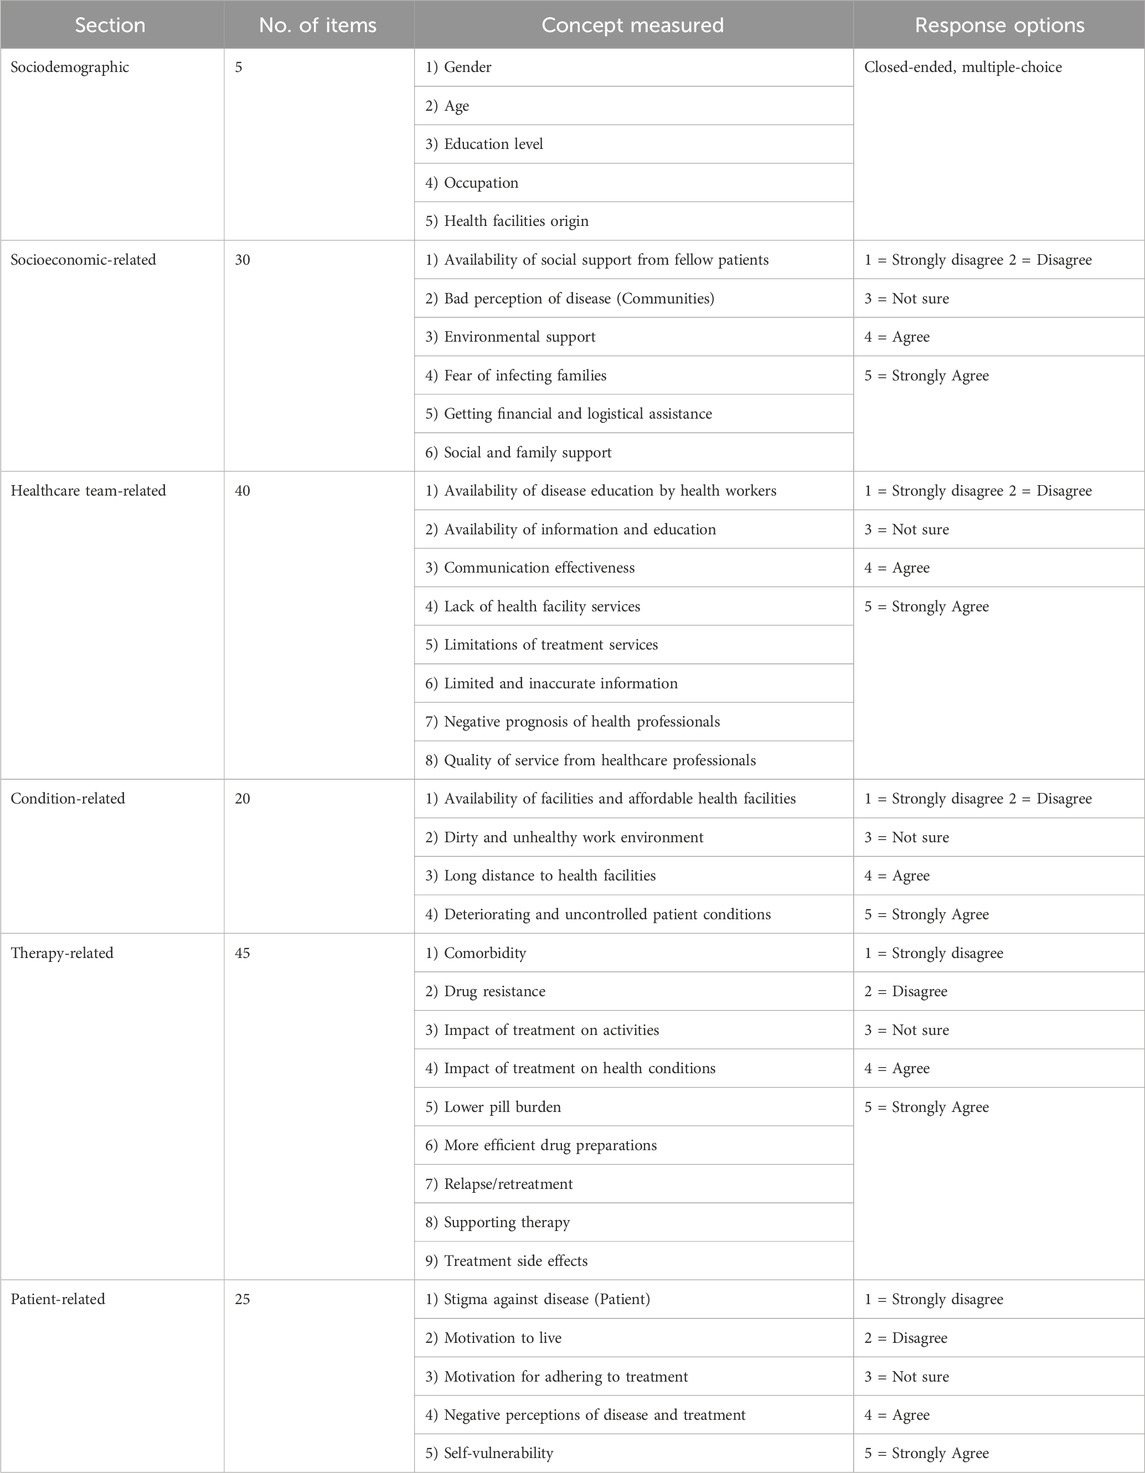
TABLE 1. Details of questionnaire sections on sociodemographic and all factors.
This section consisted of choices on a scale from one to five, with response categories ranging from “strongly disagree” to “strongly agree” for each question. Following the results of the item selection by experts, a total of 60 questionnaire items were used in the pilot study. At this stage, the expectation was to obtain a questionnaire containing a more streamlined set of items to facilitate measurement with fewer items during validation.
3.1.3 Item screening
In this phase, the initial selection of 160 items was reduced to 60, based on a median total score of 2.0 for each. Items selected by more than two experts proceeded to the next stage.
3.1.4 Pretesting (pilot study)
The results of face validity obtained during the pilot study featuring 50 respondents reduced the number of questionnaire items from 60 to 22. The response rate was 100% (50/50 participants), with respondents requiring an average of 15 min to complete the questionnaire. The validity of each item is presented in the Pearson correlation column in Table 2. Considering the 50 respondents (N) and a significance level of 0.05, the minimum Pearson correlation value was 0.278. Therefore, 22 items exhibited Pearson correlation values exceeding 0.2732, denoted by * or ** in the Pearson correlation column of the output table. As a result, 38 items were considered invalid, while 22 were validated.
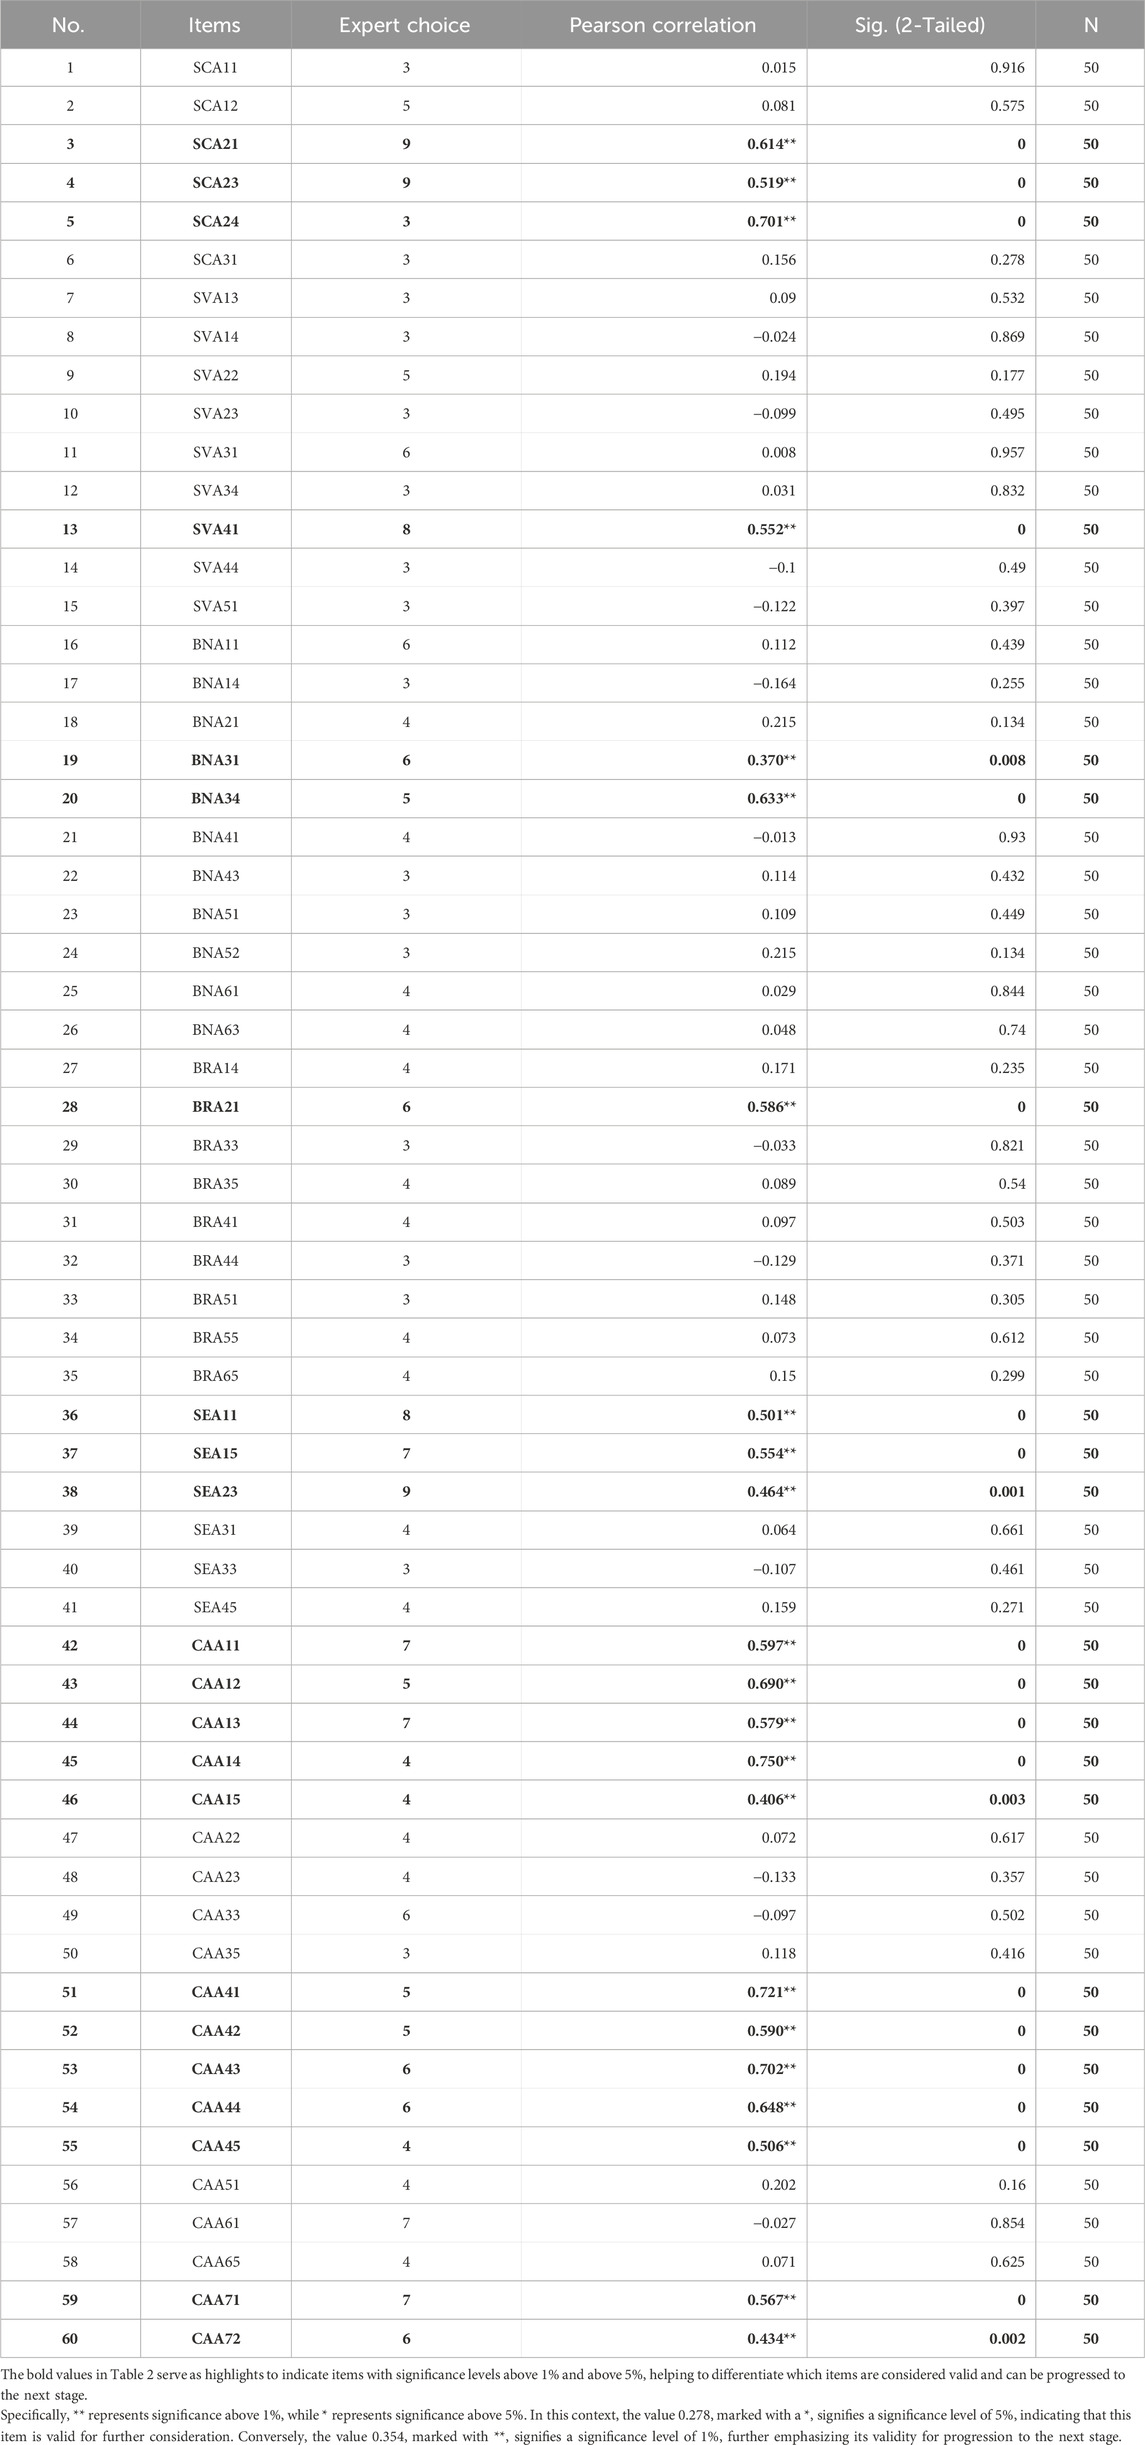
TABLE 2. The results of questionnaire validation through expert review and statistical analysis.
3.1.5 Prevalidated questionnaire items
The 22 questionnaire items identified during the face validity assessment were administered to a total of 346 sensitive TB patients as respondents. None of the patients from the pilot study were included in the validation phase. Table 3 presents an overview of selected items and themes that successfully passed face validity.
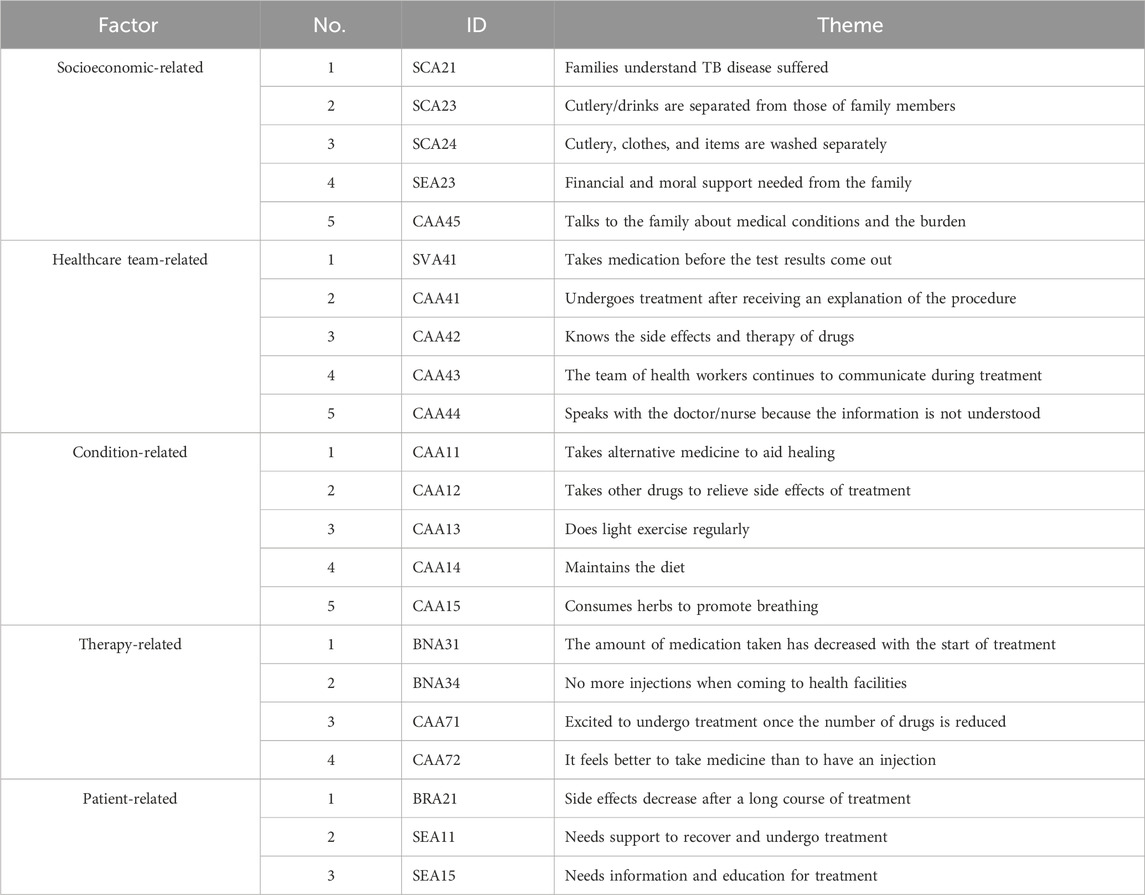
TABLE 3. Twenty two-item and theme validation study.
Overall, the results of the questionnaire development phase can be seen in Figure 3.

FIGURE 3. Process and results of questionnaire development.
3.2 Validation of questionnaire items
3.2.1 Sociodemographic details of respondents
Table 4 presents the demographic characteristics of the 346 respondents who participated in this study. The most common age range found was 20–29 years (24.28%), with a mean of 39.71 (±10.71) years. Most of the respondents were male (54.91%). The educational background was predominantly high school (82.37%), while some (17.34%) completed tertiary education. A significant proportion was unemployed (39.30%) and a small percentage was health workers (0.76%). A substantial number came from private hospitals (38.15%), which was justifiable because these hospitals served as referral centers for pulmonary diseases in Jakarta.
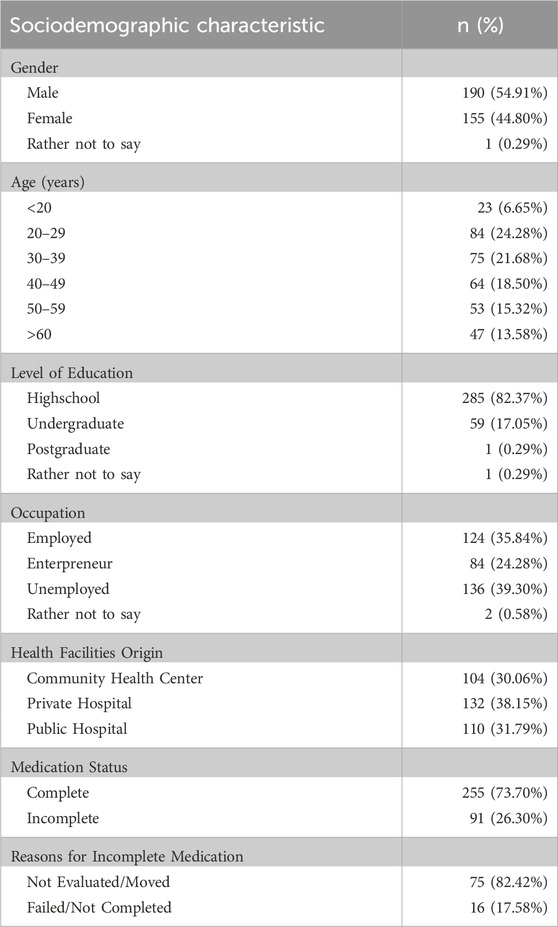
TABLE 4. Sociodemographic characteristics of respondents.
3.2.2 Confirmatory factor analysis (CFA)
Table 5 shows the results for each measured factor, as each item in all the factors was tested for factor loading to identify the influence of each item.

TABLE 5. Analysis of all factors.
Standardized factor loadings were expected to exceed 0.70, but factor loadings in the 0.40–0.70 range could be evaluated. The evaluation conducted featured content validity by considering the impact exerted on the AVE gain and composite reliability. A higher factor loading value signified greater validity of the construct measurement (Hair et al., 2014b). Factor loadings must be statistically significant, with t values exceeding 1.96 for a 5% significance level (Hair et al., 2014b). To measure convergent validity, the AVE was used, with a threshold value of 0.50. A higher AVE value indicated more information obtained from the latent and reflected similarity in the latent construct (Hair et al., 2014b). Composite reliability and Cronbach’s alpha ought to have a value of at least 0.70, although a minimum of 0.60 is acceptable for exploratory studies (Hair et al., 2014b). Regarding cross-loading, each indicator should exhibit a stronger correlation with its construct than other constructs, indicating discriminant validity. This empirical standard ensures that a measured construct is distinct from other constructs (Hair et al., 2014b).
3.2.2.1 Socioeconomic-related factors
The composite reliability value for socioeconomic-related factors was >0.7, confirming the suitability of the data for factor analysis. Based on commonality, one item (SEA23) had a very low factor loading and was excluded from further analysis, as it would not correlate with other items representing socioeconomic-related factors. Additionally, one item (SCA21) had the lowest factor loading (0.52) but was retained in the analysis because a factor loading >0.4 was considered the minimum acceptable value. The other three items (SCA23, SCA24, CAA45) met the criteria for reliability and were retained. In summary, only SEA23 was excluded and four items (SCA23, SCA24, SEA23, and CAA45) were considered reliable for socioeconomic-related factors (Table 6).

TABLE 6. Factor loading of 22-items.
3.2.2.2 Healthcare team-related factors
The composite reliability value for healthcare team-related factors also exceeded 0.7, indicating data suitability for factor analysis. One item (SVA41) showed a very low factor loading and was excluded from further analysis, as it would not correlate with others representing healthcare team-related factors. Additionally, two items (CAA41 and CAA42) had relatively low factor loadings but were maintained in the analysis due to their factor loadings exceeding the minimum acceptable value of 0.4. The other two items (CAA43 and CAA44) met the reliability criteria and were retained. In summary, only SVA41 was excluded and CAA41, CAA42, CAA43, and CAA44 were considered reliable for healthcare team-related factors (Table 6).
3.2.2.3 Condition-related factors
The composite reliability value for condition-related factors was >0.7, indicating data suitability for factor analysis. No item had low factor loading, consequently all were included in further analysis. One item (CAA14) had a low factor loading of 0.48 but was maintained in the analysis due to being greater than the minimum acceptable value of 0.4. The remaining four items (CAA11, CAA12, CAA13, and CAA15) met the reliability criteria and were retained. In summary, all five items were considered reliable for condition-related factors (Table 6).
3.2.2.4 Therapy-related factors
The composite reliability value for therapy-related factors was >0.7, indicating that the data were suitable for factor analysis. No item had low factor loading, consequently all were included in further analysis. One item (BNA34) showed the lowest factor loading (0.55) but was retained, as it exceeded the minimum acceptable value of 0.4. The other three items (BNA31, CAA71, and CAA72) met the reliability criteria and were retained. All four items were considered reliable for therapy-related factors (Table 6).
3.2.2.5 Patient-related factors
The composite reliability for patient-related factors was >0.7, indicating data suitability for factor analysis. One item (SEA11) had a very low factor loading and was excluded from further analysis, as it would not correlate with other items representing patient-related factors. The remaining two items (BRA21 and SEA15) were deemed acceptable and retained patient-related factors (Table 6), hence only SEA11 was excluded.
3.2.3 Structural equation modeling-partial least square (SEM-PLS)
The results of the questionnaires at the validation stage determined the items that proceeded to the SEM-PLS modeling stage (Figure 4). Upon model simulation, differences emerged between valid items in factor loadings at the analysis stage and factor loadings on SEM. In the analysis stage, SEA23, SVA41, and SEA11 were deemed invalid. In the simulated SEM-PLS model, SEA23, SVA41, CAA13, CAA14, BNA34, CAA72, SEA11, and SEA15 were excluded. The three items, including SEA23, SVA41, and SEA11, remained invalid in both factor analysis and SEM despite sharing similarities. CAA13, CAA14, BNA34, CAA72, and SEA15 which were valid in the factor analysis became invalid in SEM. This showed that SEM examined the effect of each item on the factor measured, and the influence of the factor on non-adherence. Consequently, SEM yielded more invalid items compared to factor analysis.
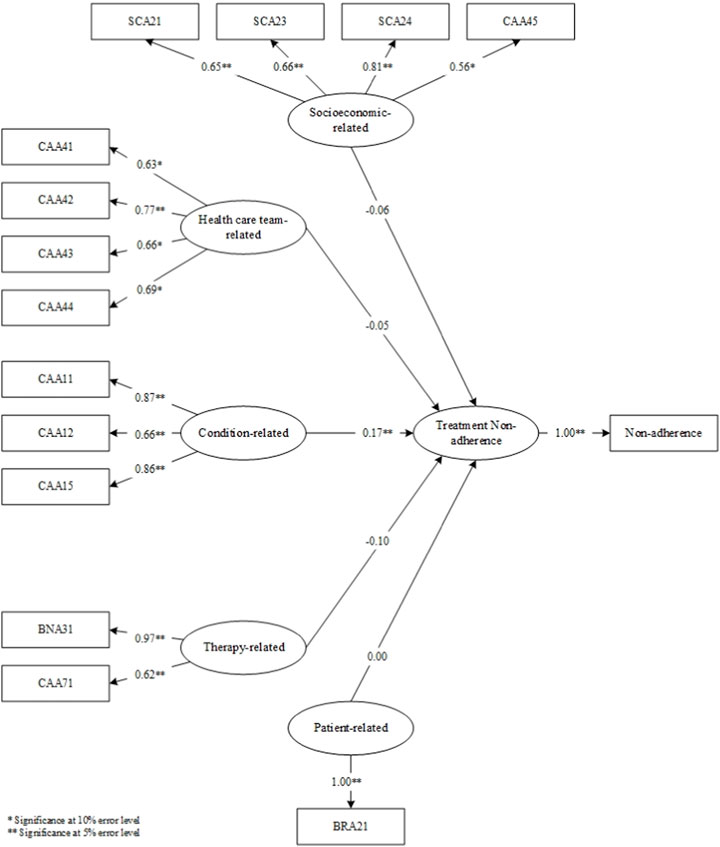
FIGURE 4. SEM-PLS modeling.
In the simulated SEM-PLS model, only one factor, namely, condition, significantly influenced non-adherence. This indicated why all condition-related factor items remained entirely valid at the analysis stage. However, the therapy-related factors had no impact on non-adherence in the SEM-PLS model. In comparison to the other four, condition-related factors significantly influenced patient non-adherence to medication.
Following the SEM-PLS modeling process, 14 valid items remained across the five factors, including those related to socioeconomics (4 items; SCA21, SCA23, SCA24, CAA45), healthcare team (4 items; CAA41, CAA42, CAA43, CAA44), medical condition (3 items; CAA11, CAA12, CAA15), therapy (2 items; BNA31, CAA71), and patients (1 item; BRA21). Only condition-related factors significantly influenced non-adherence, and as indicated in Table 7, the constructs developed were reliable. The reliability test conducted in PLS applied Cronbach’s alpha and composite reliability techniques. Cronbach’s alpha measures the lower limit of the reliability value of a construct, while composite reliability estimates the actual value. Composite reliability is considered better at estimating the internal consistency of a construct. Moreover, the rule of thumb used for the composite reliability value indicated >0.7, and the obtained Cronbach’s alpha value exceeded 0.6 (Chin, 1998; Ghozali, 2016), signifying that all constructs had good reliability.
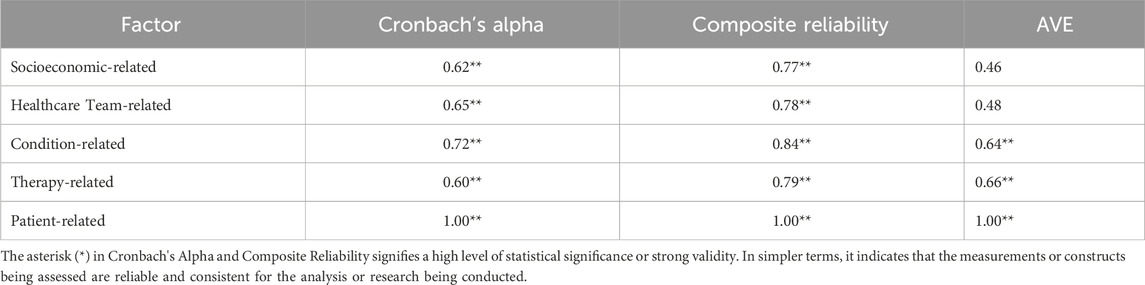
TABLE 7. Analysis of all factors after SEM-PLS modeling.
Overall, the results of the questionnaire validation phase can be seen in Figure 5.
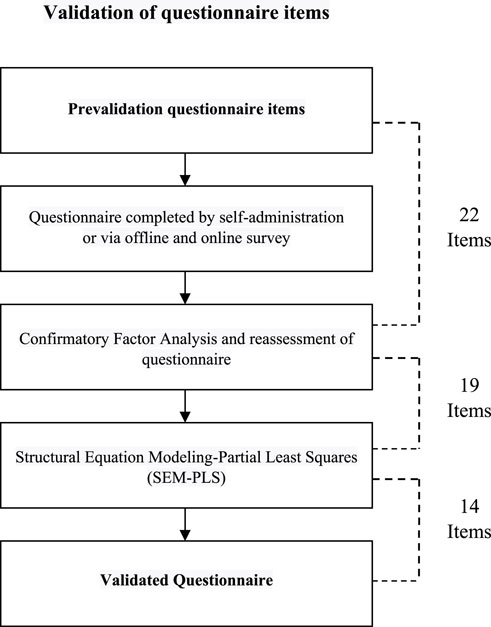
FIGURE 5. Process and results of questionnaire development.
4 Discussion
Following a rigorous validation process featuring nine experts, including a psychologist, three pulmonary specialists, two nurses, and three pharmacists, as well as 50 patients from two health facilities, 22 items were obtained for the final draft of the questionnaire. The questionnaire was tested using 346 TB patients who had only been on medication for 1–2 months. Additionally, it was distributed offline and online in accordance with ethical research agreements. The results of this study showed the influence of each item on the factors examined.
The questionnaire was suitably developed to address the complexities of the diverse regions in Indonesia and the unique healthcare challenges encountered. Indonesia has been reported to show significant regional disparities in healthcare infrastructure, patient attitudes, and socioeconomic influences (Erawati and Andriany, 2022; Siswantining et al., 2020; Pratiwi et al., 2020). Considering these disparities, the questionnaire was designed to be adaptable and relevant across different areas of the country, but some regional customization was required before the broad implementation (Mahmudiono and Laksono, 2021). In the initial phase of item development, the questionnaire was created based on evidence gathered from systematic reviews and qualitative studies rather than direct patient engagement (Bowden and Fox-Rushby, 2003). This choice was influenced by studies suggesting that expert-driven item generation often provides a more structured foundation for pilot testing (Collins, 2003). The questionnaire was designed to assess medication non-adherence factors in TB patients and intended for use across public and private healthcare settings in Indonesia, providing actionable insights for healthcare professionals. The insights provided by this questionnaire (Mekonnen and Azagew, 2018; Vaughan et al., 2019) were expected to assist policymakers, medical practitioners, and scientists in enhancing healthcare delivery and patient adherence to improve treatment outcomes (DiMatteo, 2004; Departemen Kesehatan, 2018; Kemenkes, 2020).
This study identified socioeconomic, healthcare team, condition, therapy, and patient-related issues as the five main factors contributing to medication non-adherence in TB patients. One item in each of the socioeconomic, healthcare team, and patient-related factors did not exert statistically significant effects, while all items in both condition and therapy were found to have significant impacts. Additionally, the factor loading value considered for each item was ≥0.40. The influence of each factor on the possibility of patient non-adherence was examined as presented in Figure 4. The analysis results showed that only condition-related factors significantly influenced medication non-adherence.
This study applied methods similar to those used in previous investigations conducted in Sabah, Malaysia (Guad et al., 2021). While several methods were replicated, the primary difference could be found in the analytical method. This study combined CFA with SEM-PLS, but other sources commonly used a single method, such as CFA or Exploratory Factor Analysis (EFA) (Deng et al., 2017; Soh et al., 2018; Gunawan et al., 2021). EFA is mostly used in cases where initial information is lacking or when hypotheses must be derived from a set of indicators, leading to the creation of variables from these indicators (Gorsuch, 1988; Fabrigar et al., 1999; Cudeck, 2000; Suhr, 2006; Fabrigar and Wegener, 2011; Hooper, 2012). During the analytical process, CFA was conducted because the indicators and variables were known. Besides, SEM-PLS is a relatively less utilized method for developing questionnaires, primarily due to its prevalence in investigations focused on predictive modeling (Brown, 2015). The combination of CFA and SEM-PLS was deployed to elucidate the capability of the developed and validated questionnaire to measure the impact of indicators on variables or dimensions and the effect of each variable on non-adherence (Brown and Moore, 2012; Hair et al., 2019; Kono and Sato, 2022). Through SEM-PLS analysis, this questionnaire was used to construct a predictive model for predicting TB patient non-adherence at the onset of treatment.
In the aspect of statistical analysis, this study applied robust methodological tools, specifically CFA and SEM-PLS, to examine the empirical results (Hair et al., 2019; Erawati and Andriany, 2022). This methodological choice was based on the predictive potential of the carefully developed and validated questionnaire. The CFA and SEM-PLS techniques not only clarified the complex causal pathways underlying the observed phenomena but could also forecast future trends (Luies et al., 2017). These methodologies synergistically facilitated a comprehensive examination of the relationships within the model, enabling predictions and enhancing the understanding of variable interactions (Collins et al., 2015; Dessalegn et al., 2016).
The applied methodologies were intentionally selected due to certain considerations. Despite other approaches, such as the regression technique, being valid and widely utilized, the distinctive focus of this study necessitated a non-traditional approach (Zhu et al., 2022; Do Peterson et al., 2012; Chowdhury et al., 2015; Erawati and Andriany, 2022). The adopted approach created a distinct path suitably tailored to the inherent intricacies and nuances of the study question. In summary, the utilization of CFA and SEM-PLS represented a streamlined approach. Additionally, the predictive potential of the model constructed from the questionnaire resonated strongly with the applied methods. These statistical tools impart explanatory power and the invaluable ability to predict future trends.
The questionnaire served as a foundation for constructing a predictive model for non-adherence. Furthermore, the score of each item in it offered valuable insights into the influence exerted on non-adherence. Theoretically, this study provided an overview of the steps and procedures for developing and validating questionnaires used to assess non-adherence in TB patients as well as those suffering from other diseases. The questionnaire could be practically tested in various provinces across Indonesia or Southeast Asia, supporting healthcare providers in delivering appropriate services to patients at risk of non-adherence. However, this study is currently limited to measuring non-adherence in TB patients due to the unique demographic conditions in Indonesia.
5 Conclusion
A structured questionnaire was successfully developed to assess medication non-adherence among TB patients in Indonesia. The final 22 items that emerged from this rigorous process indicated a valid and robust questionnaire for assessing risk factors of medication non-adherence among pulmonary tuberculosis patients in Indonesia. The developed questionnaire was positioned to be a valuable tool for healthcare professionals, policymakers, and scientists in creating patient-centered strategies and interventions to address non-adherence.
Data availability statement
The raw data supporting the conclusion of this article will be made available by the authors, without undue reservation.
Ethics statement
This study obtained approval from the ethics committees of Universitas Padjadjaran (No: 086/UN6. KEP/EC/2021), private hospitals (No: 1212/XIII/12/2020), and public hospitals (No: 13/ KEPK-RSUPP/02/2021). Additionally, it was conducted in accordance with the Helsinki Declaration, and all participants provided informed consent.
Author contributions
LR: Data curation, Investigation, Writing–original draft. IA: Data curation, Writing–original draft. SA: Validation, Writing–review and editing. AI: Supervision, Writing–review and editing. IP: Supervision, Writing–review and editing. RA: Supervision, Writing–review and editing.
Funding
The author(s) declare financial support was received for the research, authorship, and/or publication of this article. This study was funded by the Indonesian Ministry of Education, Culture, Research, and Technology through the BPPDN scholarship for LR. The funding source had no engagement in the design, collection, analysis, and interpretation of data, as well as in the manuscript writing.
Conflict of interest
The authors declare that the research was conducted in the absence of any commercial or financial relationships that could be construed as a potential conflict of interest.
Publisher’s note
All claims expressed in this article are solely those of the authors and do not necessarily represent those of their affiliated organizations, or those of the publisher, the editors and the reviewers. Any product that may be evaluated in this article, or claim that may be made by its manufacturer, is not guaranteed or endorsed by the publisher.
References
Alipanah, N., Jarlsberg, L., Miller, C., Linh, N. N., Falzon, D., Jaramillo, E., et al. (2018). Adherence interventions and outcomes of tuberculosis treatment: a systematic review and meta-analysis of trials and observational studies. PLoS Med. 15 (7), e1002595. doi:10.1371/journal.pmed.1002595
Bowden, A., and Fox-Rushby, J. A. (2003). A systematic and critical review of the process of translation and adaptation of generic health-related quality of life measures in Africa, Asia, Eastern Europe, the Middle East, South America. Soc. Sci. Med. 57 (7), 1289–1306. doi:10.1016/s0277-9536(02)00503-8
Brown, T. A. (2015). Confirmatory factor analysis for applied research. China: Guilford publications.
Brown, T. A., and Moore, M. T. (2012). Confirmatory factor analysis. Handb. Struct. Equ. Model 361, 379.
Chambers, J. A., O’Carroll, R. E., Hamilton, B., Whittaker, J., Johnston, M., Sudlow, C., et al. (2010). Adherence to medication in stroke survivors: a qualitative comparison of low and high adherers. Br. J. Health Psychol. 16 (3), 592–609. doi:10.1348/2044-8287.002000
Chin, W. W. (1998). The partial least squares approach to structural equation modeling. Mod. methods Bus. Res. 295 (2), 295–336.
Chowdhury, M. R. K., Rahman, M. S., Mondal, M. N. I., Sayem, A., and Billah, B. (2015). Social impact of stigma regarding tuberculosis hindering adherence to treatment: a cross sectional study involving tuberculosis patients in Rajshahi City, Bangladesh. Jpn. J. Infect. Dis. 68 (6), 461–466. doi:10.7883/yoken.JJID.2014.522
Collins, D. (2003). Pretesting survey instruments: an overview of cognitive methods. Qual. life Res. 12, 229–238. doi:10.1023/a:1023254226592
Collins, G. S., Reitsma, J. B., Altman, D. G., and Moons, K. G. M. (2015). Transparent reporting of a multivariable prediction model for individual prognosis or diagnosis (TRIPOD): the TRIPOD statement. Ann. Intern Med. 162 (1), 55–63. doi:10.7326/M14-0697
Cudeck, R. (2000). “Exploratory factor analysis,” in Handbook of applied multivariate statistics and mathematical modeling (Germany: Elsevier), 265–296.
Deng, M., Wang, S., Guan, W., and Wang, Y. (2017). The development and initial validation of a questionnaire of inclusive teachers’ competency for meeting special educational needs in regular classrooms in China. Int. J. Incl. Educ. 21 (4), 416–427. doi:10.1080/13603116.2016.1197326
Departemen Kesehatan, R. I. (2018). Pusat data dan informasi. Germany: Badan Penelitian dan pengembangan Kesehatan Kementrian Kesehatan RI.
Dessalegn, M., Daniel, E., Behailu, S., Wagnew, M., and Nyagero, J. (2016). Predictors of multidrug resistant tuberculosis among adult patients at Saint Peter Hospital Addis Ababa, Ethiopia. Pan Afr. Med. J. 25 (Suppl. 2), 5. doi:10.11604/pamj.supp.2016.25.2.9203
DiMatteo, M. R. (2004). Variations in patients’ adherence to medical recommendations: a quantitative review of 50 years of research. Med. Care 200–9. doi:10.1097/01.mlr.0000114908.90348.f9
Diniawati, E., and Wibowo, A. (2018). The economic burden and non-adherence tuberculosis treatment in Indonesia: systematic review. KnE Life Sci. 17–27. doi:10.18502/kls.v4i10.3703
Do Peterson, M., Lin, E. H. B., Korff, M. V., Ciechanowski, P., Rutter, C. M., Oliver, M., et al. (2012). Treatment adjustment and medication adherence for complex patients with diabetes, heart disease, and depression: a randomized controlled trial. Ann. Fam. Med. 10, 6–14. doi:10.1370/afm.1343
El Sahly, H. M., Wright, J. A., Soini, H., Bui, T. T., Williams-Bouyer, N., Escalante, P., et al. (2004). Recurrent tuberculosis in Houston, Texas: a population-based study. Int. J. Tuberc. lung Dis. Off. J. Int. Union against Tuberc. Lung Dis. 8 (3), 333–340.
Erawati, M., and Andriany, M. (2022). The prevalence and demographic risk factors for latent tuberculosis infection (LTBI) among healthcare workers in semarang, Indonesia. J. Multidiscip. Healthc. 13, 197–206. doi:10.2147/JMDH.S241972
Fabrigar, L. R., and Wegener, D. T. (2011). Exploratory factor analysis. Oxford: Oxford University Press.
Fabrigar, L. R., Wegener, D. T., MacCallum, R. C., and Strahan, E. J. (1999). Evaluating the use of exploratory factor analysis in psychological research. Psychol. Methods 4 (3), 272–299. doi:10.1037/1082-989x.4.3.272
Fang, X.-H., Shen, H.-H., Hu, W.-Q., Xu, Q.-Q., Jun, L., Zhang, Z.-P., et al. (2019). Prevalence of and factors influencing anti-tuberculosis treatment non-adherence among patients with pulmonary tuberculosis: a cross-sectional study in anhui province, eastern China. Med. Sci. Monit. Int. Med. J. Exp. Clin. Res. 25, 1928–1935. doi:10.12659/MSM.913510
Gatignon, H., and Gatignon, H. (2014). Confirmatory factor analysis. Stat. Anal. Manag. data, 77–154. doi:10.1007/978-1-4614-8594-0_4
Ghozali, I. (2014). Structural equation modeling metode alternatif dengan partial least squares (PLS). 4th ed.). 4th ed. Semarang: Badan Penerbit Universitas Diponegoro.
Global (2021). Tuberculosis report 2021. 2021st ed. World health organization. Geneva: World Health Organization, 1–4.
Gorsuch, R. L. (1988). Exploratory factor analysis. Handb. Multivar. Exp. Psychol., 231–258. doi:10.1007/978-1-4613-0893-5_6
Gough, A., and Kaufman, G. (2011). Pulmonary tuberculosis: clinical features and patient management. Nurs. Stand 25 (47), 48–56. doi:10.7748/ns2011.07.25.47.48.c8643
Guad, R. M., Mangantig, E., Low, W. Y., Taylor-Robinson, A. W., Azzani, M., Sekaran, S. D., et al. (2021). Development and validation of a structured survey questionnaire on knowledge, attitude, preventive practice, and treatment-seeking behaviour regarding dengue among the resident population of Sabah, Malaysia: an exploratory factor analysis. BMC Infect. Dis. 21 (1), 893. doi:10.1186/s12879-021-06606-6
Gugssa Boru, C., Shimels, T., and Bilal, A. I. (2017). Factors contributing to non-adherence with treatment among TB patients in Sodo Woreda, Gurage Zone, Southern Ethiopia: a qualitative study. J. Infect. Public Health, 10 (5), 527–533. Available from. doi:10.1016/j.jiph.2016.11.018
Gunawan, J., Marzilli, C., and Aungsuroch, Y. (2021). Establishing appropriate sample size for developing and validating a questionnaire in nursing research. Belitung Nurs. J. 7 (5), 356–360. doi:10.33546/bnj.1927
Hair, J. F., Babin, B. J., Anderson, R. E., and Black, W. C. (2014b). Multivariate data analysis. 7th Pearson new international ed. Harlow: Pearson.
Hair, J. F., Hult, G. T. M., Ringle, C. M., and Sarstedt, M. (2014a). A primer on partial least squares structural equation modeling. California: SAGE Publications, Inc., 307.
Hair, J. F., Hult, G. T. M., Ringle, C. M., and Sarstedt, M. (2021). A primer on partial least squares structural equation modeling (PLS-SEM). China: Sage publications.
Hair, J. F., Risher, J. J., Sarstedt, M., and Ringle, C. M. (2019). When to use and how to report the results of PLS-SEM. Eur. Bus. Rev. 31 (1), 2–24. doi:10.1108/ebr-11-2018-0203
Harding, E. (2020). WHO global progress report on tuberculosis elimination. Lancet. Respir. Med. 8, 19. doi:10.1016/S2213-2600(19)30418-7
Heuvelings, C. C., de Vries, S. G., and Grobusch, M. P. (2017). Tackling TB in low-incidence countries: improving diagnosis and management in vulnerable populations. Int. J. Infect. Dis. 56, 77–80. Available from. doi:10.1016/j.ijid.2016.12.025
Iranpour, A., Sarmadi, V., Alian Mofrad, A., Mousavinezhad, S. A., Mousavinezhad, S. M., Mohammad Alizadeh, F., et al. (2022). The Persian version of the 8-item Morisky Medication Adherence Scale (MMAS-8): can we trust it? J. Diabetes Metab. Disord. 21 (1), 835–840. Available from. doi:10.1007/s40200-022-01047-7
Jimmy, B., and Jose, J. (2011). Patient medication adherence: measures in daily practice. Oman Med. J. 26 (3), 155–159. doi:10.5001/omj.2011.38
Kemenkes, R. I. (2020). Pedoman nasional pelayanan kedokteran tata laksana tuberkulosis. USA: Jakarta Kementeri Kesehat RI.
Killewo, J. (2002). Poverty, TB, and HIV infection: a vicious cycle, J. health, Popul. Nutr. 20, 281–284.
Kono, S., and Sato, M. (2022). The potentials of partial least squares structural equation modeling (PLS-SEM) in leisure research. J. Leis. Res. 54, 309–329. doi:10.1080/00222216.2022.2066492
Kori, N. H., and Azmi, I. A. G. (2022). Work Commitment and transfer of training: a mediated and moderated model through sem-pls evidence from Pakistan. Online J. Islam Manag. Financ. 2 (2), 42–58.
Lee, G. K. Y., Wang, H. H. X., Liu, K. Q. L., Cheung, Y., Morisky, D. E., and Wong, M. C. S. (2013). Determinants of medication adherence to antihypertensive medications among a Chinese population using Morisky medication adherence scale. PLoS One 8 (4), e62775. doi:10.1371/journal.pone.0062775
Lestari, T., Fuady, A., Yani, F. F., Putra, IWGAE, Pradipta, I. S., Chaidir, L., et al. (2023). The development of the national tuberculosis research priority in Indonesia: a comprehensive mixed-method approach. PLoS One 18 (2), e0281591. doi:10.1371/journal.pone.0281591
Luies, L., Reenen, M. V., Ronacher, K., Walzl, G., and Loots, D. T. (2017). Predicting tuberculosis treatment outcome using metabolomics. Biomark. Med. 11 (12), 1057–1067. Available at:. doi:10.2217/bmm-2017-0133
Lutge, E., Lewin, S., and Volmink, J. (2014). Economic support to improve tuberculosis treatment outcomes in South Africa: a qualitative process evaluation of a cluster randomized controlled trial. Trials 15 (1), 236–313. doi:10.1186/1745-6215-15-236
Mahara, G., Yang, K., Chen, S., Wang, W., and Guo, X. (2018). Socio-economic predictors and distribution of tuberculosis incidence in Beijing, China: a study using a combination of spatial statistics and GIS technology. Med. Sci. 6 (2), 26. doi:10.3390/medsci6020026
Mahmudiono, T., and Laksono, A. D. (2021). Disparity in the hospitals utilization among regions in Indonesia. Open Access Maced. J. Med. Sci. 9 (E), 1461–1466. doi:10.3889/oamjms.2021.7304
Mekonnen, H. S., and Azagew, A. W. (2018). Non-adherence to anti-tuberculosis treatment, reasons and associated factors among TB patients attending at gondar town health centers, northwest Ethiopia 11 medical and health sciences 1103 clinical sciences 11 medical and health sciences 1117 public hea. BMC Res. Notes 11 (1), 1–8. Available from. doi:10.1186/s13104-018-3789-4
Morisky, D. E., Malotte, C. K., Choi, P., Langer, M., Davidson, P., Rigler, S., et al. (1990). A patient education program to improve adherence rates with antituberculosis drug regimens. Heal Educ. Behav. 17 (3), 253–267. doi:10.1177/109019819001700303
Munro, S. A., Lewin, S. A., Smith, H. J., Engel, M. E., Fretheim, A., and Volmink, J. (2007). Patient adherence to tuberculosis treatment: a systematic review of qualitative research. PLoS Med. 4 (7), e238. doi:10.1371/journal.pmed.0040238
Naafi, A. M., Perwitasari, D. A., and Darmawan, E. (2016). Kepatuhan minum obat pasien rawat jalan skizofrenia di rumah sakit jiwa prof. Dr. Soerojo Magelang. Kartika J. Ilm. Farm. 4 (2), 7–12. doi:10.26874/kjif.v4i2.60
Pradipta, I. S., Aprilio, K., Febriyanti, R. M., Ningsih, Y. F., Pratama, M. A. A., Indradi, R. B., et al. (2023). Traditional medicine users in a treated chronic disease population: a cross-sectional study in Indonesia. BMC Complement. Med. Ther. 23 (1), 120. doi:10.1186/s12906-023-03947-4
Pradipta, I. S., Houtsma, D., van Boven, J. F. M., Alffenaar, J.-W. C., and Hak, E. (2020). Interventions to improve medication adherence in tuberculosis patients: a systematic review of randomized controlled studies. NPJ Prim. care Respir. Med. 30 (1), 21. doi:10.1038/s41533-020-0179-x
Pradipta, I. S., Idrus, L. R., Probandari, A., Lestari, B. W., Diantini, A., Alffenaar, J.-W. C., et al. (2021). Barriers and strategies to successful tuberculosis treatment in a high-burden tuberculosis setting: a qualitative study from the patient’s perspective. BMC Public Health 21, 1903–1912. doi:10.1186/s12889-021-12005-y
Pradipta, I. S., Idrus, L. R., Probandari, A., Puspitasari, I. M., Santoso, P., Alffenaar, J.-W. C., et al. (2022a). Barriers to optimal tuberculosis treatment services at community health centers: a qualitative study from a high prevalent tuberculosis country. Front. Pharmacol. 13, 857783. doi:10.3389/fphar.2022.857783
Pradipta, I. S., Khairunnisa, K., Bahar, M. A., Kausar, M. N., Fitriana, E., Ruslami, R., et al. (2022b). Knowledge, attitude and practice of community pharmacy personnel in tuberculosis patient detection: a multicentre cross-sectional study in a high-burden tuberculosis setting. BMJ Open 12 (7), e060078. doi:10.1136/bmjopen-2021-060078
Pratiwi, R. D., Pramono, D., and Junaedi, J. (2020). Socio-economic and environmental risk factors of tuberculosis in wonosobo, central java, Indonesia. KEMAS J. Kesehat. Masy. 16 (1), 61–70. doi:10.15294/kemas.v16i1.12636
Rosyida, L. (2015). Kepatuhan pasien pada penggunaan obat antidiabetes dengan metode pill-count dan MMAS-8 di Puskesmas kedurus surabaya. J. Farm Komunitas 2 (2), 36–41.
Ruru, Y., Matasik, M., Oktavian, A., Senyorita, R., Mirino, Y., Tarigan, L. H., et al. (2018a). Factors associated with non-adherence during tuberculosis treatment among patients treated with DOTS strategy in Jayapura, Papua Province, Indonesia. Glob. Health Action 11 (1), 1510592. doi:10.1080/16549716.2018.1510592
Ruru, Y., Matasik, M., Oktavian, A., Senyorita, R., Mirino, Y., Tarigan, L. H., et al. (2018b). Factors associated with non-adherence during tuberculosis treatment among patients treated with DOTS strategy in Jayapura, Papua Province, Indonesia. Glob. Health Action 11 (1), 1510592. Available from. doi:10.1080/16549716.2018.1510592
Saha, S., Saxena, D., Raval, D., Halkarni, N., Doshi, R., Joshi, M., et al. (2022). Tuberculosis monitoring encouragement adherence drive (TMEAD): toward improving the adherence of the patients with drug-sensitive tuberculosis in nashik, Maharashtra. Front. public Heal 10, 1021427. doi:10.3389/fpubh.2022.1021427
Sahile, Z., Yared, A., and Kaba, M. (2018). Patients’ experiences and perceptions on associates of TB treatment adherence: a qualitative study on DOTS service in public health centers in Addis Ababa, Ethiopia. BMC Public Health 18 (1), 462–512. doi:10.1186/s12889-018-5404-y
Sekaran, U., and Bougie, R. (2016). Research methods for business: a skill building approach. USA: John Wiley & Sons.
Shargie, E. B., and Lindtjørn, B. (2007). Determinants of treatment adherence among smear-positive pulmonary tuberculosis patients in Southern Ethiopia. PLoS Med. 4 (2), e37. doi:10.1371/journal.pmed.0040037
Siswantining, T., Purwandani, NPCD, Susilowati, M. H. D., and Wibowo, A. (2020). Geoinformatics of tuberculosis (TB) disease in Jakarta city Indonesia. GEOMATE J. 19 (72), 35–42. doi:10.21660/2020.72.5599
Soh, H. J., Rowe, K., Davey, M. J., Horne, R. S. C., and Nixon, G. M. (2018). The OSA-5: development and validation of a brief questionnaire screening tool for obstructive sleep apnea in children. Int. J. Pediatr. Otorhinolaryngol. 113, 62–66. doi:10.1016/j.ijporl.2018.07.029
Stirratt, M. J., Dunbar-Jacob, J., Crane, H. M., Simoni, J. M., Czajkowski, S., Hilliard, M. E., et al. (2015). Self-report measures of medication adherence behavior: recommendations on optimal use. Transl. Behav. Med. 5 (4), 470–482. doi:10.1007/s13142-015-0315-2
Tadesse, T., Demissie, M., Berhane, Y., Kebede, Y., and Abebe, M. (2013). Long distance travelling and financial burdens discourage tuberculosis DOTs treatment initiation and compliance in Ethiopia: a qualitative study. BMC Public Health 13 (1), 424. doi:10.1186/1471-2458-13-424
Van Den Boogaard, J., Msoka, E., Homfray, M., Kibiki, G. S., Heldens, JJHM, Felling, A. J. A., et al. (2012). An exploration of patient perceptions of adherence to tuberculosis treatment in Tanzania. Qual. Health Res. 22 (6), 835–845. doi:10.1177/1049732312438968
Vaughan, B., Burns, C., Burridge, L., Wigger, J., Blair, S., and Mulcahy, J. (2019). Patient satisfaction and perception of treatment in a student-led osteopathy teaching clinic: evaluating questionnaire dimensionality and internal structure, and outcomes. Int. J. Osteopath Med. 31, 21–27. doi:10.1016/j.ijosm.2019.01.002
Widjanarko, B., Gompelman, M., Dijkers, M., and van der Werf, M. J. (2009). Factors that influence treatment adherence of tuberculosis patients living in Java, Indonesia. Patient Prefer Adherence 3, 231–238. doi:10.2147/ppa.s6020
Woimo, T. T., Yimer, W. K., Bati, T., and Gesesew, H. A. (2017). The prevalence and factors associated for anti-tuberculosis treatment non-adherence among pulmonary tuberculosis patients in public health care facilities in South Ethiopia: a cross-sectional study. BMC Public Health 17 (1), 269–310. doi:10.1186/s12889-017-4188-9
World Health Organization (2003). Adherence to long-term therapies: evidence for action. Geneva: World Health Organization, 216.
Zhu, Q.-Q., Wang, J., Sam, N. B., Luo, J., Liu, J., and Pan, H.-F. (2022). Factors associated with non-adherence for prescribed treatment in 201 patients with multidrug-resistant and rifampicin-resistant tuberculosis in anhui province, China. Med. Sci. Monit. Int. Med. J. Exp. Clin. Res. 28, e935334. doi:10.12659/MSM.935334
Keywords: tuberculosis, non-adherence, questionnaire development, questionnaire validation, SEM-PLS, prediction
Citation: Rianto L, Agustina I, Alfian SD, Iskandarsyah A, Pradipta IS and Abdulah R (2024) Development and validation of a structured questionnaire for assessing risk factors of medication non-adherence among pulmonary tuberculosis patients in Indonesia. Front. Pharmacol. 14:1257353. doi: 10.3389/fphar.2023.1257353
Received: 12 July 2023; Accepted: 29 December 2023;
Published: 16 January 2024.
Edited by:
Ines Potočnjak, University Hospital Centre Sisters of Charity, CroatiaReviewed by:
Deepak Kumar Bandari, Charles University, CzechiaDyah Aryani Perwitasari, Ahmad Dahlan University, Indonesia
Copyright © 2024 Rianto, Agustina, Alfian, Iskandarsyah, Pradipta and Abdulah. This is an open-access article distributed under the terms of the Creative Commons Attribution License (CC BY). The use, distribution or reproduction in other forums is permitted, provided the original author(s) and the copyright owner(s) are credited and that the original publication in this journal is cited, in accordance with accepted academic practice. No use, distribution or reproduction is permitted which does not comply with these terms.
*Correspondence: Rizky Abdulah, r.abdulah@unpad.ac.id