Erratum: Remdesivir strongly binds to RNA-dependent RNA polymerase, membrane protein, and main protease of SARS-CoV-2: Indication from molecular modeling and simulations
 Faez Iqbal Khan
 Tongzhou Kang1†
 Dakun Lai
- 1School of Electronic Science and Engineering, University of Electronic Science and Technology of China, Chengdu, China
- 2Faculty of Medicine, International Ala-Too University, Bishkek, Kyrgyzstan
Development of new drugs is a time-taking and expensive process. Comprehensive efforts are being made globally toward the search of therapeutics against SARS-CoV-2. Several drugs such as remdesivir, favipiravir, ritonavir, and lopinavir have been included in the treatment regimen and shown effective results in several cases. Among the existing broad-spectrum antiviral drugs, remdesivir is found to be more effective against SARS-CoV-2. Remdesivir has broad-spectrum antiviral action against many single-stranded RNA viruses including pathogenic SARS-CoV and Middle East respiratory syndrome coronavirus (MERS-CoV). In this study, we proposed that remdesivir strongly binds to membrane protein (Mprotein), RNA-dependent RNA polymerase (RDRP), and main protease (Mprotease) of SARS-CoV-2. It might show antiviral activity by inhibiting more than one target. It has been found that remdesivir binds to Mprotease, Mprotein, and RDRP with −7.8, −7.4, and −7.1 kcal/mol, respectively. The structure dynamics study suggested that binding of remdesivir leads to unfolding of RDRP. It has been found that strong binding of remdesivir to Mprotein leads to decrease in structural deviations and gyrations. Additionally, the average solvent-accessible surface area of Mprotein decreases from 127.17 to 112.12 nm2, respectively. Furthermore, the eigenvalues and the trace of the covariance matrix were found to be low in case of Mprotease–remdesivir, Mprotein–remdesivir, and RDRP–remdesivir. Binding of remdesivir to Mprotease, Mprotein, and RDRP reduces the average motions in protein due to its strong binding. The MMPBSA calculations also suggested that remdesivir has strong binding affinity with Mprotein, Mprotease, and RDRP. The detailed analysis suggested that remdesivir has more than one target of SARS-CoV-2.
Introduction
The flare-up of a surprising sickness showing extreme pneumonia and respiratory distress arose in Wuhan, China, in December 2019. Coronavirus disease 2019 (COVID-19) is brought about by severe acute respiratory syndrome coronavirus 2 (SARS-CoV-2), earlier named a novel coronavirus (2019-nCOV), and is a positive single-stranded RNA virus that has a place in the family Coronaviridae. The disease has spread across the boundary, and on March 11, 2020, the World Health Organization pronounced COVID-19 as a pandemic (Ahmed et al., 2020). The virus initially attacks the respiratory system and would cause flu-like symptoms such as cough and fever and, in severe conditions, leads to difficulty in breathing (Zou et al., 2020). According to statistical data, mortality is high in elderly (above 60 years of age) and in individuals with comorbid conditions. Apart from severe acute respiratory distress syndrome and respiratory failure, coronavirus disease (COVID-19) also manifests as systemic inflammation, acute cardiac injury, leading to sepsis, heart failure, and multiple organ dysfunction in patients at high risk (Wang D. et al., 2020).
Coronaviruses (CoVs) are a group of enveloped viruses, containing a non-segmented, positive-sense RNA genome, and pathogenic in nature (Xu Z. et al., 2020). SARS-CoV-2, the causative agent of COVID-19, has a more pathogenic form with respect to the previously mentioned SARS-CoV (2002) and Middle East respiratory syndrome coronavirus (MERS-CoV, 2013). To develop novel helpful therapeutic agents against SARS-CoV-2, it is important to understand the pathogenesis and virulence of virus (Chen et al., 2020).
Coronaviruses are the largest group of viruses belonging to the Coronaviridae family of order Nidovirales. Coronaviridae consists of two subfamilies, Coronavirinae and Torovirinae, respectively. Coronavirinae is further classified into four groups, the alpha, beta, gamma, and delta coronaviruses (Fehr and Perlman, 2015). Out of four groups, alpha and beta coronaviruses infect mammals, gamma-CoVs infect avian species, whereas delta coronaviruses infect both mammals and aves. MERS-CoV, SARS-CoV, and SARS-CoV-2 belong to beta coronaviruses that are transmitted through zoonotic transmission and spread among humans via close contact. The person-to-person spread of SARS-CoV-2, calculated by the primary reproduction number (R0), is about 2.6, which clearly indicates that the infected cases grow at an exponential rate (Chen et al., 2020; Wu et al., 2020).
CoVs particles are small (65–125 nm in diameter) and have the largest single-stranded RNA that is ∼26–32 kilobase (kb) long (Shereen et al., 2020). The genomic sequence of SARS-CoV-2 has 80% similarity to the genome of SARS-CoV and MERS-CoV, and more than 90% similarities have been found for structural proteins and essential enzymes. These important sequence similarities indicate a common pathogenesis mechanism and thus similar therapeutic targeting (Lau and Peiris, 2005). Coronaviruses contain four main structural proteins. These are the spike (S), membrane (M), envelope (E), and nucleocapsid (N) proteins. All structural proteins are encoded within the 3 end of the viral genome and share high sequence similarities to the sequence of the corresponding protein of MERS-CoV and SARS-CoV. SARS-CoV-2 spike (S) protein is essential for binding to the host cell-surface receptor for entry into the host cell (Delmas and Laude, 1990; Lau and Peiris, 2005; Beniac et al., 2006).
The spike protein has two subunits S1 and S2. The S1 subunit contains the receptor-binding domain (RBD) that binds to the angiotensin-converting enzyme 2 (ACE2) receptor located on the surface of the host cell, followed by the fusion of the S2 subunit to the cell membrane. SARS-CoV and SARS-CoV-2 use the ACE2 receptor, whereas MERS-CoV uses the dipeptidyl peptidase 4 receptor to bind with viral spike (S) protein (Zhang et al., 2020). SARS-CoV, MARS-CoV, and newly detected SARS-CoV-2 infection would cause severe respiratory symptoms and lead to death in comorbid conditions. The SARS-CoV genome shows high adaptive mutation and makes it more pathogenic and difficult for drug and vaccine inventions (Xu J. et al., 2020).
Among the existing broad-spectrum antiviral drugs, remdesivir is found to be more effective against SARS-CoV-2 and seems to have a more promising future. Remdesivir is a prodrug, unlike other nucleoside analogs, with broad-spectrum antiviral activity against many single-stranded RNA viruses including pathogenic SARS-CoV and Middle East respiratory syndrome coronavirus (MERS-CoV) (Wang M. et al., 2020).
Remdesivir is a metabolically active form (GS-441524) that works by inhibiting viral RNA-dependent RNA polymerase (RDRP) while evading proofreading by viral exoribonuclease, which leads to premature termination of viral RNA transcription and hence inhibits the spread of the virus as well as the production of viral RNA (Wang M. et al., 2020). In this study, we proposed that remdesivir possibly binds to more than one target of SARS-CoV-2. We showed possible binding and inhibitory mechanisms of remdesivir on the C-terminal domain of SARS-CoV-2 nucleocapsid protein (CTD), envelope protein (Eprotein), main protease (Mprotease), membrane protein (Mprotein), N-terminal domain of nucleocapsid phosphoprotein (NTD), RDRP, and spike protein (Sprotein) using several computational approaches. It shows strong inhibitory effects on Mprotein, RDRP, and Mprotease of SARS-CoV-2.
Materials and Methods
3D Structure Modeling
The crystal structures of CTD nucleocapsid (PDB: 7c22), Mprotease (PDB: 7k40), NTD nucleocapsid (PDB: 7acs), RDRP (PDB: 6m71), and Sprotein (PDB: 6vsb) were obtained from the PDB (https://www.rcsb.org/), and the structure of remdesivir was obtained from PubChem (CID 121304016). Because the crystal structures of Eprotein and Mprotein are not solved yet and published in the PDB, I-Tasser which is a graded protocol for the prediction of structure and function of the protein was used to predict the structure of these two proteins (Roy et al., 2010). The missing residues from the crystal structure were modeled using MODELLER software (Webb and Sali, 2016). The comprehensive procedures are mentioned in previous communication (Khan et al., 2015; Khan et al., 2016; Khan et al., 2017). Discovery Studio and PyMOL were used for visualizing and drawing structures.
Docking Studies
The molecular docking of remdesivir with CTD, Eprotein, Mprotease, Mprotein, NTD, RDRP, and Sprotein was performed using AutoDock Vina (Trott and Olson, 2010). Each of the proteins was individually prepared for docking using standard protocols (Khan et al., 2020a; Khan et al., 2020b; Khan et al., 2021). The finest poses of each complex were selected on the foundation of binding energy as well as proper orientation of remdesivir into the active pockets of target proteins (Schmidt et al., 2018).
MD Simulations
Several 100 ns MD simulations were executed on CTD, CTD–remdesivir, Eprotein, Eprotein–remdesivir, Mprotease, Mprotease–remdesivir, Mprotein, Mprotein–remdesivir, NTD, NTD–remdesivir, RDRP, RDRP–remdesivir, Sprotein, and Sprotein–remdesivir by GROMACS 2018.2 (Van Der Spoel et al., 2005; Naz et al., 2018; Ali et al., 2019; Beg et al., 2019; Gulzar et al., 2019b; Mohammad et al., 2019). The PRODRG server (Schuttelkopf and van Aalten, 2004) was used to obtain the parameters and topology files for the remdesivir molecule using a standard protocol (Camilloni et al., 2008; Carr et al., 2013; Syed et al., 2018a). Similarly, a reasonable quantity of Na+ and Cl− ions was added to preserve neutrality of the system. The final production stage of 100 ns was achieved at 298 K. The comprehensive MD simulation methodology is mentioned in previous communications (Syed et al., 2018a; Gulzar et al., 2019a; Furkan et al., 2019; Qausain et al., 2020).
Essential Dynamics
Principal component analysis (PCA) or essential dynamics (ED) was calculated for each simulated system of CTD, CTD–remdesivir, Eprotein, Eprotein–remdesivir, Mprotease, Mprotease–remdesivir, Mprotein, Mprotein–remdesivir, NTD, NTD–remdesivir, RDRP, RDRP–remdesivir, Sprotein, and Sprotein–remdesivir. It is calculated by the diagonalization of the covariance matrix C, with the elements, explained as follows:
Here, ri represents the Cartesian coordinate of the ith Cα atom, N represents the number of Cα atoms, and <ri> signifies the time average over all the configurations (Khan et al., 2020b; Durrani et al., 2020; Hassan et al., 2020).
Gibbs Free Energy Landscape
The GFE landscape offers conformational variations in proteins (Khan et al., 2016; Syed et al., 2018b; Gupta et al., 2020a; Gupta et al., 2020b). To get 2D and 3D depiction, the GFE landscapes were projected onto PC1 and PC2 for CTD, CTD–remdesivir, Eprotein, Eprotein–remdesivir, Mprotease, Mprotease–remdesivir, Mprotein, Mprotein–remdesivir, NTD, NTD–remdesivir, RDRP, RDRP–remdesivir, Sprotein, and Sprotein–remdesivir during 100 ns MD simulations. It is mentioned as follows:
Here, kB represents the Boltzmann constant, T represents the temperature, and P(PC1, PC2) represents the normalized joint probability distribution.
Results and Discussion
The SARS-CoV-2 genome is made of 29,891 nucleotides with 9,860 amino acids (Chan et al., 2020), packaged in a circular nucleocapsid protein and encapsulated by envelope proteins (Li, 2016). All proteins included in this study, namely, CTD, Eprotein, Mprotease, Mprotein, NTD, RDRP, and Sprotein, play significant roles and hence are promising therapeutic targets to control COVID-19 (Satarker and Nampoothiri, 2020). Previously, it has been mentioned in the literature that remdesivir inhibits viral RDRP protein, but some literature suggested that it inhibits more than one targeted protein of SARS-CoV-2 (Nguyen et al., 2020). In the present in silico study, we focussed on the inhibitory mechanism of remdesivir on several SARS-CoV-2 targets.
Interaction of Remdesivir With SARS-CoV-2 Proteins
The proper orientation of remdesivir in the active pockets of CTD, Eprotein, Mprotease, Mprotein, NTD, RDRP, and Sprotein has been monitored, and active site residues were targeted. Remdesivir binds with CTD, Eprotein, Mprotease, Mprotein, NTD, RDRP, and Sprotein with −4.8, −4.2, −7.8, −7.4, −6.2, −7.1, and −5.8 kcal/mol, respectively (Figure 1). It shows several electrostatic and van der Waals interactions as listed in Table 1. Remdesivir shows weak van der Waals interactions with CTD and Eprotein. It shows strong binding affinity with Mprotease, Mprotein, and RDRP. The important residues that interacted with inhibitor N3 in Mprotease are Thr24, Thr25, Thr26, His41, Met49, Phe140, Leu141, Asn142, Gly143, Ser144, Cys145, His163, His164, Met165, Glu166, Pro168, His172, Asp187, Gln189, Thr190, Ala191, and Gln192 (Jin et al., 2020). We found that remdesivir binds in the same pocket and shows interactions with residues His41, Met49, Tyr54, Phe140, Asn142, Ser144, Cys145, His163, His164, Met165, Glu166, Leu167, Pro168, His172, Asp187, Arg188, Gln189, Thr190, Ala191, and Gln192.
FIGURE 1
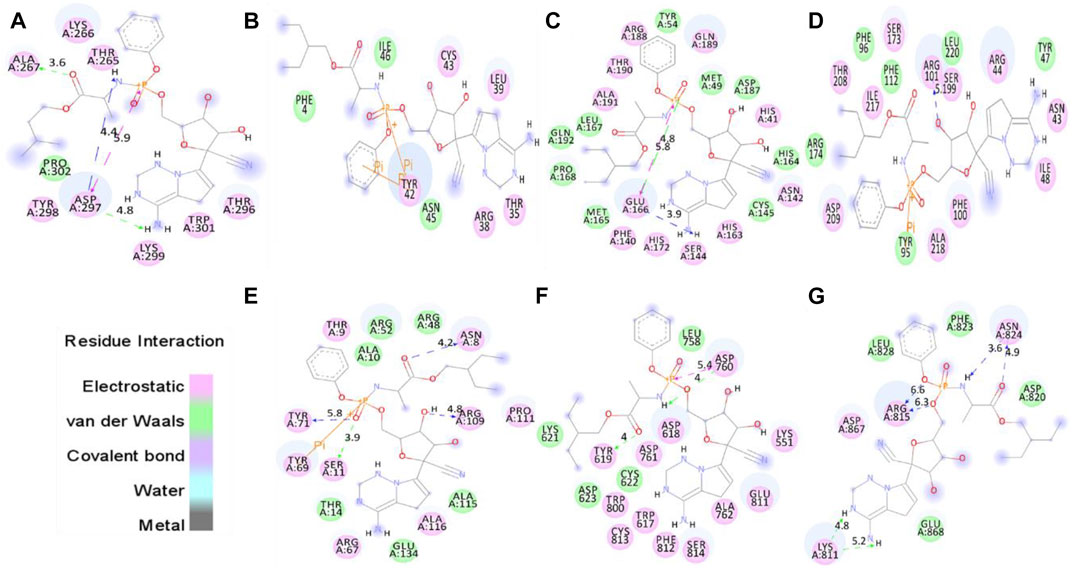
FIGURE 1. Molecular docking of remdesivir into the active pocket of CTD, Eprotein, Mprotease, Mprotein, NTD, RDRP, and Sprotein, respectively. The structure indicated different residual interactions in (A) CTD–remdesivir, (B) Eprotein–remdesivir, (C) Mprotease–remdesivir, (D) Mprotein–remdesivir, (E) NTD–remdesivir, (F) RDRP–remdesivir, and (G) Sprotein–remdesivir, respectively. The electrostatic, van der Waals, and covalent bonds are represented in pink, green, and purple colors, respectively.
TABLE 1
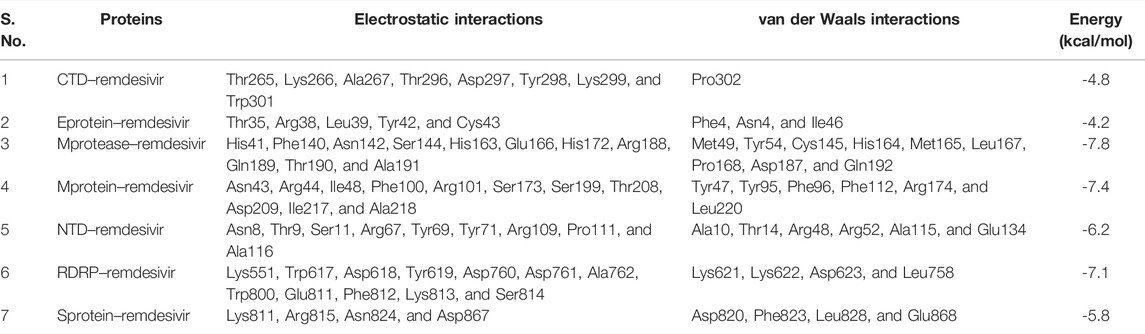
TABLE 1. Molecular docking of remdesivir with CTD, Eprotein, Mprotease, Mprotein, NTD, RDRP, and Sprotein, respectively.
It has been reported that the targeting of active sites of RDRP such as Asp760 and Asp761 by antiviral drugs could be a potential therapeutic option for inhibition of viral replication (Aftab et al., 2020). Galidesivir, a potential inhibitor of SARS-CoV-2, which binds strongly to the active site of RDRP shows interactions with residues Asp760, Asp761, Gly616, Trp617, Asp618, Tyr619, Pro620, Lys621, Cys622, Leu758, Ser759, Ala762, Ala797, Lys798, Cys799, Trp800, His810, Glu811, Phe812, Cys813, Ser814, and Gln815 (Aftab et al., 2020). We found that remdesivir binds strongly in the same active pocket and interacts with residues Lys551, Trp617, Asp618, Tyr619, Lys621, Lys622, Asp623, Leu758, Asp760, Asp761, Ala762, Trp800, Glu811, Phe812, Lys813, and Ser814. In case of Mprotein, the predicted active site residues are Ile48, Trp92, Tyr95, Phe96, Ile97, Ser99, Phe100, and Ala104 (Zhang et al., 2017). Remdesivir binds to one of the pockets of Mprotein and interacts with residues Asn43, Arg44, Tyr47, Ile48, Tyr95, Phe96, Phe100, Arg101, Phe112, Ser173, Arg174, Ser199, Thr208, Asp209, Ile217, Ala218, and Leu220. The protein–drug complexes were further analyzed for several 100 ns MD simulations.
Structural Dynamics of CTD
In order to explore the structural dynamics of CTD, CTD–remdesivir, Eprotein, Eprotein–remdesivir, Mprotease, Mprotease–remdesivir, Mprotein, Mprotein–remdesivir, NTD, NTD–remdesivir, RDRP, RDRP–remdesivir, Sprotein, and Sprotein–remdesivir, the root mean square deviation (RMSD), the root mean square fluctuation (RMSF), and the radius of gyration (Rg) were analyzed (Kuzmanic and Zagrovic, 2010). The average RMSD values of CTD and CTD–remdesivir were found to be 0.60 and 0.69 nm, respectively. Additionally, remdesivir was found to have constant fluctuations in the active pocket of CTD (Figure 2A). It has been found that RMSD values slightly increase upon binding of remdesivir. There was a rise in residual and atomic fluctuations of CTD also reported due to binding of remdesivir (Figures 2B,C). The average Rg values for CTD and CTD–remdesivir were found to be 1.33 and 1.29 nm, respectively (Figure 2D). It was found that CTD–remdesivir has more tight packing than CTD alone due to binding of remdesivir. The results from above analysis clearly state that binding of remdesivir in the active pocket of CTD slightly changes the structure dynamics of protein.
FIGURE 2
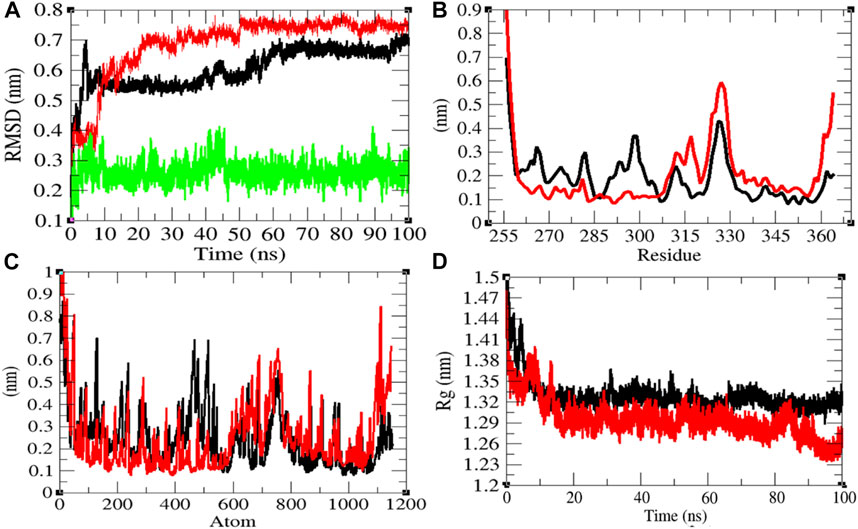
FIGURE 2. Structural dynamics of CTD. (A) Root mean square deviation plot for CTD (black), CTD–remdesivir (red), and remdesivir (green) as a function of time. (B) Root mean square fluctuations vs. residues. (C) Root mean square fluctuations vs. atoms. (D) Radius of the gyration (Rg) plot.
The solvent-accessible surface area (SASA) is explained as the surface area of a protein which forms networks with its solvent molecules (Mazola et al., 2015). The average SASA values with respect to protein for CTD and CTD–remdesivir were found to be 61.46 and 56.69 nm2, respectively. The SASA plot suggested that internal residues in CTD are not exposed to solvent when remdesivir binds to it. Furthermore, the free energy of solvation for CTD and CTD–remdesivir was found to be 145.89 and 126.21 kJ/mol/nm2, respectively.
The purpose of secondary structure is to spot the structural features of proteins. The secondary structure assignments in CTD and CTD–remdesivir such as the β-sheet, α-helix, and turn were split into separate residues in each period. The average number of residues that participated in secondary structure formation of CTD and CTD–remdesivir was compared (Table 2). It was found that the total average residues that contributed to structure development in case of CTD and CTD–remdesivir were found to be 42 and 49%, respectively. It has been found that CTD is not inhibited or unfolded upon binding of remdesivir. In other words, remdesivir did not show inhibitory effects on CTD. It was also found that the volume of CTD and CTD–remdesivir was 23.07 and 21.65 nm3, respectively. The average density of CTD and CTD–remdesivir was found to be 890.60 and 949.17 g/L, respectively (Supplementary Figure S1).
TABLE 2
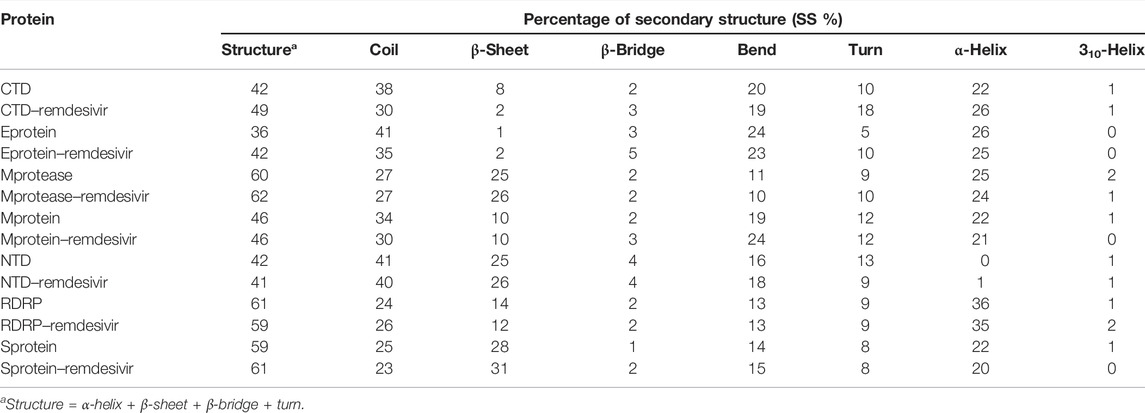
TABLE 2. Percentage of residues in CTD, CTD–remdesivir, Eprotein, Eprotein–remdesivir, Mprotease, Mprotease–remdesivir, Mprotein, Mprotein–remdesivir, NTD, NTD–remdesivir, RDRP, RDRP–remdesivir, Sprotein, and Sprotein–remdesivir, which participated in average structure formation during MD simulations.
Structural Dynamics of Eprotein
The average RMSD values of Eprotein and Eprotein–remdesivir were found to be 0.50 and 0.49 nm, respectively. Remdesivir was found to have random fluctuations in the active pocket of Eprotein (Figure 3A). It has been found that average RMSD values were almost the same upon binding of remdesivir. There were some residual and atomic fluctuations reported due to binding of remdesivir (Figures 3B,C). The average Rg values for Eprotein and Eprotein–remdesivir were found to be 1.09 and 1.07 nm, respectively (Figure 3D). It was found that Eprotein–remdesivir has more tight packing than Eprotein alone due to binding of remdesivir.
FIGURE 3
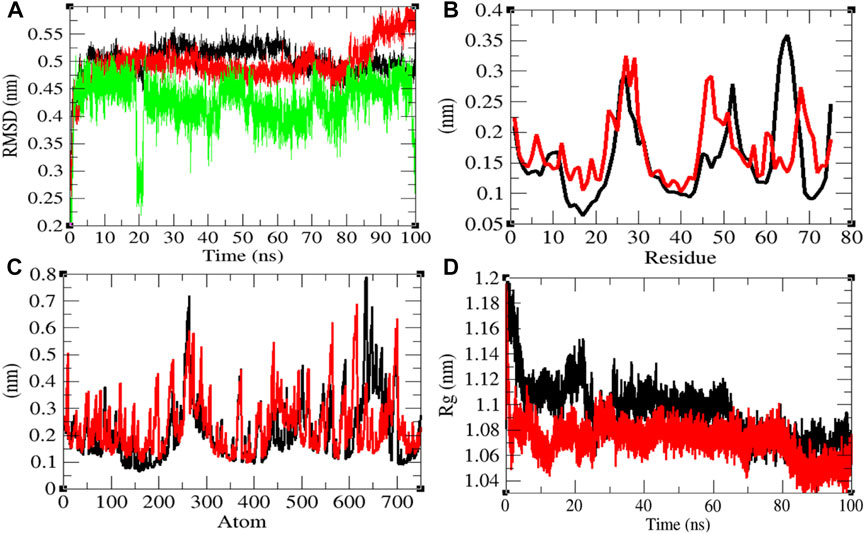
FIGURE 3. Structural dynamics of Eprotein. (A) Root mean square deviation plot for Eprotein (black), Eprotein–remdesivir (red), and remdesivir (green) as a function of time. (B) Root mean square fluctuations vs. residues. (C) Root mean square fluctuations vs. atoms. (D) Radius of the gyration (Rg) plot.
The average SASA values with respect to protein for Eprotein and Eprotein–remdesivir were found to be 41.37 and 39.98 nm2, respectively. The SASA plot suggested that internal residues in Eprotein are not exposed to solvent when remdesivir binds to it. Furthermore, the free energy of solvation for Eprotein and Eprotein–remdesivir was found to be 134.93 and 119.30 kJ/mol/nm2, respectively. It was found that the total average residues that contributed to structure development in case of Eprotein and Eprotein–remdesivir were found to be 36 and 42%, respectively. It has been found that Eprotein is not inhibited or unfolded upon binding of remdesivir. In other words, remdesivir did not show inhibitory effects on Eprotein. It was also found that the volume of Eprotein and Eprotein–remdesivir was 15.11 and 15.13 nm3, respectively. The average density of Eprotein and Eprotein–remdesivir was found to be 919.62 and 918.27 g/L, respectively (Supplementary Figure S2). The volume and the density remain the same in both the cases.
Structural Dynamics of Mprotease
Mprotease plays a key role in coordinating viral replication and transcription of the virus life cycle. It cleaves the major part of polyproteins and releases proteins that have replicative function. Therefore, Mprotease is a prime target of drugs for SARS-CoV-2 (Liu et al., 2020; Naik et al., 2020). The average RMSD values of Mprotease and Mprotease–remdesivir were found to be 0.32 and 0.33 nm, respectively. Remdesivir was found to have constant fluctuations in the active pocket of Mprotease (Figure 4A). It has been found that average RMSD values were the same upon binding of remdesivir. There were least residual and atomic fluctuations reported due to binding of remdesivir (Figures 4B,C). The average Rg values for Mprotease and Mprotease–remdesivir were found to be 2.07 and 2.10 nm, respectively (Figure 4D). It was found that Mprotease–remdesivir has more loose packing than Mprotease due to binding of remdesivir. This might be due to unfolding of Mprotease.
FIGURE 4
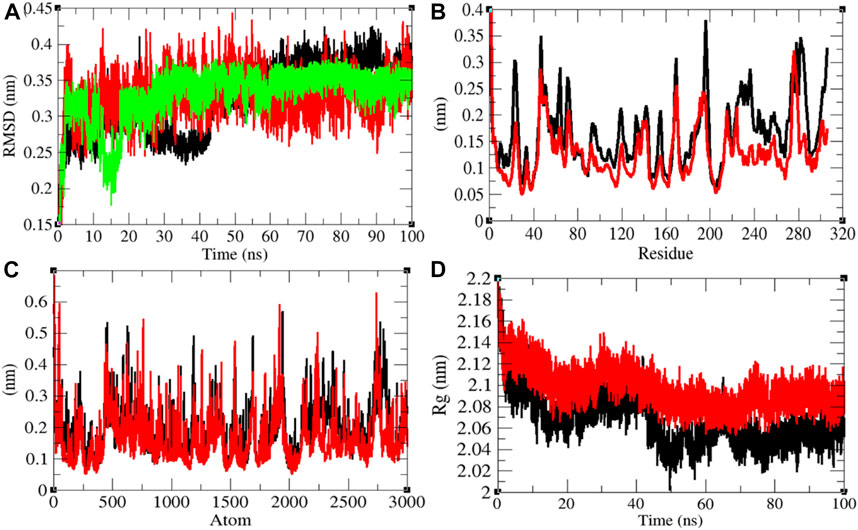
FIGURE 4. Structural dynamics of Mprotease. (A) Root mean square deviation plot for Mprotease (black), Mprotease–remdesivir (red), and remdesivir (green) as a function of time. (B) Root mean square fluctuations vs. residues. (C) Root mean square fluctuations vs. atoms. (D) Radius of the gyration (Rg) plot.
The average SASA values with respect to protein for Mprotease and Mprotease–remdesivir were found to be 155.43 and 156.34 nm2, respectively. The SASA plot suggested that internal residues in Mprotease are not much exposed to solvent when remdesivir binds to it. Furthermore, the free energy of solvation for Mprotease and Mprotease–remdesivir was found to be 207.35 and 213.14 kJ/mol/nm2, respectively. It was found that the total average residues that contributed to structure development in case of Mprotease and Mprotease–remdesivir were found to be 60 and 62%, respectively. It has been found that remdesivir has less impact on structural unfolding of Mprotease. It was also found that the volume of Mprotease and Mprotease–remdesivir was 54.98 and 55.10 nm3, respectively. The average density of Mprotease and Mprotease–remdesivir was found to be 1,020.79 g/L and 1,018.49 g/L, respectively (Supplementary Figure S3).
Structural Dynamics of Mprotein
The average RMSD values of Mprotein and Mprotein–remdesivir were found to be 0.56 and 0.47 nm, respectively. Remdesivir showed constant fluctuations in the active pocket of Mprotein (Figure 5A). It has been found that average RMSD values were less upon binding of remdesivir. This indicates that remdesivir binds tightly with Mprotein and possibly inhibits it. The residual and atomic fluctuations were also less due to binding of remdesivir (Figures 5B,C). The average Rg values for Mprotein and Mprotein–remdesivir were found to be 1.63 and 1.58 nm, respectively (Figure 5D). It was found that Mprotein–remdesivir has more tight packing than Mprotein alone. This might be due to strong binding of remdesivir with Mprotein.
FIGURE 5
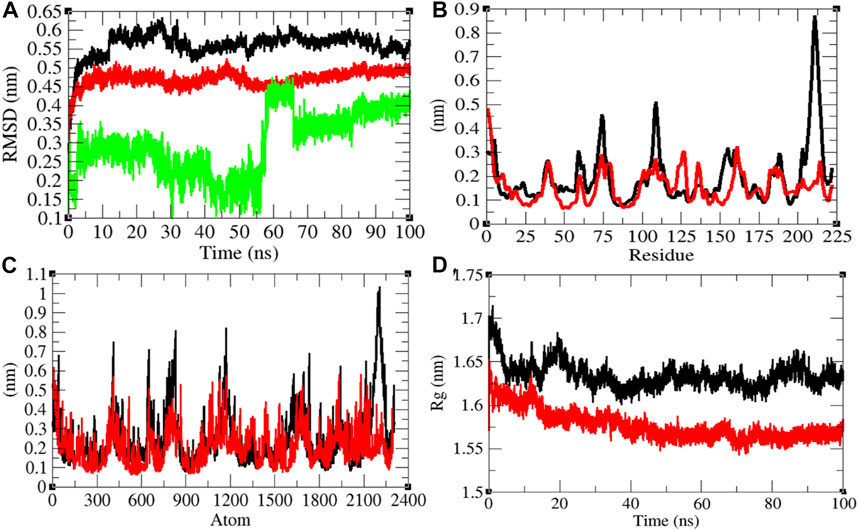
FIGURE 5. Structural dynamics of Mprotein. (A) Root mean square deviation plot for Mprotein (black), Mprotein–remdesivir (red), and remdesivir (green) as a function of time. (B) Root mean square fluctuations vs. residues. (C) Root mean square fluctuations vs. atoms. (D) Radius of the gyration (Rg) plot.
The average SASA values with respect to protein for Mprotein and Mprotein–remdesivir were found to be 127.17 and 112.12 nm2, respectively. The SASA plot suggested that internal residues in Mprotein are not exposed to solvent when remdesivir binds to it. Furthermore, the free energy of solvation for Mprotein and Mprotein–remdesivir was found to be 237.24 and 205.11 kJ/mol/nm2, respectively. It was found that the total average residues that contributed to structure development in case of Mprotein and Mprotein–remdesivir were found to be the same (46%). It was also found that the volume of Mprotein and Mprotein–remdesivir was 45.70 and 42.34 nm3, respectively. The average density of Mprotein and Mprotein–remdesivir was found to be 914.05 and 986.80 g/L, respectively (Supplementary Figure S4).
The role of Mprotein of SARS-CoV-2 during host infection is not clearly understood. It was found that Mprotein binds with nucleocapsid protein and promotes completion of viral assembly by stabilizing the nucleocapsid protein and RNA complex (Astuti and Ysrafil, 2020). Thomas (2020) predicted that Mprotein of SARS-CoV-2 is structurally similar to SemiSWEET sugar transport proteins of prokaryotes (Thomas, 2020). He hypothesized that the SemiSWEET sugar transporter–like structure of Mprotein influences glycosylation of Sprotein. The SemiSWEET sugar transporter–like structure of Mprotein may be involved in multiple functions that may aid in the rapid proliferation, replication, and immune evasion of the SARS-CoV-2 virus.
Structural Dynamics of NTD
The average RMSD values of NTD and NTD–remdesivir were found to be 0.50 and 0.64 nm, respectively. Additionally, remdesivir showed random fluctuations in the active pocket of NTD (Figure 6A). It has been found that average RMSD values were more upon binding of remdesivir. This indicates that the random fluctuations increased upon remdesivir binding to NTD. There was minor increase in residual and atomic fluctuations too (Figures 6B,C). The average Rg values for NTD and NTD–remdesivir were found to be 1.49 and 1.47 nm, respectively (Figure 6D). It was found that NTD–remdesivir has slightly more tight packing than NTD alone.
FIGURE 6
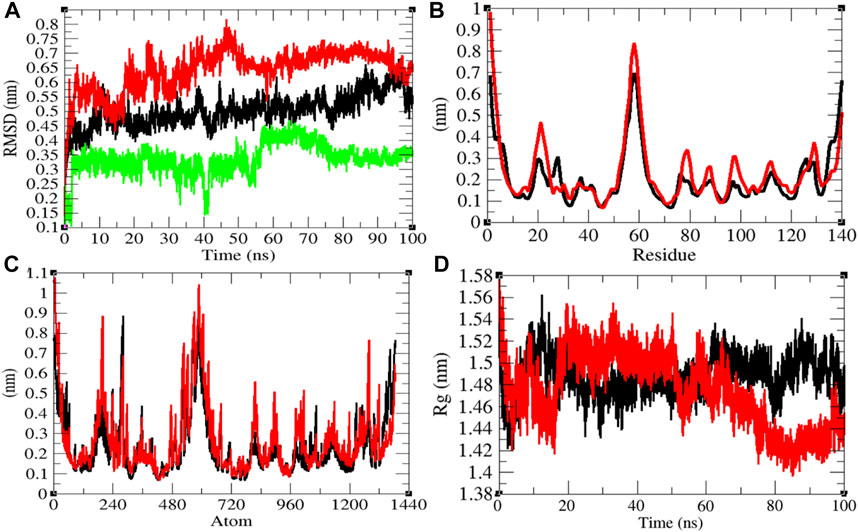
FIGURE 6. Structural dynamics of NTD. (A) Root mean square deviation plot for NTD (black), NTD–remdesivir (red), and remdesivir (green) as a function of time. (B) Root mean square fluctuations vs. residues. (C) Root mean square fluctuations vs. atoms. (D) Radius of the gyration (Rg) plot.
The average SASA values with respect to protein for NTD and NTD–remdesivir were found to be 74.51 and 75.73 nm2, respectively. The SASA plot suggested that internal residues in NTD are slightly exposed to solvent when remdesivir binds to it. Furthermore, the free energy of solvation for NTD and NTD–remdesivir was found to be 147.53 and 158.73 kJ/mol/nm2, respectively. The free energy of solvation for NTD–remdesivir was found to be higher than that of NTD. It was found that the total average residues that contributed to structure development in case of NTD and NTD–remdesivir were found to be 42 and 41%, respectively. It has been found that binding of remdesivir has minor effects on NTD. It was also found that the volume of NTD and NTD–remdesivir was 26.43 and 26.51 nm3, respectively. The average density of NTD and NTD–remdesivir was found to be 950.06 and 947.03 g/L, respectively. The volume and density of NTD remain almost the same in both the cases. There was no major impact of remdesivir on the structural volume of NTD during the course of simulations (Supplementary Figure S5).
Structural Dynamics of RNA-Dependent RNA Polymerase
It has been reported that remdesivir inhibits RDRP and shows antiviral activity against multiple variants of the Ebola virus (Warren et al., 2016). In vitro experiments showed that remdesivir is effective against SARS-CoV and MERS-CoV by interfering with the polymerase function of RDRP (Agostini et al., 2018). It is also expected that remdesivir inhibits RDRP of SARS-CoV-2. The average RMSD values of RDRP and RDRP–remdesivir were found to be 0.68 and 0.67 nm, respectively. Additionally, remdesivir was stable in the active pocket of RDRP (Figure 7A). It has been found that the structure of RDRP was not deviated upon binding of remdesivir. The residual and atomic fluctuations were also less (Figures 7B,C). The average Rg values for RDRP and RDRP–remdesivir were found to be 3.06 and 3.05 nm, respectively (Figure 7D). It was found that RDRP–remdesivir has similar structural packing to RDRP alone.
FIGURE 7
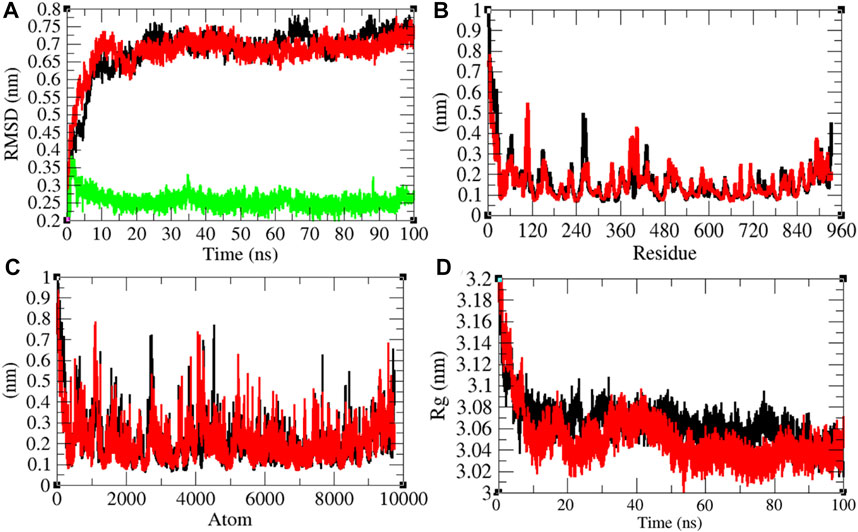
FIGURE 7. Structural dynamics of RDRP. (A) Root mean square deviation plot for RDRP (black), RDRP–remdesivir (red), and remdesivir (green) as a function of time. (B) Root mean square fluctuations vs. residues. (C) Root mean square fluctuations vs. atoms. (D) Radius of the gyration (Rg) plot.
The average SASA values with respect to protein for RDRP and RDRP–remdesivir were found to be 461.72 and 466.09 nm2, respectively. The SASA plot suggested that internal residues in RDRP are exposed to solvent when remdesivir binds to it. Furthermore, the free energy of solvation for RDRP and RDRP–remdesivir was found to be 479.17 and 517.78 kJ/mol/nm2, respectively. It was found that the total average residues that contributed to structure development in case of RDRP and RDRP–remdesivir were found to be 61 and 59%, respectively. It has been found that RDRP is slightly unfolded upon binding of remdesivir. It was also found that the volume of RDRP and RDRP–remdesivir was 169.68 and 169.68 nm3, respectively. The average density of RDRP and RDRP–remdesivir was found to be 1,043.81 and 1,043.83 g/L, respectively (Supplementary Figure S6).
Structural Dynamics of Sprotein
The average RMSD values of Sprotein and Sprotein–remdesivir were found to be 1.90 and 2.29 nm, respectively. Remdesivir maintained stable conformation in the active pocket of Sprotein from 25 to 100 ns MD simulations (Figure 8A). It has been found that the structure of Sprotein was largely deviated upon binding of remdesivir. This indicates that binding of remdesivir deviated the structure conformation of Sprotein. The residual and atomic fluctuations were also reported due to binding of remdesivir (Figures 8B,C). The average Rg values for Sprotein and Sprotein–remdesivir were found to be 4.18 and 3.93 nm, respectively (Figure 8D). It was found that Sprotein–remdesivir has more tight packing than Sprotein alone. This might be due to strong binding of remdesivir with Sprotein.
FIGURE 8
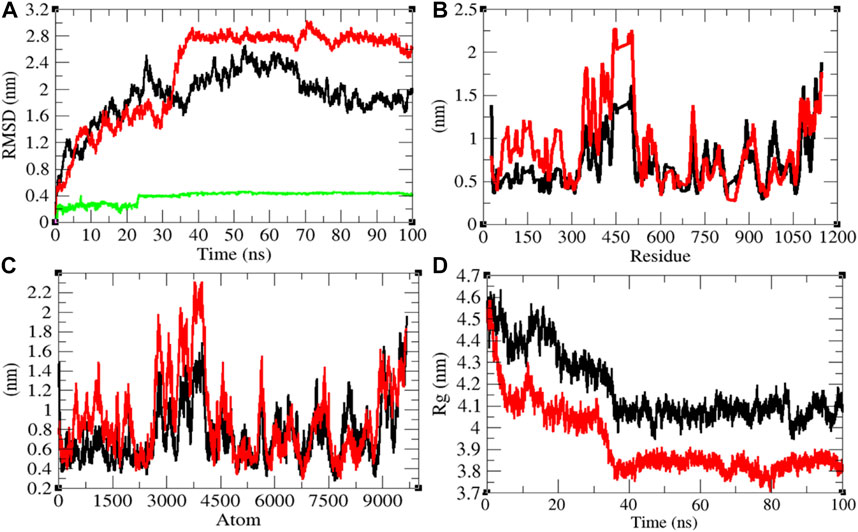
FIGURE 8. Structural dynamics of Sprotein. (A) Root mean square deviation plot for Sprotein (black), Sprotein–remdesivir (red), and remdesivir (green) as a function of time. (B) Root mean square fluctuations vs. residues. (C) Root mean square fluctuations vs. atoms. (D) Radius of the gyration (Rg) plot.
The average SASA values with respect to protein for Sprotein and Sprotein–remdesivir were found to be 513.80 and 473.77 nm2, respectively. The SASA plot suggested that internal residues in Sprotein are not exposed to solvent when remdesivir binds to it. Furthermore, the free energy of solvation for Sprotein and Sprotein–remdesivir was found to be 829.97 and 656.94 kJ/mol/nm2, respectively. It was found that the total average residues that contributed to structure development in case of Sprotein and Sprotein–remdesivir were found to be 59 and 61%, respectively. It has been found that Sprotein is not unfolded upon binding of remdesivir. It was also found that the volume of Sprotein and Sprotein–remdesivir was 186.77 and 174.05 nm3, respectively. The average density of Sprotein and Sprotein–remdesivir was found to be 944.20 and 1,013.23 g/L, respectively (Supplementary Figure S7).
Hydrogen Bonding
The hydrogen bond is a significant factor in stabilizing protein conformations. To check the hydrogen bond formations between remdesivir and SARS-CoV-2 proteins such as CTD, Eprotein, Mprotease, Mprotein, NTD, RDRP, and Sprotein, the hydrogen bonds paired within 0.35 nm were estimated during the 100 ns MD simulations. The average number of hydrogen bonds between remdesivir and CTD, Eprotein, Mprotease, Mprotein, NTD, RDRP, and Sprotein was found to be 3, 2, 5, 4, 11, 8, and 5, respectively (Figure 9). The maximum number of hydrogen bonds was found between remdesivir and NTD. RDRP, Sprotein, and Mprotease also showed extensive hydrogen bonding with remdesivir. Weak interactions were reported in case of CTD, Eprotein, and Mprotein.
FIGURE 9
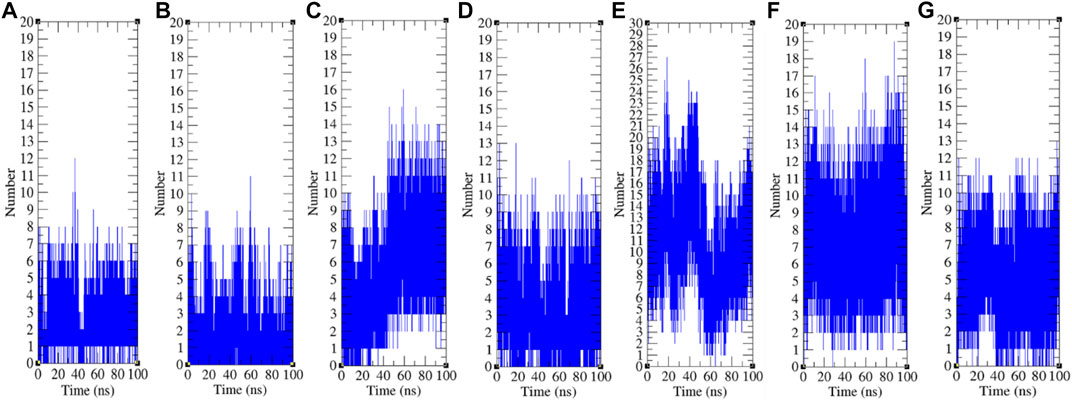
FIGURE 9. Hydrogen bond analysis. Hydrogen bonds between remdesivir and (A) CTD, (B) Eprotein, (C) Mprotease, (D) Mprotein, (E) NTD, (F) RDRP, and (G) Sprotein, respectively.
Principal Component Analysis
The PCA or ED shows an overall expansion of CTD, Eprotein, Mprotease, Mprotein, NTD, RDRP, and Sprotein during MD simulation. It categorizes average atomic motions of CTD, Eprotein, Mprotease, Mprotein, NTD, RDRP, and Sprotein. The entirety of the eigenvalues is a degree of the global mobility in the system to relate the elasticity of a protein. The trace of the covariance matrix and eigenvalues were found to be 192.95, 257.40, 84.53, 95.33, 383.19, 233.40, 450.76, 250.48, 331.98, 440.60, 1,387.72, 1,235.44, 21,461.90, and 33,703.80 nm2, for CTD, CTD–remdesivir, Eprotein, Eprotein–remdesivir, Mprotease, Mprotease–remdesivir, Mprotein, Mprotein–remdesivir, NTD, NTD–remdesivir, RDRP, RDRP–remdesivir, Sprotein, and Sprotein–remdesivir, respectively. The trace of the covariance matrix and eigenvalues were found to be more in case of CTD–remdesivir, Eprotein–remdesivir, NTD–remdesivir, and Sprotein–remdesivir than CTD, Eprotein, NTD, and Sprotein, respectively. The higher eigenvalues and the trace of the covariance matrix of CTD–remdesivir, Eprotein–remdesivir, NTD–remdesivir, and Sprotein–remdesivir advise that the average casual fluctuations are more upon binding of remdesivir with CTD, Eprotein, NTD, and Sprotein, respectively. The trace of the covariance matrix and eigenvalues were found to be low in case of Mprotease–remdesivir, Mprotein–remdesivir, and RDRP–remdesivir than Mprotease, Mprotein, and RDRP, respectively. Binding of remdesivir to Mprotease, Mprotein, and RDRP reduces the average motion in protein. This might be due to strong binding of remdesivir. The comprehensive multi-dimensional covariance matrix for individual atom pair covariance and the predictions of trajectories on eigenvectors are described in Figure 10.
FIGURE 10
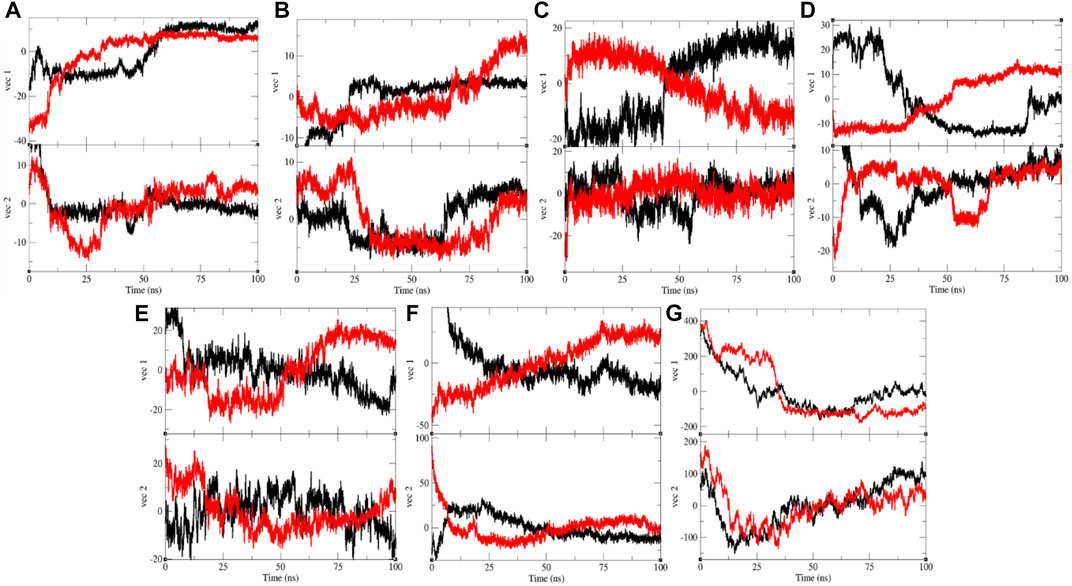
FIGURE 10. Projection of eigenvectors and components. Projections of trajectories on eigenvectors for (A) CTD (black) and CTD–remdesivir (red), (B) Eprotein (black) and Eprotein–remdesivir (red), (C) Mprotease (black) and Mprotease–remdesivir (red), (D) Mprotein (black) and Mprotein–remdesivir (red), (E) NTD (black) and NTD–remdesivir (red), (F) RDRP (black) and RDRP–remdesivir (red), and (G) Sprotein (black) and Sprotein–remdesivir (red), respectively.
Gibbs Free Energy Landscape
The color-coded energy landscape displayed varied forms for CTD, CTD–remdesivir, Eprotein, Eprotein–remdesivir, Mprotease, Mprotease–remdesivir, Mprotein, Mprotein–remdesivir, NTD, NTD–remdesivir, RDRP, RDRP–remdesivir, Sprotein, and Sprotein–remdesivir, respectively (Figure 11). Each atom pair covariance shows dissimilar outlines in each case. The conforming energy contour records with profound blue gloom signify the lower energy position. Additional blue zones designate transitions in the protein conformation trailed by thermodynamically more favorable regions. The free energy state in the global free energy minimum region of CTD, CTD–remdesivir, Eprotein, Eprotein–remdesivir, Mprotease, Mprotease–remdesivir, Mprotein, Mprotein–remdesivir, NTD, NTD–remdesivir, RDRP, RDRP–remdesivir, Sprotein, and Sprotein–remdesivir is different in each case. A comparison between the full views of the Gibbs free energy values of CTD, CTD–remdesivir, Eprotein, Eprotein–remdesivir, Mprotease, Mprotease–remdesivir, Mprotein, Mprotein–remdesivir, NTD, NTD–remdesivir, RDRP, RDRP–remdesivir, Sprotein, and Sprotein–remdesivir suggested that these systems have different outlines of global minima. There are more changes in the global minima patterns in case of Mprotease, Mprotein, and RDRP when remdesivir binds to them. In case of Mprotease and RDRP, the global minima changed from single minima to dark blue color when remdesivir bound to them. In case of Mprotein, there was single deep blue well, and it shifted to three global minima in case of Mprotein–remdesivir.
FIGURE 11
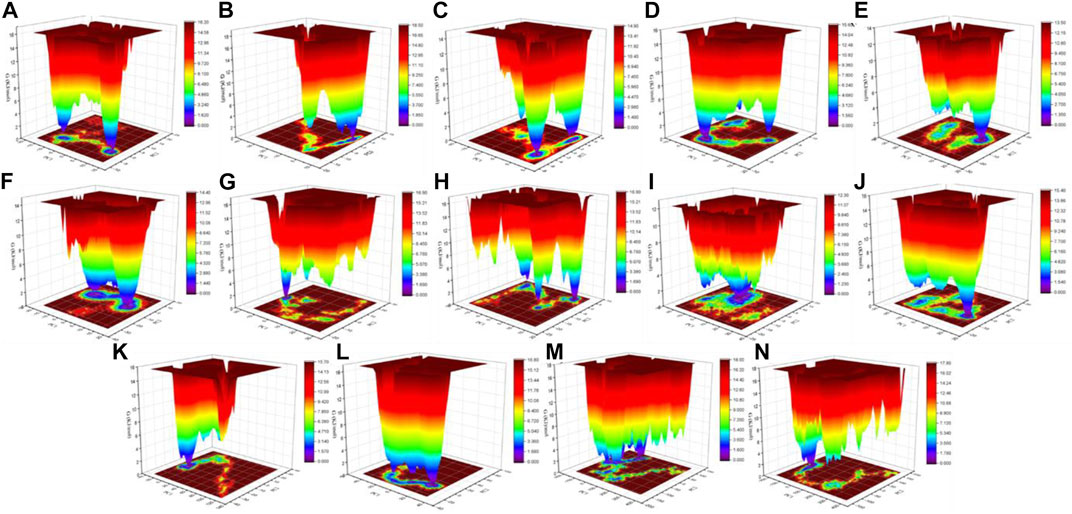
FIGURE 11. Gibbs energy landscape. Gibbs free energy landscape plot obtained during 100 ns MD simulations for (A) CTD, (B) CTD–remdesivir, (C) Eprotein, (D) Eprotein–remdesivir, (E) Mprotease, (F) Mprotease–remdesivir, (G) Mprotein, (H) Mprotein–remdesivir, (I) NTD, (J) NTD–remdesivir, (K) RDRP, (L) RDRP–remdesivir, (M) Sprotein, and (N) Sprotein–remdesivir, respectively.
MMPBSA Analysis
The free energy for binding the ligand to the protein receptor was mined by executing the MMPBSA scheme (Kumari et al., 2014). It is calculated by using polar and apolar solvation constraints to obtain the energies linked with binding of remdesivir to CTD, Eprotein, Mprotease, Mprotein, NTD, RDRP, and Sprotein during MD simulations. The point of these calculations is to attain van der Waals and electrostatic interactions and net non-bonded potential energy between remdesivir and CTD, Eprotein, Mprotease, Mprotein, NTD, RDRP, and Sprotein. The MMPBSA calculations also suggested that remdesivir has strong binding affinity with Mprotein, Mprotease, and RDRP. It has been found that the average binding free energy between remdesivir and Mprotein, Mprotease, and RDRP was −454.69 ± 29.11 kJ/mol, −357.78 ± 39.53 kJ/mol, and −245.12 ± 45.12 kJ/mol, respectively. The MMPBSA calculations also suggested that remdesivir shows strong interactions with these proteins. The previous in vitro experiment showed that the EC50 value of remdesivir for SARS-CoV-2 is 0.77 μM (Wang M. et al., 2020). Nguyen et al. estimated the binding free energy for Mprotease–remdesivir and RDRP–remdesivir using umbrella sampling. They found that the binding free energy for Mprotease–remdesivir and RDRP–remdesivir was −8.69 ± 0.36 kcal/mol (−36.36 kJ/mol) and −9.34 ± 0.38 kcal/mol (−39.08 kJ/mol), respectively (Nguyen et al., 2020). The huge difference between binding free energies is due to different methods used in both the cases. Although the computational results have several limitations, it can be used for comparative analysis.
Conclusion
By means of several computational tools, the association of remdesivir with the C-terminal domain of SARS-CoV-2 nucleocapsid protein, envelope protein, main protease, membrane protein, N-terminal domain of nucleocapsid phosphoprotein, spike protein, and RNA-dependent RNA polymerase of SARS-CoV-2 has been studied. It has been found that together with RNA-dependent RNA polymerase, the membrane protein and main protease of SARS-CoV-2 are also targets for remdesivir. In this study, we analyzed the possible inhibitory mechanism of remdesivir against SARS-CoV-2 using electrostatic interactions, structural deviations, solvent-accessible surface area, secondary structure, principal component analysis, and MMPBSA approaches. Although we have performed detailed computational analysis of binding remdesivir to CTD, Eprotein, Mprotease, Mprotein, NTD, RDRP, and Sprotein, there are many possible research limitations. The experimental validations of the present work are needed to support these data. The information on the different targets might be beneficial for the development of potential drugs.
Data Availability Statement
The raw data supporting the conclusion of this article will be made available by the authors, without undue reservation, to any qualified researcher.
Author Contributions
FK and TK contributed to conception and design of the study. HA wrote the Introduction. DL edited the manuscript.
Funding
This work was supported by the National Natural Science Foundation of China (61771100 and 62001083), the National Key R&D Program of China (2018YFF01013603), the China Postdoctoral Science Foundation (2020M673187), the Sichuan Science and Technology Program (2021YFH0093), and the Guangdong Provincial Key Research and Development Project (2020B010179002).
Conflict of Interest
The authors declare that the research was conducted in the absence of any commercial or financial relationships that could be construed as a potential conflict of interest.
Supplementary Material
The Supplementary Material for this article can be found online at: https://www.frontiersin.org/articles/10.3389/fphar.2021.710778/full#supplementary-material
References
Aftab, S. O., Ghouri, M. Z., Masood, M. U., Haider, Z., Khan, Z., Ahmad, A., et al. (2020). Analysis of SARS-CoV-2 RNA-dependent RNA Polymerase as a Potential Therapeutic Drug Target Using a Computational Approach. J. Translational Med. 18, 275. doi:10.1186/s12967-020-02439-0
Agostini, M. L., Andres, E. L., Sims, A. C., Graham, R. L., Sheahan, T. P., Lu, X., et al. (2018). Coronavirus Susceptibility to the Antiviral Remdesivir (GS-5734) Is Mediated by the Viral Polymerase and the Proofreading Exoribonuclease. mBio 9. doi:10.1128/mbio.00221-18
Ahmed, S. F., Quadeer, A. A., and Mckay, M. R. (2020). Preliminary Identification of Potential Vaccine Targets for the COVID-19 Coronavirus (SARS-CoV-2) Based on SARS-CoV Immunological Studies. Viruses 12, 254. doi:10.3390/v12030254
Ali, S., Khan, F. I., Mohammad, T., Lan, D., Hassan, M. I., and Wang, Y. (2019). Identification and Evaluation of Inhibitors of Lipase from Malassezia Restricta Using Virtual High-Throughput Screening and Molecular Dynamics Studies. Int. J. Mol. Sci. 20. doi:10.3390/ijms20040884
Astuti, I., and Ysrafil, (2020). Severe Acute Respiratory Syndrome Coronavirus 2 (SARS-CoV-2): An Overview of Viral Structure and Host Response. Diabetes Metab. Syndr. Clin. Res. Rev. 14, 407–412. doi:10.1016/j.dsx.2020.04.020
Beg, A., Khan, F. I., Lobb, K. A., Islam, A., Ahmad, F., and Hassan, M. I. (2019). High Throughput Screening, Docking, and Molecular Dynamics Studies to Identify Potential Inhibitors of Human Calcium/calmodulin-dependent Protein Kinase IV. J. Biomol. Struct. Dyn. 37, 2179–2192. doi:10.1080/07391102.2018.1479310
Beniac, D. R., Andonov, A., Grudeski, E., and Booth, T. F. (2006). Architecture of the SARS Coronavirus Prefusion Spike. Nat. Struct. Mol. Biol. 13, 751–752. doi:10.1038/nsmb1123
Camilloni, C., Guerini Rocco, A., Eberini, I., Gianazza, E., Broglia, R. A., and Tiana, G. (2008). Urea and Guanidinium Chloride Denature Protein L in Different Ways in Molecular Dynamics Simulations. Biophysical J. 94, 4654–4661. doi:10.1529/biophysj.107.125799
Carr, J. K., Buchanan, L. E., Schmidt, J. R., Zanni, M. T., and Skinner, J. L. (2013). Structure and Dynamics of Urea/water Mixtures Investigated by Vibrational Spectroscopy and Molecular Dynamics Simulation. J. Phys. Chem. B 117, 13291–13300. doi:10.1021/jp4037217
Chan, J. F.-W., Kok, K.-H., Zhu, Z., Chu, H., To, K. K.-W., Yuan, S., et al. (2020). Genomic Characterization of the 2019 Novel Human-Pathogenic Coronavirus Isolated from a Patient with Atypical Pneumonia after Visiting Wuhan. Emerging Microbes & Infections 9, 221–236. doi:10.1080/22221751.2020.1719902
Chen, Y., Liu, Q., and Guo, D. (2020). Emerging Coronaviruses: Genome Structure, Replication, and Pathogenesis. J. Med. Virol. 92, 418–423. doi:10.1002/jmv.25681
Delmas, B., and Laude, H. (1990). Assembly of Coronavirus Spike Protein into Trimers and its Role in Epitope Expression. J. Virol. 64, 5367–5375. doi:10.1128/jvi.64.11.5367-5375.1990
Durrani, R., Khan, F. I., Ali, S., Wang, Y., and Yang, B. (2020). A Thermolabile Phospholipase B from Talaromyces marneffei GD-0079: Biochemical Characterization and Structure Dynamics Study. Biomolecules 10, 231. doi:10.3390/biom10020231
Fehr, A. R., and Perlman, S. (2015). Coronaviruses: an Overview of Their Replication and Pathogenesis. Methods Mol. Biol. 1282, 1–23. doi:10.1007/978-1-4939-2438-7_1
Furkan, M., Siddiqi, M. K., Zakariya, S. M., Khan, F. I., Hassan, M. I., and Khan, R. H. (2019). An In Vitro Elucidation of the Antiaggregatory Potential of Diosminover Thermally Induced Unfolding of Hen Egg white Lysozyme; A Preventive Quest for Lysozyme Amyloidosis. Int. J. Biol. Macromolecules 129, 1015–1023. doi:10.1016/j.ijbiomac.2019.02.107
Gulzar, M., Ali, S., Khan, F. I., Khan, P., Taneja, P., and Hassan, M. I. (2019a). Binding Mechanism of Caffeic Acid and Simvastatin to the Integrin Linked Kinase for Therapeutic Implications: a Comparative Docking and MD Simulation Studies. J. Biomol. Struct. Dyn. 37, 4327–4337. doi:10.1080/07391102.2018.1546621
Gulzar, M., Syed, S. B., Khan, F. I., Khan, P., Ali, S., Hasan, G. M., et al. (2019b). Elucidation of Interaction Mechanism of Ellagic Acid to the Integrin Linked Kinase. Int. J. Biol. Macromolecules 122, 1297–1304. doi:10.1016/j.ijbiomac.2018.09.089
Gupta, P., Khan, F. I., Ambreen, D., Lai, D., Alajmi, M. F., Hussain, A., et al. (2020a). Investigation of Guanidinium Chloride-Induced Unfolding Pathway of Sphingosine Kinase 1. Int. J. Biol. Macromolecules 147, 177–186. doi:10.1016/j.ijbiomac.2020.01.023
Gupta, P., Khan, F. I., Roy, S., Anwar, S., Dahiya, R., Alajmi, M. F., et al. (2020b). Functional Implications of pH-Induced Conformational Changes in the Sphingosine Kinase 1. Spectrochimica Acta A: Mol. Biomol. Spectrosc. 225, 117453. doi:10.1016/j.saa.2019.117453
Hassan, F., Khan, F. I., Song, H., Lai, D., and Juan, F. (2020). Effects of Reverse Genetic Mutations on the Spectral and Photochemical Behavior of a Photoactivatable Fluorescent Protein PAiRFP1. Spectrochimica Acta Part A: Mol. Biomol. Spectrosc. 228, 117807. doi:10.1016/j.saa.2019.117807
Jin, Z., Du, X., Xu, Y., Deng, Y., Liu, M., Zhao, Y., et al. (2020). Structure of Mpro from SARS-CoV-2 and Discovery of its Inhibitors. Nature 582, 289–293. doi:10.1038/s41586-020-2223-y
Khan, F. I., Govender, A., Permaul, K., Singh, S., and Bisetty, K. (2015). Thermostable Chitinase II from Thermomyces Lanuginosus SSBP: Cloning, Structure Prediction and Molecular Dynamics Simulations. J. Theor. Biol. 374, 107–114. doi:10.1016/j.jtbi.2015.03.035
Khan, F. I., Hassan, F., Anwer, R., Juan, F., and Lai, D. (2020a). Comparative Analysis of Bacteriophytochrome Agp2 and its Engineered Photoactivatable NIR Fluorescent Proteins PAiRFP1 and PAiRFP2. Biomolecules 10, 1286. doi:10.3390/biom10091286
Khan, F. I., Lai, D., Anwer, R., Azim, I., and Khan, M. K. A. (2020b). Identifying Novel Sphingosine Kinase 1 Inhibitors as Therapeutics against Breast Cancer. J. Enzyme Inhib. Med. Chem. 35, 172–186. doi:10.1080/14756366.2019.1692828
Khan, F. I., Nizami, B., Anwer, R., Gu, K.-R., Bisetty, K., Hassan, M. I., et al. (2017). Structure Prediction and Functional Analyses of a Thermostable Lipase Obtained from Shewanella Putrefaciens. J. Biomol. Struct. Dyn. 35, 2123–2135. doi:10.1080/07391102.2016.1206837
Khan, F. I., Song, H., Hassan, F., Tian, J., Tang, L., Lai, D., et al. (2021). Impact of Amino Acid Substitutions on the Behavior of a Photoactivatable Near Infrared Fluorescent Protein PAiRFP1. Spectrochimica Acta Part A: Mol. Biomol. Spectrosc. 253, 119572. doi:10.1016/j.saa.2021.119572
Khan, F. I., Wei, D.-Q., Gu, K.-R., Hassan, M. I., and Tabrez, S. (2016). Current Updates on Computer Aided Protein Modeling and Designing. Int. J. Biol. Macromolecules 85, 48–62. doi:10.1016/j.ijbiomac.2015.12.072
Kumari, R., Kumar, R., and Lynn, A. (2014). g_mmpbsa-A GROMACS Tool for High-Throughput MM-PBSA Calculations. J. Chem. Inf. Model. 54, 1951–1962. doi:10.1021/ci500020m
Kuzmanic, A., and Zagrovic, B. (2010). Determination of Ensemble-Average Pairwise Root Mean-Square Deviation from Experimental B-Factors. Biophysical J. 98, 861–871. doi:10.1016/j.bpj.2009.11.011
Lau, Y. L., and Peiris, J. M. (2005). Pathogenesis of Severe Acute Respiratory Syndrome. Curr. Opin. Immunol. 17, 404–410. doi:10.1016/j.coi.2005.05.009
Li, F. (2016). Structure, Function, and Evolution of Coronavirus Spike Proteins. Annu. Rev. Virol. 3, 237–261. doi:10.1146/annurev-virology-110615-042301
Liu, C., Zhou, Q., Li, Y., Garner, L. V., Watkins, S. P., Carter, L. J., et al. (2020). Research and Development on Therapeutic Agents and Vaccines for COVID-19 and Related Human Coronavirus Diseases. ACS Cent. Sci. 6, 315–331. doi:10.1021/acscentsci.0c00272
Mazola, Y., Guirola, O., Palomares, S., Chinea, G., Menendez, C., Hernandez, L., et al. (2015). A Comparative Molecular Dynamics Study of Thermophilic and Mesophilic Beta-Fructosidase Enzymes. J. Mol. Model. 21, 2772. doi:10.1007/s00894-015-2772-4
Mohammad, T., Khan, F. I., Lobb, K. A., Islam, A., Ahmad, F., and Hassan, M. I. (2019). Identification and Evaluation of Bioactive Natural Products as Potential Inhibitors of Human Microtubule Affinity-Regulating Kinase 4 (MARK4). J. Biomol. Struct. Dyn. 37, 1813–1829. doi:10.1080/07391102.2018.1468282
Naik, V. R., Munikumar, M., Ramakrishna, U., Srujana, M., Goudar, G., Naresh, P., et al. (2020). Remdesivir (GS-5734) as a Therapeutic Option of 2019-nCOV Main Protease -in Silicoapproach. J. Biomol. Struct. Dyn., 1–14. doi:10.1080/07391102.2020.1781694
Naz, F., Khan, F. I., Mohammad, T., Khan, P., Manzoor, S., Hasan, G. M., et al. (2018). Investigation of Molecular Mechanism of Recognition between Citral and MARK4: A Newer Therapeutic Approach to Attenuate Cancer Cell Progression. Int. J. Biol. Macromolecules 107, 2580–2589. doi:10.1016/j.ijbiomac.2017.10.143
Nguyen, H. L., Thai, N. Q., Truong, D. T., and Li, M. S. (2020). Remdesivir Strongly Binds to Both RNA-dependent RNA Polymerase and Main Protease of SARS-CoV-2: Evidence from Molecular Simulations. J. Phys. Chem. B 124, 11337–11348. doi:10.1021/acs.jpcb.0c07312
Qausain, S., Khan, F. I., Lai, D., Hassan, M. I., Basheeruddin, M., Ahmed, N., et al. (2020). Mechanistic Insights into the Urea-Induced Denaturation of a Non-seleno Thiol Specific Antioxidant Human Peroxiredoxin 6. Int. J. Biol. Macromol.
Roy, A., Kucukural, A., and Zhang, Y. (2010). I-TASSER: a Unified Platform for Automated Protein Structure and Function Prediction. Nat. Protoc. 5, 725–738. doi:10.1038/nprot.2010.5
Satarker, S., and Nampoothiri, M. (2020). Structural Proteins in Severe Acute Respiratory Syndrome Coronavirus-2. Arch. Med. Res. 51, 482–491. doi:10.1016/j.arcmed.2020.05.012
Schmidt, A., Sauthof, L., Szczepek, M., Lopez, M. F., Escobar, F. V., Qureshi, B. M., et al. (2018). Structural Snapshot of a Bacterial Phytochrome in its Functional Intermediate State. Nat. Commun. 9, 4912–4917. doi:10.1038/s41467-018-07392-7
Schüttelkopf, A. W., and Van Aalten, D. M. F. (2004). PRODRG: a Tool for High-Throughput Crystallography of Protein-Ligand Complexes. Acta Crystallogr. D Biol. Cryst. 60, 1355–1363. doi:10.1107/s0907444904011679
Shereen, M. A., Khan, S., Kazmi, A., Bashir, N., and Siddique, R. (2020). COVID-19 Infection: Emergence, Transmission, and Characteristics of Human Coronaviruses. J. Adv. Res. 24, 91–98. doi:10.1016/j.jare.2020.03.005
Syed, S. B., Khan, F. I., Khan, S. H., Srivastava, S., Hasan, G. M., Lobb, K. A., et al. (2018a). Mechanistic Insights into the Urea-Induced Denaturation of Kinase Domain of Human Integrin Linked Kinase. Int. J. Biol. Macromolecules 111, 208–218. doi:10.1016/j.ijbiomac.2017.12.164
Syed, S. B., Khan, F. I., Khan, S. H., Srivastava, S., Hasan, G. M., Lobb, K. A., et al. (2018b). Unravelling the Unfolding Mechanism of Human Integrin Linked Kinase by GdmCl-Induced Denaturation. Int. J. Biol. Macromolecules 117, 1252–1263. doi:10.1016/j.ijbiomac.2018.06.025
Thomas, S. (2020). The Structure of the Membrane Protein of SARS-CoV-2 Resembles the Sugar Transporter SemiSWEET. Pai 5, 342–363. doi:10.20411/pai.v5i1.377
Trott, O., and Olson, A. J. (2010). AutoDock Vina: Improving the Speed and Accuracy of Docking with a New Scoring Function, Efficient Optimization, and Multithreading. J. Comput. Chem. 31, 455–461. doi:10.1002/jcc.21334
Van Der Spoel, D., Lindahl, E., Hess, B., Groenhof, G., Mark, A. E., and Berendsen, H. J. C. (2005). GROMACS: Fast, Flexible, and Free. J. Comput. Chem. 26, 1701–1718. doi:10.1002/jcc.20291
Wang, D., Hu, B., Hu, C., Zhu, F., Liu, X., Zhang, J., et al. (2020a). Clinical Characteristics of 138 Hospitalized Patients with 2019 Novel Coronavirus-Infected Pneumonia in Wuhan, China. Jama 323, 1061–1069. doi:10.1001/jama.2020.1585
Wang, M., Cao, R., Zhang, L., Yang, X., Liu, J., Xu, M., et al. (2020b). Remdesivir and Chloroquine Effectively Inhibit the Recently Emerged Novel Coronavirus (2019-nCoV) In Vitro. Cell Res 30, 269–271. doi:10.1038/s41422-020-0282-0
Warren, T. K., Jordan, R., Lo, M. K., Ray, A. S., Mackman, R. L., Soloveva, V., et al. (2016). Therapeutic Efficacy of the Small Molecule GS-5734 against Ebola Virus in Rhesus Monkeys. Nature 531, 381–385. doi:10.1038/nature17180
Webb, B., and Sali, A. (2016). Comparative Protein Structure Modeling Using MODELLER. Curr. Protoc. Bioinformatics 54, 5.6.1–5.6.37. doi:10.1002/cpbi.3
Wu, A., Peng, Y., Huang, B., Ding, X., Wang, X., Niu, P., et al. (2020). Genome Composition and Divergence of the Novel Coronavirus (2019-nCoV) Originating in China. Cell Host & Microbe 27, 325–328. doi:10.1016/j.chom.2020.02.001
Xu, J., Zhao, S., Teng, T., Abdalla, A. E., Zhu, W., Xie, L., et al. (2020a). Systematic Comparison of Two Animal-To-Human Transmitted Human Coronaviruses: SARS-CoV-2 and SARS-CoV. Viruses 12, 244. doi:10.3390/v12020244
Xu, Z., Shi, L., Wang, Y., Zhang, J., Huang, L., Zhang, C., et al. (2020b). Pathological Findings of COVID-19 Associated with Acute Respiratory Distress Syndrome. Lancet Respir. Med. 8, 420–422. doi:10.1016/s2213-2600(20)30076-x
Zhang, C., Freddolino, P. L., and Zhang, Y. (2017). COFACTOR: Improved Protein Function Prediction by Combining Structure, Sequence and Protein-Protein Interaction Information. Nucleic Acids Res. 45, W291–w299. doi:10.1093/nar/gkx366
Zhang, H., Penninger, J. M., Li, Y., Zhong, N., and Slutsky, A. S. (2020). Angiotensin-converting Enzyme 2 (ACE2) as a SARS-CoV-2 Receptor: Molecular Mechanisms and Potential Therapeutic Target. Intensive Care Med. 46, 586–590. doi:10.1007/s00134-020-05985-9
Keywords: SARS-CoV-2, remdesivir, main protease, membrane proteins, RNA-dependent RNA polymerase
Citation: Khan FI, Kang T, Ali H and Lai D (2021) Remdesivir Strongly Binds to RNA-Dependent RNA Polymerase, Membrane Protein, and Main Protease of SARS-CoV-2: Indication From Molecular Modeling and Simulations. Front. Pharmacol. 12:710778. doi: 10.3389/fphar.2021.710778
Received: 17 May 2021; Accepted: 15 June 2021;
Published: 07 July 2021.
Edited by:
Ilaria Peluso, Council for Agricultural and Economics Research (CREA), ItalyReviewed by:
Mai Suan Li, Institute of Physics (PAN), PolandBechan Sharma, Allahabad University, India
Copyright © 2021 Khan, Kang, Ali and Lai. This is an open-access article distributed under the terms of the Creative Commons Attribution License (CC BY). The use, distribution or reproduction in other forums is permitted, provided the original author(s) and the copyright owner(s) are credited and that the original publication in this journal is cited, in accordance with accepted academic practice. No use, distribution or reproduction is permitted which does not comply with these terms.
*Correspondence: Dakun Lai, dklai@uestc.edu.cn
†These authors have contributed equally to this work