 Hirotaka Takayama1†
 Takuya Yoshimura1†
 Hajime Suzuki1*
 Yuka Hirano1Masahiro Tezuka1Takayuki Ishida1Kiyohide Ishihata1
 Marie Amitani2,3
 Haruka Amitani3Yasunori Nakamura4Yasushi Imamura5
 Akio Inui6Norifumi Nakamura1
- 1Department of Oral and Maxillofacial Surgery, Kagoshima University Graduate School of Medical and Dental Sciences, Kagoshima, Japan
- 2Department of Community-Based Medicine, Kagoshima University Graduate School of Medical and Dental Sciences, Kagoshima, Japan
- 3Department of Psychosomatic Internal Medicine, Kagoshima University Graduate School of Medical and Dental Sciences, Kagoshima, Japan
- 4Department of Oral Surgery, Kagoshima Medical Center, National Hospital Organization, Kagoshima, Japan
- 5Department of Internal Medicine, Kagoshima Kouseiren Hospital, Kagoshima, Japan
- 6Pharmacological Department of Herbal Medicine, Kagoshima University Graduate School of Medical and Dental Sciences, Kagoshima, Japan
Introduction: The most effective method of assessing sarcopenia has yet to be determined, whether by single muscle or by whole muscle segmentation. The purpose of this study was to compare the prognostic value of these two methods using computed tomography (CT) images in patients with oral squamous cell carcinoma (OSCC).
Materials and methods: Sex- and age-adjusted Cox proportional hazards models were employed for each parameter of sarcopenia related to overall survival, disease-free survival, and disease-specific survival. Harrell’s concordance index was calculated for each model to assess discriminatory power.
Results: In this study including 165 patients, a significant correlation was found between the CT-based assessment of individual muscles and their cross-sectional area. Single muscle assessments showed slightly higher discriminatory power in survival outcomes compared to whole muscle assessments, but the difference was not statistically significant, as indicated by overlapping confidence intervals for the C-index between assessments. To further validate our measurements, we classified patients into two groups based on intramuscular adipose tissue content (P-IMAC) of the spinous process muscle. Analysis showed that the higher the P-IMAC value, the poorer the survival outcome.
Conclusion: Our findings indicate a slight advantage of single-muscle over whole-muscle assessment in prognostic evaluation, but the difference between the two methods is not conclusive. Both assessment methods provide valuable prognostic information for patients with OSCC, and further studies involving larger, independent cohorts are needed to clarify the potential advantage of one method over the other in the prognostic assessment of sarcopenia in OSCC.
1 Introduction
The prevalence of head and neck cancer is growing yearly, with oral squamous cell carcinoma (OSCC), the most frequent kind of oral cancer, having the highest mortality rate (1). In the United States, the total mortality rate for cancers of the oral cavity and pharynx increased by 0.5% per year from 2009 to 2018 (1). In 2020, there were approximately 53,260 new cases of this cancer, which is an increase of approximately 10,750 deaths compared to previous years (2). With advances in diagnostic and therapeutic modalities, 5-year survival rates for OSCC have improved markedly (3). An international retrospective study focused primarily on survival rates for OSCC patients treated with surgery alone or surgery and adjuvant radiation therapy (4). The results revealed that between 1990 and 2011, the 5-year survival rate for these patients increased from 59% to 70% (4).
Clinical symptoms associated with cancer progression in patients with OSCC can include limited mouth opening, tissue swelling, swollen lymph nodes, anorexia, and hygiene problems (5). Limited mouth opening, also known as trismus, can result from tumor growth or radiation therapy, leading to difficulties in eating, speaking, and maintaining oral hygiene (6). Tissue swelling and swollen lymph nodes may indicate disease progression and the spread of cancer (6). Advanced oral cancer is frequently linked to symptoms such as anorexia, loss of appetite, and consequent weight loss (6). It is known that patients with oral cancer are more likely to experience dysphagia due to the characteristics of the site of occurrence and are at high risk of deterioration of nutritional status and progression to frailty and sarcopenia (7). Sarcopenia is a condition in which muscle mass is reduced due to aging, malnutrition, and lack of physical activity, causing functional deterioration. Globally, especially in industrialized countries, the elderly population is growing (8–10), as is the number of elderly cancer patients. Elderly people and those with malnutrition, prolonged hospital stays, and reduced physical activity further promote sarcopenia (8–12). Sarcopenia itself is not a direct cause of decreased quality of life (QOL) in cancer patients. However, the underlying factors associated with sarcopenia, such as decreased physical function, fatigue, and treatment tolerance, can contribute to a decline in QOL among cancer patients. There is limited specific research on the direct relationship between sarcopenia and QOL in cancer patients. However, several studies have investigated the impact of muscle loss, physical function, and related factors on QOL in cancer patients (13, 14). The association between sarcopenia and poor postoperative prognosis has been described in various cancers, such as colorectal cancer and gastric cancer patients, and there are some reports that patients with preoperative sarcopenia have a poor postoperative prognosis (15–17). In the area of OSCC, the impact of sarcopenia on prognosis is becoming a focus of interest. The study by Lin et al. and the systematic review and meta-analysis by Graves et al. are pioneering works that evaluated the prognostic value of sarcopenia in OSCC (18, 19). Lin et al. demonstrated a significant relationship between reduced skeletal muscle mass and lower survival rates, suggesting the importance of sarcopenia as a prognostic factor in OSCC patients undergoing surgery (18). Similarly, Graves et al. highlighted the association between sarcopenia detected through radiographic assessment before treatment and poorer survival outcomes in patients with OSCC (19), supporting the findings of Lin et al.
Numerous techniques have been proposed to evaluate sarcopenia. To determine muscle mass or lean body mass, imaging modalities such as computed tomography (CT), magnetic resonance imaging (MRI), and dual-energy X-ray absorptiometry (DXA) have been employed. CT has gained popularity in recent times, especially among patients who opt for CT scans as part of their routine medical examination (20). Several studies have utilized CT scans to measure skeletal muscle mass by analyzing the cross-sectional area at the third lumbar vertebra (L3), which is highly correlated with total skeletal muscle mass (16). However, abdominal CT imaging is not a standard procedure for patients with squamous cell carcinoma of the head and neck, and lumbar region imaging is typically performed using 18F-fluorodeoxyglucose positron emission tomography/computed tomography (FDG PET/CT) for routine staging purposes (21–23).
To date, no definitive conclusion has been reached as to whether assessment by a single muscle or its whole cross-sectional area (CSA) is more appropriate in assessing sarcopenia. The psoas muscle index is often used to diagnose preoperative sarcopenia, but there is literature that requires muscle evaluation of the entire cross-section instead of a single muscle in the diagnosis of sarcopenia (20), while single-muscle evaluation has been related to poor prognosis in patients with OSCC (24, 25). Rollins KE et al. reported a correlation between the CSA of the psoas major muscle measured by CT and the CSA of the entire L3 slice for healthy subjects (26). However, they noted that this relationship was not conclusive and that single muscles should not be used as sentinels for whole-slice CSA because there was considerable variation in the measurements (26). On the other hand, it is also recommended that further research be conducted on the correlation between body composition analysis of individual skeletal muscle groups across L3 slices and clinical outcome measures, with the goal of assessing which muscle groups correlate best with the relevant clinical outcome measures (26).
Previous studies provide a basis for understanding the prognostic significance of sarcopenia in OSCC and advocate the assessment of sarcopenia in the prognostic evaluation of patients. Inspired by these findings, the present study examined whether the assessment of a single-muscle or the whole-muscle cross-sectional area is a more accurate predictor of prognosis in OSCC. Through this study, we sought to contribute new knowledge on the prognostic value of muscle assessment in OSCC, strengthen the current knowledge base, and advance our understanding of the relationship between muscle composition and cancer prognosis.
2 Materials and methods
2.1 Patients
Between January 2009 and December 2017, surgical treatment was performed on 183 patients with primary OSCC at Kagoshima University Hospital. However, some patients were excluded from the analysis due to the lack of preoperative FDG PET/CT imaging or artifacts in the patient’s CT images. A total of 165 patients were included in this retrospective cohort study. Gender, age, body mass index (BMI), comorbidities, tobacco/alcohol use, serum albumin concentration, tumor site, TN staging, tumor stage, treatment, survival rate, and duration of follow-up were among the clinicopathological data collected from all patients. The patient flow chart, according to STROBE standards, is presented in Figure 1.
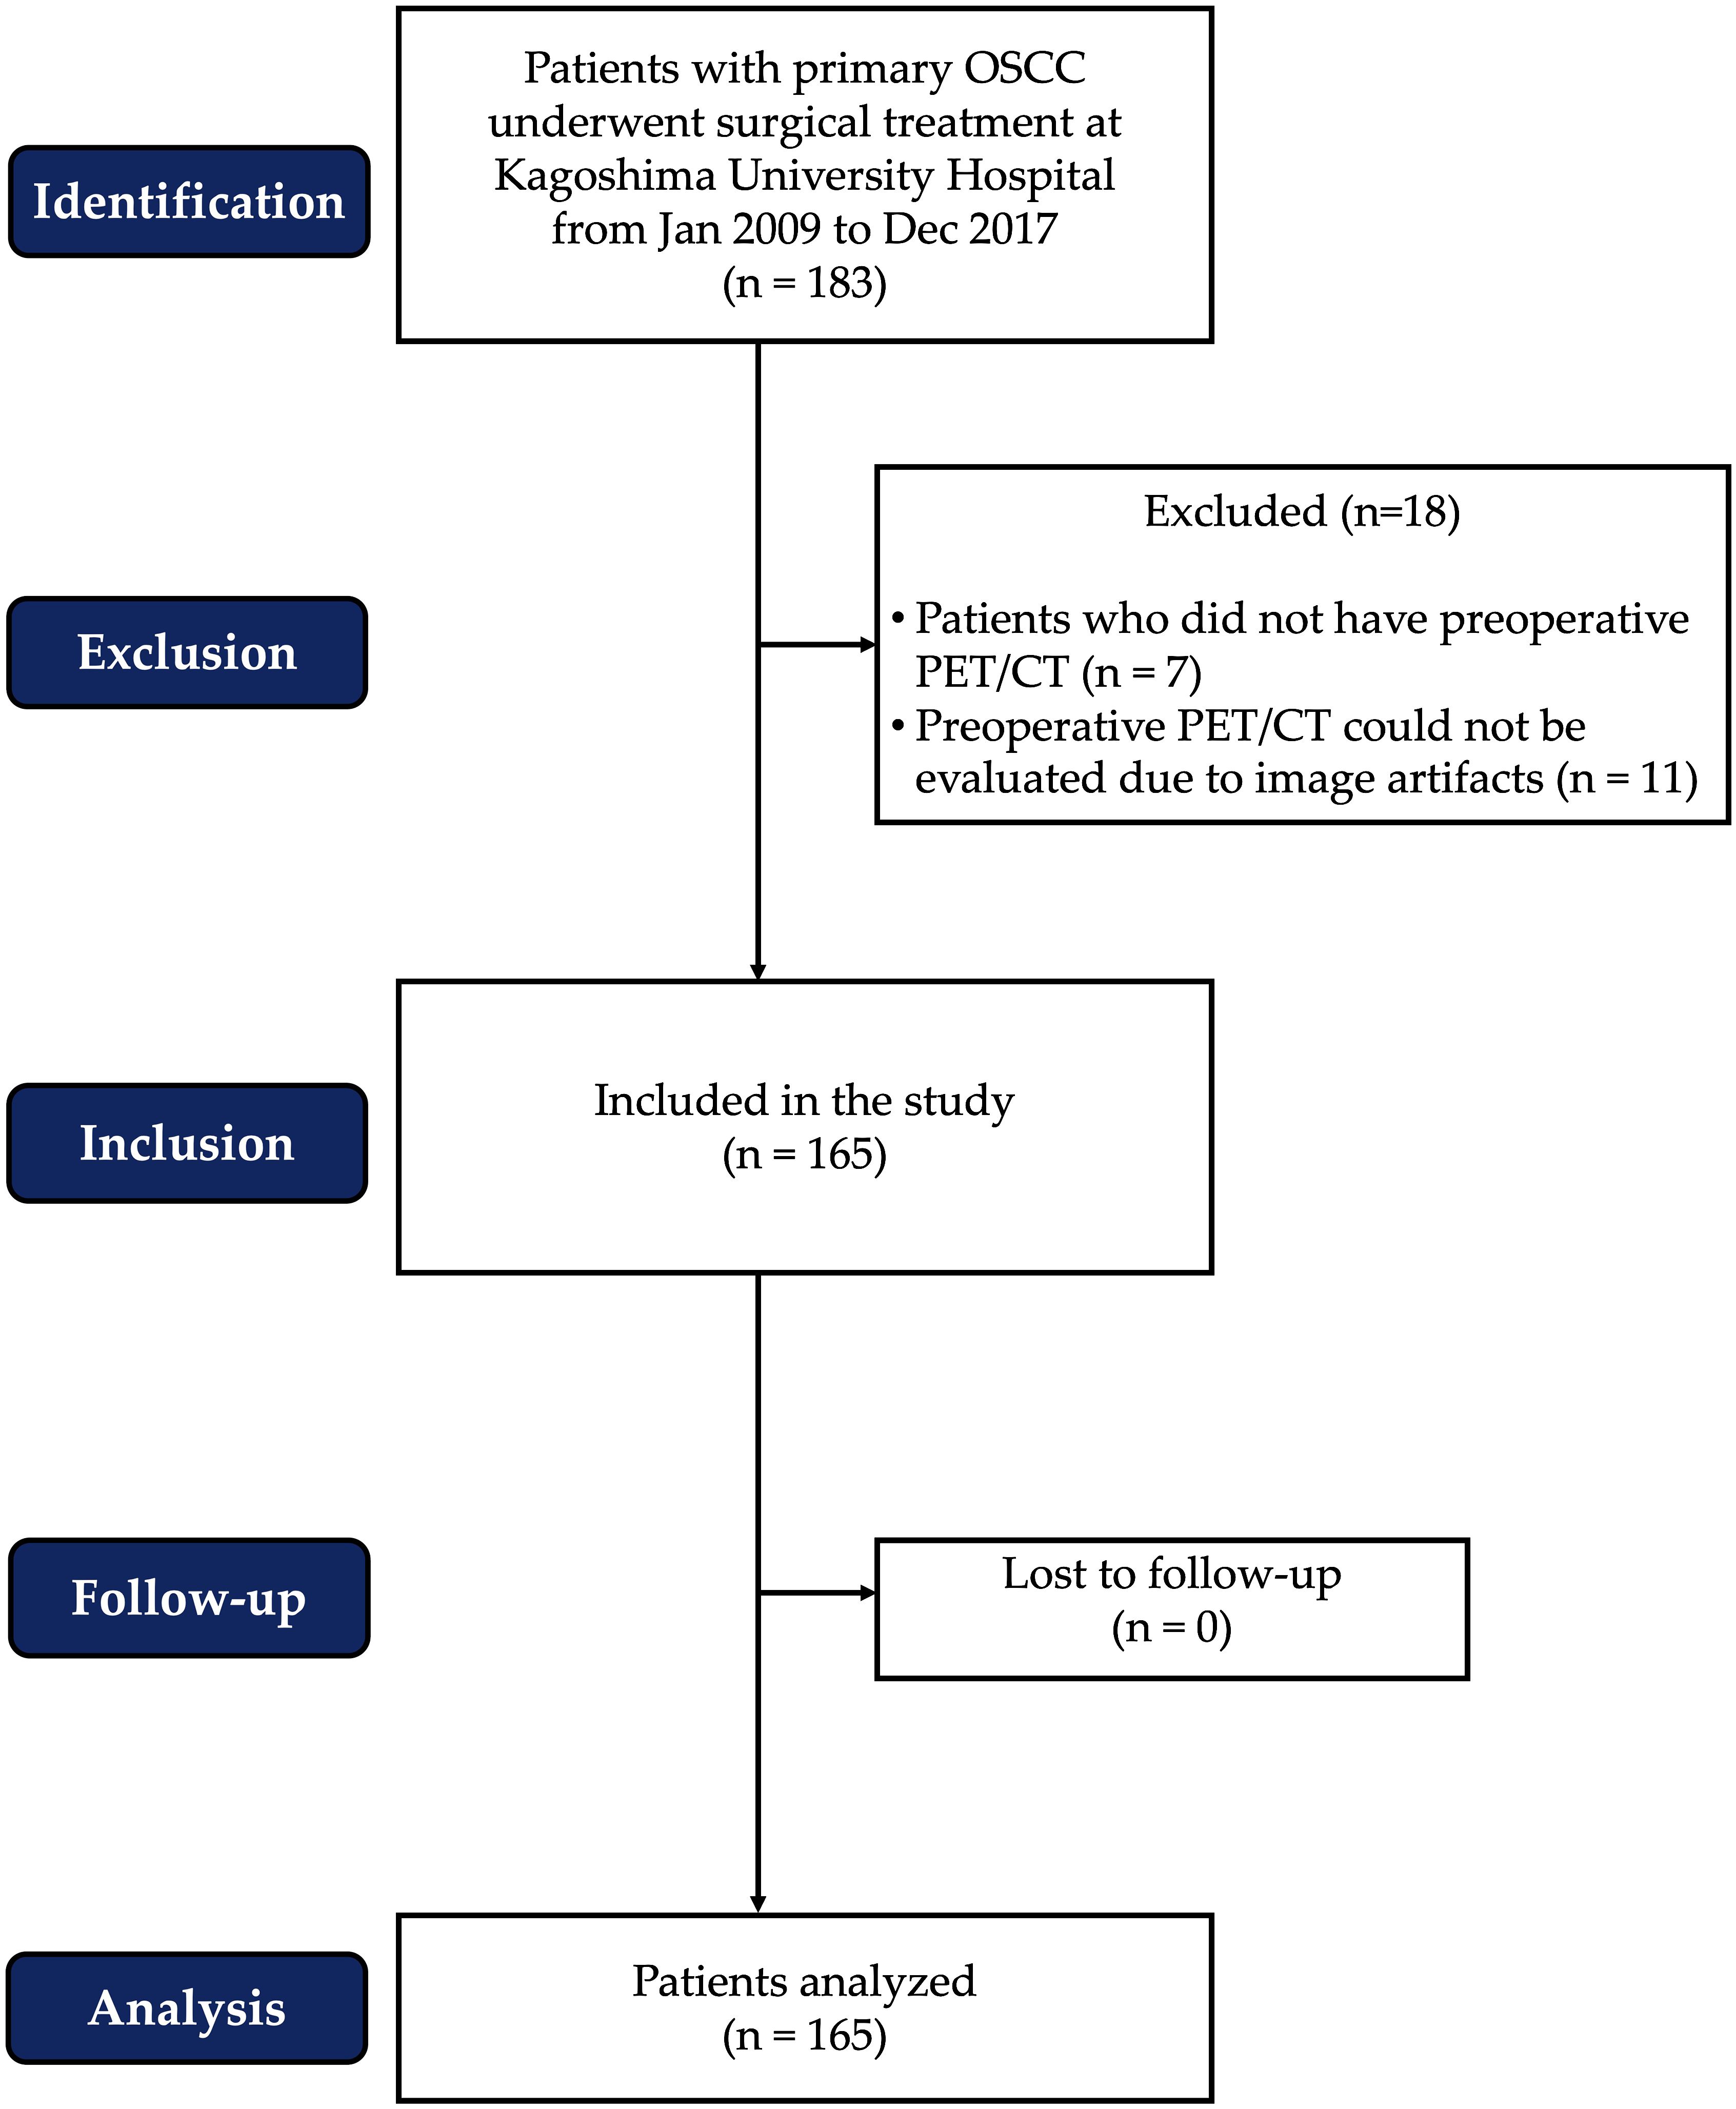
Figure 1 The patient flow chart according to STROBE standards.
We utilized the TNM classification system of the International Union Against Cancer, specifically the 7th edition of 2010 (27), to determine the clinical and pathological stages of each patient. The 7th edition was chosen for data collection because it was the most recent edition available at the time and allowed for consistency in patient classification. Based on clinical and imaging findings, a cervical dissection was planned for each patient. Patients with confirmed lymph node metastases [cN(+)] or requiring reconstructive surgery underwent simultaneous neck dissection with resection of the primary tumor. Radical neck dissection involving levels I-V on the affected side was performed if lymph node metastases were detected prior to treatment. During cervical dissection, the sternocleidomastoid muscle was always excised, but the accessory nerves and the internal jugular vein were preserved if they were not directly involved in the metastatic lymph nodes.
For the purpose of monitoring the patient’s postoperative recovery and to identify signs of recurrence or complications, routine clinical examinations were performed by the surgeon after surgery. The frequency varied over time: once or twice a month in the first year, once a month in the second year, and every three to six months in the third to fifth years. Contrast-enhanced CT and ultrasound were performed at regular intervals after surgery. Imaging was performed at 1, 3, 6, 12, 18, and 24 months postoperatively and annually for the following three years. If cervical lymph node metastases were detected during the surveillance period, immediate cervical dissection and histopathology were performed to further investigate and determine the extent of metastases.
2.2 Ethics and informed consent statement
This retrospective cohort study adhered to the principles of the Helsinki Declaration and was approved by the Institutional Ethics Committee of Kagoshima University (permission No. 160319). Due to the nature of the investigation, patient consent was not obtained. Instead, an opt-out approach was implemented, and a notification was posted on the Kagoshima University Hospital website to obtain authorization for this study.
2.3 18F FDG-PET/CT scanning
The detection of metastasis, including metastatic lymph nodes, using 18F FDG-PET/CT has been established. The Discovery PET/CT 600 Motion and Discovery PET/CT 610 Motion (GE Healthcare) were employed to obtain images for this study. Patients were administered 18F FDG at a dose of 3.7 MBq/kg body weight after fasting for 6 hours before the 18F FDG-PET/CT examinations. Whole-body scanning was performed one hour after the administration of 18F FDG, followed by local imaging two hours later.
2.4 Image analysis
To identify the presence of systemic metastasis of squamous cell carcinoma, a single FDG PET/CT scan was performed within two weeks before surgery. The CT component of the FDG PET/CT images was utilized for image analysis. A single measurer, who was not involved in the treatment, performed the analysis based on a previous study (28). The CT values for skeletal muscle were defined as areas of -29 to 150 HU, while subcutaneous adipose tissue areas were defined as areas of -150 to -50 HU. The multifidus and sternocleidomastoid muscles were evaluated separately by tracing their contours in OsiriX v.4.0 (Pixmeo SARL, Geneva, Switzerland). The sternocleidomastoid muscle mass index (SCMI) and psoas muscle mass index (PMI) were calculated by normalizing cross-sectional areas to height (cm2/m2) (25). The region of interest (ROI) for the multifidus muscle was used to determine the processus spinosus muscle-intramuscular adipose tissue content (P-IMAC) and intramuscular adipose tissue content (IMAC) by dividing the ROI of the multifidus muscle (in Hounsfield units) by the ROI of subcutaneous adipose tissue (in Hounsfield units) (25). The cross-sectional areas (CSA) (in cm2) of skeletal muscle in the third cervical vertebra (C3) and the third lumbar vertebrae (L3) region, as well as CT values (in Hounsfield units), were evaluated using sliceOmatic® v.5.0 (TomoVision, Magog, Canada). The areas of muscle and adipose tissue were traced semiautomatically. Adipose tissue of the same cross-section was measured, and the average CT value was used as the CT value of adipose tissue. Cross-sectional areas were normalized by height (in cm2) and defined as the skeletal muscle index (SMI) and C3-SMI, respectively. The cross-sectional area intramuscular adipose tissue content (CSA IMAC) and the cross-sectional area intramuscular adipose tissue content at the level of the third cervical vertebra (C3-CSA IMAC) were defined by dividing SMI and C3-SMI by the CT value of adipose tissue, respectively. A summary of the parameters is presented in Table 1. Figure 2 is an analysis of muscle and adipose tissue by image, highlighting the delineation and quantitative evaluation of the multifidus and sternocleidomastoid muscles. This analysis facilitated the calculation of the SCMI and PMI by normalizing the muscle cross-sectional area to the height of the subject, allowing uniform comparisons. In addition, the ratio of CT values of muscle to subcutaneous adipose tissue was calculated to assess muscle quality and provide insight into fat infiltration. This visualization enabled the distinction between muscle and adipose tissue and the accurate quantification of cross-sectional area at a given vertebral level.
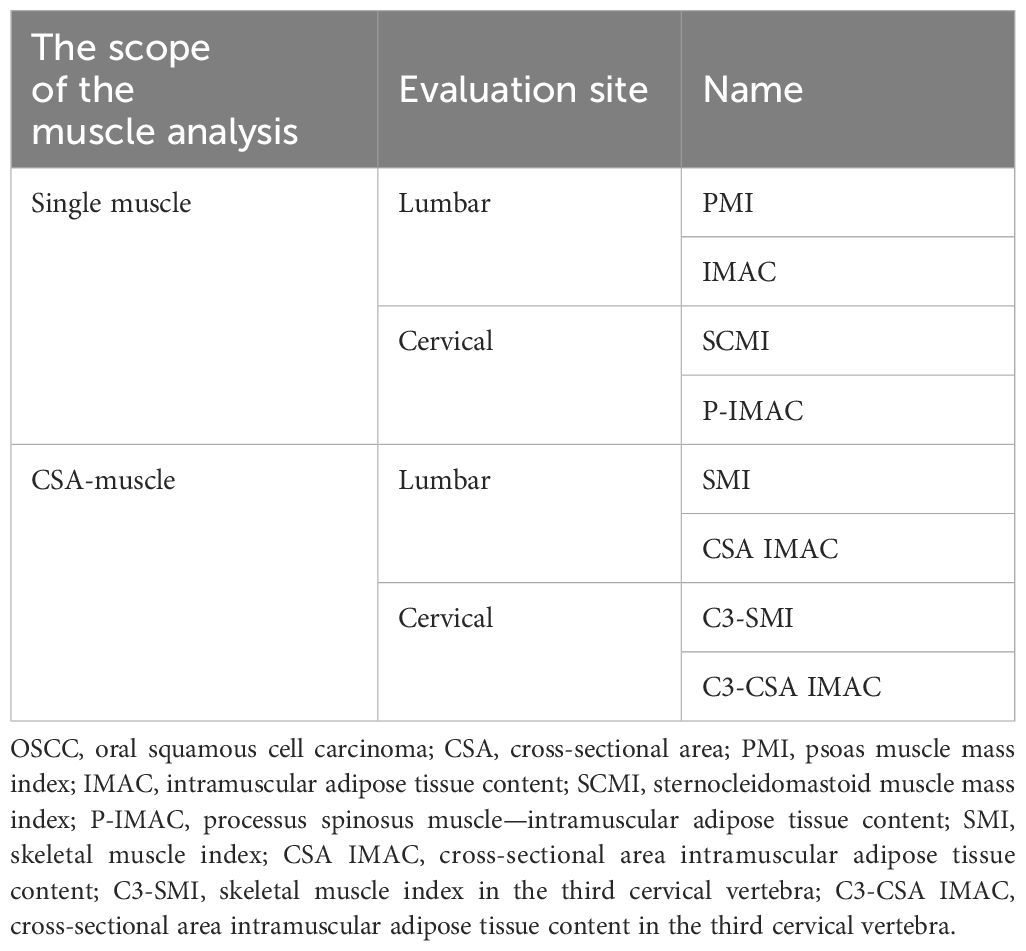
Table 1 Indicators for assessing sarcopenia in OSCC: single muscle and cross-sectional area analysis.
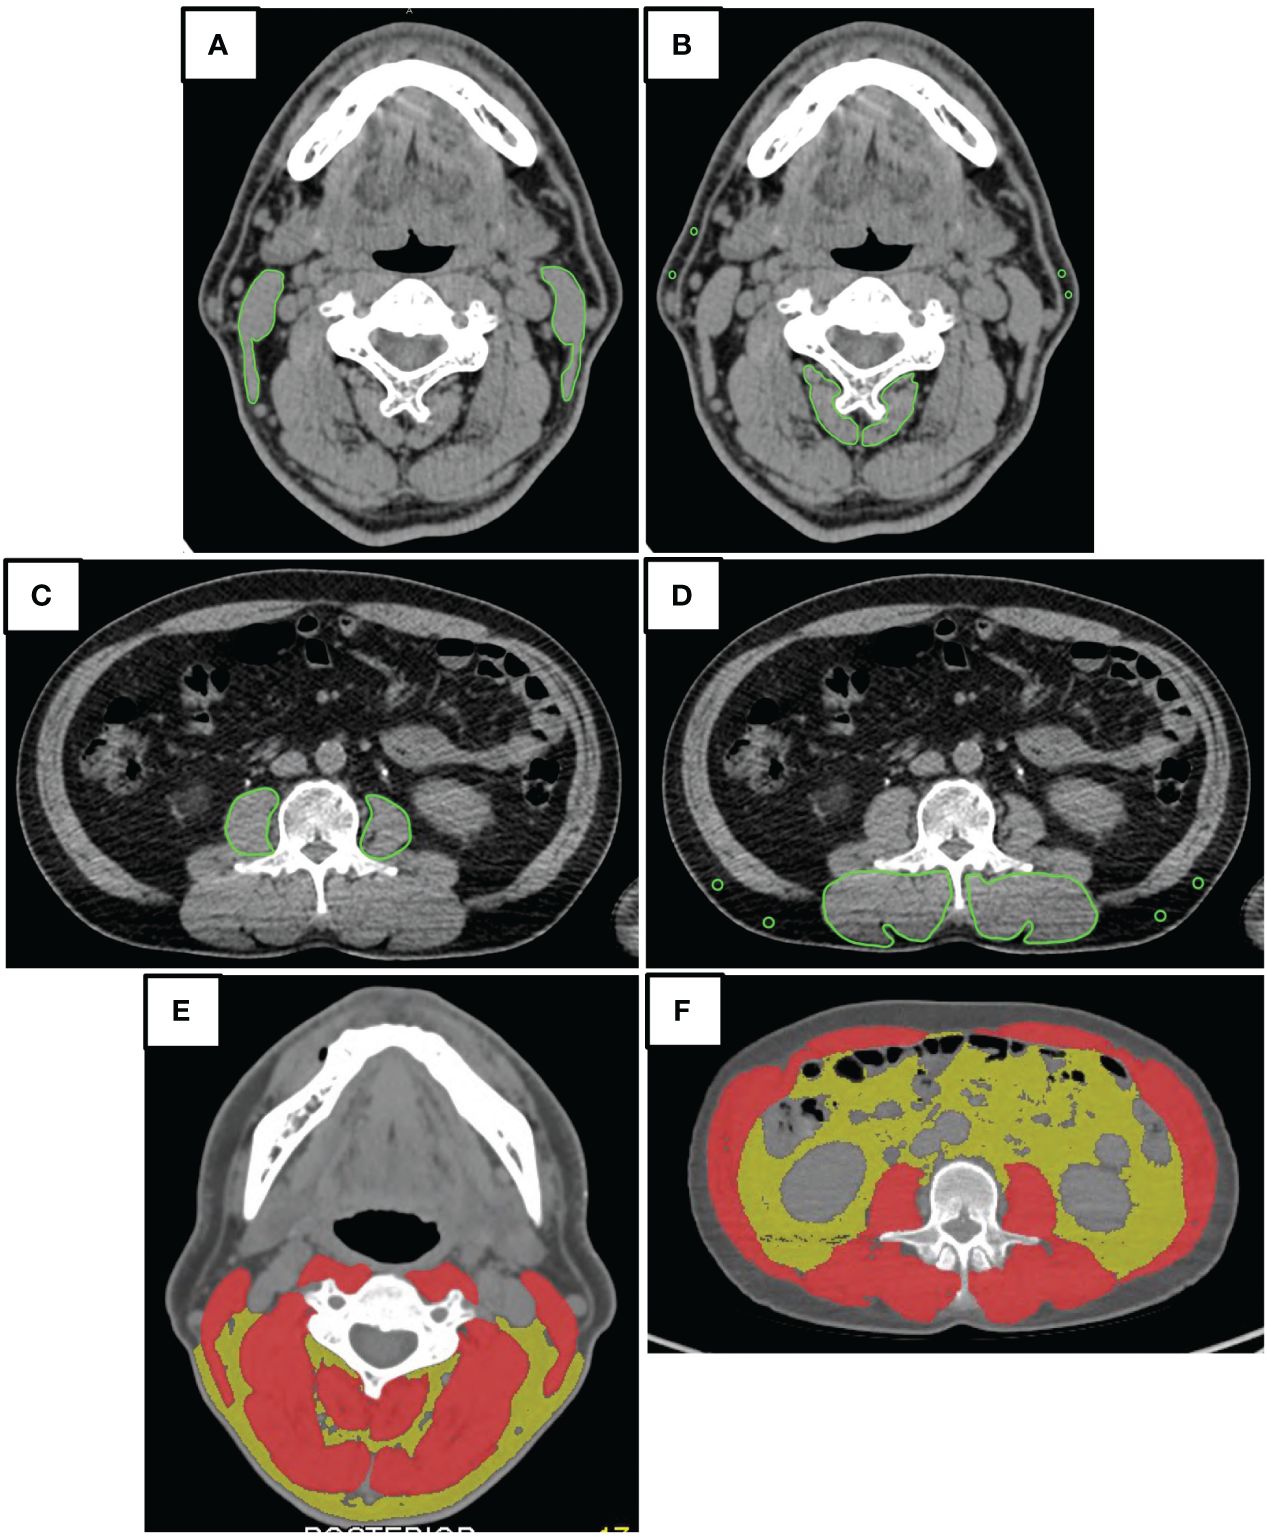
Figure 2 Image analysis. The illustrative outcomes from a comprehensive analysis of muscular and adipose tissues using imaging techniques. (A, C) Tracing of Muscular Contours for Quantitative Assessment: The precise delineation of the multifidus and sternocleidomastoid muscles facilitated the calculation of the Spinal Cord Muscle Index (SCMI) and the Psoas Muscle Index (PMI). By normalizing the cross-sectional areas of muscle (in cm²) against the height of the subjects, indices were derived in units of cm²/m². This normalization process permitted a uniform comparison among subjects, regardless of their height variations. (B, D) The Evaluation of Muscle Quality through Adipose Tissue Ratios: Through the calculation of the Posterior Intermuscular Adipose Tissue Composition (P-IMAC) and the Intermuscular Adipose Composition (IMAC), an assessment of muscle quality was achieved. This assessment required dividing the computed tomography (CT) values for the bilateral multifidus muscle at the cervical level 3 (C3) and lumbar level 3 (L3) by the CT attenuation values of subcutaneous adipose tissue. The resulting ratios served as metrics for analyzing the infiltration of fat into the muscle, offering insights into muscle quality. (E, F) The Quantification of Cross-Sectional Areas at Specific Vertebral Levels: These panels provided a visual and quantitative analysis of the cross-sectional areas at the C3 and L3 levels. An emphasis was placed on differentiating between muscular and adipose tissues, with muscular tissues highlighted in red and adipose tissues depicted in yellow. This color differentiation facilitated a clear visual distinction, which in turn supported the quantitative analysis by clearly delineating the areas of interest for accurate measurement.
2.5 Parameter analysis
To assess the relationships between single muscle and CSA muscle evaluation, we investigated correlations across several key metrics: PMI and SMI, IMAC and CSA IMAC, SCMI and C3-SMI, as well as P-IMAC and C3-CSA IMAC. To quantify these associations, Pearson’s correlation analyses were performed, followed by simple linear regression analysis to further elucidate the strength and nature of these relationships. Sex-, age, and stage-adjusted Cox proportional hazards models were created for each parameter for overall survival (OS), disease-free survival (DFS), and disease-specific survival (DSS). After every survey estimation, Harrell’s concordance index (C-index) of each model was evaluated for linear combinations of coefficients (29).
2.6 Statistical analysis
Statistical significance was determined by P values minor to 0.05. The Youden index was employed to determine the appropriate cutoff values for variable estimates. The Kaplan−Meier method was utilized to analyze the survival curves, and the log-rank test was performed to compare the survival curves between the two groups. Stata version 16 (StataCorp LLC, College Station, TX, USA) and GraphPad Prism version 9.5.0 for MacOS (GraphPad Software, San Diego, CA, USA) were used for all statistical analyses.
3 Results
3.1 Sample characteristics
Table 2 presents an overview of the patient characteristics. In summary, males accounted for over half of the patients (64%), and the average age was 68 years. The patients had a normal body mass index (BMI) on average. The primary tumors invaded the oral mucosa in various locations, including the tongue, gingiva, oral floor, buccal region, palate, and lip. At the time of diagnosis, 60% of patients had advanced disease (TNM stages III and IV). The 5-year disease-specific survival rate for all patients was 88.1%, the 5-year disease-free survival rate was 69.9%, and the 5-year overall survival rate was 79.7%. The median duration of follow-up was 1060 days. The Kaplan−Meier curves and the number of subjects at risk of overall DSS, DFS, and OS, alongside graphical representations of the number of subjects at risk over time was shown in Figure 3. These results provided a comprehensive overview of survival outcomes and subject risk, employing Kaplan-Meier estimations to elucidate the temporal dynamics of survival and disease progression among the samples.
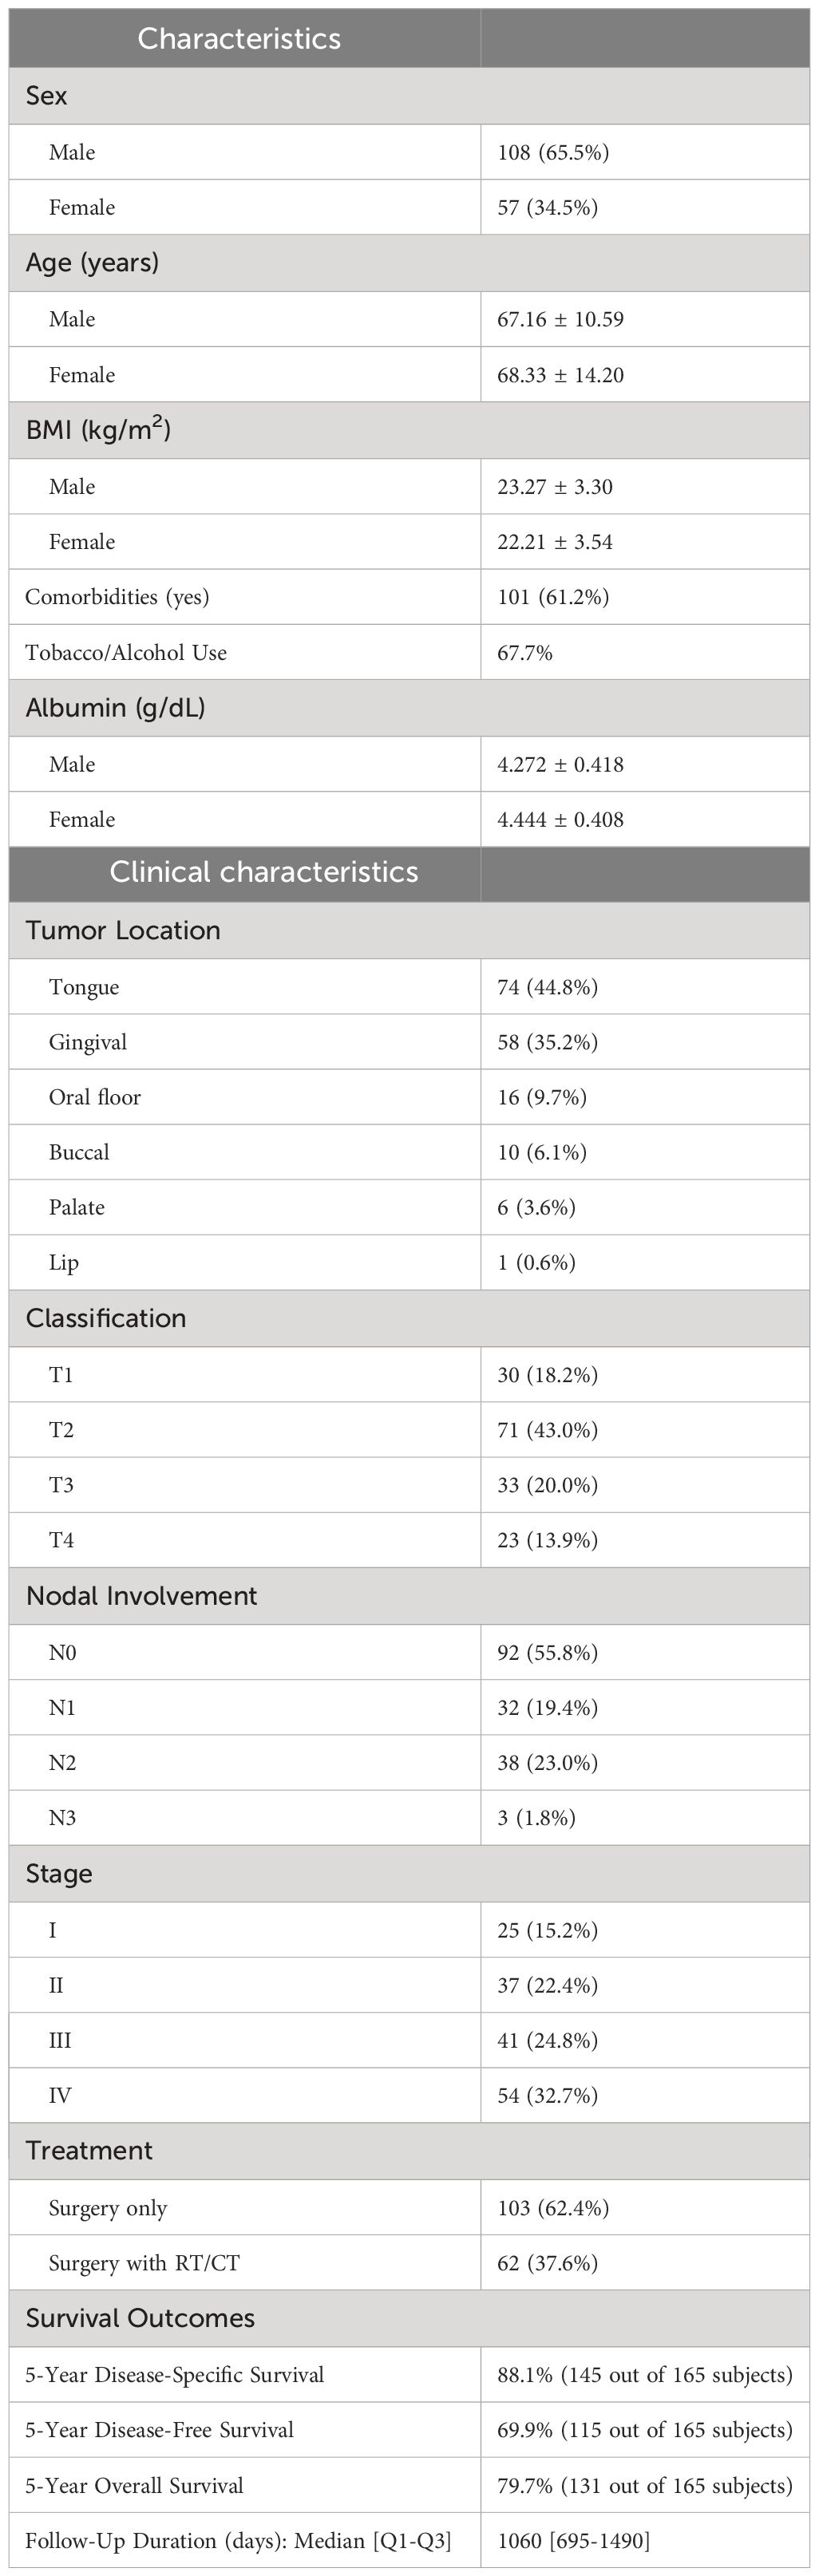
Table 2 Sample characteristics. (A) Demographic and clinical characteristics of the study population (n=165).
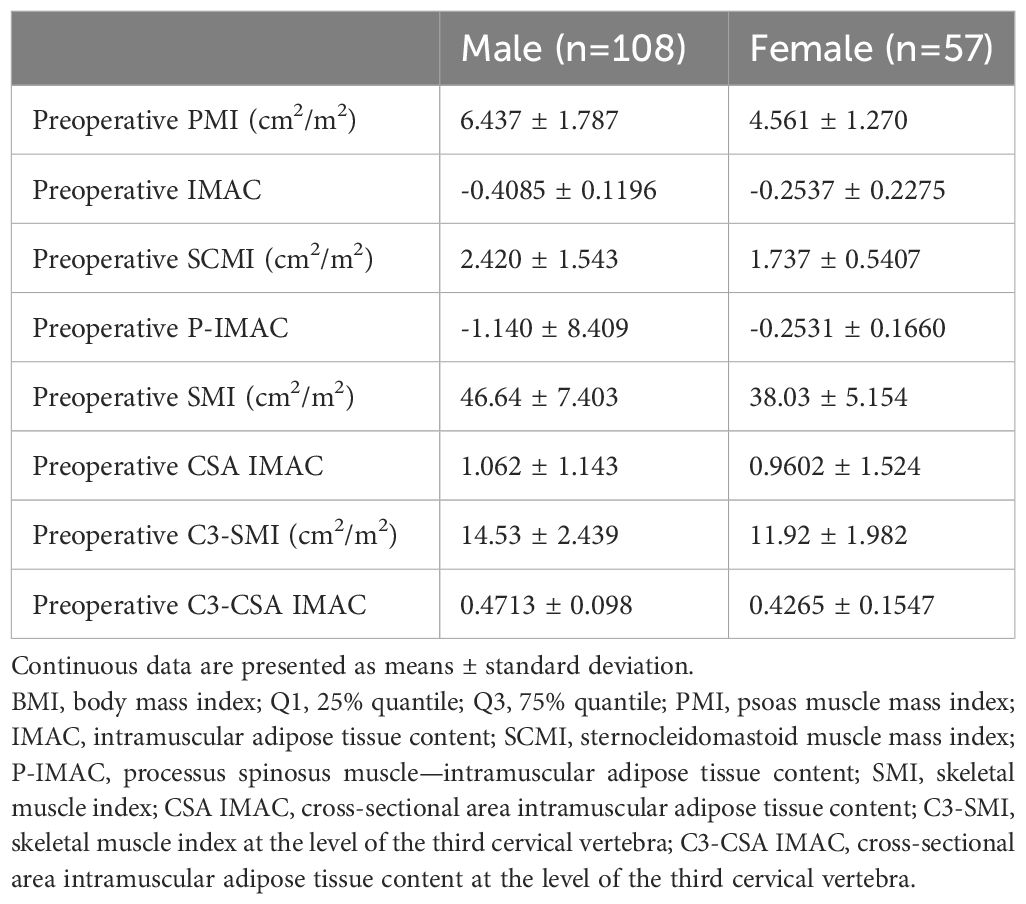
Table 2 (B) Image and preoperative parameters.
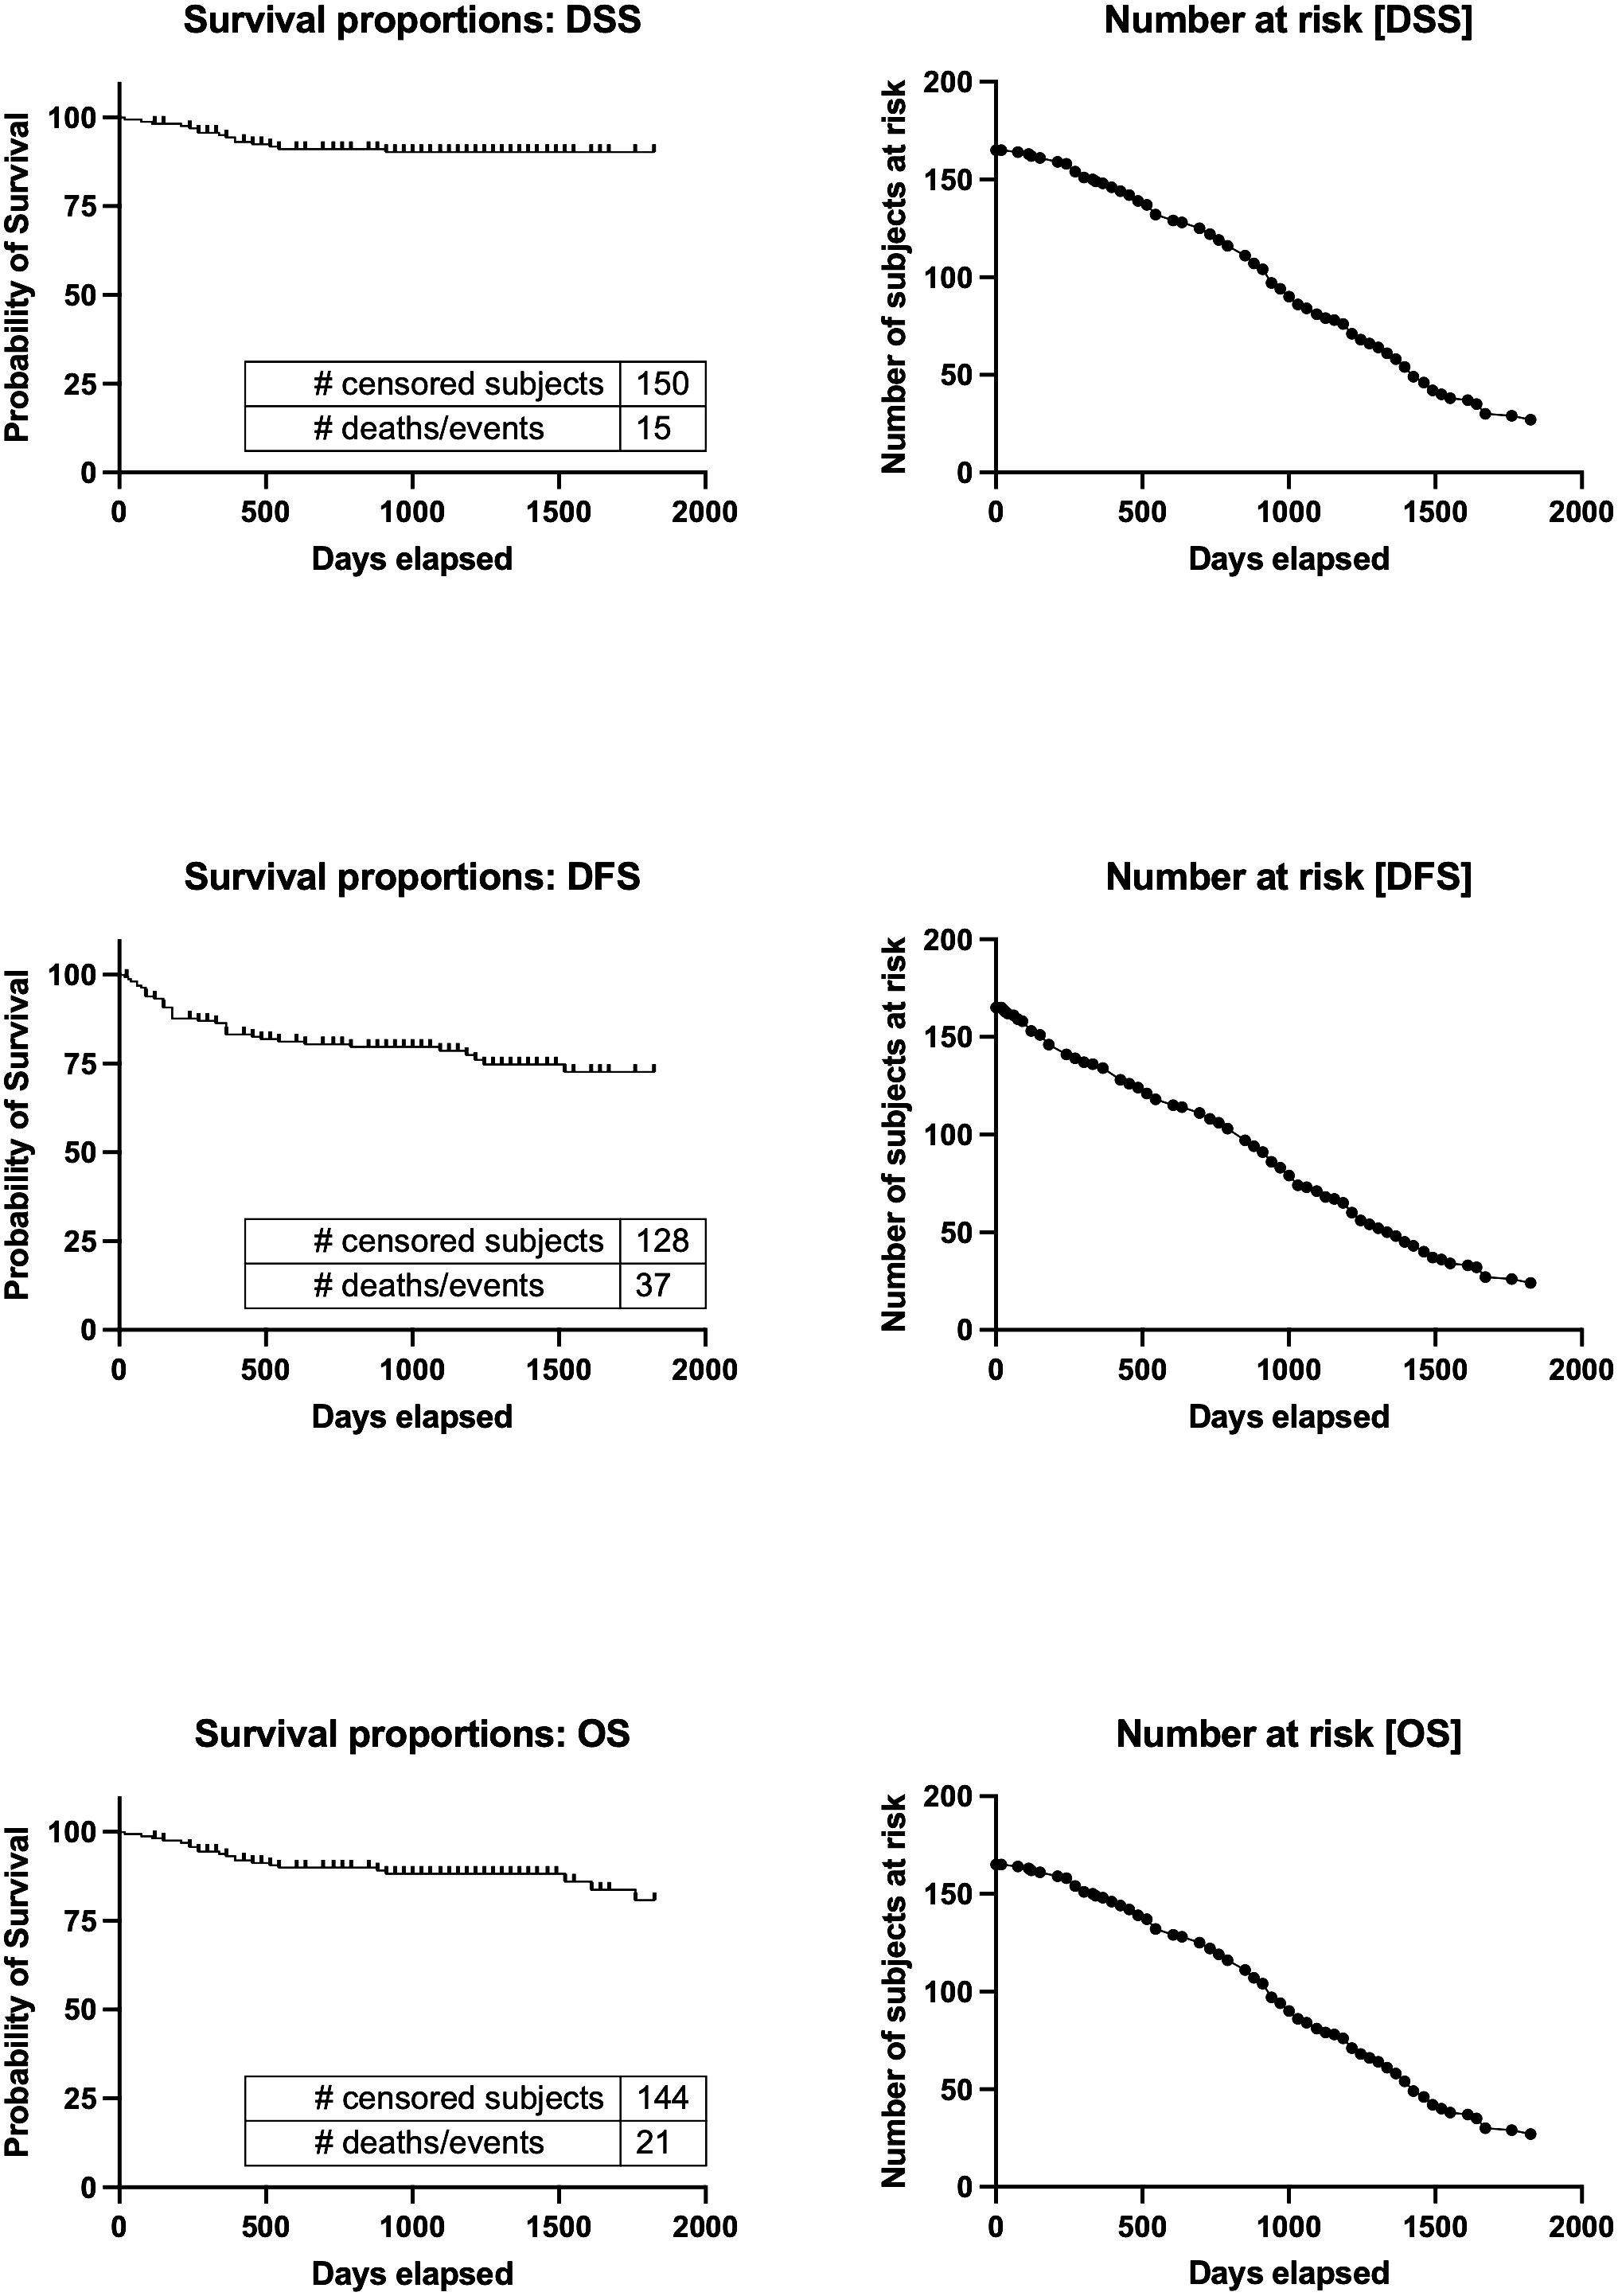
Figure 3 Kaplan−Meier curves and the number of subjects at risk of overall DSS, DFS, and OS. Kaplan-Meier survival curves for Disease-Specific Survival (DSS), Disease-Free Survival (DFS), and Overall Survival (OS), alongside the number of subjects at risk over a timeline extending to 2000 days. It illustrates survival probabilities from diagnosis, detailing the chance of avoiding disease-specific death, recurrence, and any cause of death, respectively. Through censoring points and event occurrences, the figure reveals trends in survival probabilities across different periods. Additionally, it highlights the changing cohort size at risk at key intervals, providing a dynamic view of the study population’s survival over time. This visualization offers a succinct overview of survival outcomes and temporal disease progression dynamics. DSS, disease-specific survival; DFS, disease-free survival; OS, overall survival.
3.2 The correlations between the single muscle evaluation and cross-sectional area muscle evaluation
Significant correlations were identified in several muscle and adipose tissue indices in our study. The relationship between C3-CSA IMAC and P-IMAC was demonstrated with a Pearson correlation coefficient (r) of 0.4082 (95% CI: 0.2273 - 0.5919; P<0.0001; Figure 4A), and a regression slope of 0.3334 (95% CI: 0.1815 – 0.4852), yielding a t-value of 19.0 at 95 degrees of freedom (P<0.0001) and an explained variance of 16.67% (r² = 0.1667). Similarly, CSA-IMAC and IMAC showed a Pearson’s r of 0.7136 (95% CI: 0.6295 - 0.7812; P<0.0001; Figure 4B), with a regression slope of 0.3794 (95% CI: 0.3218 – 0.4370), t-value of 169.1 at 163 degrees of freedom (P<0.0001), and an r² of 0.5093. The correlation between C3-SMI and SCMI was also strong, with a Pearson’s r of 0.6702 (95% CI: 0.5761 - 0.7468; P<0.0001; Figure 4C), regression slope of 2.792 (95% CI: 2.312 – 3.272), t-value of 132.1 at 162 degrees of freedom (P<0.0001), and an r² of 0.4492. Finally, PMI and SMI correlation yielded a Pearson’s r of 0.6210 (95% CI: 0.5173 - 0.7067; P<0.0001; Figure 4D), with a slope of 2.632 (95% CI: 2.118 – 3.416), t-value of 102.3 at 163 degrees of freedom (P<0.0001), and an r² of 0.3857. These analyses underscore significant associations between key indices of muscle and adipose tissue composition, highlighting the interconnectedness of these metrics in the context of patient evaluation and disease prognosis.
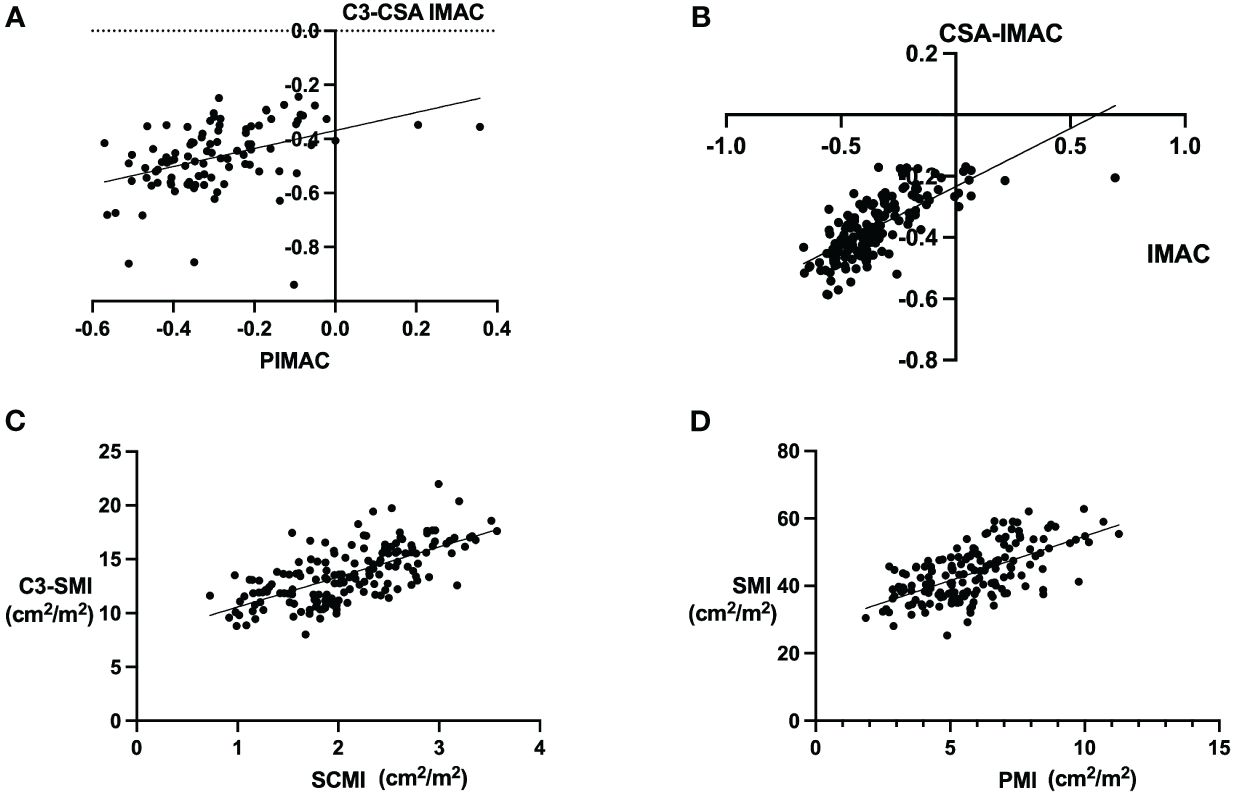
Figure 4 Correlations between the single muscle evaluation and cross-sectional area (CSA) muscles. The image shows correlations between various muscular and adipose tissue metrics as determined by Pearson’s correlation coefficient. Panel (A) displays the relationship between cross-sectional area (CSA) at the cervical level 3 (C3) intermuscular adipose composition (IMAC) and posterior intermuscular adipose tissue composition (P-IMAC), revealing a Pearson’s r value of 0.4082 (P<0.0001). Panel (B) demonstrates the correlation between CSA-IMAC and IMAC, with a Pearson’s r of 0.7136 (P<0.0001). Panel (C) presents the association between C3 spinal muscle index (SMI) and spinal cord muscle index (SCMI), indicating a Pearson’s r of 0.6702 (P<0.0001). Lastly, Panel (D) shows the correlation between psoas muscle index (PMI) and SMI, with a Pearson’s r of 0.6210 (P<0.0001). These analyses underscore significant associations between key indices of muscle and adipose tissue composition, highlighting the interconnectedness of these metrics in the context of patient evaluation and disease prognosis.
3.3 Evaluation and comparison of Cox proportional hazards models of survival time analysis with the C-index
Table 3 displays the discriminating power of P-IMAC and SCMI in predicting OS, DFS, and DSS prognosis. P-IMAC demonstrated the strongest discriminating power for predicting OS, with a C-index of 0.799 (95% CI 0.731-0.866), followed by SCMI with a C-index of 0.790 (95% CI 0.689-0.892). Similarly, P-IMAC had the strongest discriminating power for predicting DFS, with a C-index of 0.742 (95% CI 0.653-0.831), followed by SCMI with a C-index of 0.647 (95% CI 0.549-0.746). In predicting DSS, P-IMAC showed the strongest discriminating power with a C-index of 0.825 (95% CI 0.753-0.896), followed by SCMI with a C-index of 0.824 (95% CI 0.722-0.927). Patients were divided into two groups based on their P-IMAC levels: those with “normal P-IMAC” below the cutoff values and those with “high P-IMAC” above the cutoff values. High P-IMAC patients had significantly poorer survival rates in DSS, DFS, and OS than normal P-IMAC patients (P<0.0001; Figure 5). P-IMAC cutoff values for males and females were as follows: DSS: -0.3036 (AUC=0.86; sensitivity, 100%; specificity, 68%) and -0.2345 (AUC=0.67; sensitivity, 100%; specificity, 68%); DFS: -0.3036 (AUC=0.75; sensitivity, 72.2%; specificity, 70%) and -0.2345 (AUC=0.79; sensitivity, 79.0%; specificity, 79.0%); OS: -0.3393 (AUC=0.82; sensitivity, 100%; specificity, 58.5%) and -0.2345 (AUC=0.67; sensitivity, 100%; specificity, 68%).
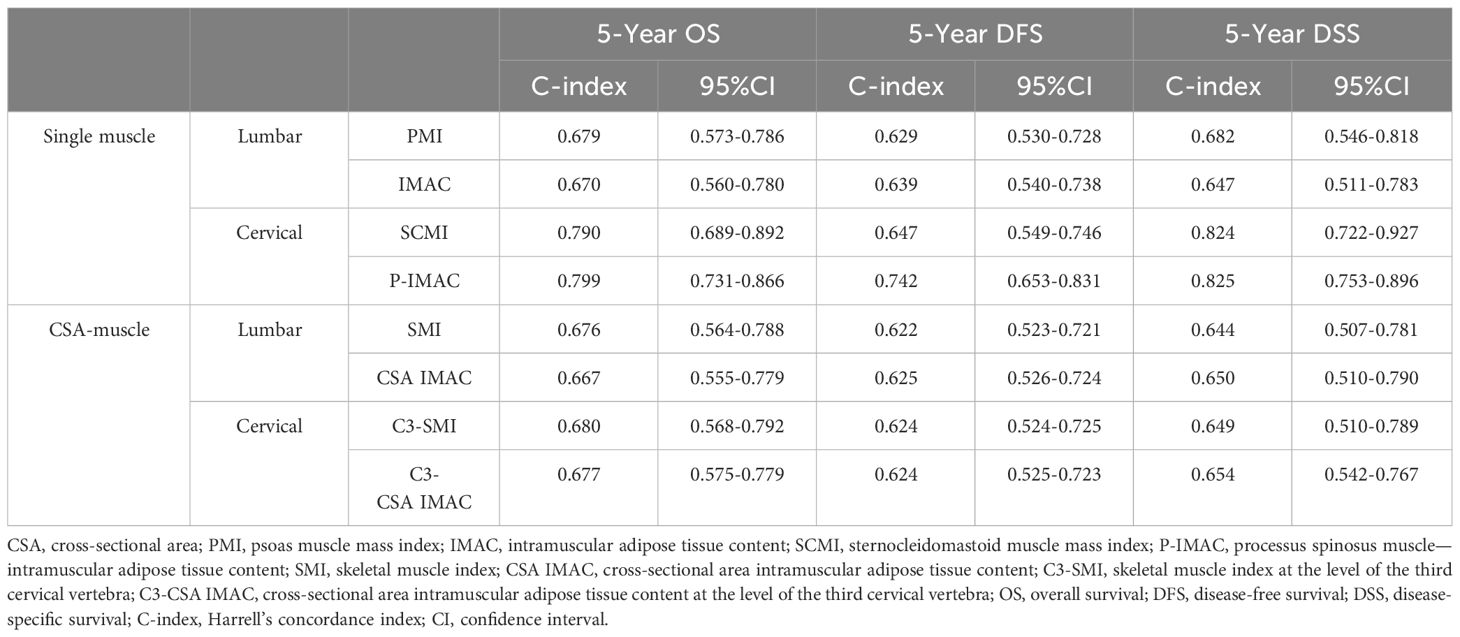
Table 3 Harrell’s concordance index (C-index) in sex-, age, and stage-adjusted Cox proportional regression analysis.
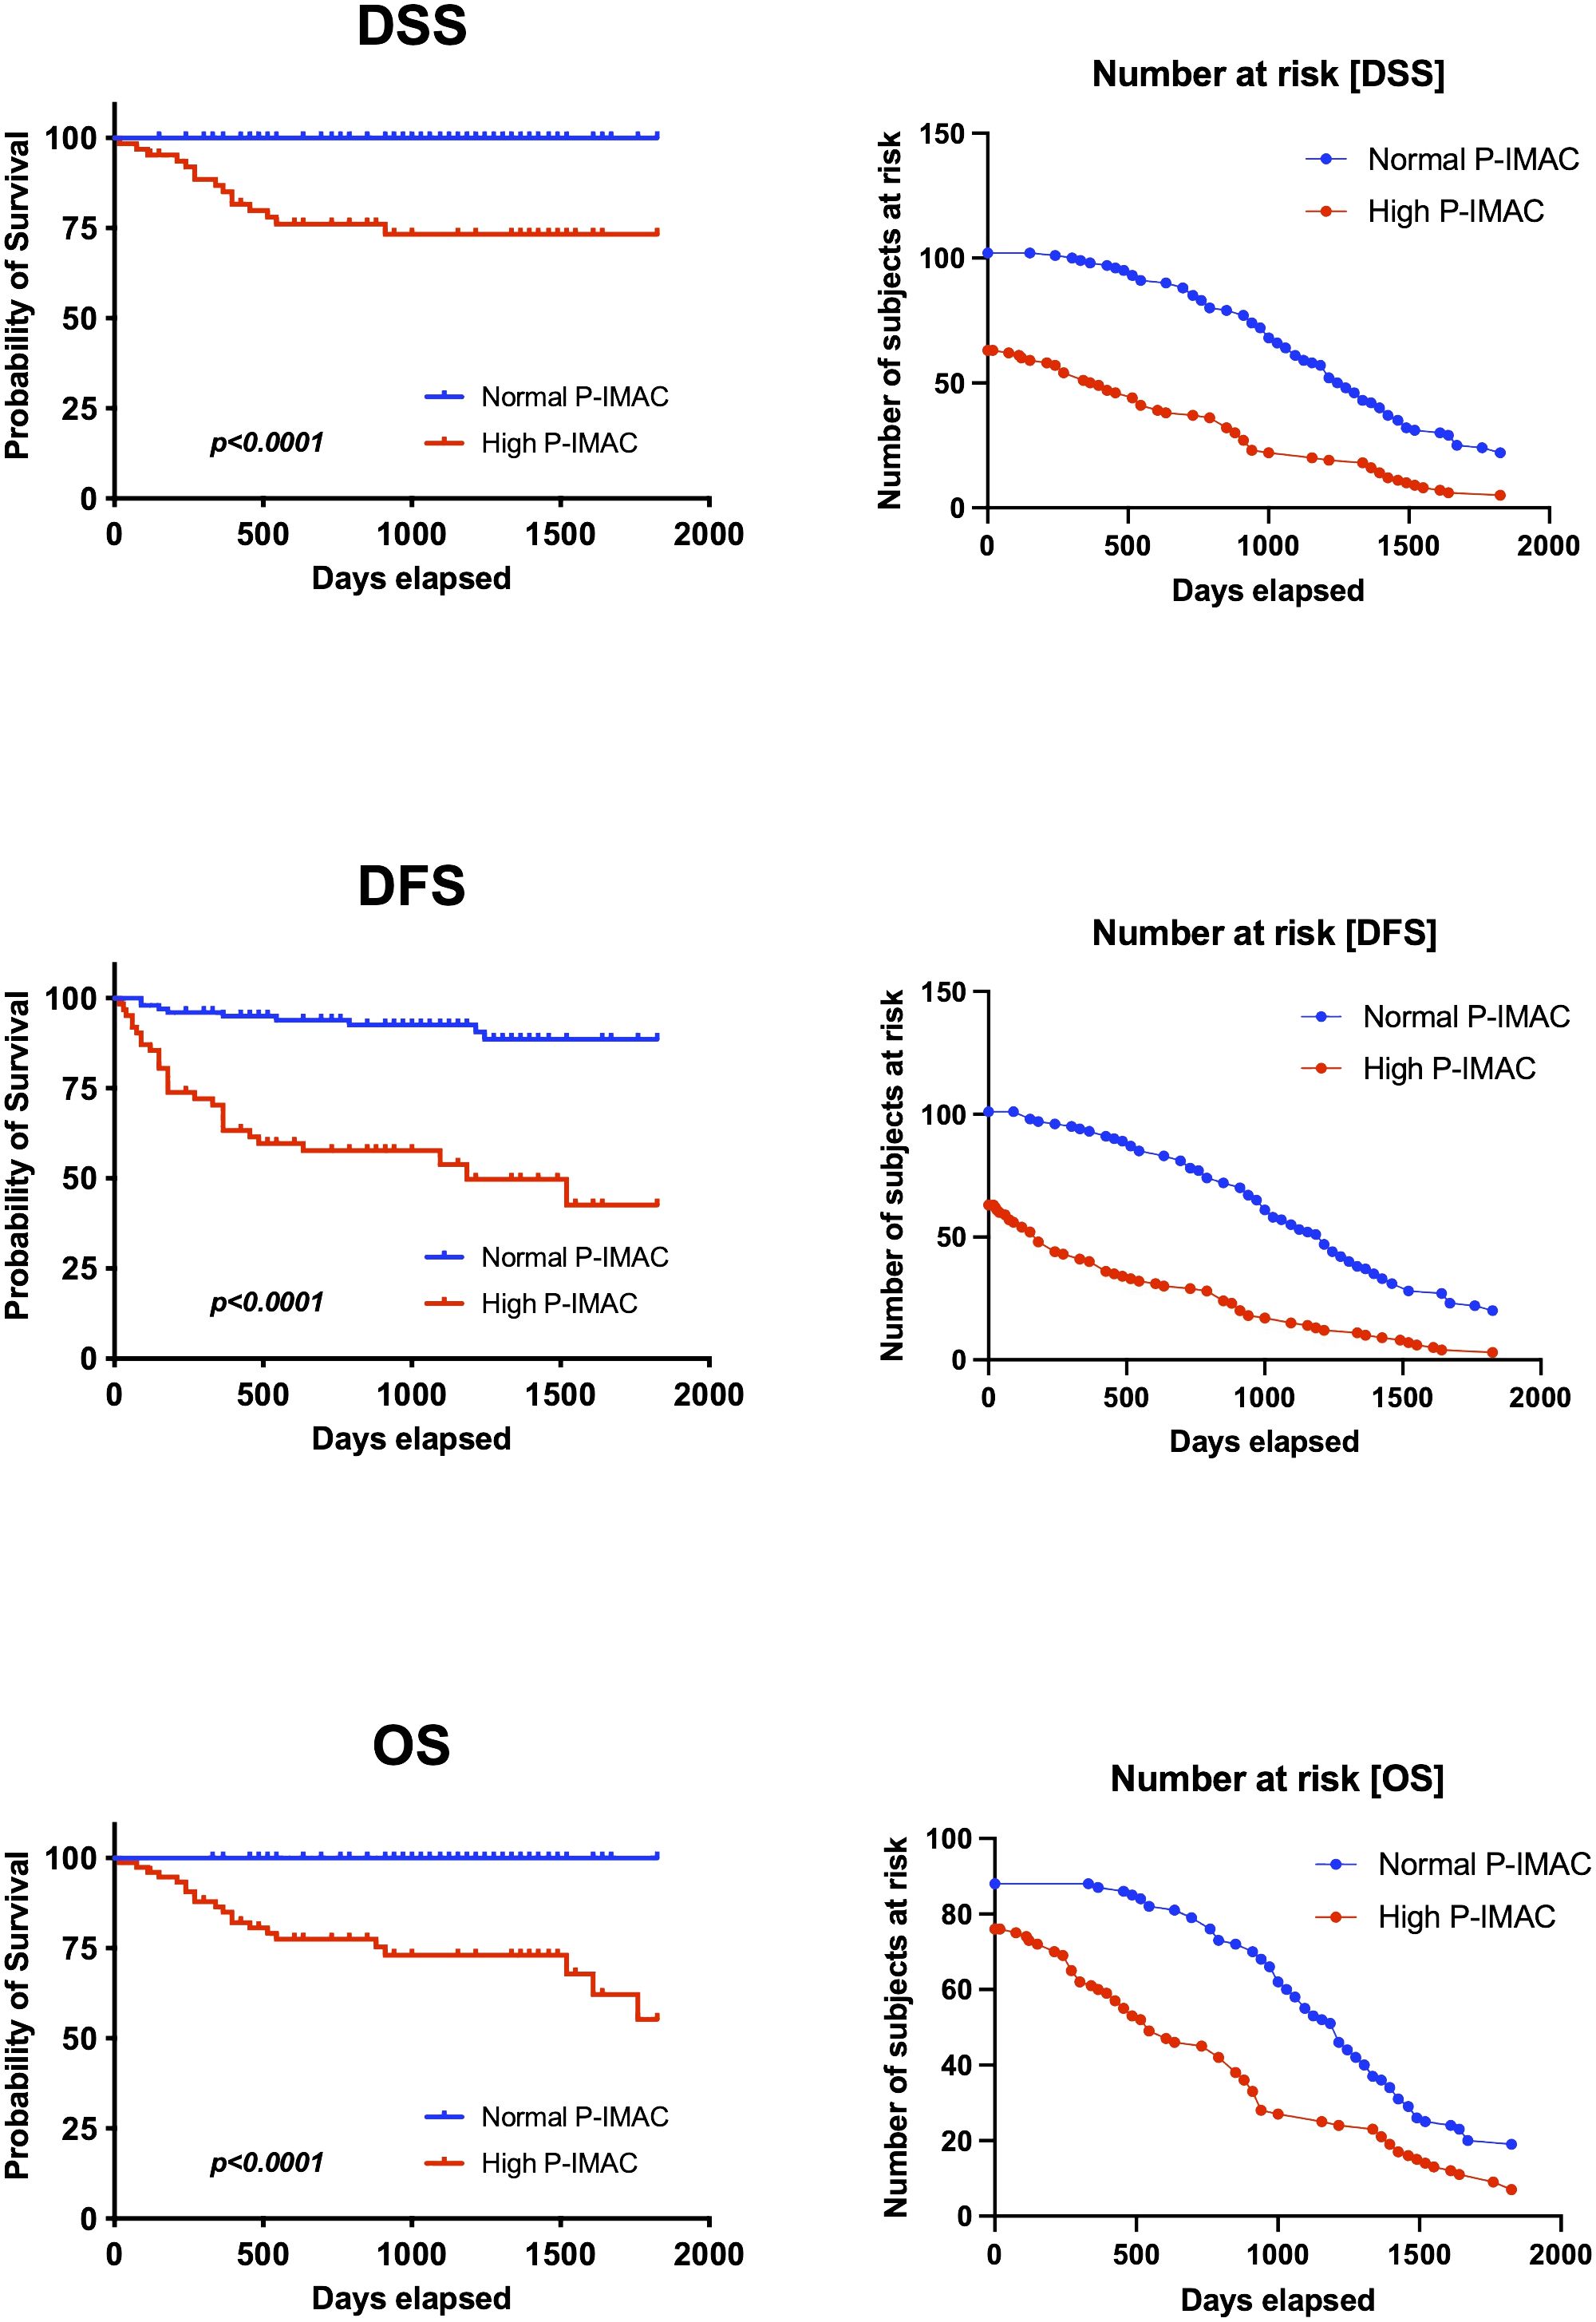
Figure 5 Survival analysis. P-IMAC quantifies the intramuscular adipose tissue content within the processus spinosus muscle. The analysis distinctly showed that subjects classified within the high P-IMAC group exhibit significantly lower survival rates across all measured endpoints when compared to those in the normal P-IMAC group. P-IMAC, processus spinosus muscle—intramuscular adipose tissue content; OS, overall survival; DFS, disease-free survival; DSS, disease-specific survival.
4 Discussion
This study retrospectively evaluated the prognostic value of single muscle assessment compared to whole cross-sectional area in patients with OSCC, and is the first attempt to determine which assessment method more accurately predicts prognosis in OSCC patients. Our findings fill an important gap in oncology research and introduce a new perspective on prognostic assessment, which may have a significant impact on patient management and treatment planning. The focus of previous studies has been on the relationship between whole muscle assessment and single muscle assessment (30, 31). Our study suggests that single muscle evaluation using cervical muscle CT scans is the most accurate predictor of 5-year overall survival, disease-free survival, and disease-specific survival in OSCC patients. In a previous study, we found that OSCC patients with low preoperative muscle mass (indicated by a low PMI) and high preoperative muscle volume (indicated by a high IMAC) had significantly lower disease specificity than the control group (24). It has also been suggested that SCMI and P-IMAC, which are C3-level muscle evaluations, may be superior to L3-level muscle evaluations among single muscles (25). The present study supports these previous studies and further indicates that the evaluation of a single neck muscle may be more useful than the evaluation of the CSA of the neck or lumbar in predicting a patient’s prognosis.
Sarcopenia is significantly influenced by molecular mechanisms, particularly in the context of cancer (32). Chronic systemic inflammation, marked by elevated levels of cytokines such as TNF-α and IL-6 (33), plays a pivotal role in muscle degradation. The ubiquitin-proteasome system, with key enzymes like Atrogin-1 and MuRF1, accelerates muscle protein breakdown, contributing to sarcopenia (34). Additionally, myostatin and activins inhibit muscle growth through the Smad 2/3 signaling pathway (35). Insulin resistance and mitochondrial dysfunction further exacerbate muscle loss by impairing energy production and increasing oxidative stress (36). Hormonal fluctuations, especially in testosterone and growth hormone, also contribute to sarcopenia’s development (37). Our findings, particularly the correlation between higher P-IMAC and poorer survival outcomes, align with the complex interplay of sarcopenia’s molecular mechanisms in cancer prognosis. Our study underscores the pivotal role of sarcopenia, propelled by multifaceted molecular dynamics, as a significant prognostic factor in OSCC, highlighting the potential of single-muscle CT evaluations in refining prognostic assessments and tailoring patient care strategies.
Treatments for patients with OSCC, such as surgery, radiation therapy, and chemotherapy, can significantly affect a patient’s ability to eat and swallow. In patients with OSCC, there is a significant relationship between low food intake and sarcopenia. Pain, mouth sores, difficulty chewing and swallowing, and changes in taste and appetite are common side effects of OSCC treatment (6). Dysphagia can make it difficult to consume adequate food and, if not managed appropriately, can lead to reduced food intake, malnutrition, and muscle wasting, such as sarcopenia. Nutritional deficiencies impair muscle protein synthesis, increase muscle breakdown, and accelerate the development of sarcopenia. In this context, past literature emphasizes the importance of optimal protein intake for preventing and managing sarcopenia, especially in the elderly (38–41). Exercise interventions, especially resistance training, have shown promising results in combating sarcopenia by increasing muscle mass, strength, and function (42). In addition, nutritional strategies focused on adequate protein intake and potentially beneficial supplements such as vitamin D, calcium, and branched-chain amino acids (BCAAs) provide another important avenue for sarcopenia management (41, 43). On the other hand, no studies have yet been conducted on OSCC patients, and further research is needed to prove the usefulness of these strategies in OSCC patients. Our study highlights the predictive value of a single muscle assessment for OSCC patient’s prognosis and integration of sarcopenia management into patient care, emphasizes the need for clinical trials to evaluate the effectiveness of exercise and nutrition interventions, and further research on their optimal timing, intensity, and customization to OSCC treatment strategies will provide important insights into the effective integration of sarcopenia management.
It is still a matter of debate as to which muscles best reflect systemic sarcopenia. Single muscle assessment is very simple and convenient (44), whereas total skeletal muscle mass assessment using automated total muscle segmentation on CT images is not very versatile in actual clinical practice in general clinics. However, since both muscle and intramuscular adipose tissue were measured in the single muscle assessment, the single muscle does not always reflect the actual muscle mass (45). Thus, expert panels have suggested that a single sentinel muscle is not recommended for diagnosing sarcopenia (46–48), as it is difficult to claim that one muscle is representative (20). Yoon et al. reported that cervical muscle strength assessment does not adequately reflect whole-body sarcopenia (49), while Bril et al. concluded that CSA at C3 can provide a good estimate of skeletal muscle mass (SMM) in patients with head and neck cancer, without the need for additional diagnostic procedures and with minimal effort and with considerable accuracy at present (30). However, in line with the study on Japanese patients with OSCC (31), they acknowledge that estimation of CSA at L3 based on CSA at C3 is not ideal and may overestimate patients with low SMM (30) Bril et al. also concluded that estimation of CSA is probably not sufficient as the most accurate estimator of a patient’s total SMM because the problem that a single muscle may not reflect the whole-body SMM, as concluded by Baracos et al. (20), probably applies to CSA on a single CT slice representing whole-body SMM (30). In a previous study, we suggested that assessing both PMI and IMAC (i.e., evaluating different muscles in combination) could serve as a substitute for evaluating muscle strength and function and could be the most suitable parameter for evaluating preoperative sarcopenia (24). Our study aimed to compare the quantification of skeletal muscle mass using both single muscle evaluation and CSA in CT images. Our findings indicate that single muscle evaluation had superior discrimination with the C-index compared to CSA. These results offer valuable insights into the ongoing debate about the usefulness of single-muscle versus CSA assessments.
There are several limitations to this study. First, sliceOmatic® is designed by semiautomatically identifying a range of CT values; however, the design also includes other adjacent muscles and other tissues with the same CT value. Ultimately, the measurer must identify and design the tissues, which may lead to measurement errors. Second, because this was a retrospective study in a single cohort, patient selection bias could not be eliminated, and the generalizability of the findings may be limited. Because a control group of healthy subjects who were not head and neck cancer patients was not measured, the quality and quantity of each muscle could not be compared to a healthy control group. Recognizing the importance of validation, we acknowledge that cross-validation with another cohort with identical parameters and cutoff values is essential to confirm the applicability and robustness of these results. Future studies will incorporate independent cohorts to address this limitation, which will help establish the reliability and broad applicability of our findings in diverse patient populations. Third, because the measurements were performed by a single measurer, reliability, and validity have not been verified. Therefore, it is necessary to conduct measurements by multiple measures in the future to verify errors and confirm reproducibility. Fourth, the cutoff values for PMI and IMAC, as well as SCMI and P-IMAC, were established about the methods used in our previous studies (24, 25). The European Working Group on Sarcopenia in Older People (EWGSOP2) guidelines offer cutoff points for simple and specific measurements (50). However, importantly, these values were derived from primarily Caucasian populations and may not be directly applicable to Asian populations due to differences in body size, lifestyle, and ethnicity (51). Therefore, future prospective longitudinal intervention studies will be necessary to validate the proposed cutoff values. Lastly, the omission of a comprehensive assessment of adverse events related to oncologic treatment using established standard terminology criteria for adverse events (CTCAE). Furthermore, the Edmonton Symptom Assessment System (ESAS) subjective global rating scale, which comprehensively assesses patient symptoms and their severity, was not employed. The exclusion of these assessments precludes a detailed understanding of treatment-related side effects and their impact on patient quality of life, which is crucial to a holistic oncologic care approach. Future studies will incorporate these methodologies to provide a more comprehensive analysis of oncologic treatment outcomes and a better understanding of the balance between treatment efficacy and management of side effects. Incorporation of these methodologies will allow treatment to be tailored to minimize adverse effects on patient well-being and enhance overall treatment strategies, which is expected to contribute significantly to optimizing patient care.
Although the above limitations must be considered, this study suggests that a focus on single-strand assessment with CT imaging may provide better prognostic information for patients with oral squamous cell carcinoma. Incorporating this approach into clinical practice could enhance treatment decision-making and patient management strategies. However, individual clinical judgment must always be made, considering the characteristics of each patient and referring to other relevant evidence and guidelines.
5 Conclusions
Our study indicates that while CT imaging-based assessment of single muscles may have slight differences in prognostic predictions for OSCC patients compared to the evaluation of entire muscles through semiautomated segmentation, the results do not conclusively establish superior reliability. The overlapping confidence intervals for the C-index among the markers suggest that both methods provide comparably valuable prognostic information, while the simplicity and direct clinical applicability of single-muscle assessment might offer practical advantages. Given these findings, further prospective studies are essential to substantiate the clinical relevance and potentially refine the prognostic utility of single muscle assessment in this patient population.
Data availability statement
The raw data supporting the conclusions of this article will be made available by the authors, without undue reservation.
Ethics statement
The studies involving humans were approved by Institutional Ethics Committee of Kagoshima University (permission No. 160319). The studies were conducted in accordance with the local legislation and institutional requirements. Written informed consent for participation was not required from the participants or the participants’ legal guardians/next of kin because due to the nature of the investigation, patient consent was not obtained. Instead, an opt-out approach was implemented, and a notification was posted on the Kagoshima University Hospital website to obtain authorization for this study.
Author contributions
HT: Investigation, Writing – original draft. TY: Conceptualization, Formal Analysis, Funding acquisition, Investigation, Methodology, Writing – review & editing. HS: Conceptualization, Formal Analysis, Funding acquisition, Writing – original draft, Writing – review & editing. YH: Investigation, Writing – review & editing. MT: Validation, Writing – review & editing. TI: Data curation, Software, Writing – review & editing. KI: Data curation, Validation, Writing – review & editing. MA: Writing – review & editing. HA: Writing – review & editing. YN: Supervision, Writing – review & editing. YI: Supervision, Writing – review & editing. AI: Conceptualization, Writing – review & editing. NN: Conceptualization, Project administration, Writing – review & editing.
Funding
The author(s) declare financial support was received for the research, authorship, and/or publication of this article. This study was supported in part by JSPS KAKENHI (Grant Numbers 22K10152 and 22K10196).
Conflict of interest
The authors declare that the research was conducted in the absence of any commercial or financial relationships that could be construed as a potential conflict of interest.
Publisher’s note
All claims expressed in this article are solely those of the authors and do not necessarily represent those of their affiliated organizations, or those of the publisher, the editors and the reviewers. Any product that may be evaluated in this article, or claim that may be made by its manufacturer, is not guaranteed or endorsed by the publisher.
References
1. Siegel RL, Miller KD, Fuchs HE, Jemal A. Cancer statistics, 2022. CA Cancer J Clin. (2022) 72:7–33. doi: 10.3322/caac.21708
2. Mosaddad SA, Beigi K, Doroodizadeh T, Haghnegahdar M, Golfeshan F, Ranjbar R, et al. Therapeutic applications of herbal/synthetic/bio-drug in oral cancer: An update. Eur J Pharmacol. (2021) 890:173657. doi: 10.1016/J.EJPHAR.2020.173657
3. Chamoli A, Gosavi AS, Shirwadkar UP, Wangdale KV, Behera SK, Kurrey NK, et al. Overview of oral cavity squamous cell carcinoma: Risk factors, mechanisms, and diagnostics. Oral Oncol. (2021) 121:105451. doi: 10.1016/J.ORALONCOLOGY.2021.105451
4. Amit M, Yen TC, Liao CT, Chaturvedi P, Agarwal JP, Kowalski LP, et al. Improvement in survival of patients with oral cavity squamous cell carcinoma: An international collaborative study. Cancer. (2013) 119:4242–8. doi: 10.1002/CNCR.28357
5. Epstein JB, Thariat J, Bensadoun R-J, Barasch A, Murphy BA, Kolnick L, et al. Oral complications of cancer and cancer therapy: from cancer treatment to survivorship. CA Cancer J Clin. (2012) 62:400–22. doi: 10.3322/CAAC.21157
6. Warnakulasuriya S. Global epidemiology of oral and oropharyngeal cancer. Oral Oncol. (2009) 45:309–16. doi: 10.1016/J.ORALONCOLOGY.2008.06.002
7. Swartz JE, Pothen AJ, Wegner I, Smid EJ, Swart KMA, de Bree R, et al. Feasibility of using head and neck CT imaging to assess skeletal muscle mass in head and neck cancer patients. Oral Oncol. (2016) 62:28–33. doi: 10.1016/j.oraloncology.2016.09.006
8. Lieffers JR, Bathe OF, Fassbender K, Winget M, Baracos VE. Sarcopenia is associated with postoperative infection and delayed recovery from colorectal cancer resection surgery. Br J Cancer. (2012) 107:931–6. doi: 10.1038/bjc.2012.350
9. Findlay M, White K, Stapleton N, Bauer J. Is sarcopenia a predictor of prognosis for patients undergoing radiotherapy for head and neck cancer? A meta-analysis. Clin Nutr. (2021) 40:1711–8. doi: 10.1016/j.clnu.2020.09.017
10. Ito N, Funasaka K, Miyahara R, Furukawa K, Yamamura T, Ishikawa T, et al. Relationship between psoas muscle index and long-term survival in older patients aged ≥ 80 years after endoscopic submucosal dissection for gastric cancer. Int J Clin Oncol. (2022) 27:729–38. doi: 10.1007/s10147-021-02112-6
11. Orzell S, Verhaaren BFJ, Grewal R, Sklar M, Irish JC, Gilbert R, et al. Evaluation of sarcopenia in older patients undergoing head and neck cancer surgery. Laryngoscope. (2022) 132:356–63. doi: 10.1002/lary.29782
12. Meerkerk CDA, Chargi N, de Jong PA, van den Bos F, de Bree R. Low skeletal muscle mass predicts frailty in elderly head and neck cancer patients. Eur Arch Oto-Rhino-Laryngology. (2022) 279:967–77. doi: 10.1007/s00405-021-06835-0
13. Prado CM, Lieffers JR, McCargar LJ, Reiman T, Sawyer MB, Martin L, et al. Prevalence and clinical implications of sarcopenic obesity in patients with solid tumours of the respiratory and gastrointestinal tracts: a population-based study. Lancet Oncol. (2008) 9:629–35. doi: 10.1016/S1470-2045(08)70153-0
14. Steffl M, Bohannon RW, Sontakova L, Tufano JJ, Shiells K, Holmerova I. Relationship between sarcopenia and physical activity in older people: a systematic review and meta-analysis. Clin Interv Aging. (2017) 12:835–45. doi: 10.2147/CIA.S132940
15. Miyamoto Y, Baba Y, Sakamoto Y, Ohuchi M, Tokunaga R, Kurashige J, et al. Sarcopenia is a negative prognostic factor after curative resection of colorectal cancer. Ann Surg Oncol. (2015) 22:2663–8. doi: 10.1245/s10434-014-4281-6
16. Chargi N, Bril SI, Emmelot-Vonk MH, de Bree R. Sarcopenia is a prognostic factor for overall survival in elderly patients with head-and-neck cancer. Eur Arch Oto-Rhino-Laryngology. (2019) 276:1475–86. doi: 10.1007/s00405-019-05361-4
17. Sun C, Anraku M, Kawahara T, Karasaki T, Konoeda C, Kitano K, et al. Combination of skeletal muscle mass and density predicts postoperative complications and survival of patients with non-small cell lung cancer. Ann Surg Oncol. (2022) 29:1816–24. doi: 10.1245/s10434-021-11024-8
18. Lin SC, Lin YS, Kang BH, Yin CH, Chang KP, Chi CC, et al. Sarcopenia results in poor survival rates in oral cavity cancer patients. Clin Otolaryngol. (2020) 45:327–33. doi: 10.1111/COA.13481
19. Graves JP, Daher GS, Bauman MMJ, Moore EJ, Tasche KK, Price DL, et al. Association of sarcopenia with oncologic outcomes of primary treatment among patients with oral cavity cancer: A systematic review and meta-analysis. Oral Oncol. (2023) 147. doi: 10.1016/J.ORALONCOLOGY.2023.106608
20. Baracos VE. Psoas as a sentinel muscle for sarcopenia: a flawed premise. J Cachexia Sarcopenia Muscle. (2017) 8:527–8. doi: 10.1002/jcsm.12221
21. de Bree R, Meerkerk CDA, Halmos GB, Mäkitie AA, Homma A, Rodrigo JP, et al. Measurement of sarcopenia in head and neck cancer patients and its association with frailty. Front Oncol. (2022) 12:884988. doi: 10.3389/fonc.2022.884988
22. Chargi N, Bril SI, Smid EJ, de Jong PA, De Bree R. Cut-off values for low skeletal muscle mass at the level of the third cervical vertebra (C3) in patients with head and neck cancer. Quant Imaging Med Surg. (2022) 12:3024–33. doi: 10.21037/qims-21-911
23. Pałasz P, Adamski Ł, Górska-Chrząstek M, Starzyńska A, Studniarek M. Contemporary diagnostic imaging of oral squamous cell carcinoma – A review of literature. Pol J Radiol. (2017) 82:193–202. doi: 10.12659/PJR.900892
24. Yoshimura T, Suzuki H, Takayama H, Higashi S, Hirano Y, Tezuka M, et al. Impact of preoperative low prognostic nutritional index and high intramuscular adipose tissue content on outcomes of patients with oral squamous cell carcinoma. Cancers. (2020) 12:3167. doi: 10.3390/CANCERS12113167
25. Yoshimura T, Suzuki H, Takayama H, Higashi S, Hirano Y, Tezuka M, et al. Prognostic role of preoperative sarcopenia evaluation of cervical muscles with long-term outcomes of patients with oral squamous cell carcinoma. Cancers (Basel). (2021) 13. doi: 10.3390/cancers13184725
26. Rollins KE, Gopinath A, Awwad A, Macdonald IA, Lobo DN. Computed tomography-based psoas skeletal muscle area and radiodensity are poor sentinels for whole L3 skeletal muscle values. Clin Nutr. (2020) 39:2227–32. doi: 10.1016/j.clnu.2019.10.003
27. Edge SB, Byrd DR, Compton CC, Fritz AG, Fritz ctr A, Reno A, et al. AJCC CANCER STAGING MANUAL Seventh Edition (2010). New York: Springer. Available online at: www.springer.com (Accessed April 8, 2024).
28. Grégoire V, Lefebvre JL, Licitra L, Felip E. Squamous cell carcinoma of the head and neck: EHNS-ESMO-ESTRO clinical practice guidelines for diagnosis, treatment and follow-up. Ann Oncol. (2010) 21. doi: 10.1093/annonc/mdq185
29. Harrell FE, Califf RM, Pryor DB, Lee KL, Rosati RA. Evaluating the yield of medical tests. JAMA. (1982) 247:2543–6. doi: 10.1001/JAMA.1982.03320430047030
30. Bril SI, Chargi N, Wendrich AW, Wegner I, Bol GH, Smid EJ, et al. Validation of skeletal muscle mass assessment at the level of the third cervical vertebra in patients with head and neck cancer. Oral Oncol. (2021) 123:105617. doi: 10.1016/J.ORALONCOLOGY.2021.105617
31. Ohashi N, Koike K, Sakai K, Nishiyama K, Sasaki T, Ogi K, et al. Accurate estimation of skeletal muscle mass by comparison of computed tomographic images of the third lumbar and third cervical vertebrae in Japanese patients with oral squamous cell carcinoma. Oral Radiol. (2022) 1:1–10. doi: 10.1007/S11282-022-00653-8
32. Suzuki H, Asakawa A, Amitani H, Nakamura N, Inui A. Cancer cachexia–pathophysiology and management. J Gastroenterol. (2013) 48:574–94. doi: 10.1007/S00535-013-0787-0
33. Bano G, Trevisan C, Carraro S, Solmi M, Luchini C, Stubbs B, et al. Inflammation and sarcopenia: A systematic review and meta-analysis. Maturitas. (2017) 96:10–5. doi: 10.1016/J.MATURITAS.2016.11.006
34. Attaix D, Combaret L, Béchet D, Taillandier D. Role of the ubiquitin-proteasome pathway in muscle atrophy in cachexia. Curr Opin Support Palliat Care. (2008) 2:262–6. doi: 10.1097/SPC.0b013e3283196ac2
35. Baczek J, Silkiewicz M, Wojszel ZB. Myostatin as a biomarker of muscle wasting and other pathologies-state of the art and knowledge gaps. Nutrients. (2020) 12:2401. doi: 10.3390/NU12082401
36. Kim MJ, Sinam IS, Siddique Z, Jeon JH, Lee IK. The link between mitochondrial dysfunction and sarcopenia: an update focusing on the role of pyruvate dehydrogenase kinase 4. Diabetes Metab J. (2023) 47:153. doi: 10.4093/DMJ.2022.0305
37. Brameld JM, Buttery PJ, Dawson JM, Harper JMM. Nutritional and hormonal control of skeletal-muscle cell growth and differentiation. Proc Nutr Soc. (1998) 57:207–17. doi: 10.1079/PNS19980033
38. Cruz-Jentoft AJ, Bahat G, Bauer J, Boirie Y, Bruyère O, Cederholm T, et al. Sarcopenia: revised European consensus on definition and diagnosis. Age Ageing. (2019) 48:601. doi: 10.1093/AGEING/AFZ046
39. Prado CM, Purcell SA, Alish C, Pereira SL, Deutz NE, Heyland DK, et al. Implications of low muscle mass across the continuum of care: a narrative review. Ann Med. (2018) 50:675–93. doi: 10.1080/07853890.2018.1511918
40. Morley JE, Anker SD, von Haehling S. Prevalence, incidence, and clinical impact of sarcopenia: facts, numbers, and epidemiology-update 2014. J Cachexia Sarcopenia Muscle. (2014) 5:253–9. doi: 10.1007/s13539-014-0161-y
41. Bauer J, Biolo G, Cederholm T, Cesari M, Cruz-Jentoft AJ, Morley JE, et al. Evidence-based recommendations for optimal dietary protein intake in older people: a position paper from the PROT-AGE Study Group. J Am Med Dir Assoc. (2013) 14:542–59. doi: 10.1016/J.JAMDA.2013.05.021
42. Fragala MS, Cadore EL, Dorgo S, Izquierdo M, Kraemer WJ, Peterson MD, et al. Resistance training for older adults: Position statement from the national strength and conditioning association. J Strength Cond Res. (2019) 33:2019–52. doi: 10.1519/JSC.0000000000003230
43. Houston DK, Nicklas BJ, Ding J, Harris TB, Tylavsky FA, Newman AB, et al. Dietary protein intake is associated with lean mass change in older, community-dwelling adults: the Health, Aging, and Body Composition (Health ABC) Study. Am J Clin Nutr. (2008) 87:150–5. doi: 10.1093/AJCN/87.1.150
44. Hanaoka M, Yasuno M, Ishiguro M, Yamauchi S, Kikuchi A, Tokura M, et al. Morphologic change of the psoas muscle as a surrogate marker of sarcopenia and predictor of complications after colorectal cancer surgery. Int J Colorectal Dis. (2017) 32:847–56. doi: 10.1007/s00384-017-2773-0
45. Hamaguchi Y, Kaido T, Okumura S, Ito T, Fujimoto Y, Ogawa K, et al. Preoperative intramuscular adipose tissue content is a novel prognostic predictor after hepatectomy for hepatocellular carcinoma. J Hepatobiliary Pancreat Sci. (2015) 22:475–85. doi: 10.1002/jhbp.236
46. Cesari M, Fielding RA, Pahor M, Goodpaster B, Hellerstein M, Van Kan GA, et al. Biomarkers of sarcopenia in clinical trials-recommendations from the International Working Group on Sarcopenia. J Cachexia Sarcopenia Muscle. (2012) 3:181–90. doi: 10.1007/s13539-012-0078-2
47. Bahat G, Tufan A, Tufan F, Kilic C, Akpinar TS, Kose M, et al. Cut-off points to identify sarcopenia according to European Working Group on Sarcopenia in Older People (EWGSOP) definition. Clin Nutr. (2016) 35:1557–63. doi: 10.1016/J.CLNU.2016.02.002
48. Cruz-Jentoft AJ, Bahat G, Bauer J, Boirie Y, Bruyère O, Cederholm T, et al. Sarcopenia: Revised European consensus on definition and diagnosis. Age Ageing. (2019) 48:16–31. doi: 10.1093/ageing/afy169
49. Yoon JK, Jang JY, An YS, Lee SJ. Skeletal muscle mass at C3 may not be a strong predictor for skeletal muscle mass at L3 in sarcopenic patients with head and neck cancer. PloS One. (2021) 16. doi: 10.1371/journal.pone.0254844
50. Cruz-Jentoft AJ, Landi F, Schneider SM, Zúñiga C, Arai H, Boirie Y, et al. Prevalence of and interventions for sarcopenia in ageing adults: A systematic review. Rep Int Sarcopenia Initiative (EWGSOP IWGS). Age Ageing. (2014) 43:48–759. doi: 10.1093/ageing/afu115
Keywords: oral cancer, sarcopenia, sliceOmatic®, Harrell’s concordance index, C-index
Citation: Takayama H, Yoshimura T, Suzuki H, Hirano Y, Tezuka M, Ishida T, Ishihata K, Amitani M, Amitani H, Nakamura Y, Imamura Y, Inui A and Nakamura N (2024) Comparison between single-muscle evaluation and cross-sectional area muscle evaluation for predicting the prognosis in patients with oral squamous cell carcinoma: a retrospective cohort study. Front. Oncol. 14:1336284. doi: 10.3389/fonc.2024.1336284
Received: 10 November 2023; Accepted: 22 April 2024;
Published: 01 May 2024.
Edited by:
Ali-Farid Safi, Craniologicum - Center for Craniomaxillofacial Surgery, SwitzerlandReviewed by:
Jessica Maldonado-Mendoza, Metropolitan Autonomous University, MexicoEverton Freitas De Morais, State University of Campinas, Brazil
Copyright © 2024 Takayama, Yoshimura, Suzuki, Hirano, Tezuka, Ishida, Ishihata, Amitani, Amitani, Nakamura, Imamura, Inui and Nakamura. This is an open-access article distributed under the terms of the Creative Commons Attribution License (CC BY). The use, distribution or reproduction in other forums is permitted, provided the original author(s) and the copyright owner(s) are credited and that the original publication in this journal is cited, in accordance with accepted academic practice. No use, distribution or reproduction is permitted which does not comply with these terms.
*Correspondence: Hajime Suzuki, hajime@dent.kagoshima-u.ac.jp
†These authors have contributed equally to this work