 Xinping Yu1
 Hongjuan Yang
 Shuai Zhang
- 1Department of Gynecology, The Affiliated Hospital of Qingdao University, Qingdao, China
- 2Department of Pathology, The Affiliated Hospital of Qingdao University, Qingdao, China
- 3Department of Radiology, The Affiliated Hospital of Qingdao University, Qingdao, China
Objectives: This study aimed to construct a radiomics nomogram and validate its performance in the preoperative differentiation between early-stage (I and II) serous borderline ovarian tumors (SBOTs) and serous malignant ovarian tumors (SMOTs).
Methods: Data were collected from 80 patients with early-stage SBOTs and 102 with early-stage SMOTs (training set: n = 127; validation set: n = 55). Univariate and multivariate analyses were performed to identify the independent clinicoradiological factors. A radiomics signature model was constructed using radiomics features extracted from multidetector computed tomography images of the venous phase, in which the least absolute shrinkage and selection operator regression was employed to lessen the dimensionality of the data and choose the radiomics features. A nomogram model was established by combining independent clinicoradiological factors with the radiomics signature. The performance of nomogram calibration, discrimination, and clinical usefulness was evaluated using training and validation sets.
Results: In terms of clinicoradiological characteristics, age (p = 0.001), the diameter of the solid component (p = 0.009), and human epididymis protein 4 level (p < 0.001) were identified as the independent risk factors of SMOT, for which the area under the curves (AUCs) were calculated to be 0.850 and 0.836 in the training and validation sets, respectively. Nine features were finally selected to construct the radiomics signature model, which exhibited AUCs of 0.879 and 0.826 for the training and validation sets, respectively. The nomogram model demonstrated considerable calibration and discrimination with AUCs of 0.940 and 0.909 for the training and validation sets, respectively. The nomogram model displayed more prominent clinical usefulness than the clinicoradiological and radiomics signature models according to the decision curve analysis.
Conclusions: The nomogram model can be employed as an individualized preoperative non-invasive tool for differentiating early-stage SBOTs from SMOTs.
Introduction
Epithelial ovarian tumors account for 60% of all ovarian tumors and are common in women all over the world (1). Ovarian epithelial tumors can be morphologically categorized into three types as follows: benign, borderline, and malignant (2), with borderline tumors accounting for 10%–15% of all primary ovarian tumors (3, 4). Typically, compared with serous malignant ovarian tumors (SMOTs), serous borderline ovarian tumors (SBOTs) have a better prognosis, implying the vitality of early diagnosis and treatment.
Over the past decade, increasing efforts have been made to differentiate between borderline ovarian tumors (BOTs) and malignant ovarian tumors (MOTs) to modify the differential diagnosis and allow for more timely and effective treatments. Nougaret et al. (5) demonstrated the efficient differentiation of SBOTs from low-grade SMOTs using multidetector computed tomography (MDCT) features, such as peritoneal disease patterns and solid tumor volumes. Furthermore, Grabowska-Derlatka et al. (6) indicated that the morphological assessment of tumor vascularity in MDCT is an efficient approach to distinguish BOTs from MOTs. Previous studies demonstrated that BOTs can be distinguished from MOTs by analyzing the apparent diffusion coefficient of a solid tumor component using magnetic resonance imaging (MRI) (7, 8). Differentiating BOTs from MOTs based on imaging alone is generally difficult; thus, some studies have attempted to predict BOTs using preoperative imaging and tumor biomarkers. A previous study validated the superior performance of combining MRI with serum cancer antigen 125 (CA125) for differentiating between BOTs and MOTs (9). In our previous study, age, vascular abnormalities, and largest solid portion were independent factors distinguishing SBOTs from SMOTs (10).
Radiomics is an emerging translational research field that aims to extract high-dimensional quantitative features from clinical images and provide useful information (11). This approach has been adopted in a variety of applications, including the prediction of treatment response and outcome, tumor staging, tissue identification, and cancer genetics assessment (12, 13). SBOTs and SMOTs share similar clinical symptoms and imaging features in their early stages, making differentiation between these two entities difficult. We developed a nomogram combining clinical characteristics, conventional imaging characteristics, and MDCT radiomics features for preoperative differentiation between early-stage SBOTs and SMOTs. As far as we know, it is the first nomogram model established for preoperative differentiation between early-stage SBOTs and SMOTs.
Materials and methods
Patients
This retrospective study was conducted and approved by the institutional review committee, with the requirement of informed consent waived. Eighty SBOT patients (54 stage I and 26 stage II) and 102 SMOT patients (63 stage I and 39 stage II) from December 2017 to June 2020 were enrolled from our hospital information system (HIS) database into this analysis. The inclusion criteria were as follows: 1) histopathologically confirmed SBOTs and SMOTs after surgery and 2) SBOTs and SMOTs diagnosed as stage I or II based on the International Federation of Gynecology and Obstetrics (FIGO) guideline. The exclusion criteria were 1) SBOTs and SMOTs of stage III or IV according to the FIGO guideline, 2) patients that have accepted preoperative therapy (radiotherapy, chemotherapy, or chemoradiotherapy) before MDCT examination, and 3) incomplete clinical data or poor imaging data. The cohort was divided into a training set (127 patients) and a validation set (55 patients) according to the examination date of MDCT, with the total process depicted in Figure 1.
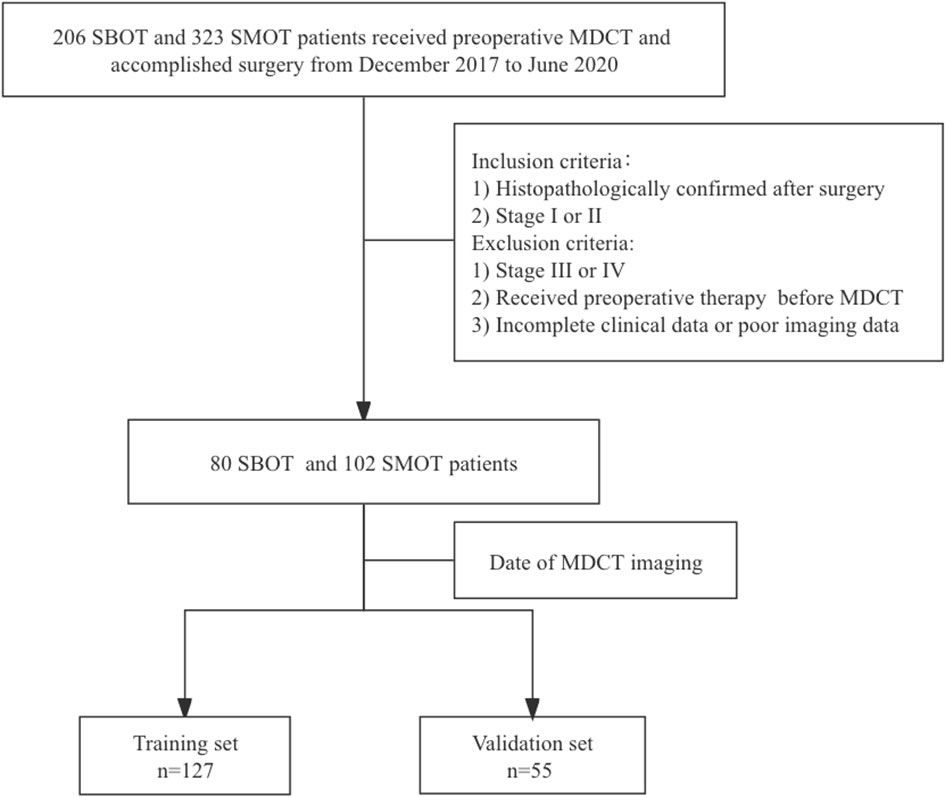
Figure 1 The flowchart of the selection of patients.
MDCT image acquisition
Pelvic MDCT images from five different CT scanners [AquilionONE (Canon Medical Systems, Otawara, Japan), Discovery CT750 HD (GE Medical Systems, Waukesha, WI, USA), Optima CT670 (GE Medical Systems, Milwaukee WI, USA), iCT 256 (Philips Medical System, Best, Netherlands), SOMATOM Definition Flash (Siemens Medical Systems, Forchheim, Germany)] were obtained with the following parameters: 100–300 mA, 120 kV, pitch of 0.599–0.984, thickness of 1–1.2 mm, and rotation time of 0.42–0.6 s. Iohexol (300 mg iodine/mL) with 85–100 mL volume was administered into the vein using a power injector at the speed of 2.0–3.0 mL/s. Then, the post-contrast CT scans from the arterial phase (AP, 30 s), venous phase (VP, 60 s), and equilibrium phase (EP, 90–120 s) were attained.
Clinicoradiological risk factors
The clinical characteristics of age, CA125 level (≤50 U/mL; >50 U/mL) (9), and human epididymis protein 4 (HE4) level (≤150 pmol/L; >150 pmol/L) (14) derived from medical records were recorded in the HIS. The imaging was viewed separately and independently by two radiologists in abdominal diagnosis, with 8 and 9 years of experience who were blinded to the clinical variables and pathological diagnosis. The following data of conventional imaging characteristics were recorded: the diameter of the tumor on the axial MDCT image, the diameter of the solid component on the axial MDCT image, location (unilateral or bilateral), texture (predominantly cystic or solid), margins (smooth or irregular), ascites (present or absent), and vascular abnormality (present or absent; vascular abnormality was defined as the presence of no less than one of the following situations: a) chaotic or serpentine course of the vessel, b) microaneurysm, and c) arteriovenous fistula).
MDCT radiomics analysis
The radiomics analysis methodology was carried out as described in a previous paper (15). In brief, regions of interest (ROIs) were manually segmented with 3D slicer, a free open-source software (https://www.slicer.org/). Afterward, 7 categories and 1,167 radiomics features were extracted with the “radiomics” package of the 3D slicer.
All radiomics features extracted from MDCT of VP were normalized. Significant radiomics features in the training set were selected applying interclass correlation coefficient and least absolute shrinkage and selection operator (LASSO) regression. A radiomics score (Rad-score) of each patient was calculated by means of a linear combination of the chosen features weighted by their coefficients.
Construction of the differentiation models
Three models were constructed by multivariate logistic regression analysis: the clinicoradiological model by prominent clinical characteristics and conventional imaging characteristics, the radiomics signature model by the selected radiomics features, and the nomogram model by the independent clinicoradiological risk factors combined with the radiomics signature.
Evaluation and validation of the different models
The evaluation of calibration of the nomogram model was conducted in the training and validation sets using the Hosmer–Lemeshow goodness-of-fit test. The performance of the three models in diagnosis was evaluated in the training set and validated in the validation set by plotting the receiver operating characteristic (ROC) curve and calculating the area under the ROC curve (AUC) and the multiple comparison of AUC curves using the DeLong test on Bonferroni-adjusted p-values. The AUC with 95% confidence interval (CI), sensitivity, and specificity was calculated. Decision curve analysis (DCA) was performed according to net benefits and the corresponding threshold probabilities in the training and validation sets, to assess the clinical application of the nomogram model. Our study workflow diagram is shown in Figure 2.
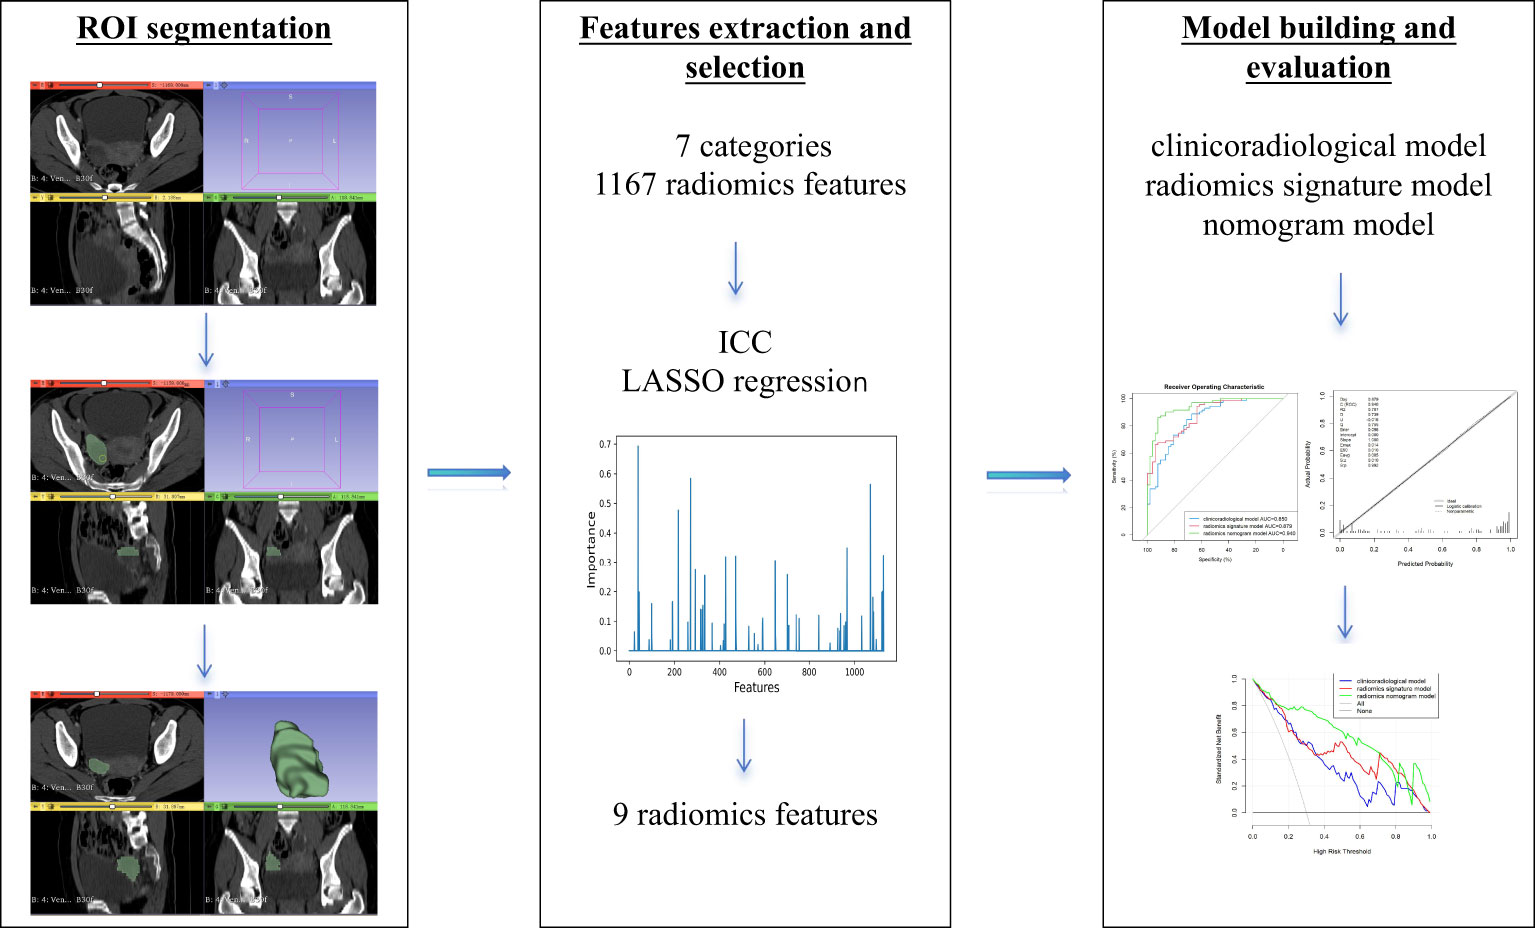
Figure 2 Workflow of features selection and model construction.
Statistical analysis
All statistical analyses were carried out on SPSS (version 20, Chicago, IL, USA) and R (https://www.r-project.org/). Statistical significance was defined as p <0.05.
Results
Patient characteristics
The clinicoradiological characteristics of all patients in the training and validation sets are provided in Table 1. SBOTs and SMOTs exhibited significant differences in age, HE4 level, location, texture, margins, vascular abnormalities, and the diameter of the solid component (p < 0.05), while there were no significant differences in CA125 level, ascites, and size (p > 0.05) in the training set. Age (p = 0.001), the diameter of the solid component (p = 0.009), and HE4 level (p < 0.001) were identified as the independent factors in the clinicoradiological model according to multiple logistic regression analysis. Tumors with older age [odds ratio (OR), 1.11; 95% CI, 1.05–1.18], larger diameter of the solid component (OR, 1.07; 95% CI, 1.02–1.13), and higher HE4 level (OR, 56.94; 95% CI, 7.1–456.49) trended to develop to SMOTs.
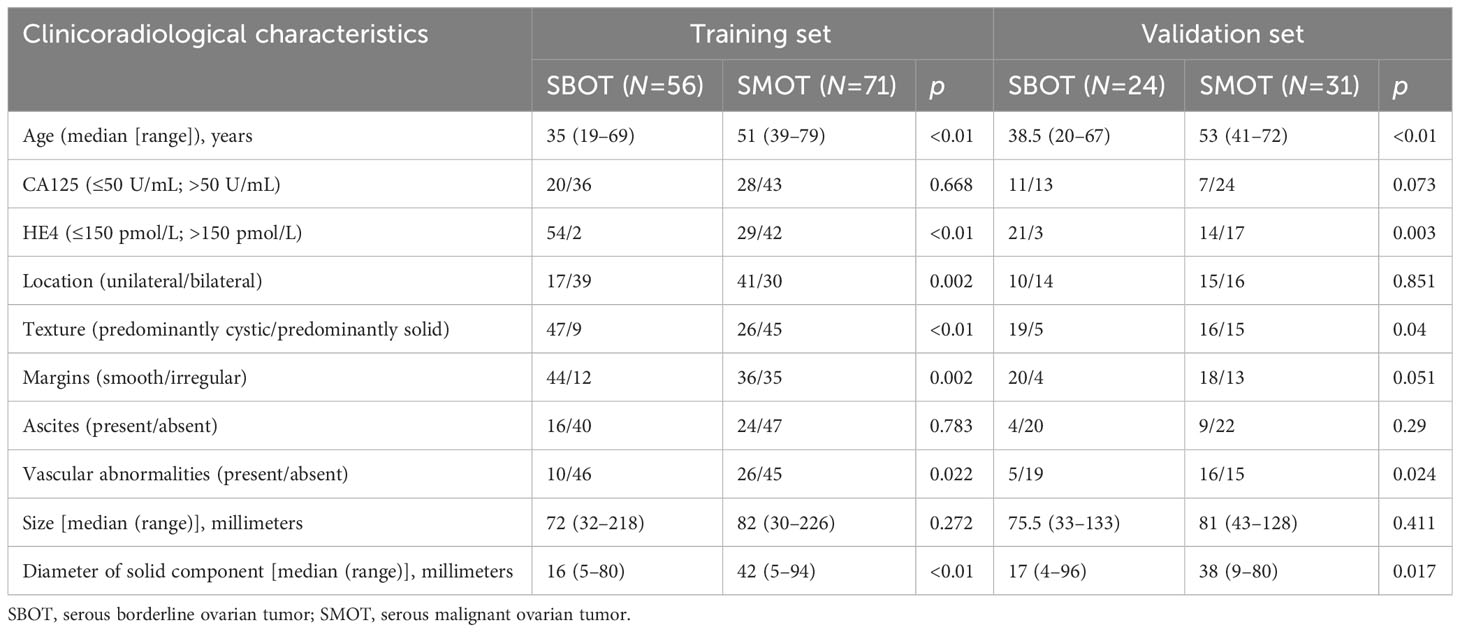
Table 1 Comparison of the clinicoradiological characteristics of SBOT and SMOT patients.
Radiomics feature selection and model construction
A total of 1,167 radiomics features were extracted from the ROIs, from which 812 with high reliability in the VP were selected for the LASSO to screen out the most contributing features. The radiomics signature model was constructed by the nine eventually chosen radiomics features. The Rad-score was calculated by the formula below:
Rad-score = −34.8136792 + 22.8447829 × Idn + 0.1912723 × ClusterShade − 63.2419151 × RunLengthNonUniformityNormalized − 2.3563718 × Median + 0.9576375 × LowGrayLevelZoneEmphasis + 13.5659235 × GrayLevelNonUniformityNormalized + 28.8492739 × InverseVariance + 11.5428048 × Imc2 − 173.8911646 × Contrast.
Clinical use of the nomogram model
Age, the diameter of the solid component, HE4 level, and Rad-score were integrated for the nomogram model construction (Figure 3). The calibration curve of the nomogram in Figure 4 demonstrated considerable calibration in both the training set (p = 0.994) and the validation set (p = 0.859). The performance of the clinicoradiological model, the radiomics signature model, and the nomogram model in diagnosis is evaluated and summarized in Table 2, and the ROC curves are depicted in Figure 5. The nomogram model exhibited significantly higher AUC compared with the clinicoradiological model and the radiomics signature model (p < 0.001) in the training set, while there was no significant difference in AUC between the nomogram model and the radiomics signature (p = 0.123) in the validation set. In the training (p = 0.494) and validation sets (p = 0.8972), no significant differences in AUC were revealed between the clinicoradiological model and the radiomics signature model. The DCA of the three models (Figure 6) demonstrated a more prominent overall net benefit of the nomogram model in differentiating between SBOTs and SMOTs in comparison to the clinicoradiological model and the radiomics signature model.
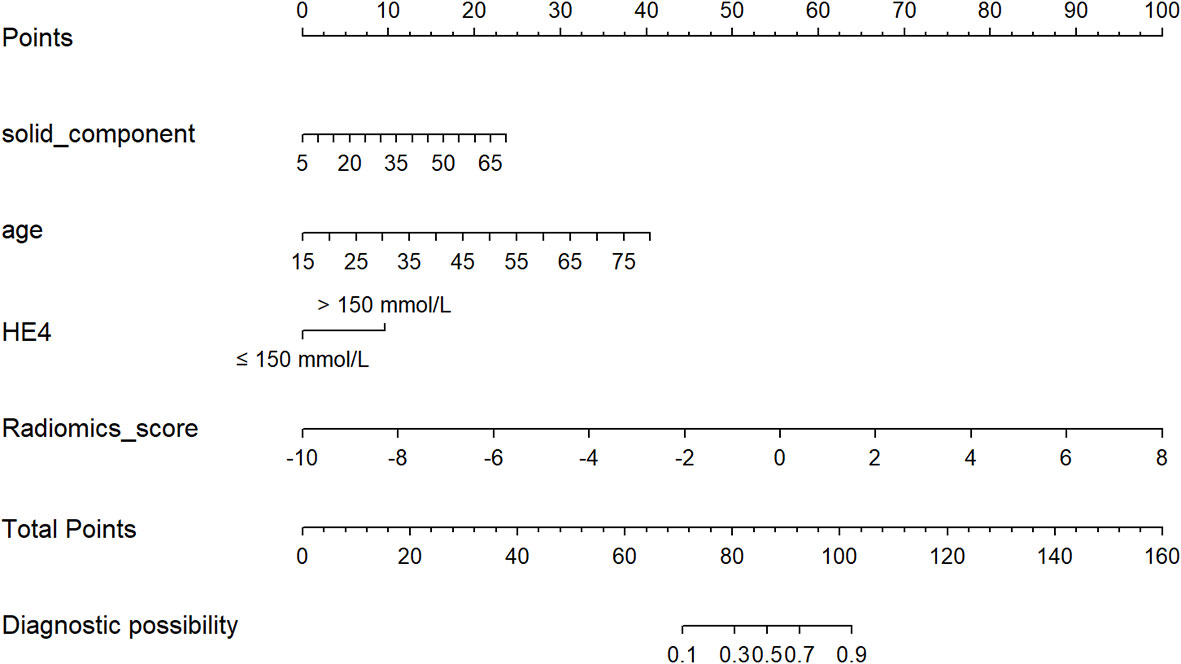
Figure 3 The radiomics nomogram, combining age, the diameter of the solid component, HE4 level, and Rad-score, developed in the training set.
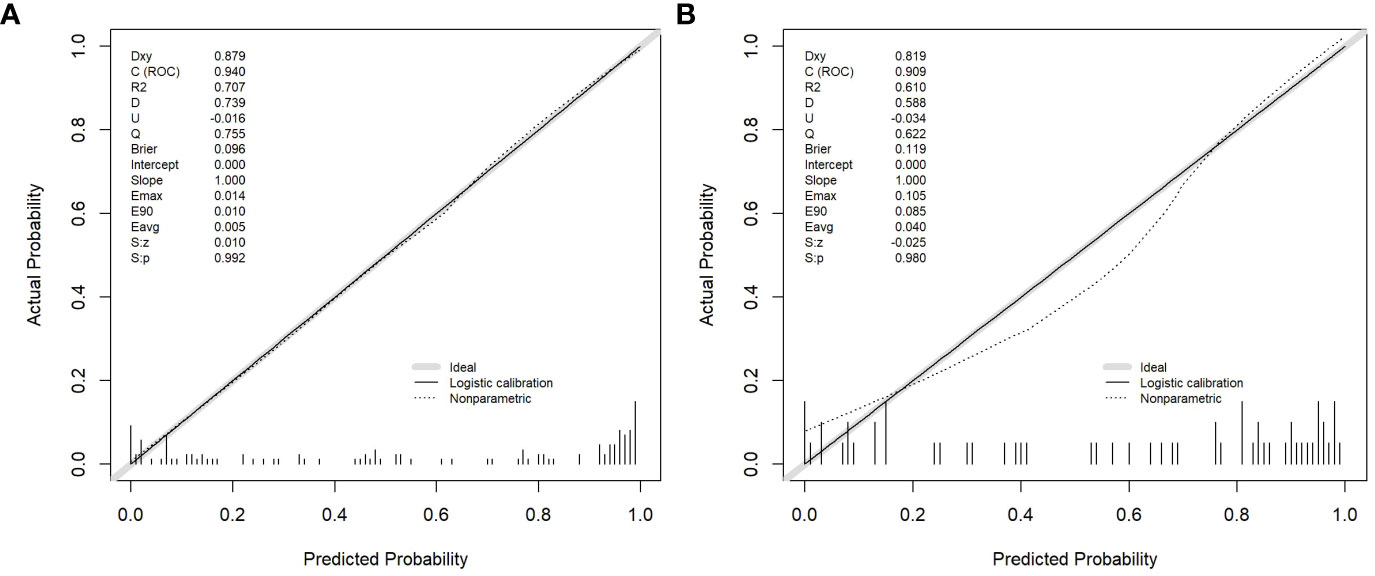
Figure 4 Calibration curves of the radiomics nomogram in the training (A) and validation (B) sets.
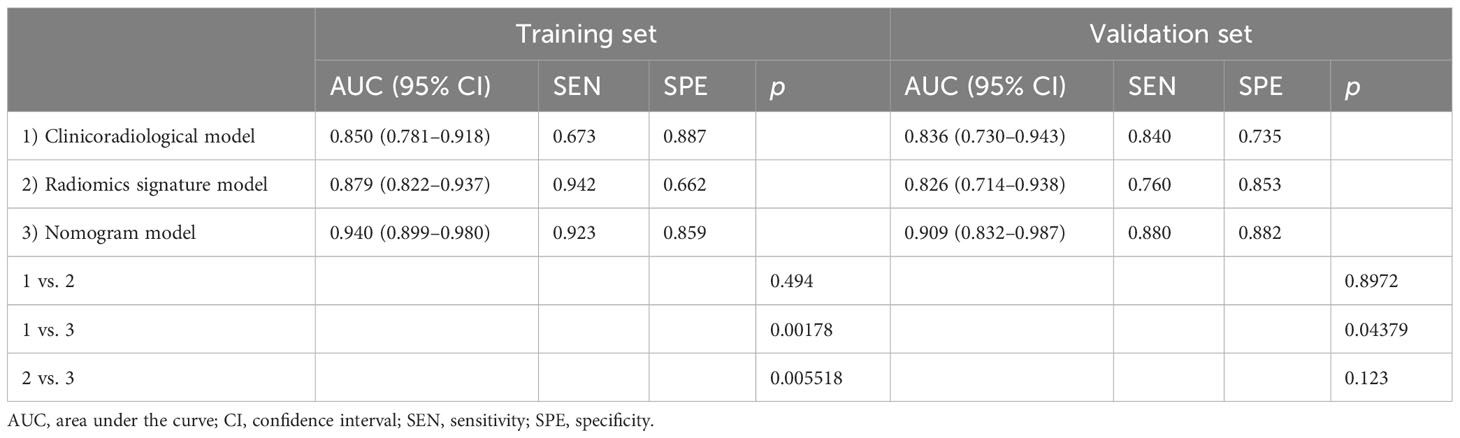
Table 2 Predictive performance of the three models.
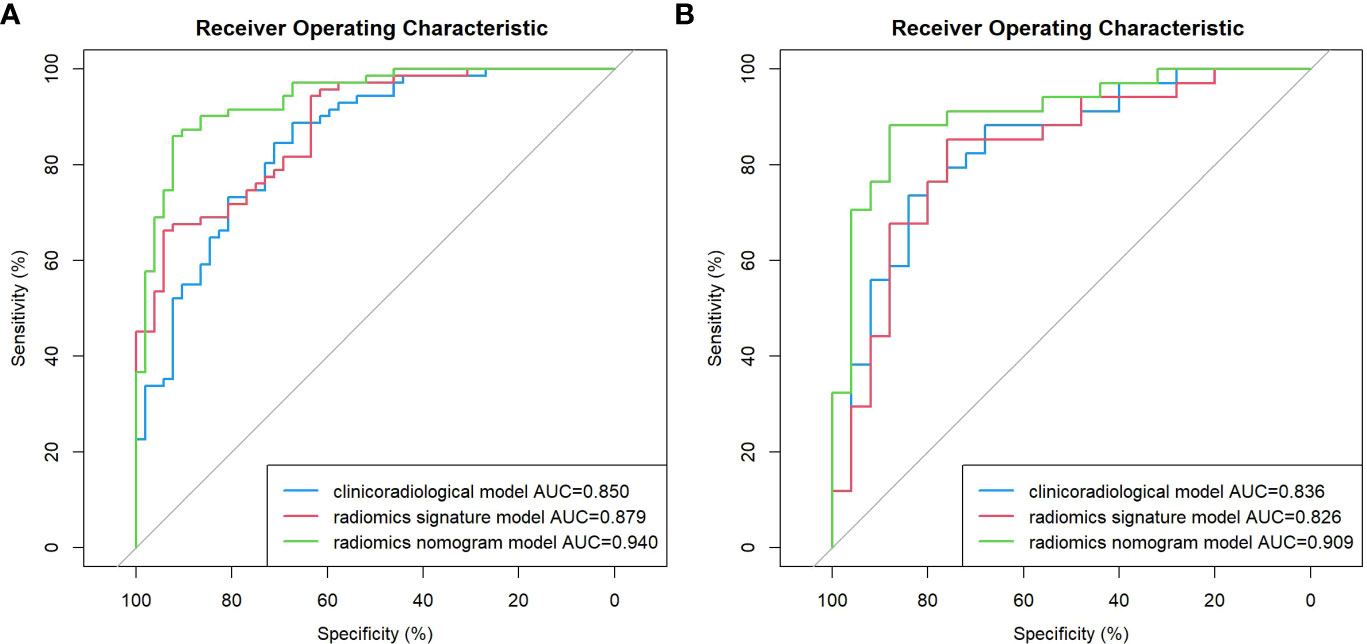
Figure 5 ROC curve of the clinicoradiological model, the radiomics signature model, and the nomogram model in the training (A) and validation (B) sets.
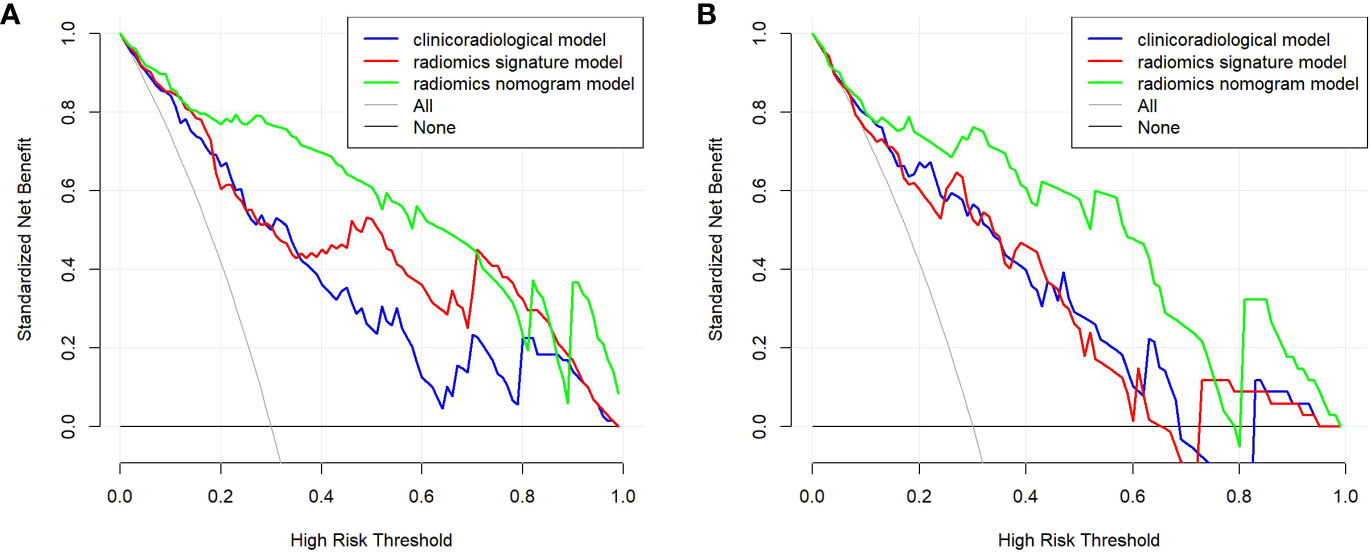
Figure 6 DCA for the clinicoradiological model, the radiomics signature model, and the nomogram model in the training (A) and validation (B) sets.
Discussion
The biological characteristics, prognoses, and treatments completely vary between SBOTs and SMOTs, implying the crucial role of accurate preoperative differentiation in determining individualized treatment options and improving postoperative quality of life (2). FIGO stage III or IV ovarian tumors more prominently display aggressive characteristics, such as lymphatic and distant metastases, resulting in a tendency to be identified as SMOT (16, 17). Therefore, patients in the early stages were employed as subjects in our study, which holds greater significance in clinical practice.
Age is generally acknowledged as one of the factors that discriminate between SBOTs and SMOTs (18). As indicated by our previous study, the median age of the patients with SMOTs was 10 years older than patients with SBOTs, showing a statistically significant difference (10). In the present study, using multiple logistic regression analysis, age was validated as an independent predictor in accordance with previous studies (18).
In the past two decades, studies on several serum biomarkers for the diagnosis of epithelial ovarian cancer including CA125, carbohydrate antigen 19-9, carcinoembryonic antigen, and HE4 have already been conducted (19, 20). HE4 is a relatively reliable biomarker for ovarian cancer detection, whereas CA125 is commonly used for early ovarian cancer diagnosis in clinical practice (14). In terms of ovarian cancer detection, HE4 exhibits superior diagnostic performance to CA125, while their combination provides higher sensitivity at the expense of lower specificity compared with HE4 alone (21, 22). In the present study, the HE4 level was proven to be an independent predictor in the clinicoradiological model, showing a superior diagnostic performance to the CA125 level in terms of differentiation between early-stage SBOTs and SMOTs.
In routine clinical practice, MDCT is the most commonly used imaging method for preoperative assessment and postoperative surveillance of patients with ovarian tumors. Previous studies have indicated that MDCT and MRI are promising imaging tools for differentiating BOTs from MOTs (23, 24). Due to the focus on variables such as tumor shape, tumor volume, and tumor vascular changes in early studies (6, 17), it is difficult to distinguish BOTs from MOTs depending on imaging information alone, despite the medical imaging methods used to distinguish them, which could result from some morphological imaging findings overlapping between BOTs and MOTs, such as irregularly thickened walls or septa, predominantly solid masses, and vascular abnormalities. Therefore, medical imaging methods must be combined with clinical data to achieve a differential diagnosis. Our previous study demonstrated the validity of the combined analysis of age, vascular abnormalities, and the diameter of the solid components for differentiating between SBOTs and SMOTs (10). Shin et al. (25) found that a more reproducible and accurate differentiation of BOTs from MOTs could be achieved by combining MDCT data and CA125 levels.
With advancements in computer technology, radiomics has emerged as a new research method in recent years. Medical images can be converted into high-dimensional mineable data after the extraction of quantitative image features. Radiomics could contribute to exploring the potential connections related to tumor occurrence and development offering reference for clinicians to make a proper diagnosis before surgery. This is a promising field used in oncology and has been adopted in the differential diagnosis of pulmonary solid nodule (26), renal masses (27), liver tumor (28), and thyroid follicular neoplasms (29) on MDCT images.
In our previous study (15), the MDCT-based radiomics model was efficient in discriminating SBOTs from SMOTs, with AUCs for the radiomics models AP, VP, and EP of 0.8, 0.86, and 0.73, respectively; the AUC was higher for VP. In the present study, we investigated the performance of a nomogram model based on radiomics of the VP for preoperative differentiation between SBOTs and SMOTs.
The nomogram model incorporated a radiomics signature and three clinicoradiological risk factors as follows: age, solid component diameter, and HE4 level. The combined model exerted a more remarkable function compared with the other two models in the training and validation sets. The AUCs of the nomogram model were 0.940 and 0.909 for the training and validation sets, respectively. These findings demonstrated the efficiency of the nomogram model for preoperative differentiation between SBOTs and SMOTs, which is easy to use. The nomogram displayed high consistency and potential clinical usefulness according to the calibration and DCA curves. To the best of our knowledge, for the first time, we constructed a nomogram model with high accuracy and robust discrimination, providing a convenient and non-invasive tool for clinicians.
This study had some limitations. First, it was a single-center scanner study; a multicenter study is warranted to analyze and verify our results in the future. Second, the late stages of SBOMs and STOMs were not included, which may limit the model generalization. Third, there may be an inevitable selection bias in retrospective studies, and prospective and external validation studies are needed. Fourth, the lack of multiple segmentations affected the quality of the study, limiting the reproducibility of the results.
Conclusions
In summary, a nomogram model combining clinicoradiological risk factors and radiomics features was established in the present study and can be adopted as an individualized preoperative non-invasive tool for distinguishing between early-stage SBOTs and SMOTs.
Data availability statement
The original contributions presented in the study are included in the article/supplementary material. Further inquiries can be directed to the corresponding author.
Ethics statement
The studies involving humans were approved by the Ethics Committee of Affiliated Hospital of Qingdao University. The studies were conducted in accordance with the local legislation and institutional requirements. The ethics committee/institutional review board waived the requirement of written informed consent for participation from the participants or the participants’ legal guardians/next of kin because this study was retrospective design, and all data were kept confidential. Written informed consent was not obtained from the individual(s) for the publication of any potentially identifiable images or data included in this article because written informed consent was not required to participate in this study in accordance with the institutional requirements.
Author contributions
XY: Investigation, Software, Writing – original draft, Writing – review & editing, Methodology. YZ: Methodology, Resources, Writing – review & editing. LW: Methodology, Resources, Writing – review & editing. HJY: Methodology, Resources, Writing – review & editing. JJ: Methodology, Resources, Writing – original draft. HYY: Data curation, Software, Writing – review & editing. SZ: Conceptualization, Methodology, Software, Supervision, Writing – review & editing.
Funding
The author(s) declare that no financial support was received for the research, authorship, and/or publication of this article.
Conflict of interest
The authors declare that the research was conducted in the absence of any commercial or financial relationships that could be construed as a potential conflict of interest.
Publisher’s note
All claims expressed in this article are solely those of the authors and do not necessarily represent those of their affiliated organizations, or those of the publisher, the editors and the reviewers. Any product that may be evaluated in this article, or claim that may be made by its manufacturer, is not guaranteed or endorsed by the publisher.
Abbreviations
SBOT, serous borderline ovarian tumor; SMOT, serous malignant ovarian tumor; AUC, area under the receiver operator characteristic curve; BOT, borderline ovarian tumor; MOT, malignant ovarian tumor; MDCT, multidetector computed tomography; MRI, magnetic resonance imaging; CA125, serum cancer antigen 125; HIS, hospital information system; FIGO, International Federation of Gynecology and Obstetrics; AP, arterial phase; VP, venous phase; EP, equilibrium phase; HE4, epididymis protein 4; ROI, region of interest; LASSO, least absolute shrinkage and selection operator; ROC, receiver operating characteristic; CI, confidence interval; DCA, decision curve analysis.
References
1. Lheureux S, Gourley C, Vergote I, Oza AM. Epithelial ovarian cancer. Lancet (2019) 393(10177):1240–53. doi: 10.1016/S0140-6736(18)32552-2
2. Prat J. Pathology of borderline and invasive cancers. Best Pract Res Clin Obstet Gynaecol (2017) 41:15–30. doi: 10.1016/j.bpobgyn.2016.08.007
3. Mimura R, Kato F, Tha KK, Kudo K, Konno Y, Oyama-Manabe N, et al. Comparison between borderline ovarian tumors and carcinomas using semi-automated histogram analysis of diffusion-weighted imaging: focusing on solid components. Jpn J Radiol (2016) 34(3):229–37. doi: 10.1007/s11604-016-0518-6
4. Liu X, Wang T, Zhang G, Hua K, Jiang H, Duan S, et al. Two-dimensional and three-dimensional T2 weighted imaging-based radiomic signatures for the preoperative discrimination of ovarian borderline tumors and Malignant tumors. J Ovarian Res (2022) 15(1):22. doi: 10.1186/s13048-022-00943-z
5. Nougaret S, Lakhman Y, Molinari N, Feier D, Scelzo C, Vargas HA, et al. CT features of ovarian tumors: defining key differences between serous borderline tumors and low-grade serous carcinomas. AJR Am J Roentgenol (2018) 210(4):918–26. doi: 10.2214/AJR.17.18254
6. Grabowska-Derlatka L, Derlatka P, Palczewski P, Danska-Bidzinska A, Pacho R. Differentiation of ovarian cancers from borderline ovarian tumors on the basis of evaluation of tumor vascularity in multi-row detector computed tomography—comparison with histopathology. Int J Gynecol Cancer (2013) 23(9):1597–602. doi: 10.1097/IGC.0b013e3182a80a41
7. Xiao F, Zhang L, Yang S, Peng K, Hua T, Tang G. Quantitative analysis of the MRI features in the differentiation of benign, borderline, and Malignant epithelial ovarian tumors. J Ovarian Res (2022) 15(1):13. doi: 10.1186/s13048-021-00920-y
8. Zhao SH, Qiang JW, Zhang GF, Ma FH, Cai SQ, Li HM, et al. Diffusion-weighted MR imaging for differentiating borderline from Malignant epithelial tumours of the ovary: pathological correlation. Eur Radiol (2014) 24(9):2292–9. doi: 10.1007/s00330-014-3236-4
9. Denewar FA, Takeuchi M, Urano M, Kamishima Y, Kawai T, Takahashi N, et al. Multiparametric MRI for differentiation of borderline ovarian tumors from stage I Malignant epithelial ovarian tumors using multivariate logistic regression analysis. Eur J Radiol (2017) 91:116–23. doi: 10.1016/j.ejrad.2017.04.001
10. Yu XP, Liu Y, Jiao JW, Yang HJ, Wang RJ, Zhang S. Evaluation of ovarian tumors with multidetector computed tomography and tumor markers: differentiation of stage I serous borderline tumors and stage I serous Malignant tumors presenting as solid-cystic mass. Med Sci Monit (2020) 26:e924497. doi: 10.12659/MSM.924497
11. Lambin P, Leijenaar RTH, Deist TM, Peerlings J, de Jong EEC, van Timmeren J, et al. Radiomics: the bridge between medical imaging and personalized medicine. Nat Rev Clin Oncol (2017) 14(12):749–62. doi: 10.1038/nrclinonc.2017.141
12. Yip SS, Aerts HJ. Applications and limitations of radiomics. Phys Med Biol (2016) 61(13):R150–66. doi: 10.1088/0031-9155/61/13/R150
13. Mayerhoefer ME, Materka A, Langs G, Häggström I, Szczypiński P, Gibbs P, et al. Introduction to radiomics. J Nucl Med (2020) 61(4):488–95. doi: 10.2967/jnumed.118.222893
14. Huang J, Chen J, Huang Q. Diagnostic value of HE4 in ovarian cancer: A meta-analysis. Eur J Obstet Gynecol Reprod Biol (2018) 231:35–42. doi: 10.1016/j.ejogrb.2018.10.008
15. Yu XP, Wang L, Yu HY, Zou YW, Wang C, Jiao JW, et al. MDCT-based radiomics features for the differentiation of serous borderline ovarian tumors and serous Malignant ovarian tumors. Cancer Manag Res (2021) 13:329–36. doi: 10.2147/CMAR.S284220
16. Ye R, Weng S, Li Y, Yan C, Chen J, Zhu Y, et al. Texture analysis of three-dimensional MRI images may differentiate borderline and Malignant epithelial ovarian tumors. Korean J Radiol (2021) 22(1):106–17. doi: 10.3348/kjr.2020.0121
17. Javadi S, Ganeshan DM, Qayyum A, Iyer RB, Bhosale P. Ovarian cancer, the revised FIGO staging system, and the role of imaging. AJR Am J Roentgenol (2016) 206(6):1351–60. doi: 10.2214/AJR.15.15199
18. Gershenson DM. Management of borderline ovarian tumours. Best Pract Res Clin Obstet Gynaecol (2017) 41:49–59. doi: 10.1016/j.bpobgyn.2016.09.012
19. Guo J, Yu J, Song X, Mi H. Serum CA125, CA199 and CEA combined detection for epithelial ovarian cancer diagnosis: A meta-analysis. Open Med (Wars) (2017) 12:131–7. doi: 10.1515/med-2017-0020
20. Qing X, Liu L, Mao X. A clinical diagnostic value analysis of serum CA125, CA199, and HE4 in women with early ovarian cancer: systematic review and meta-analysis. Comput Math Methods Med (2022) 2022:9339325. doi: 10.1155/2022/9339325
21. Lin J, Qin J, Sangvatanakul V. Human epididymis protein 4 for differential diagnosis between benign gynecologic disease and ovarian cancer: a systematic review and meta-analysis. Eur J Obstet Gynecol Reprod Biol (2013) 167(1):81–5. doi: 10.1016/j.ejogrb.2012.10.036
22. Ferraro S, Braga F, Lanzoni M, Boracchi P, Biganzoli EM, Panteghini M. Serum human epididymis protein 4 vs carbohydrate antigen 125 for ovarian cancer diagnosis: a systematic review. J Clin Pathol (2013) 66(4):273–81. doi: 10.1136/jclinpath-2012-201031
23. Li YA, Qiang JW, Ma FH, Li HM, Zhao SH. MRI features and score for differentiating borderline from Malignant epithelial ovarian tumors. Eur J Radiol (2018) 98:136–42. doi: 10.1016/j.ejrad.2017.11.014
24. Yang S, Tang H, Xiao F, Zhu J, Hua T, Tang G. Differentiation of borderline tumors from type I ovarian epithelial cancers on CT and MR imaging. Abdom Radiol (NY) (2020) 45(10):3230–8. doi: 10.1007/s00261-020-02467-w
25. Shin JE, Choi HJ, Kim MH, Cho KS. The serum CA-125 concentration data assists in evaluating CT imaging information when used to differentiate borderline ovarian tumor from Malignant epithelial ovarian tumors. Korean J Radiol (2011) 12(4):456–62. doi: 10.3348/kjr.2011.12.4.456
26. Feng B, Chen X, Chen Y, Liu K, Li K, Liu X, et al. Radiomics nomogram for preoperative differentiation of lung tuberculoma from adenocarcinoma in solitary pulmonary solid nodule. Eur J Radiol (2020) 128:109022. doi: 10.1016/j.ejrad.2020.109022
27. Nie P, Yang G, Wang Z, Yan L, Miao W, Hao D, et al. A CT-based radiomics nomogram for differentiation of renal angiomyolipoma without visible fat from homogeneous clear cell renal cell carcinoma. Eur Radiol (2020) 30(2):1274–84. doi: 10.1007/s00330-019-06427-x
28. Nie P, Yang G, Guo J, Chen J, Li X, Ji Q, et al. A CT-based radiomics nomogram for differentiation of focal nodular hyperplasia from hepatocellular carcinoma in the non-cirrhotic liver. Cancer Imaging (2020) 20(1):20. doi: 10.1186/s40644-020-00297-z
Keywords: ovarian tumors, multidetector computed tomography, radiomics, nomogram, preoperative differentiation
Citation: Yu X, Zou Y, Wang L, Yang H, Jiao J, Yu H and Zhang S (2024) Radiomics nomogram for preoperative differentiation of early-stage serous borderline ovarian tumors and serous malignant ovarian tumors. Front. Oncol. 13:1269589. doi: 10.3389/fonc.2023.1269589
Received: 30 July 2023; Accepted: 18 December 2023;
Published: 15 January 2024.
Edited by:
Renata Colombo Bonadio, University of São Paulo, BrazilReviewed by:
Dania Cioni, University of Pisa, ItalyRaghunadharao Digumarti, GSL Medical College, India
Copyright © 2024 Yu, Zou, Wang, Yang, Jiao, Yu and Zhang. This is an open-access article distributed under the terms of the Creative Commons Attribution License (CC BY). The use, distribution or reproduction in other forums is permitted, provided the original author(s) and the copyright owner(s) are credited and that the original publication in this journal is cited, in accordance with accepted academic practice. No use, distribution or reproduction is permitted which does not comply with these terms.
*Correspondence: Shuai Zhang, zhangshuai@qdu.edu.cn