 Kangwen He1†
 Yucong Zhang2†
 Shichao Li1
 Guanjie Yuan1Ping Liang1
 Qingpeng Zhang3Qingguo Xie4Peng Xiao4
 Heng Li5*Xiaoyan Meng1*
 Zhen Li1
- 1Department of Radiology, Tongji Hospital, Tongji Medical College, Huazhong University of Science and Technology, Wuhan, China
- 2Department of Geriatrics, Tongji Hospital of Tongji Medical College, Huazhong University of Science and Technology, Wuhan, China
- 3School of Data Science, City University of Hong Kong, Hong Kong, Hong Kong SAR, China
- 4College of Life Science and Technology, Huazhong University of Science and Technology, Wuhan, China
- 5Department of Urology, Tongji Hospital, Tongji Medical College, Huazhong University of Science and Technology, Wuhan, China
Purpose: To investigate the incremental prognostic value of preoperative apparent diffusion coefficient (ADC) histogram analysis in patients with high-risk prostate cancer (PCa) who received adjuvant hormonal therapy (AHT) after radical prostatectomy (RP).
Methods: Sixty-two PCa patients in line with the criteria were enrolled in this study. The 10th, 50th, and 90th percentiles of ADC (ADC10, ADC50, ADC90), the mean value of ADC (ADCmean), kurtosis, and skewness were obtained from the whole-lesion ADC histogram. The Kaplan–Meier method and Cox regression analysis were used to analyze the relationship between biochemical recurrence-free survival (BCR-fs) and ADC parameters and other clinicopathological factors. Prognostic models were constructed with and without ADC parameters.
Results: The median follow-up time was 53.4 months (range, 41.1-79.3 months). BCR was found in 19 (30.6%) patients. Kaplan−Meier curves showed that lower ADCmean, ADC10, ADC50, and ADC90 and higher kurtosis could predict poorer BCR-fs (all p<0.05). After adjusting for clinical parameters, ADC50 and kurtosis remained independent prognostic factors for BCR-fs (HR: 0.172, 95% CI: 0.055-0.541, p=0.003; HR: 7.058, 95% CI: 2.288-21.773, p=0.001, respectively). By adding ADC parameters to the clinical model, the C index and diagnostic accuracy for the 24- and 36-month BCR-fs were improved.
Conclusion: ADC histogram analysis has incremental prognostic value in patients with high-risk PCa who received AHT after RP. Combining ADC50, kurtosis and clinical parameters can improve the accuracy of BCR-fs prediction.
1. Introduction
Prostate cancer (PCa) is the second most common cancer and fifth leading cause of cancer-related deaths in men worldwide, with an estimated nearly 1.4 million new cases and 375,000 deaths in 2020 (1). For men with high-risk localized and locally advanced PCa, multimodal therapy strategies, such as a reasonable first step of radical prostatectomy (RP) to reduce the tumor burden, followed by adjuvant androgen deprivation therapy or radiation therapy, are often necessary (2). Several studies have found considerable benefits for patients receiving adjuvant hormonal therapy (AHT) after RP compared to observations after RP (3–6). However, the current definition of high-risk prostate cancer includes a heterogeneous group of patients with different outcomes based on different baseline characteristics (7). A proportion of patients may exhibit early resistance to AHT and elevated PSA levels in the short term after RP, which has given rise to studies of prognostic factors, including novel biomarkers such as advanced magnetic resonance imaging (MRI) parameters.
In recent years, MRI has been widely used in clinical practice for the detection and staging of PCa (8) and is also promising in predicting the prognosis of PCa (9, 10). The apparent diffusion coefficient (ADC), derived from diffusion-weighted MRI, is thought to be related to the cellularity and interstitial structure of pathological tissue and therefore reflects the histopathological heterogeneity of malignant tumors (11–13). Histogram analysis is a texture-based statistical measurement method for images that can quantitatively provide a series of information on ADC maps, such as percentile ADC values, kurtosis, and skewness. Numerous studies have shown that ADC histogram analysis derived from baseline MRI examination has prognostic value in several types of tumors, including glioblastoma (14), esophageal carcinoma (15), and squamous cell cervical cancer (16). In PCa, ADC histogram analysis has recently been declared to be valuable in the detection, differentiation, and aggressiveness assessment of cancer lesions. Peng et al. (17) found that ADC10 and ADCmean could differentiate between prostate cancer and normal tissue. Donati et al. (18) evaluated the correlation between the 10th percentile, 25th percentile, mean, and median ADC values and Gleason scores of 6, 7 and 8 and found the strongest correlation between the 10th percentile ADC values and Gleason score. Given that histogram parameters may reflect tumor heterogeneity, it is of clinical relevance to know whether histogram analysis can serve as a biomarker for the prediction of BCR and whether ADC parameters have an incremental prognostic value in patients with PCa receiving RP and AHT.
To our knowledge, the predictive effect of ADC histogram analysis on the prognosis of high-risk PCa patients receiving AHT after RP remains unclear. Therefore, the purpose of this study was to evaluate the prognostic value of preoperative ADC histogram analysis in this certain population and to develop a prognostic model combining clinical factors and ADC histogram parameters.
2. Materials and methods
2.1. Patients
The study was approved by our institutional review board, and the requirement for written informed consent was waived because of the retrospective nature. In this study, 88 patients with PCa who received RP and extended pelvic lymph node dissection (ePLND) in our hospital from March 2013 to October 2015 were enrolled. The inclusion criteria were as follows: 1) age ≥18 years; 2) pathologically confirmed prostate adenocarcinoma; 3) high-risk PCa (preoperative serum PSA ≥ 20 ng/mL or Gleason score ≥ 8) or locally advanced PCa (pT3/4, N0M0 or any T, N1M0) or positive surgical margin (R1) (19); 4) preoperative MRI scans, including diffusion-weighted imaging with a b value of 0 and 1000 sec/mm2, were performed within 3 months before surgery; and 5) AHT was given immediately after surgery. Of these, 26 males were excluded: initially received additional concurrent anticancer therapy (RT, chemotherapy) before MRI scanning (n = 13), lack of DW images (n = 2), the tumor location was not clearly defined (n = 3), and poor image quality due to severe motion artifacts or susceptibility artifacts (n = 8). Finally, 62 consecutive males were included in this study. All enrolled patients received AHT, including medical castration (LHRHa), combined with anti-androgens (bicalutamide, etc.) immediately after RP. The baseline clinicopathologic data were collected retrospectively from our medical database, including age at RP, preoperative total PSA (TPSA), pathological Gleason score, pathological T and N stages (pT, pN), and surgical margin status (SM R1/R0).
2.2. MRI protocol
All patients underwent MRI examinations using a 3.0 T MRI scanner (MAGNETOM Skyra, Siemens Healthcare, Erlangen, Germany) with an 18-element body coil above the pelvis. The MRI sequences included: 1) axial T2-weighted image (repetition time/echo time [TR/TE] 6500-6874/104 msec, slice thickness 3 mm, slice spacing 3 mm, field of view 180 mm×180 mm, matrix 384×346 mm, flip angle 160°, NEX=2; 2) DWI (b = 0, 200, 400, 800,1000, 1500 sec/mm2) was acquired in the axial plane by single-shot echo-planar sequence with the following parameters: TR 4500 ms, TE 85 ms, slice thickness of 3 mm, slice spacing 0 mm, field of view of 214×171 mm, matrix 90 × 72.
2.3. Image postprocessing and analysis
All the image data were saved in Digital Imaging and Communication in Medicine (DICOM) format in a personal computer and postprocessed offline with custom-developed software (Firevoxel, https://firevoxel.org). A radiologist (MXY) with more than 5 years of experience in prostate MRI interpretation performed the segmentation of lesions independently and was blinded to the patients’ clinical characteristics and survival outcomes. For each patient, a 3D volume of interest (3D VOI) was manually delineated along the margins of the whole lesion on all continuous sections of DWI (b=1000 s/mm2), avoiding the areas of hemorrhage and adjacent nonneoplastic structures, with reference to T2-weighted images. To evaluate the reproducibility of segmentation, another senior radiology resident (LP) with 3 years of prostate mp-MRI experience randomly selected 30 prostate cancers for segmentation. The ADC map within the 3D VOI was calculated automatically by DWIs at b = 0 and 1000 s/mm2 (18) using a monoexponential model:
where S represents the signal intensity at a certain b-value and S0 represents the signal intensity at b-value = 0 s/mm2. The ADC histogram was automatically generated on a voxel-by-voxel basis along with the following corresponding parameters: mean ADC (ADCmean), median ADC (ADC50), 10th percentile ADC (ADC10), 90th percentile ADC (ADC90), skewness, and kurtosis, which were the most commonly used histogram parameters in the previous studies of PCa and other cancers. Two typical examples of PCa cases are provided in Figure 1.
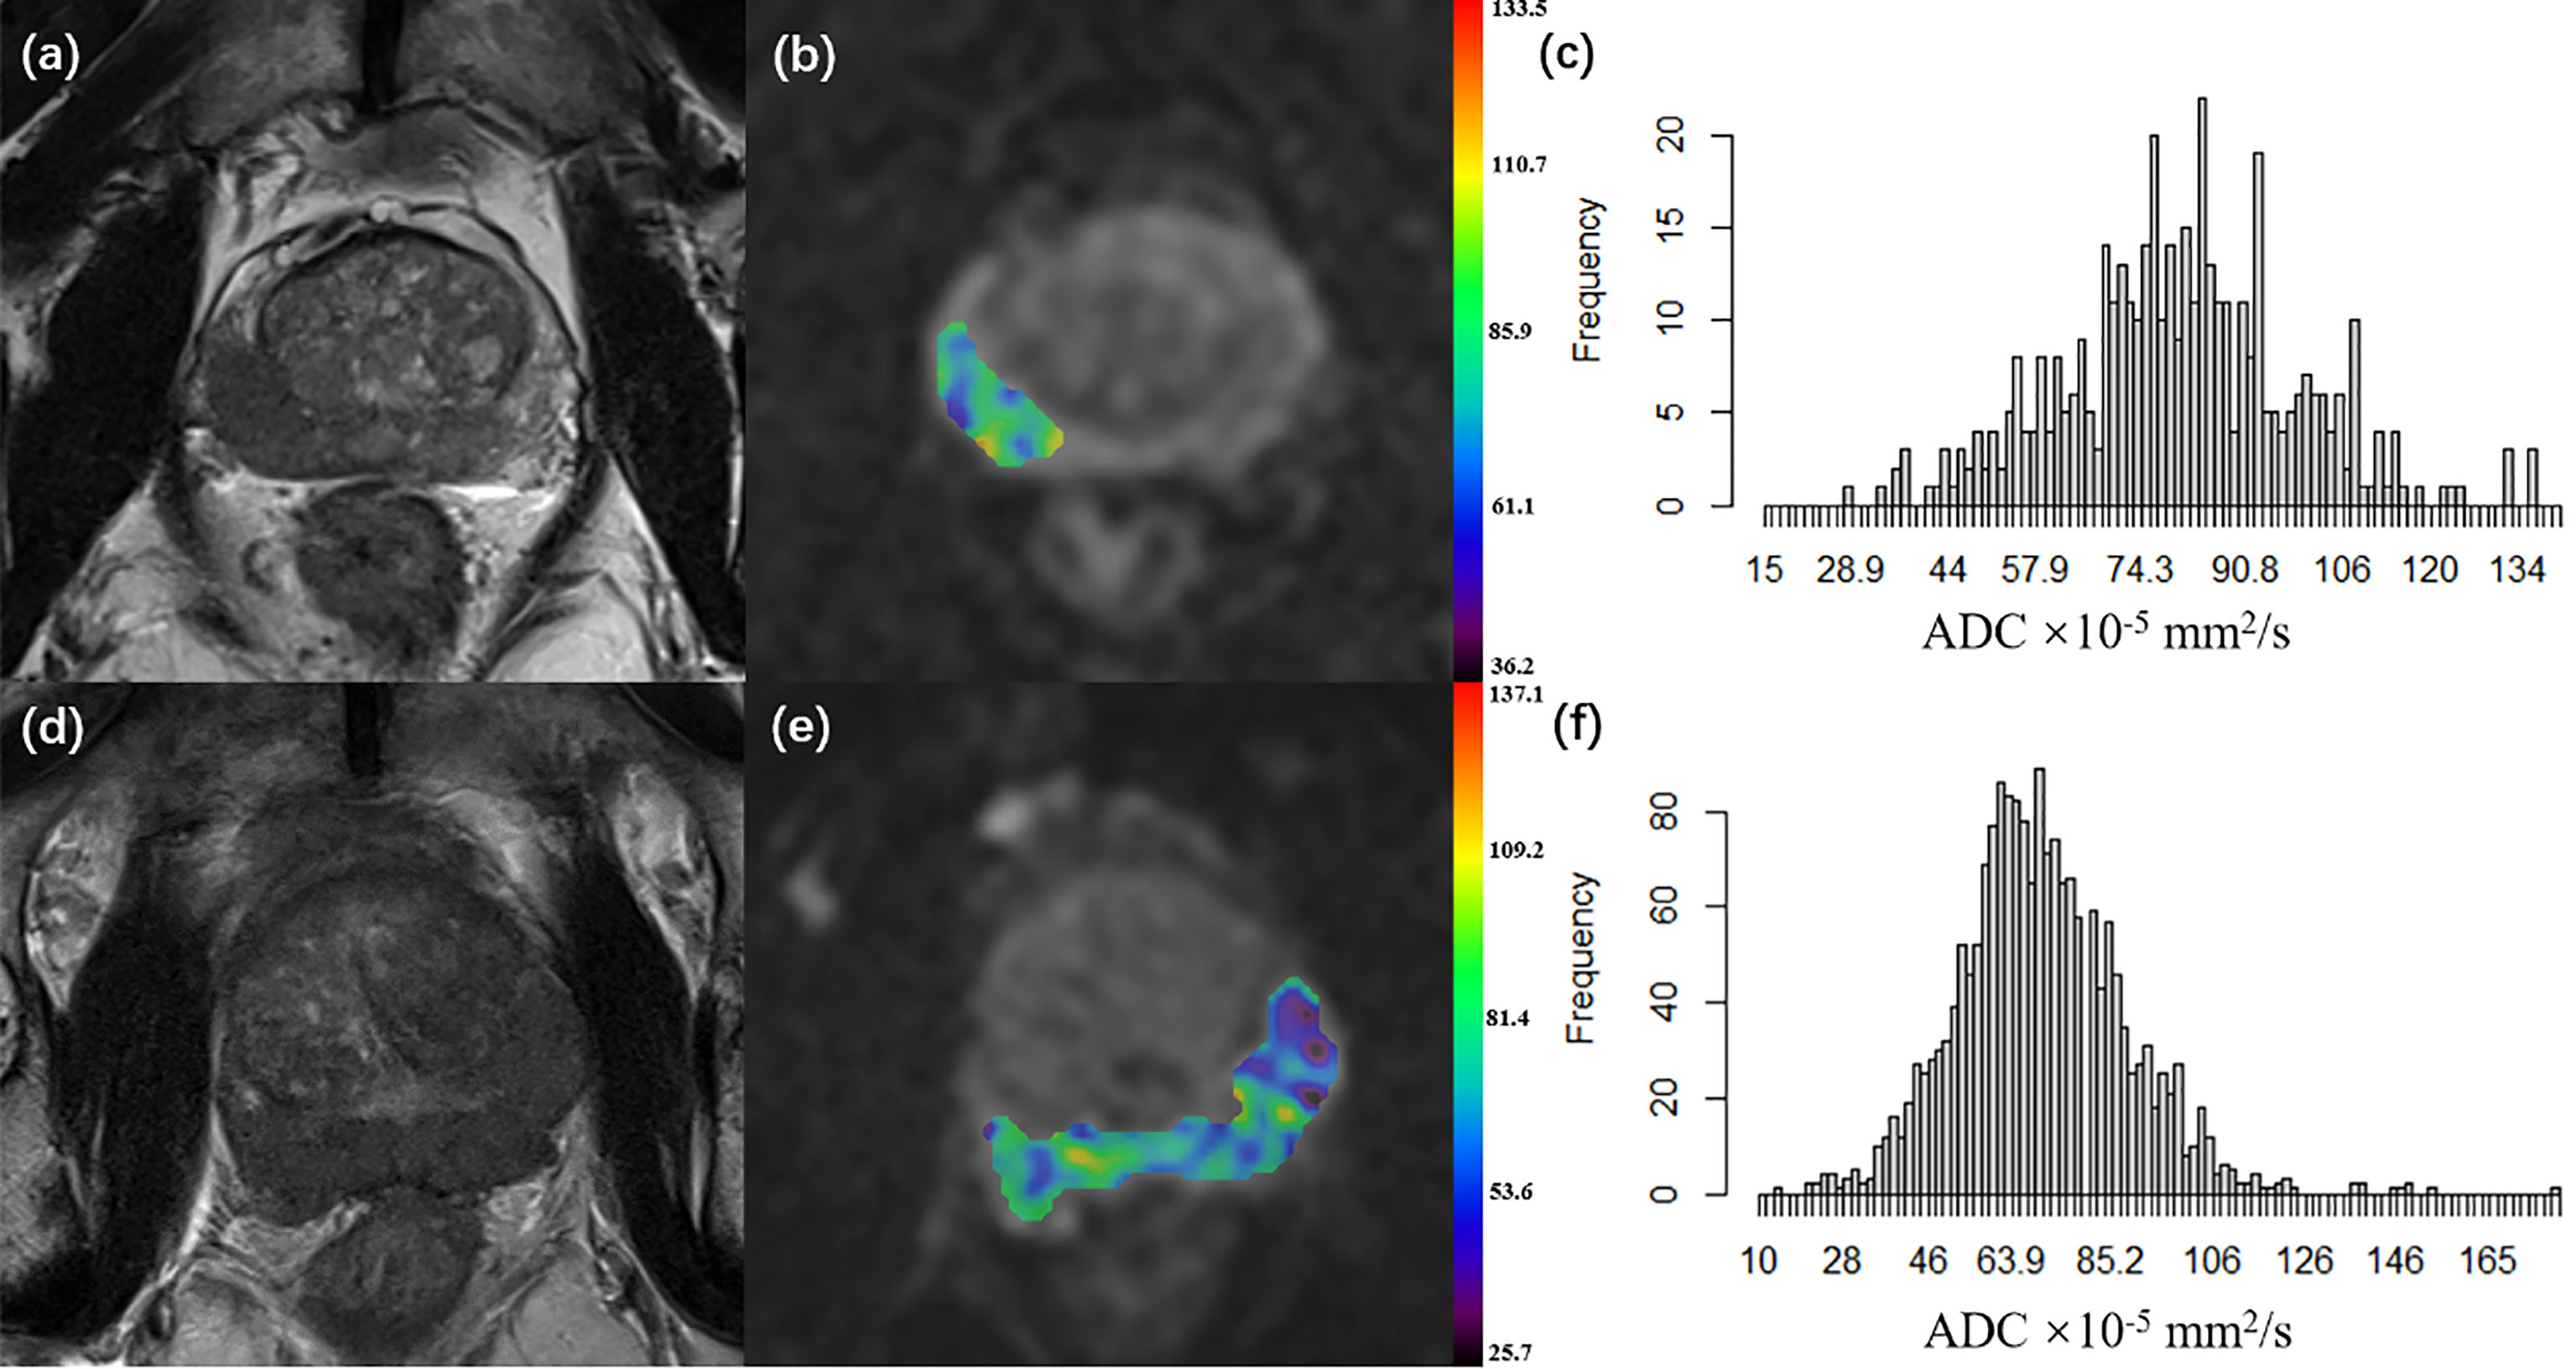
Figure 1 (A–C) A 66-year-old patient with pT2 prostate cancer who did not undergo disease progression. (D–F) A 68-year-old patient with pT3a prostate cancer who underwent disease progression 5.3 months after surgery. (A, D) Axial T2WI; (B, E) Axial diffusion-weighted imaging at b 1000 value with ADC map of the lesion VOI generated from b1000 and b0; (C, F) ADC histogram generated from the VOI. (pT, pathological T grade; T2WI, T2 weighted imaging; ADC, apparent diffusion coefficient, ADC values are given in units of ×10-5 mm2/s; VOI, the volume of interest).
2.4. Clinical outcome
The clinical outcome was biochemical recurrence-free survival (BCR-fs), defined as the time from surgery to biochemical recurrence (BCR). BCR was defined as a PSA increase for two consecutive measurements: a PSA level ≥ 0.2 ng/ml for localized disease and an increase in the PSA level by 25% or more above the nadir (and by ≥2 ng/ml), with confirmation four or more weeks later for lymphatic or distant metastasis cases, according to PCWG3 criteria (20). One patient was censored on the date of the last follow-up.
2.5. Statistical analysis
The statistical analysis was performed using R (Version 4.1.2, R Foundation for Statistical Computing, Vienna, Austria) and Stata software package version 12.1 (StataCorp, College Station, Tex). A two-tailed p<0.05 was considered statistically significant. Continuous data are presented as medians and interquartile ranges (IQRs), while categorical data are presented as frequencies and proportions. The Kaplan−Meier method and the log-rank test were used for univariate survival analysis. Continuous variables such as the ADC parameters and age were dichotomized before Kaplan−Meier curve construction by using optimal cutoff values determined by the “surv_cutpoint” function of the “survminer” R package. The factors with p< 0.100 in univariate analysis were included in multivariate Cox regression analysis to establish the prognostic model of BCR-fs. Prognostic models were built in two ways: one clinical model without ADC parameters and the other clinical-imaging model with ADC parameters as covariates. The variables in the final models were determined by backward stepwise variable selection on the basis of p = 0.100, indicating a significant difference, which can also be used to eliminate multicollinearity. The Harrell concordance index (c index) was calculated to evaluate the performance of the model. In addition, the method mentioned by Newson (21) was used to compare the C indices between models with and without ADC parameters to assess the incremental prognostic value of the ADC parameters. Additionally, receiver operating characteristic curve (ROC) analysis was used to assess the diagnostic accuracy of BCR-fs at 12, 24 and 36 months and to compare the area under the receiver operating characteristic curves (AUC) between the clinical model and clinical imaging model.
Intraclass correlation coefficients (ICCs) were used to evaluate the interrater reliability of ADC parameters. The ICC was interpreted as follows: ≥0.80, excellent reproducibility; 0.61-0.80, good reproducibility; 0.41-0.60, moderate reproducibility; 0.21-0.40, fair reproducibility; and<0.20, poor reproducibility.
3. Result
A total of 62 patients (median age: 66.50 years and IQR: 61.75-71.00 years) with pathologically confirmed prostate cancer were included. All patients were followed up for more than 3 years with a median follow-up period of 54.1 months (range, 41.1–79.3 months). BCR was found in 19 patients (30.6%). The BCR-fs rates at 12, 24 and 36 months were 85.5%, 79.0%, and 71.0%, respectively. The baseline characteristics of the enrolled patients are shown in Table 1.
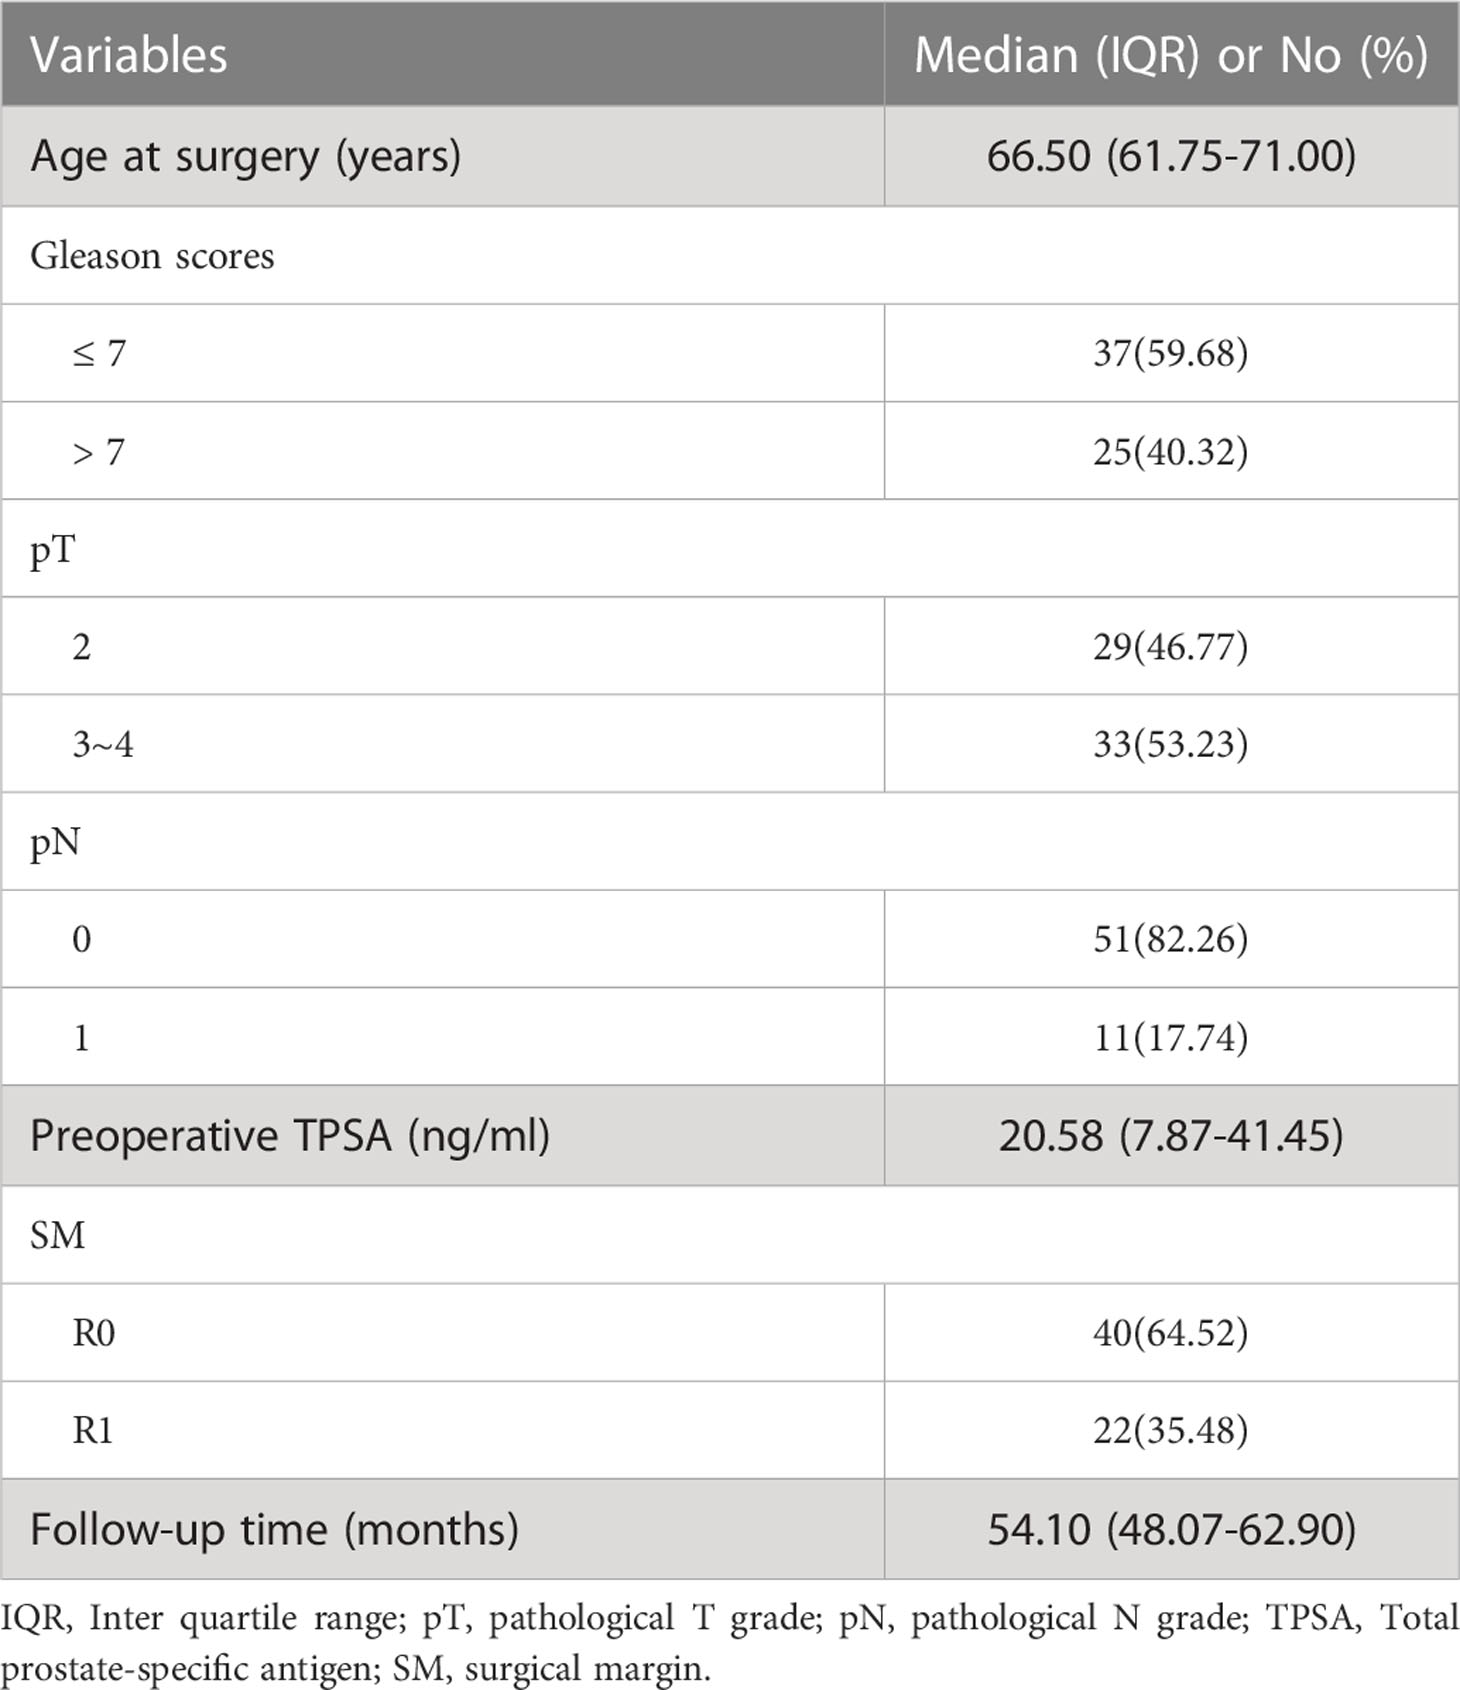
Table 1 Baseline characteristics of all patients (n=62).
ADC histogram parameters demonstrated good to excellent reproducibility (ADC10, ICC: 0.892; ADC90, ICC: 0.917; ADCmean, ICC: 0.803; ADC50, ICC: 0.931; kurtosis, ICC: 0.867; skewness, ICC: 0.820).
In the univariate survival analysis, lower ADC values (ADCmean ≤ 8.59 × 10⁻⁴ mm2/s, ADC10 ≤ 6.18 × 10⁻⁴ mm2/s, ADC50 ≤ 8.28 × 10⁻⁴ mm2/s, ADC90 ≤ 11.7 × 10⁻⁴ mm2/s) and higher kurtosis (> 9.78×10⁻¹) were significant predictors of poorer BCR-fs (all p<.05, Table 2). For clinical parameters, SM R1, TPSA ≥ 24.6 ng/ml, and pT3~pT4 had significant relationships with poor BCR-fs (p = 0.011, p = 0.002, and p = 0.037, respectively). BCR-fs showed no significant differences in age, Gleason score, and pN (Table 2). Kaplan−Meier curves of pT, SM, TPSA ADC10, ADC50, and ADCkurtosis for BCR-fs are shown in Figure 2.
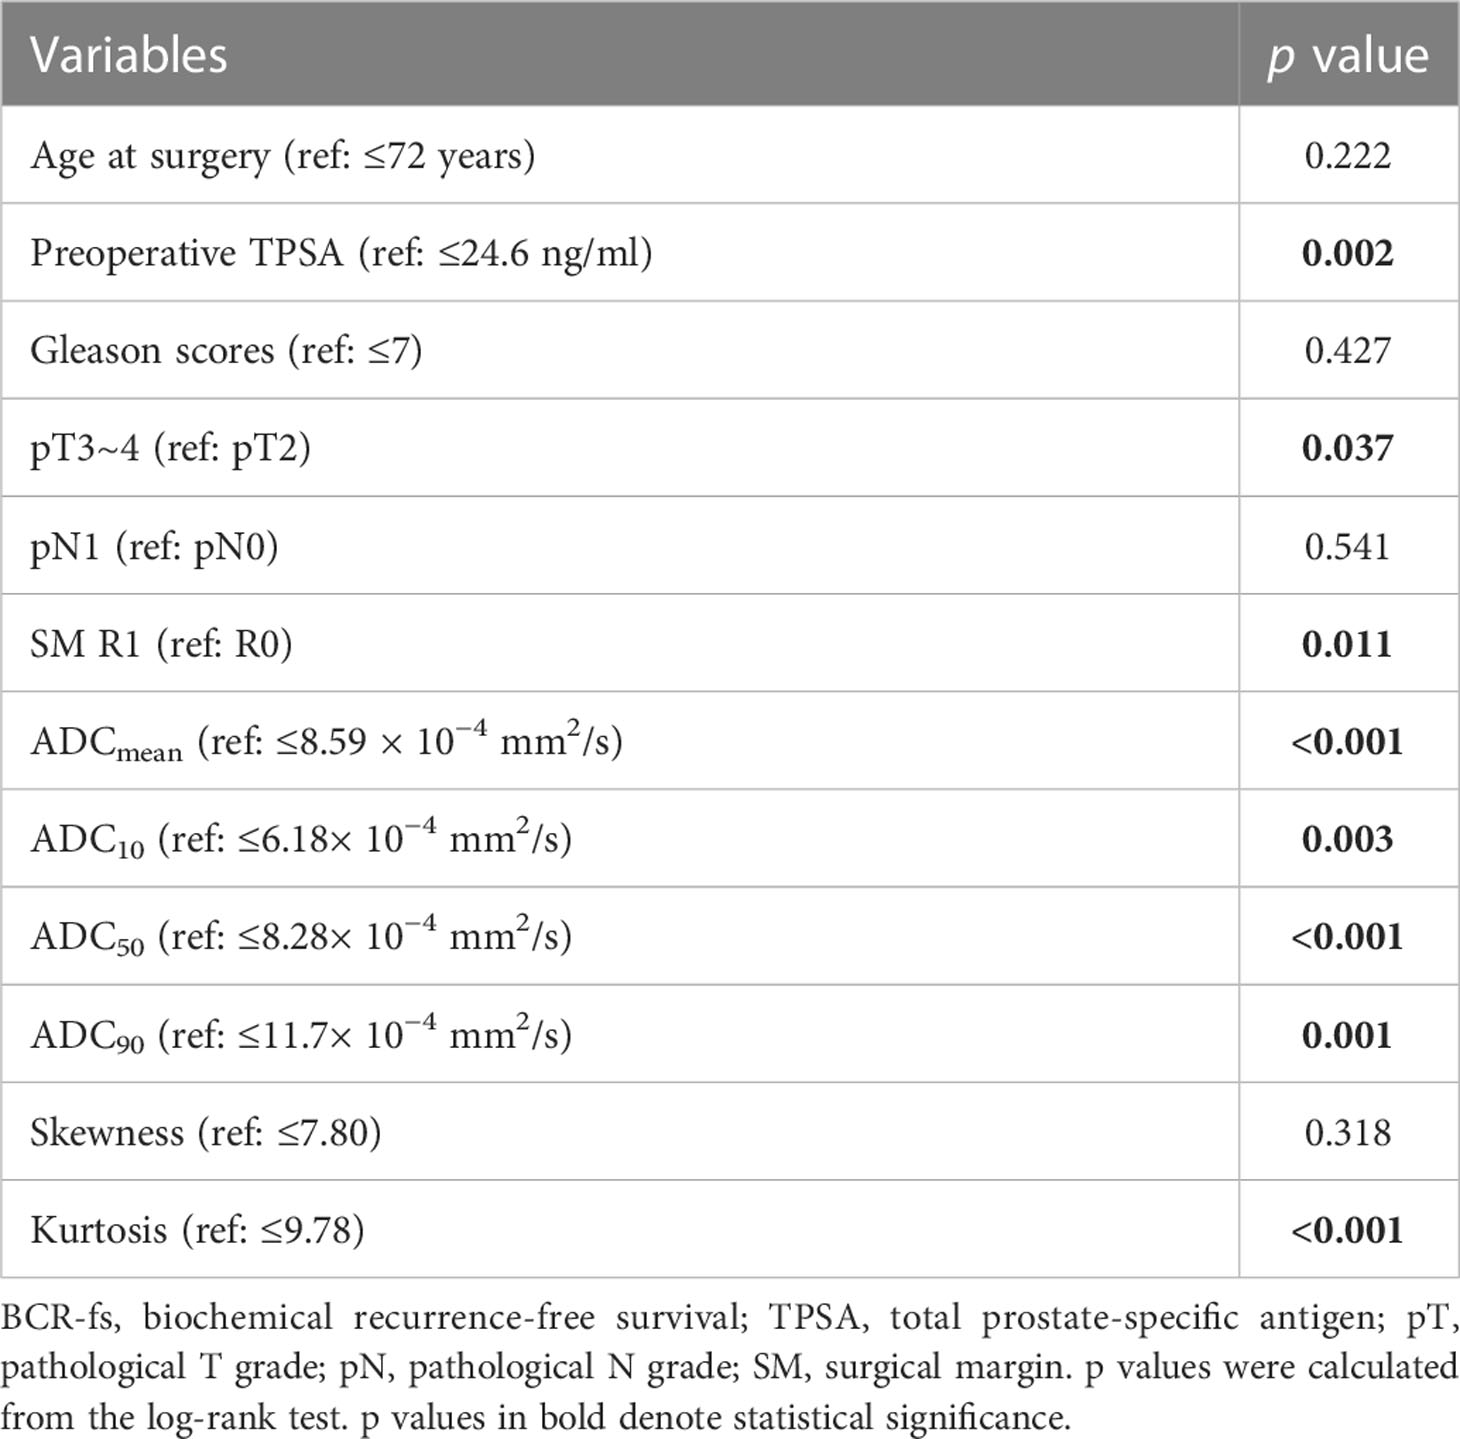
Table 2 Univariable analysis of BCR-fs by K-M analysis and log-rank test.
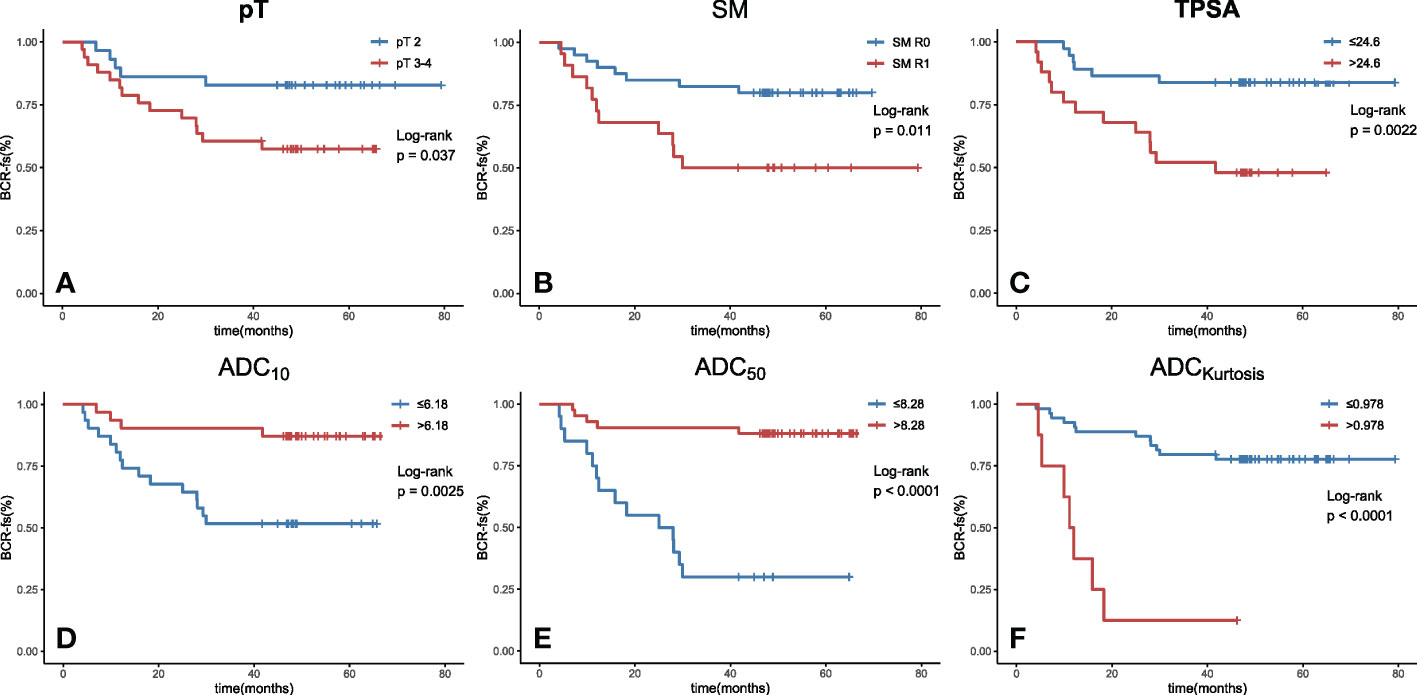
Figure 2 Kaplan−Meier curves with log-rank test for BCR-fs based on (A) pT, (B) SM, (C) TPSA, (D) ADC10, (E) ADC50 and (F) ADCkurtosis. All of these parameters were significant prognostic factors. (BCR-fs, biochemical recurrence-free survival; pT, pathological T staging; SM, surgical margin; TPSA, total prostate-specific antigen; ADC, apparent diffusion coefficient; the values of ADC10, ADC50 are given in units of ×10-4 mm2/s, the value of kurtosis is given in unit of ×10-1 and the value of TPSA is given in unit of ×10-1 ng/ml.).
Multivariate Cox regression analysis was performed for ADCmean, ADC10, ADC50, ADC90, and kurtosis histogram parameters, as well as preoperative TPSA, pT and SM status. ADC50 and kurtosis remained significant (HR: 0.172, 95% CI: 0.055-0.541, p = 0.003; HR: 7.058, 95% CI: 2.288-21.773, p = 0.001;, respectively) after adjustment for clinical factors. The clinical parameters of preoperative TPSA and SM were independent predictors of BCR-fs (HR = 3.824, 95% CI = 1.406-10.402, p = 0.009; HR = 3.067, 95% CI = 1.110-8.477, p = 0.031, respectively).
Then, the clinical model was established with TPSA and surgical margins, while the clinical imaging model was established with ADC50 and kurtosis as covariables. All variables in the clinical model remained significant predictors in multivariate prognostic models of BCR-fs (p<.100 for all), as shown in Table 3. In the comparison of model performance, the C index of the clinical-imaging model was higher than that of the clinical model (C index = 0.85, 95% CI: 0.76-0.94; C index = 0.73, 95% CI: 0.61-0.84, respectively, p = 0.032). The inclusion of histogram parameters improved the diagnostic accuracy of the models for 12-, 24- and 36-month BCR-fs (AUC of clinical imaging model vs clinical model: 0.869 VS 0.733, p = 0.19; 0.859 VS 0.678, p = 0.038; and 0.921 VS 0.7557, p = 0.014; for 12-month, 24-month and 36-month BCR-fs, respectively), in which the improvement in the diagnostic accuracy of BCR-fs at 24 and 36 months was statistically significant (Figure 3).
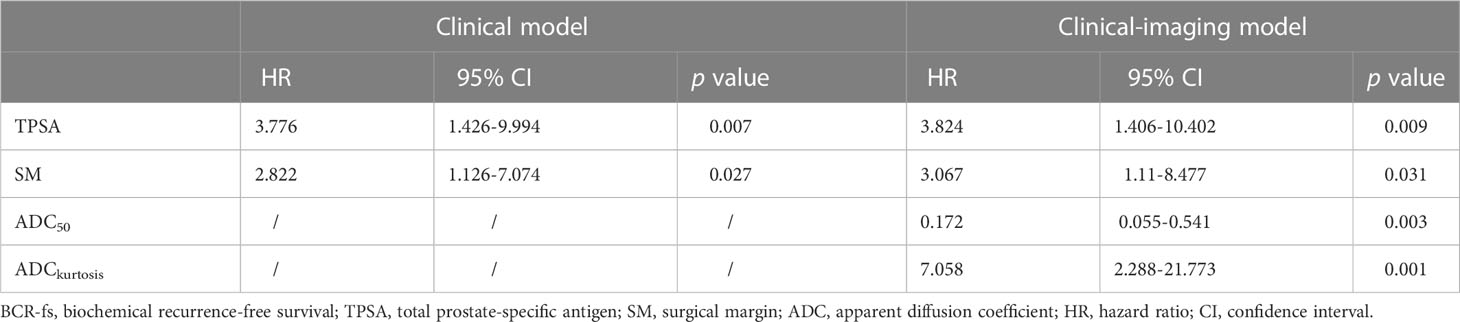
Table 3 Prognostic model analysis with and without histogram parameters for BCR-fs.
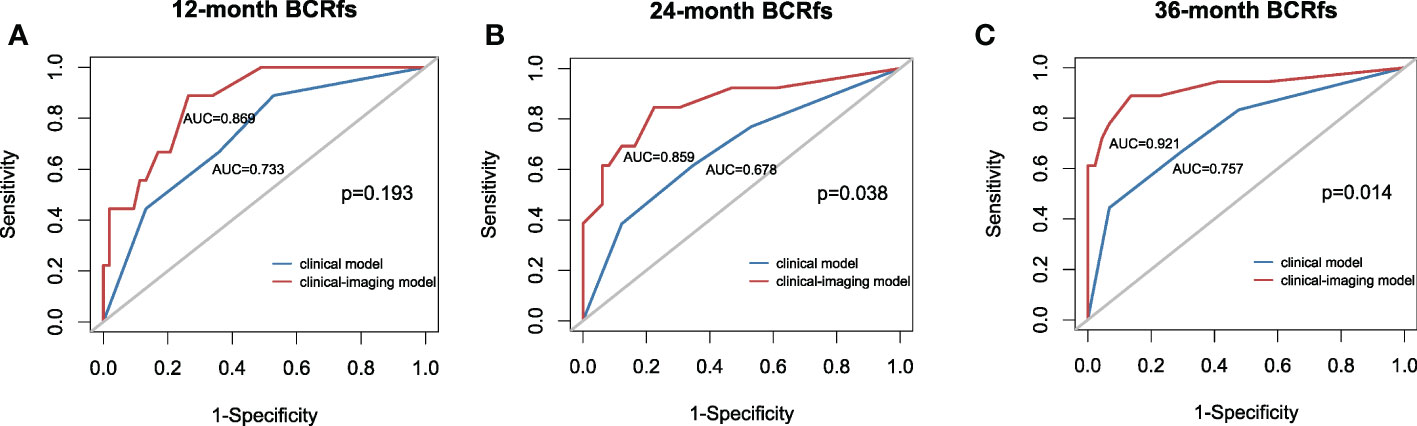
Figure 3 Receiver operating characteristic (ROC) curve with the clinical model and clinical-imaging model used for predicting the (A) 12-month BCR-fs, (B) 24-month BCR-fs and (C) 36-month BCR-fs. The clinical imaging model had higher AUCs than the clinical model in predicting the 12-month, 24-month and 36-month BCR-fs. AUC, area under the curve; BCR-fs, biochemical recurrence-free survival.
4. Discussion
In this study, we evaluated the prognostic value of the ADC histogram derived from preoperative DWI in predicting the BCR of patients with high-risk PCa who underwent RP followed by AHT. The results showed that the ADC50 and kurtosis of the ADC histogram were independent prognostic factors for BCR-fs, and when ADC parameters were incorporated into the clinical model, the prediction accuracy for BCR-fs was improved.
Several tools have been proposed to identify patients at risk for BCR, including preoperative tools, such as the Kattan Nomogram (22) and Prostate Cancer Risk Assessment (CAPRA) score (23), and postoperative tools, such as the Postsurgery Prostate Cancer Risk Assessment (CAPRA-S) score (24, 25). These assessments showed that factors including PSA and SM status were significantly associated with the risk of BCR (24). In our study, we also found that preoperative TPSA, pT stage and SM status were associated with the risk of BCR. Although most studies have demonstrated that the Gleason score is a risk factor for BCR, our study did not find a significant association between the Gleason score and the risk of BCR, similar to the results from a prospective, multicenter cohort of patients with high-risk localized and locally advanced prostate cancer in China who also received adjuvant hormone therapy after radical prostatectomy (26). Moreover, the BCR rate at the 24-month follow-up in our study was 21%, which is also similar to the BCR rate (17.4% at the 24-month follow-up) in that prospective study (26). We did not find any relationship between pN stage and BCR. The differences in the results between our study and other studies may be because of the heterogeneity of the study population and the limited sample size and follow-up time.
MRI is an essential clinical examination for prostate cancer. The diffusion-weighted imaging of MRI is a functional sequence that reflects the degree of restricted diffusion of water and is thought to be related to the cellularity and interstitial structure of pathological tissue. Tumors with different biological behaviors, such as metastasis and recurrence potential, may show different degrees of diffusion restriction. Attempts have been made to integrate MRI into prognostic models to improve the predictive performance (9, 10). Haralick features on T2WI have been previously shown to be associated with BCR in PCa (27, 28). However, the information embodied in the T1 and T2 sequences is more anatomical than functional, and not all patients underwent dynamic contrast-enhanced examination, so we chose DWI as the research object, similar to other histogram analysis studies of different cancers. Bourbonne et al. (29) used radiomics to analyze BCR and BCR-free survival in 107 high-risk PCa patients (pT3–pT4, positive margins, GS 8–10) treated with RP. They found that a texture feature, small zone emphasis (SZEGLSZM) from the ADC map, was strongly correlated with the risk of BCR, independent of other radiomic features and clinical variables. However, the study reported that the MRI was performed on two different MRI scanners: a Phillips 3T and a Siemens 1.5T, which could have some relevant impact on the results. Compared to high-order texture features, which may involve complex statistical computations and less interpretability, first-order textural analysis can be better understood and may have more clinical validity (30).
ADC histogram analysis can yield additional parameters, such as different percentiles of ADC values, skewness, and kurtosis, which can provide more diffusion information than qualitative evaluation and can better reflect tumor heterogeneity. In this study, we evaluated percentile values of ADC10 and ADC90, because they were far from the ADCmean, may provide information that the ADCmean cannot, and are less susceptible to extreme values, like ADCmax and ADCmin. Rosenkrantz et al. (31) found that ADC0-10, the mean of the bottom 10th percentile ADC, rather than the average value of the ADC, was a significant independent predictor for BCR in the multivariate logistic regression analysis. Donati et al. (18) also observed that the AUC of the 10th percentile ADC was significantly higher than the mean ADC to predict the Gleason score. They argued that the 10th percentile ADC was more representative of focal areas of high cellularity than the mean or median values, which were more susceptible to normal glandular tissue (18). However, according to our results, ADC50 remained a significant parameter after stepwise backward regression to rule out collinearity of other ADC percentile values, which means that ADC50 predicts BCR-fs better than ADC10 in PCa patients after RP and AHT. While the reason remains unclear, one possible explanation for the difference between the results of this study and the previous ones is that we studied a different population. We enrolled patients with high-risk localized or locally advanced PCa whose cancer foci may be more prone to necrosis and hemorrhage. When delineating the ROI, micronecrosis and microhemorrhage lesions within the tumor were inevitable, leading to increased ADC values. We assume that micronecrosis and microhemorrhage also play a role in the prognostic value of the ADC histogram; thus, higher percentile ADCs may more comprehensively predict the outcome than lower percentile ADCs. These controversial results indicated the need for further investigation of the mechanisms underlying the association between different percentile ADCs and prognostic values.
Kurtosis is an important indicator of tumor homogeneity and has been reported to be associated with the prognosis of several cancers. Higher kurtosis on DWI was associated with poorer overall survival and relapse-free survival in surgically treated colorectal cancer patients (32). In thyroid cancer, ADC kurtosis was associated with the aggressiveness of the lesion, and higher kurtosis predicted lymphatic metastasis (33). In addition, kurtosis of the ADC histogram could serve as a potential biomarker for the prediction of tumor aggressiveness and survival in esophageal cancer (15). We speculate that the profound changes in the microarchitecture of distinct tumor cell clusters may be related to their recurrence potential, which is reflected in the corresponding changes in the ADC histogram.
In this study, we hypothesized that the prognostic value might increase when ADC histogram parameters were added to traditional clinical factors. Further comparison of the performance of the clinical imaging model and clinical model showed that the C index increased and the p value was 0.032. We also observed an increase in the AUC of the diagnostic accuracy of BCR-fs at 24 months and 36 months. This trend leads us to believe that ADC histogram analysis has incremental prognostic value in the prognosis of PCa patients.
This study has several limitations. First, this single-center, retrospective study could have some possible bias, which needs to be validated in multicenter prospective studies to provide more reliable evidence for clinical application. Second, the sample size is small, with only 62 patients’ survival information available, and it is difficult to set aside an independent validation cohort, which may not have sufficient power to draw conclusions. An independent cohort to validate this finding is required in the future. Studies with larger sample sizes may produce more accurate predictions. In addition, the follow-up time was relatively short, with longer follow-up times required to predict 5-year and 10-year BCR-fs, progression-free survival and overall survival. Besides, the delineation of the tumor ROIs was subjectively free-hand, which may reduce the research reproducibility. A standardization and consensus of the DWI protocol, including the imaging postprocessing method, especially automatic or semiautomatic segmentation, are warranted. Last but not least, this prostate prognostic model was constructed based on high-risk localized and locally advanced PCa, the community-based benefits of this model are limited.
5. Conclusion
Preoperative MRI-derived ADC histogram analysis has incremental prognostic value as an imaging biomarker for the prognosis of patients with high-risk PCa receiving AHT after RP. Our study results demonstrate that ADC50 and kurtosis are the most valuable histogram-derived parameters for predicting BCR-fs in high-risk PCa patients.
Data availability statement
The raw data supporting the conclusions of this article will be made available by the authors, without undue reservation.
Ethics statement
The studies involving human participants were reviewed and approved by the Tongji Hospital of Huazhong University of Science and Technology (Wuhan, China) ethics review committee. Written informed consent for participation was not required for this study in accordance with the national legislation and the institutional requirements.
Author contributions
XM and HL had full access to all the data used in this study and takes responsibility for the accuracy of the data analysis. KH and YZ contributed equally to this work. Study concept and design, XM and HL. Drafting of the manuscript, KH and YZ. Critical revision of the manuscript for important intellectual content, all authors. Image obtaining and postprocessing, XM and PL. Statistical analysis, SL, GY, and QZ. Administrative, technical, or material support, HL and ZL. Study supervision, ZL. All authors contributed to the article and approved the submitted version.
Funding
This research was supported by the National Natural Science Foundation of China (grant numbers 82071889 and 62131009).
Conflict of interest
The authors declare that the research was conducted in the absence of any commercial or financial relationships that could be construed as a potential conflict of interest.
Publisher’s note
All claims expressed in this article are solely those of the authors and do not necessarily represent those of their affiliated organizations, or those of the publisher, the editors and the reviewers. Any product that may be evaluated in this article, or claim that may be made by its manufacturer, is not guaranteed or endorsed by the publisher.
References
1. Sung H, Ferlay J, Siegel RL, Laversanne M, Soerjomataram I, Jemal A, et al. Global cancer statistics 2020: GLOBOCAN estimates of incidence and mortality worldwide for 36 cancers in 185 countries. CA Cancer J Clin (2021) 71(3):209–49. doi: 10.3322/caac.21660
2. Mottet N, Bellmunt J, Bolla M, Briers E, Cumberbatch MG, De Santis M, et al. EAU-ESTRO-SIOG guidelines on prostate cancer. part 1: Screening, diagnosis, and local treatment with curative intent. Eur Urol (2017) 71(4):618–29. doi: 10.1016/j.eururo.2016.08.003
3. Messing EM, Manola J, Yao J, Kiernan M, Crawford D, Wilding G, et al. Immediate versus deferred androgen deprivation treatment in patients with node-positive prostate cancer after radical prostatectomy and pelvic lymphadenectomy. Lancet Oncol (2006) 7(6):472–9. doi: 10.1016/s1470-2045(06)70700-8
4. Siddiqui SA, Boorjian SA, Inman B, Bagniewski S, Bergstralh EJ, Blute ML. Timing of androgen deprivation therapy and its impact on survival after radical prostatectomy: A matched cohort study. J Urol (2008) 179(5):1830–7. doi: 10.1016/j.juro.2008.01.022
5. Bastide C, Rossi D, Lechevallier E, Bladou F, Barriol D, Bretheau D, et al. Seminal vesicle invasion: What is the best adjuvant treatment after radical prostatectomy? BJU Int (2012) 109(4):525–30. doi: 10.1111/j.1464-410X.2011.10332.x
6. Siddiqui SA, Boorjian SA, Blute ML, Rangel LJ, Bergstralh EJ, Karnes RJ, et al. Impact of adjuvant androgen deprivation therapy after radical prostatectomy on the survival of patients with pathological T3b prostate cancer. BJU Int (2011) 107(3):383–8. doi: 10.1111/j.1464-410X.2010.09565.x
7. Chang AJ, Autio KA, Roach M 3rd, Scher HI. High-risk prostate cancer-classification and therapy. Nat Rev Clin Oncol (2014) 11(6):308–23. doi: 10.1038/nrclinonc.2014.68
8. Turkbey B, Choyke PL. Prostate magnetic resonance imaging: Lesion detection and local staging. Annu Rev Med (2019) 70:451–9. doi: 10.1146/annurev-med-053117-123215
9. Park JJ, Kim CK, Park SY, Park BK, Lee HM, Cho SW. Prostate cancer: Role of pretreatment multiparametric 3-T MRI in predicting biochemical recurrence after radical prostatectomy. AJR Am J roentgenol (2014) 202(5):W459–65. doi: 10.2214/AJR.13.11381
10. Hattori S, Kosaka T, Mizuno R, Kanao K, Miyajima A, Yasumizu Y, et al. Prognostic value of preoperative multiparametric magnetic resonance imaging (MRI) for predicting biochemical recurrence after radical prostatectomy. BJU Int (2014) 113(5):741–7. doi: 10.1111/bju.12329
11. Padhani AR, Liu G, Mu-Koh D, Chenevert TL, Thoeny HC, Takahara T, et al. Diffusion-weighted magnetic resonance imaging as a cancer biomarker: Consensus and recommendations. Neoplasia (2009) 11(2):102–25. doi: 10.1593/neo.81328
12. Le Bihan D. Apparent diffusion coefficient and beyond: What diffusion MR imaging can tell us about tissue structure. Radiology (2013) 268(2):318–22. doi: 10.1148/radiol.13130420
13. Zelhof B, Pickles M, Liney G, Gibbs P, Rodrigues G, Kraus S, et al. Correlation of diffusion-weighted magnetic resonance data with cellularity in prostate cancer. BJU Int (2009) 103(7):883–8. doi: 10.1111/j.1464-410X.2008.08130.x
14. Choi YS, Ahn SS, Kim DW, Chang JH, Kang SG, Kim EH, et al. Incremental prognostic value of ADC histogram analysis over MGMT promoter methylation status in patients with glioblastoma. Radiology (2016) 281(1):175–84. doi: 10.1148/radiol.2016151913
15. Hirata A, Hayano K, Ohira G, Imanishi S, Hanaoka T, Toyozumi T, et al. Volumetric histogram analysis of apparent diffusion coefficient as a biomarker to predict survival of esophageal cancer patients. Ann Surg Oncol (2020) 27(8):3083–9. doi: 10.1245/s10434-020-08270-7
16. Zhao B, Cao K, Li XT, Zhu HT, Sun YS. Whole lesion histogram analysis of apparent diffusion coefficients on MRI predicts disease-free survival in locally advanced squamous cell cervical cancer after radical chemo-radiotherapy. BMC Cancer (2019) 19(1):1115. doi: 10.1186/s12885-019-6344-3
17. Peng Y, Jiang Y, Yang C, Brown JB, Antic T, Sethi I, et al. Quantitative analysis of multiparametric prostate MR images: differentiation between prostate cancer and normal tissue and correlation with Gleason score–a computer-aided diagnosis development study. Radiology (2013) 267(3):787–96. doi: 10.1148/radiol.13121454
18. Donati OF, Mazaheri Y, Afaq A, Vargas HA, Zheng J, Moskowitz CS, et al. Prostate cancer aggressiveness: assessment with whole-lesion histogram analysis of the apparent diffusion coefficient. Radiology (2014) 271(1):143–52. doi: 10.1148/radiol.13130973
19. EAU Guidelines. Edn. presented at the EAU annual congress Amsterdam. (2022), ISBN 978-94-92671-16-5. Available at: https://uroweb.org/guidelines/prostate-cancer/chapter/citation-information.
20. Scher HI, Morris MJ, Stadler WM, Higano C, Basch E, Fizazi K, et al. Trial design and objectives for castration-resistant prostate cancer: Updated recommendations from the prostate cancer clinical trials working group 3. J Clin Oncol (2016) 34(12):1402–18. doi: 10.1200/JCO.2015.64.2702
21. Newson RB. Comparing the predictive powers of survival models using harrell’s c or somers’ d. STATA J (2010) 10(3):339–58. doi: 10.1177/1536867X1001000303
22. Kattan MW, Eastham JA, Stapleton AM, Wheeler TM, Scardino PT. A preoperative nomogram for disease recurrence following radical prostatectomy for prostate cancer. J Natl Cancer Institute (1998) 90(10):766–71. doi: 10.1093/jnci/90.10.766
23. Cooperberg MR, Pasta DJ, Elkin EP, Litwin MS, Latini DM, Du Chane J, et al. The university of California, San Francisco cancer of the prostate risk assessment score: A straightforward and reliable preoperative predictor of disease recurrence after radical prostatectomy. J Urol (2005) 173(6):1938–42. doi: 10.1097/01.ju.0000158155.33890.e7
24. Cooperberg MR, Hilton JF, Carroll PR. The CAPRA-s score: A straightforward tool for improved prediction of outcomes after radical prostatectomy. Cancer (2011) 117(22):5039–46. doi: 10.1002/cncr.26169
25. Punnen S, Freedland SJ, Presti JC Jr., Aronson WJ, Terris MK, Kane CJ, et al. Multi-institutional validation of the CAPRA-s score to predict disease recurrence and mortality after radical prostatectomy. Eur Urol (2014) 65(6):1171–7. doi: 10.1016/j.eururo.2013.03.058
26. Ye D, Zhang W, Ma L, Du C, Xie L, Huang Y, et al. Adjuvant hormone therapy after radical prostatectomy in high-risk localized and locally advanced prostate cancer: First multicenter, observational study in China. Chin J Cancer Res (2019) 31(3):511–20. doi: 10.21147/j.issn.1000-9604.2019.03.13
27. Gnep K, Fargeas A, Gutierrez-Carvajal RE, Commandeur F, Mathieu R, Ospina JD, et al. Haralick textural features on T2 -weighted MRI are associated with biochemical recurrence following radiotherapy for peripheral zone prostate cancer. J Magn Reson Imaging (2017) 45(1):103–17. doi: 10.1002/jmri.25335
28. Shiradkar R, Ghose S, Jambor I, Taimen P, Ettala O, Purysko AS, et al. Radiomic features from pretreatment biparametric MRI predict prostate cancer biochemical recurrence: Preliminary findings. J Magn Reson Imaging (2018) 48(6):1626–36. doi: 10.1002/jmri.26178
29. Bourbonne V, Vallières M, Lucia F, Doucet L, Visvikis D, Tissot V, et al. MRI-Derived radiomics to guide post-operative management for high-risk prostate cancer. Front Oncol (2019) 9:807. doi: 10.3389/fonc.2019.00807
30. Patel N, Henry A, Scarsbrook A. The value of MR textural analysis in prostate cancer. Clin Radiol (2019) 74(11):876–85. doi: 10.1016/j.crad.2018.11.007
31. Rosenkrantz AB, Ream JM, Nolan P, Rusinek H, Deng FM, Taneja SS. Prostate cancer: Utility of whole-lesion apparent diffusion coefficient metrics for prediction of biochemical recurrence after radical prostatectomy. AJR Am J roentgenol (2015) 205(6):1208–14. doi: 10.2214/AJR.15.14482
32. Takahashi Y, Hayano K, Ohira G, Imanishi S, Hanaoka T, Watanabe H, et al. Histogram analysis of diffusion-weighted MR imaging as a biomarker to predict survival of surgically treated colorectal cancer patients. Dig Dis Sci (2021) 66(4):1227–32. doi: 10.1007/s10620-020-06318-y
33. Schob S, Meyer HJ, Dieckow J, Pervinder B, Pazaitis N, Höhn AK, et al. Histogram analysis of diffusion weighted imaging at 3T is useful for prediction of lymphatic metastatic spread, proliferative activity, and cellularity in thyroid cancer. Int J Mol Sci (2017) 18(4):821. doi: 10.3390/ijms18040821
Keywords: high-risk prostate cancer, biochemical recurrence, magnetic resonance imaging, apparent diffusion coefficient, histogram analysis
Citation: He K, Zhang Y, Li S, Yuan G, Liang P, Zhang Q, Xie Q, Xiao P, Li H, Meng X and Li Z (2023) Incremental prognostic value of ADC histogram analysis in patients with high-risk prostate cancer receiving adjuvant hormonal therapy after radical prostatectomy. Front. Oncol. 13:1076400. doi: 10.3389/fonc.2023.1076400
Received: 21 October 2022; Accepted: 05 January 2023;
Published: 25 January 2023.
Edited by:
Hongzan Sun, Shengjing Hospital of China Medical University, ChinaReviewed by:
Jing Ren, Fourth Military Medical University, ChinaSha Zhu, Sichuan University, China
Di Gu, First Affiliated Hospital of Guangzhou Medical University, China
Copyright © 2023 He, Zhang, Li, Yuan, Liang, Zhang, Xie, Xiao, Li, Meng and Li. This is an open-access article distributed under the terms of the Creative Commons Attribution License (CC BY). The use, distribution or reproduction in other forums is permitted, provided the original author(s) and the copyright owner(s) are credited and that the original publication in this journal is cited, in accordance with accepted academic practice. No use, distribution or reproduction is permitted which does not comply with these terms.
*Correspondence: Heng Li, lihengtjmu@163.com; Xiaoyan Meng, xymeng@hust.edu.cn
†These authors have contributed equally to this work and share first authorship