 Zhiyong Chen1†
 Li Yi1†
 Zhiwei Peng1
 Jianzhong Zhou2
 Zhaotao Zhang1Yahong Tao1
 Ze Lin1Anjing He1
 Mengni Jin1
 Minjing Zuo1*
- 1Department of Radiology, The Second Affiliated Hospital of Nanchang University, Nanchang, China
- 2Department of Radiology, The Quzhou City People’s Hospital, Quzhou, Zhejiang, China
Objective: Based on pretherapy dual-energy computed tomography (DECT) images, we developed and validated a nomogram combined with clinical parameters and radiomic features to predict the pathologic subtypes of non-small cell lung cancer (NSCLC) — adenocarcinoma (ADC) and squamous cell carcinoma (SCC).
Methods: A total of 129 pathologically confirmed NSCLC patients treated at the Second Affiliated Hospital of Nanchang University from October 2017 to October 2021 were retrospectively analyzed. Patients were randomly divided in a ratio of 7:3 (n=90) into training and validation cohorts (n=39). Patients’ pretherapy clinical parameters were recorded. Radiomics features of the primary lesion were extracted from two sets of monoenergetic images (40 keV and 100 keV) in arterial phases (AP) and venous phases (VP). Features were selected successively through the intra-class correlation coefficient (ICC) and the least absolute shrinkage and selection operator (LASSO). Multivariate logistic regression analysis was then performed to establish predictive models. The prediction performance between models was evaluated and compared using the receiver operating characteristic (ROC) curve, DeLong test, and Akaike information criterion (AIC). A nomogram was developed based on the model with the best predictive performance to evaluate its calibration and clinical utility.
Results: A total of 87 ADC and 42 SCC patients were enrolled in this study. Among the five constructed models, the integrative model (AUC: Model 4 = 0.92, Model 5 = 0.93) combining clinical parameters and radiomic features had a higher AUC than the individual clinical models or radiomic models (AUC: Model 1 = 0.84, Model 2 = 0.79, Model 3 = 0.84). The combined clinical-venous phase radiomics model had the best predictive performance, goodness of fit, and parsimony; the area under the ROC curve (AUC) of the training and validation cohorts was 0.93 and 0.90, respectively, and the AIC value was 60.16. Then, this model was visualized as a nomogram. The calibration curves demonstrated it’s good calibration, and decision curve analysis (DCA) proved its clinical utility.
Conclusion: The combined clinical-radiomics model based on pretherapy DECT showed good performance in distinguishing ADC and SCC of the lung. The nomogram constructed based on the best-performing combined clinical-venous phase radiomics model provides a relatively accurate, convenient and noninvasive method for predicting the pathological subtypes of ADC and SCC in NSCLC.
1 Introduction
Lung cancer is the second most common cancer worldwide and the leading cause of cancer death (1). Non-small cell lung cancer (NSCLC) accounts for approximately 85% of lung cancers, with adenocarcinoma (ADC) and squamous cell carcinoma (SCC) being the most common subtypes (2, 3). In recent years, the prognosis of some lung cancer patients has improved thanks to the rapid development of individualized medicine and precise therapy, such as targeted therapies and immunotherapy (4–6). However, different pathological subtypes have distinct phenotypic and biological characteristics, which directly affect clinical treatment and outcomes (6–8). For example, bevacizumab has good effects in the treatment of lung adenocarcinoma, but it may lead to a lung squamous cell carcinoma patient bleeding profusely (9). Therefore, it is important to accurately predict pathological subtypes before treatment to establish better therapeutic strategies for NSCLC.
Currently, invasive biopsy for histological confirmation is usually performed before the treatment of NSCLC (9, 10). However, it is difficult to obtain a biopsy for several reasons. First, lung cancer is a heterogeneous tumor, and the tissue obtained from the biopsy of the lung tumor may contain only a few tumor cells and may not reflect the complete biological information (5, 9). Then, tumor samples are difficult to obtain in some patients, ang biopsy is contraindicated, and so on. In addition, biopsy may also increase the potential risk of cancer transmission (11). Therefore, it is necessary to develop a reliable, non-invasive, safe and economical approach to help pretherapy predict the pathological subtypes in NSCLC for treatment decision-making and prognosis estimation in NSCLC patients.
Dual-energy computed tomography (DECT) is a new technology in the field of CT imaging in recent years. It not only shows the morphological features of tumors, but also provides extensive quantitative information (12). Many studies have used DECT for tumor diagnosis and prediction. Zhang et al. (13) found that quantitative parameters based on venous phase DECT, including iodine concentration (IC), normalized iodine concentration (NIC), and slope of the curve (λHU), can effectively distinguish ADC and SCC of the lung. Radiomics analyzes medical images in an automated high-throughput manner and aims to extract quantitative and reproducible tumor information that the human eye cannot distinguish, quantify tumor heterogeneity, and monitor tumor development, progression, and even prognosis (14–17). Many studies have explored the role of radiomics in the pathological classification of NSCLC. Zhu et al. (18) enrolled 129 NSCLC patients for retrospective studies, and the LASSO regression model was constructed by screening 5 radiomic features. The result was that the radiomic features could be used as a diagnostic factor to distinguish the histological subtypes of NSCLC.
To further explore the additional value of the DECT image, some studies combine DECT with radiomics. Liu et al. (19) built and evaluated a pretherapy dual-energy CT-based clinical-radiomics model that can effectively predict the clinical response to systemic chemotherapy in patients with advanced gastric cancer (AGC). However, to our knowledge, the application and potential advantages of DECT-based radiomics in predicting the pathological subtypes of NSCLC have not been explored. Theoretically, DECT contains more information than single-energy CT. Radiomic analysis of DECT images may extract more features relevant to tumor heterogeneity and biology.
Therefore, the aim of this study was to establish an independent predictive model for predicting the pathological subtypes of NSCLC by combining clinical parameters and DECT-based radiomic features. In addition, we provide a visually quantitative nomogram in clinical practice, as an additional predictive method for patients who cannot obtain pathological subtypes before treatment.
2 Materials and methods
2.1 Patients
Eligible patients with NSCLC treated at the Second Affiliated Hospital of Nanchang University between October 2017 and October 2021 were retrospectively analyzed. This single-center retrospective study was approved by the Ethics Committee of Second Affiliated Hospital of Nanchang University (Ethics Number: 2017061), and the requirement of informed consent was exempted due to the retrospective study design. The inclusion criteria were as follows: 1) all patients had standard DECT plain scan and enhanced scan images; 2) all lesions were examined by DECT within two weeks, and pathological results were confirmed by puncture biopsy, fiberoptic bronchoscopy or surgical resection; 3) lesion diameter >10 mm, and the boundary was clear; and 4) all patients had detailed clinical data, including age, sex, smoking history, etc. Exclusion criteria included the following: 1) patients who have been or are being treated for oncological disease; 2) dense metal or implants interference in the scanning area; and 3) patients who cannot cooperate during scanning and who experience respiratory motion artifacts.
The patient recruitment process is presented in Figure 1. A total of 129 patients were randomly divided at a ratio of 7:3 into training and validation cohorts. The training cohort consisted of 90 patients (ADC 61, SCC 29), whereas the validation cohort consisted of 39 patients (ADC 26, SCC 13).

Figure 1 Flow chart showing the patient selection and exclusion.
2.2 Clinical features
The following pretherapy clinical features of each patient were recorded from the medical system: age, sex, smoking status (never, ever/always), carcinoembryonic antigen (CEA) level, and distant metastasis (with/without).
2.3 Dual-energy CT image acquisition
The patient was in the supine position. After breath holding at the end of inhalation, the dual-energy plain scan and dual-energy enhanced scan in AP and VP were performed from the thoracic inlet to the bottom of the lung.
CT scans were performed in DE mode on a second-generation dual-source CT scanner (SOMATOM Definition FLASH, Siemens Healthcare, Germany). After unenhanced CT was performed, 350 mg I/mL of nonionic iodinated contrast agent (Ioversol) at a dose of 1.2 mL/kg weight was injected into an antecubital vein together with 20 mL of saline at rates of 3 mL/s and 4 mL/s, respectively. AP and VP dual-energy contrast-enhanced CT images were obtained after post-injection delays of 30 and 60 s, respectively. The scan parameters for the DECT mode were summarized as follows. The tube voltages of A and B were set at 100 kVp and 140 kVp, respectively, with a real-time adjustable variable tube current. Collimation was 128 × 0.6 mm; rotation speed was 0.28 s/r; gantry rotation was 330 ms; slice thickness was 5 mm. Finally, 100 kVp and 140 kVp images were acquired in the arterial and venous phases, respectively, and 120 kVp equivalent mixed images were generated (linear fusion coefficient, 0.4). These images were reconstructed with a slice thickness of 1 mm and an interval of 1 mm using iterative reconstruction software (SAFIRE, Siemens Healthcare, Germany).
2.4 Dual energy-CT image analysis
CT Semantic Feature Acquisition: Two radiologists (with five and fifteen years of experience in diagnostic thoracic imaging), blinded to the patient’s pathologic data, viewed and analyzed the 120 kVp equivalent hybrid images and obtained CT semantic features of each lesion. Six CT semantic features for each mass were included (1): spiculation sign (2), lobulation sign (3), null vacuole sign (4), tumor location (central/peripheral type) (5), pleural effusion on the tumor side (yes/no), and (6) pericardial effusion (yes/no). If any disagreements arose, final consensus was reached through group discussions.
DECT Quantitative Parameter Acquisition: Data from AP and VP DECT were loaded and postprocessed using specific software (Siemens Healthcare, Germany). The iodine diagram was obtained by the Liver VNC program. Manually, the region of interest (ROI) was drawn as large as possible on the solid part of the primary lesion, avoiding tumor margins, necrosis, cavities, calcifications and large vessels. Then, the iodine concentration (IC, mean value, units of 100 μg/ml) of the lesion was recorded in the ROI. Simultaneously, ROIs were placed in the same slice to obtain the ICs of the aorta. Finally, the normalized iodine concentration (NIC) was calculated according to the following formula: NIC = IC (lesion)/IC (artery). Then, through the Monogenetic program, the CT values of 40 keV and 100 keV single energy images of the solid part of the lesion were recorded. The slope of the spectrum attenuation curves (λHU) was calculated using the following formula: λHU=((CT40KeV-CT100keV)/60). All data were measured three times and averaged.
2.5 Radiomic analysis
2.5.1 Tumor segmentation
The 40-keV and 100-keV monoenergetic images (NIFTI format) reconstructed in AP and VP were imported into the open source software ITK-snap (version 3.8.0, University of Pennsylvania, USA, http://www.itksnap.org). A radiologist (with five years of experience in diagnostic thoracic imaging) performed semi-automatic or manual combined semi-automatic layer-by-layer segmentation of the lung window.
2.5.2 Feature extraction
Artificial Intelligence Kit software (A.K. Software; GE Healthcare, China) was used to extract the radiomics features from each ROI. A total of 107 features were extracted including first-order statistical features, shape features, and texture features. In addition, the software provides a variety of options to standardize image preprocessing before feature extraction. The extracted features were reproducible and based on the benchmarks of the image biomarker standardization initiative (IBSI).
2.5.3 Feature selection
To assess segmentation variability, 20 patients were randomly selected and re-segmented after one month by the same two radiologists. The inter- and intra-observer reproducibility of tumor segmentation was assessed by intraclass correlation coefficients (ICCs). The features with an ICC greater than 0.75 are defined as having good repeatability. After selecting the repeatable features based on ICC, the LASSO algorithm was applied to select the most useful predictive features in the training cohort.
2.5.4 Radiomics model establishment
Radiomics models were established by multivariable logistic regression analysis of radiomic features selected in the images from AP and VP DECT. Radiomic signatures, also called the radiomic score (Rad-score), were calculated separately for the training and validation cohorts in the AP and VP via a linear combination of selected features weighted by their respective coefficients in the model.
2.6 Clinical model and nomogram establishment
Clinical features, CT semantic features, and DECT quantification parameters are collectively referred to as clinical parameters in this study.
Univariate analysis was performed for candidate clinical parameters. The significant variables (p value < 0.05) in the univariable analysis were then introduced into stepwise logistic regression analyses. The independent clinical predictors were determined and the clinical model was established. Then, the selected clinical predictors were combined with the radiomic signatures of the arterial and venous phases to establish two combination models. To visualize the prediction results of the model for ADC and SCC, the nomogram was developed based on the model with the best performance.
2.7 Evaluation and comparison of model performance
Evaluation of the model included discrimination, calibration, and clinical utility. Receiver operating characteristic (ROC) curve analysis was used to evaluate the predictive performance of each model. The Delong test was used to compare the difference in the area under the curve (AUC) between different models. The Akaike information criterion (AIC) is used to compare the goodness of fit and parsimony between models. Calibration curves were constructed to describe calibration performance based on the agreement between predicted and actual response probabilities. Decision curve analysis (DCA) was used to determine the value of the predictive model for clinical application and to determine the net benefit to patients at each threshold probability.
2.8 Statistical analysis
IBM SPSS 25.0 (IBM, Armonk, NY, USA) software was used for statistical analysis of clinical parameters: Normality of distribution of continuous variables was tested using a Kolmogorov–Smirnov test; independent samples t-test (or Mann-Whitney U-test) for continuous variables and chi-square test for categorical variables.
Other statistical analyses were conducted with R (version 4.1.2, http://www.r-project.org) software. The “MASS” package was used for stepwise logistic regression to further filter clinical features. The “glmnet” package was used for lasso logistic regression to filter radiomic features and multiple logistic regression to build models. The “pROC” package was used for plotting ROC curves and calculating AUC values and related indicators. And the “rms” package was used for drawing nomograms and calibration curves. The Delong test was used for comparison between models, and the Akaike information criterion (AIC) was used for model ranking and selection. Two-sided p values < 0.05 indicate statistical significance.
3 Results
3.1 Clinical parameters
A total of 129 NSCLC patients, including 87 ADC patients and 42 SCC patients, were enrolled in this study. After univariate analysis, eight clinical parameters, including age, sex, smoking status, spiculation sign, tumor location (central/peripheral type), distant metastasis (with/without), NIC and λ HU in the VP, were significantly associated with the pathological subtypes of NSCLC (p < 0.05; the results of univariate analysis of patients’ clinical parameters are shown in Table 1). Subsequently, three of these parameters (sex, distant metastasis, and NIC in the VP) were selected using stepwise logistic analysis to form the clinical model (related data in eTable 1 in the Supplementary Materials).
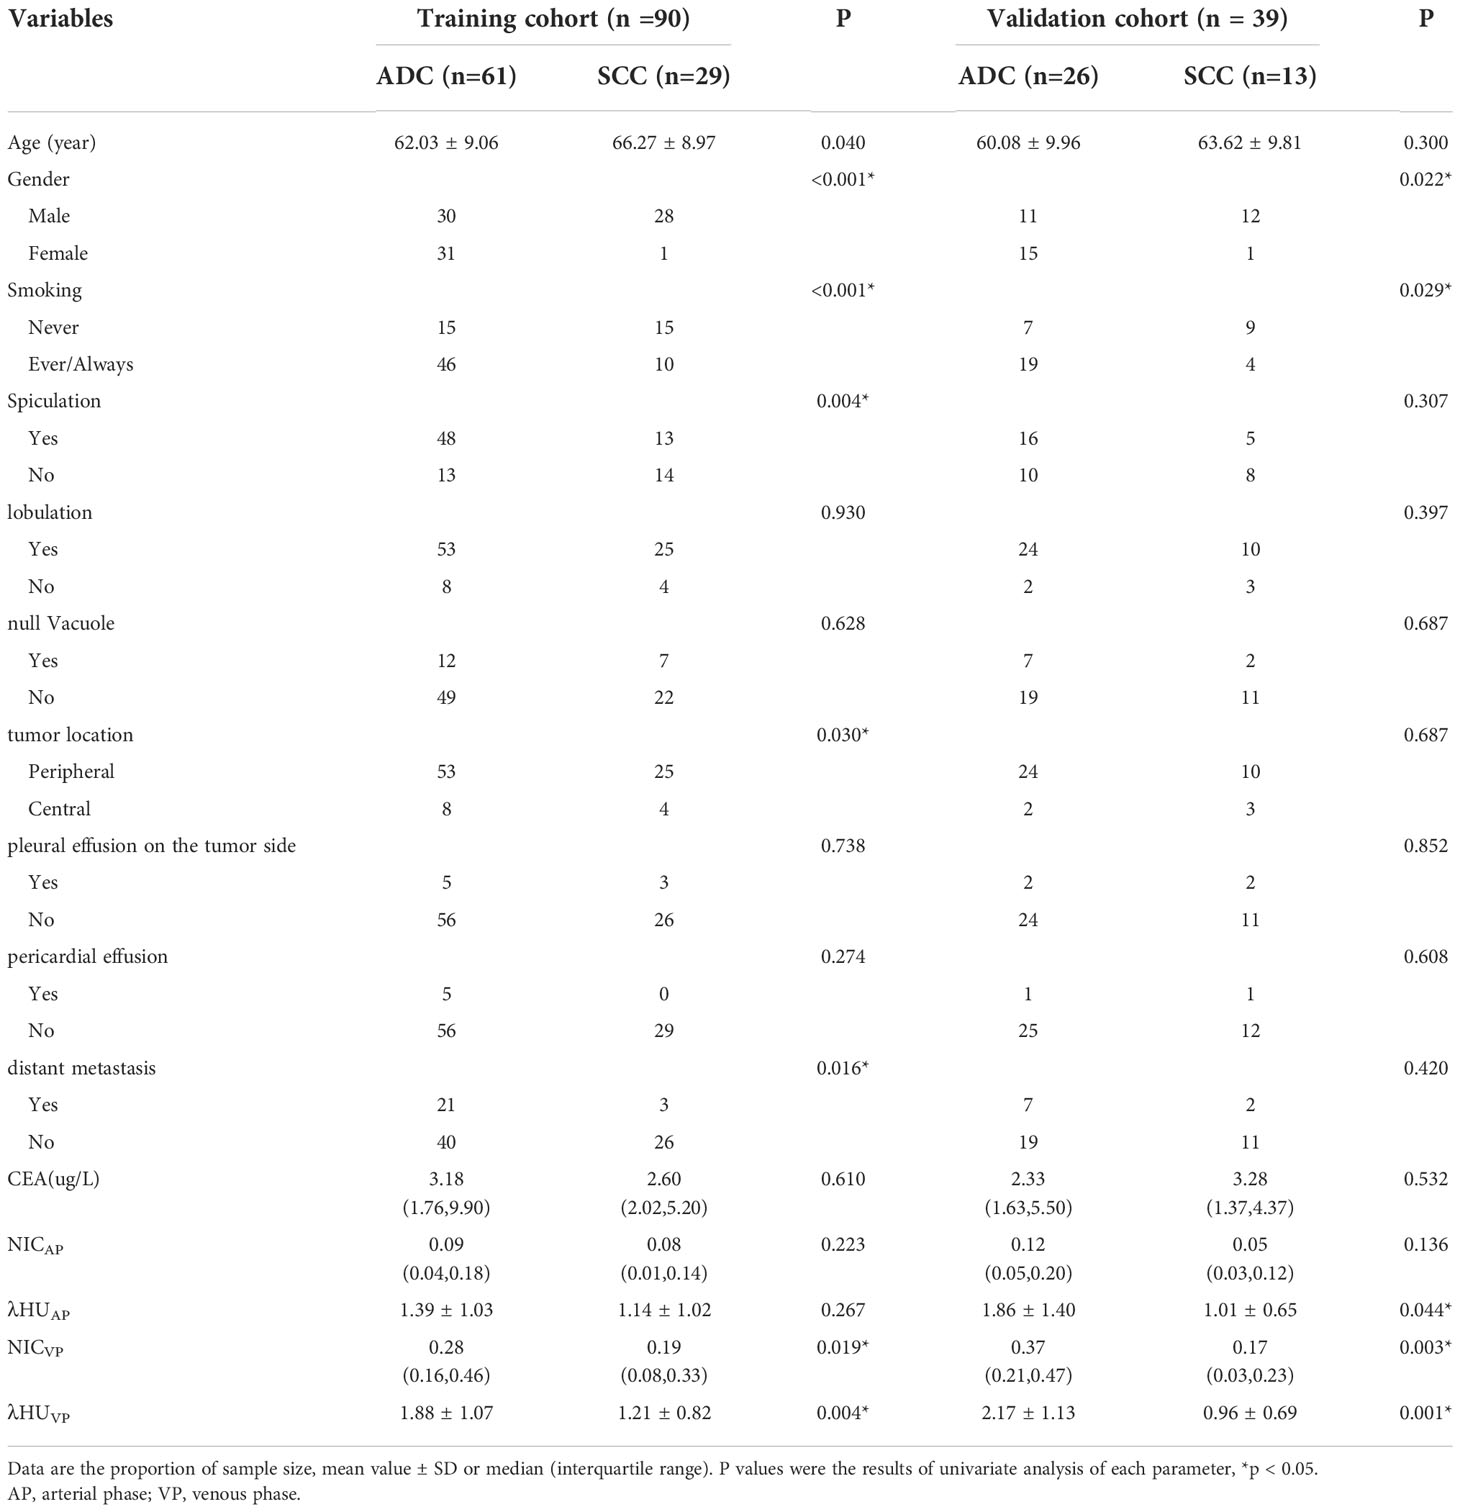
Table 1 Clinical parameters of patients.
3.2 Radiomic features selection and radiomic signature building
The workflow of tumor segmentation, feature extraction and selection, model establishment and evaluation is illustrated in Figure 2. A total of 107 features were extracted from the reconstructed 40 keV and 100 keV monoenergetic images from AP and VP DECT for each patient, respectively. Excluding features with low reproducibility according to ICC (intra- and inter-observer ICC <0.75, ICC results are shown in eTable 2 in the Supplementary Materials). Thus, the numbers of 40 keV and 100 keV in the AP (AP40 keV, AP100 keV), and 40 keV and 100 keV in the VP (VP40 keV, VP100 keV) features were reduced to 76, 78, 86 and 84 respectively. Then, the LASSO algorithm was used to exclude redundant features. This left 2, 3, 5, and 5 features at AP 40 keV, AP 100 keV, VP 40 keV, and VP 100 keV respectively (eTable 3 in the Supplementary Materials). Finally, the five features selected from 40-keV and 100-keV DECT images in AP were combined, and the radiomic signature based on AP (rad-score AP) was established by multivariate logistic regression analysis in the training cohort. The same method was used to establish the radiomic signature based on VP (rad-scoreVP). The radiomic score calculation formula is presented in eTable 1 in the Supplementary Materials.
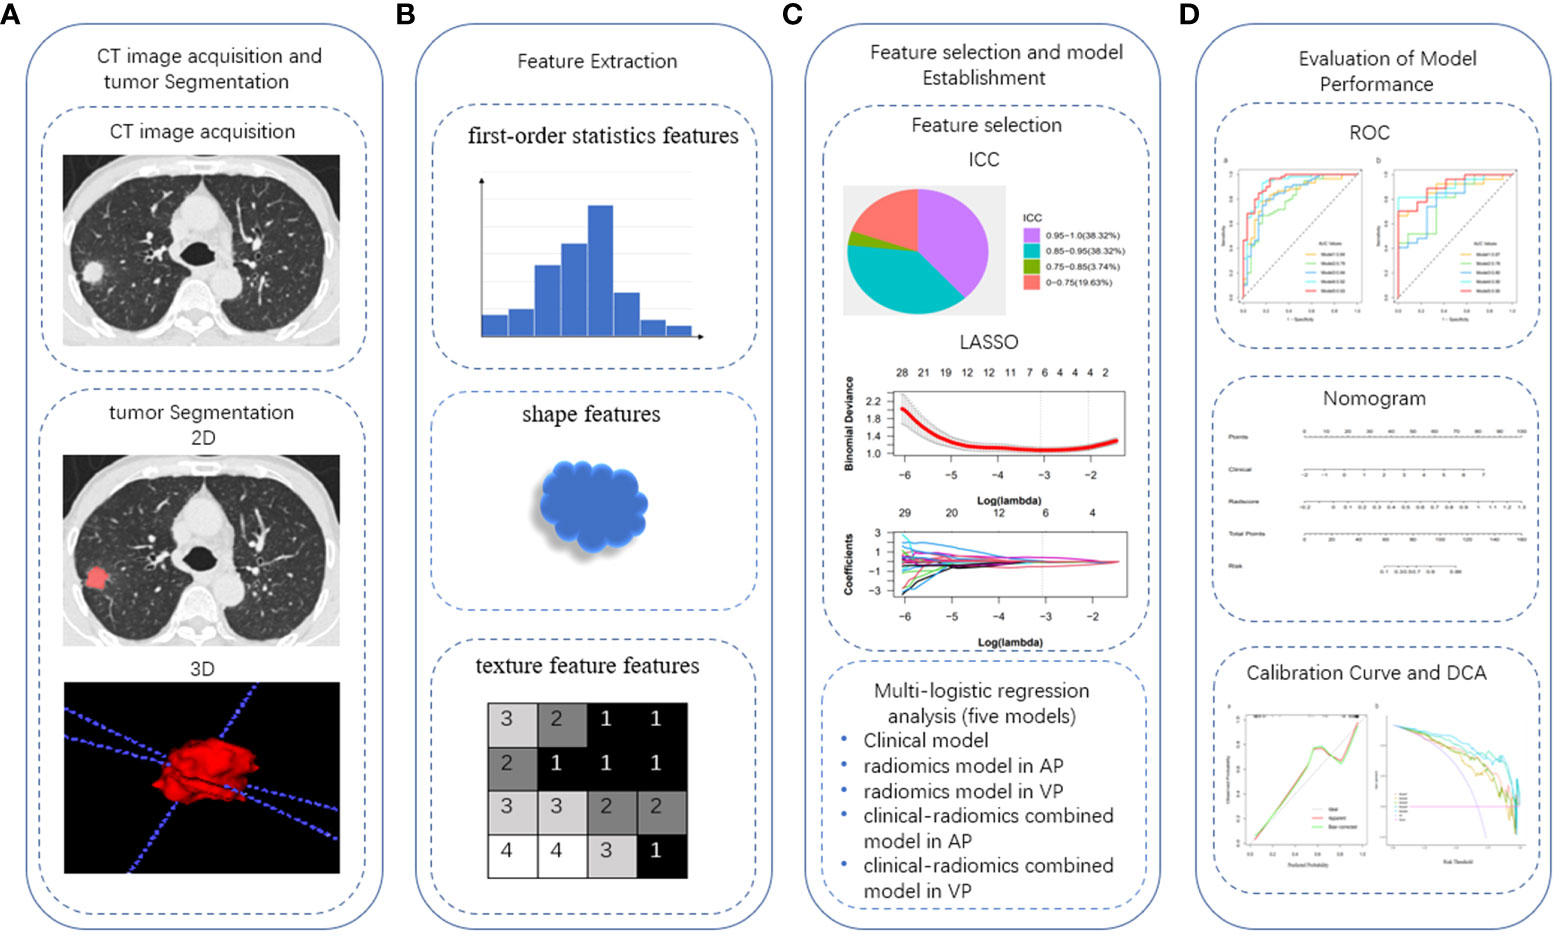
Figure 2 Work flow of tumor segmentation, feature extraction and signature building. ICC, intra-class correlation coefficient; LASSO, the least absolute shrinkage and selection operator; ROC, receiver operating characteristic; DCA, decision curve analysis.
3.3 Prediction model establishment and evaluation of model performance
All models were established by multivariate logistic regression analysis.
Clinical model: The clinical model (Model 1) consisted of three clinical parameters (sex, distant metastasis, and NIC in the VP). The AUCs of the training and validation cohorts were 0.84 (95% CI 0.75-0.93) and 0.87 (95% CI 0.77-0.98) respectively.
Radiomics model: The AUCs for the radiomics model in AP (Model 2) and the radiomics model in VP (Model 3) in the training cohort were 0.79 (95% CI 0.69-0.89) and 0.84 (95% CI 0.75-0.93), respectively; in the validation cohort, they were 0.78 (95% CI 0.63-0.93) and 0.80 (95% CI 0.64-0.95), respectively. Compared with AP, the AUC of the VP radiomics model was higher, but there was no significant difference between the 2 AUCs (Delong test, P = 0.067).
Combined model: The combined clinical-arterial phase radiomics model (Model 4) and the combined clinical-venous phase radiomics model (Model 5) were established by combining the clinical parameters with the radiomic features of AP and VP, respectively. The AUC values were 0.92 (0.86-0.98) and 0.93 (0.88-0.98) in the training cohort and 0.90 (0.81-0.99) and 0.90 (0.81-0.99) in the validation cohort.
The results showed that the predictive performance of the combined model was significantly higher than that of the single radiomic or clinical model (DeLong test, p > 0.05 for each comparison). The combined clinical-venous phase radiomics model (Model 5) had the best predictive performance (AUC: training cohort 0.93, validation cohort 0.90), but there was no significant difference in AUC between Model 5 and Model 4(DeLong test, p=0.384). In addition, the Akaike information criterion (AIC) was introduced to evaluate the goodness and parsimony of fit of the model, and Model 5 achieved the lowest AIC value at 60.16 among all prediction models. Based on the overall consideration of ROC curves and AIC, Model 5 was proven to have the best predictive performance, good goodness of fit and parsimony. The ROC curves, detailed performance and AIC values of the five models are illustrated in Figure 3 and Table 2. The result of the DeLong test is given in Table 3.
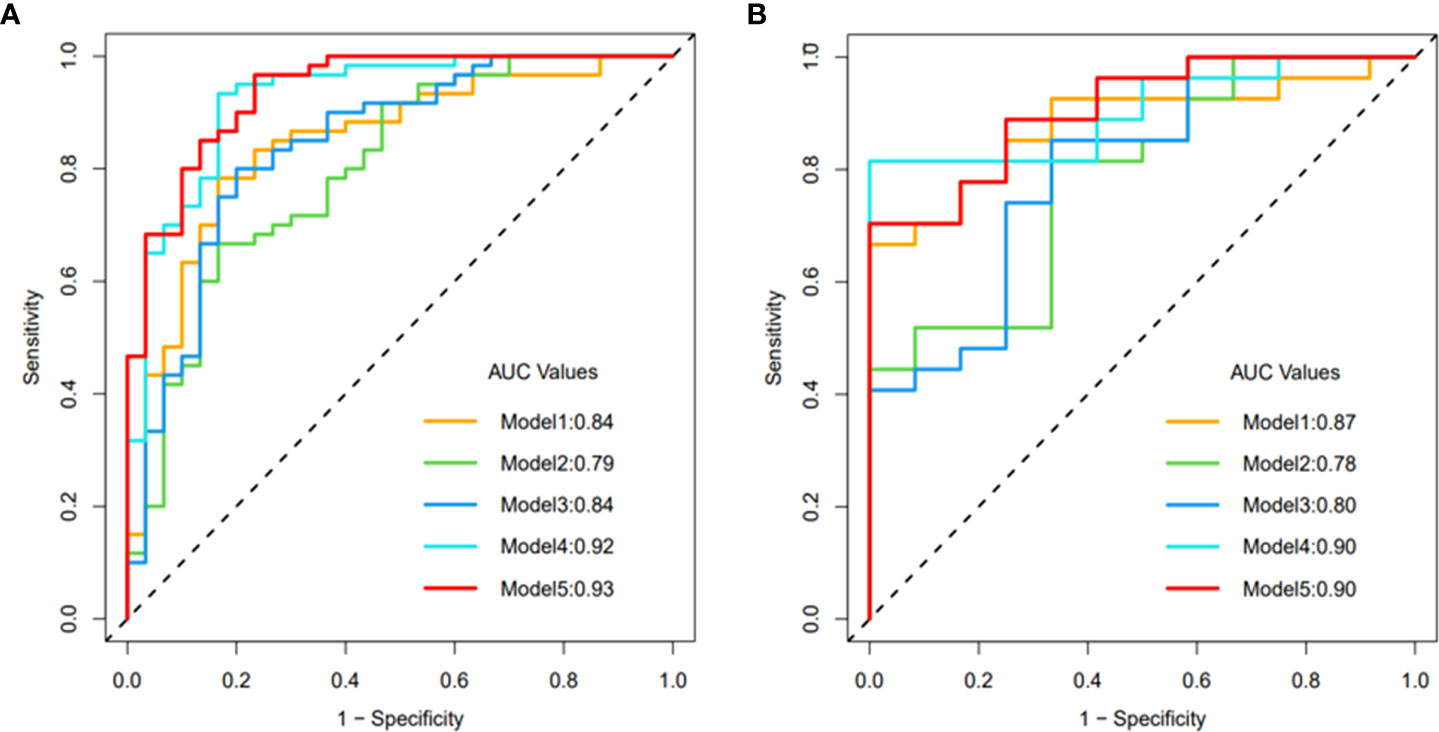
Figure 3 ROC curve of model 1-5: (A) training cohort, (B) validation cohort.
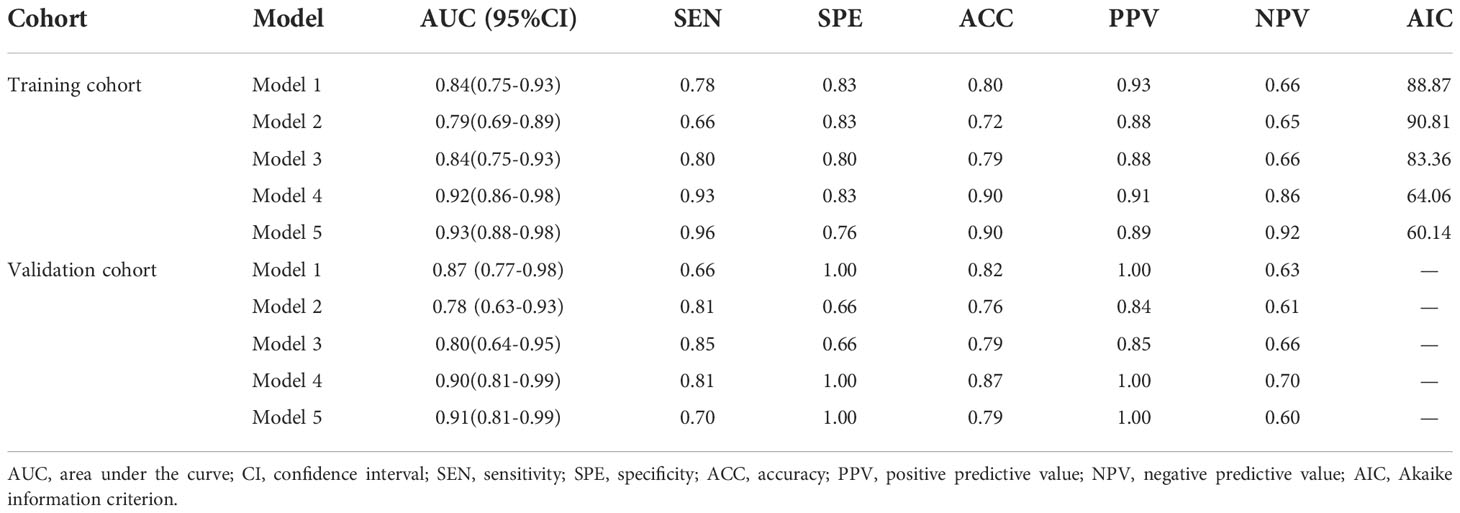
Table 2 Prediction performance of model 1-5.
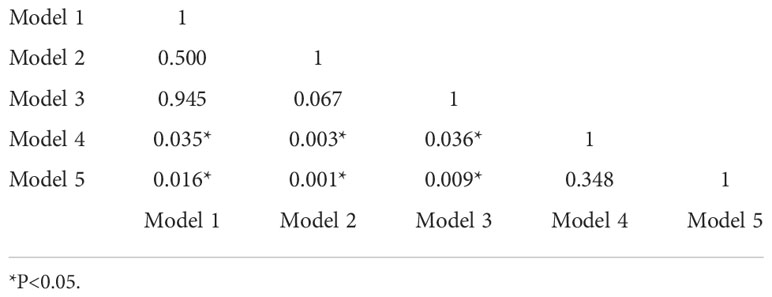
Table 3 Delong test between models 1-5.
3.4 Development and performance evaluation of the nomogram
Based on the above results, Model 5 with the best prediction efficiency was selected and visualized as a nomogram for individualized patient prediction. Multivariate logistic regression analysis showed that the clinical signature (odds ratio (OR) = 1.11; 95% CI, 1.07 to 1.16; p < 0.001) and radiomic signature (odds ratio (OR) = 2.21; 95% CI, 1.68 to 2.90; p < 0.001) represented independent predictors in the nomogram (eTable 4 in the Supplementary Materials).
As shown in the nomogram (Figure 4), the radiological signature accounted for the largest proportion compared with the clinical signature, making it the most important biomarker for distinguishing ADC from SCC. In clinical practice, based on the obtained features, the clinical signature and radiomic signature can be calculated using the formula. Then, the probability of the predictive variable was converted into a fraction corresponding to the first scale “point” at the top of the nomogram. After adding up the corresponding prediction probability, the risk of ADC was at the bottom of the nomogram.
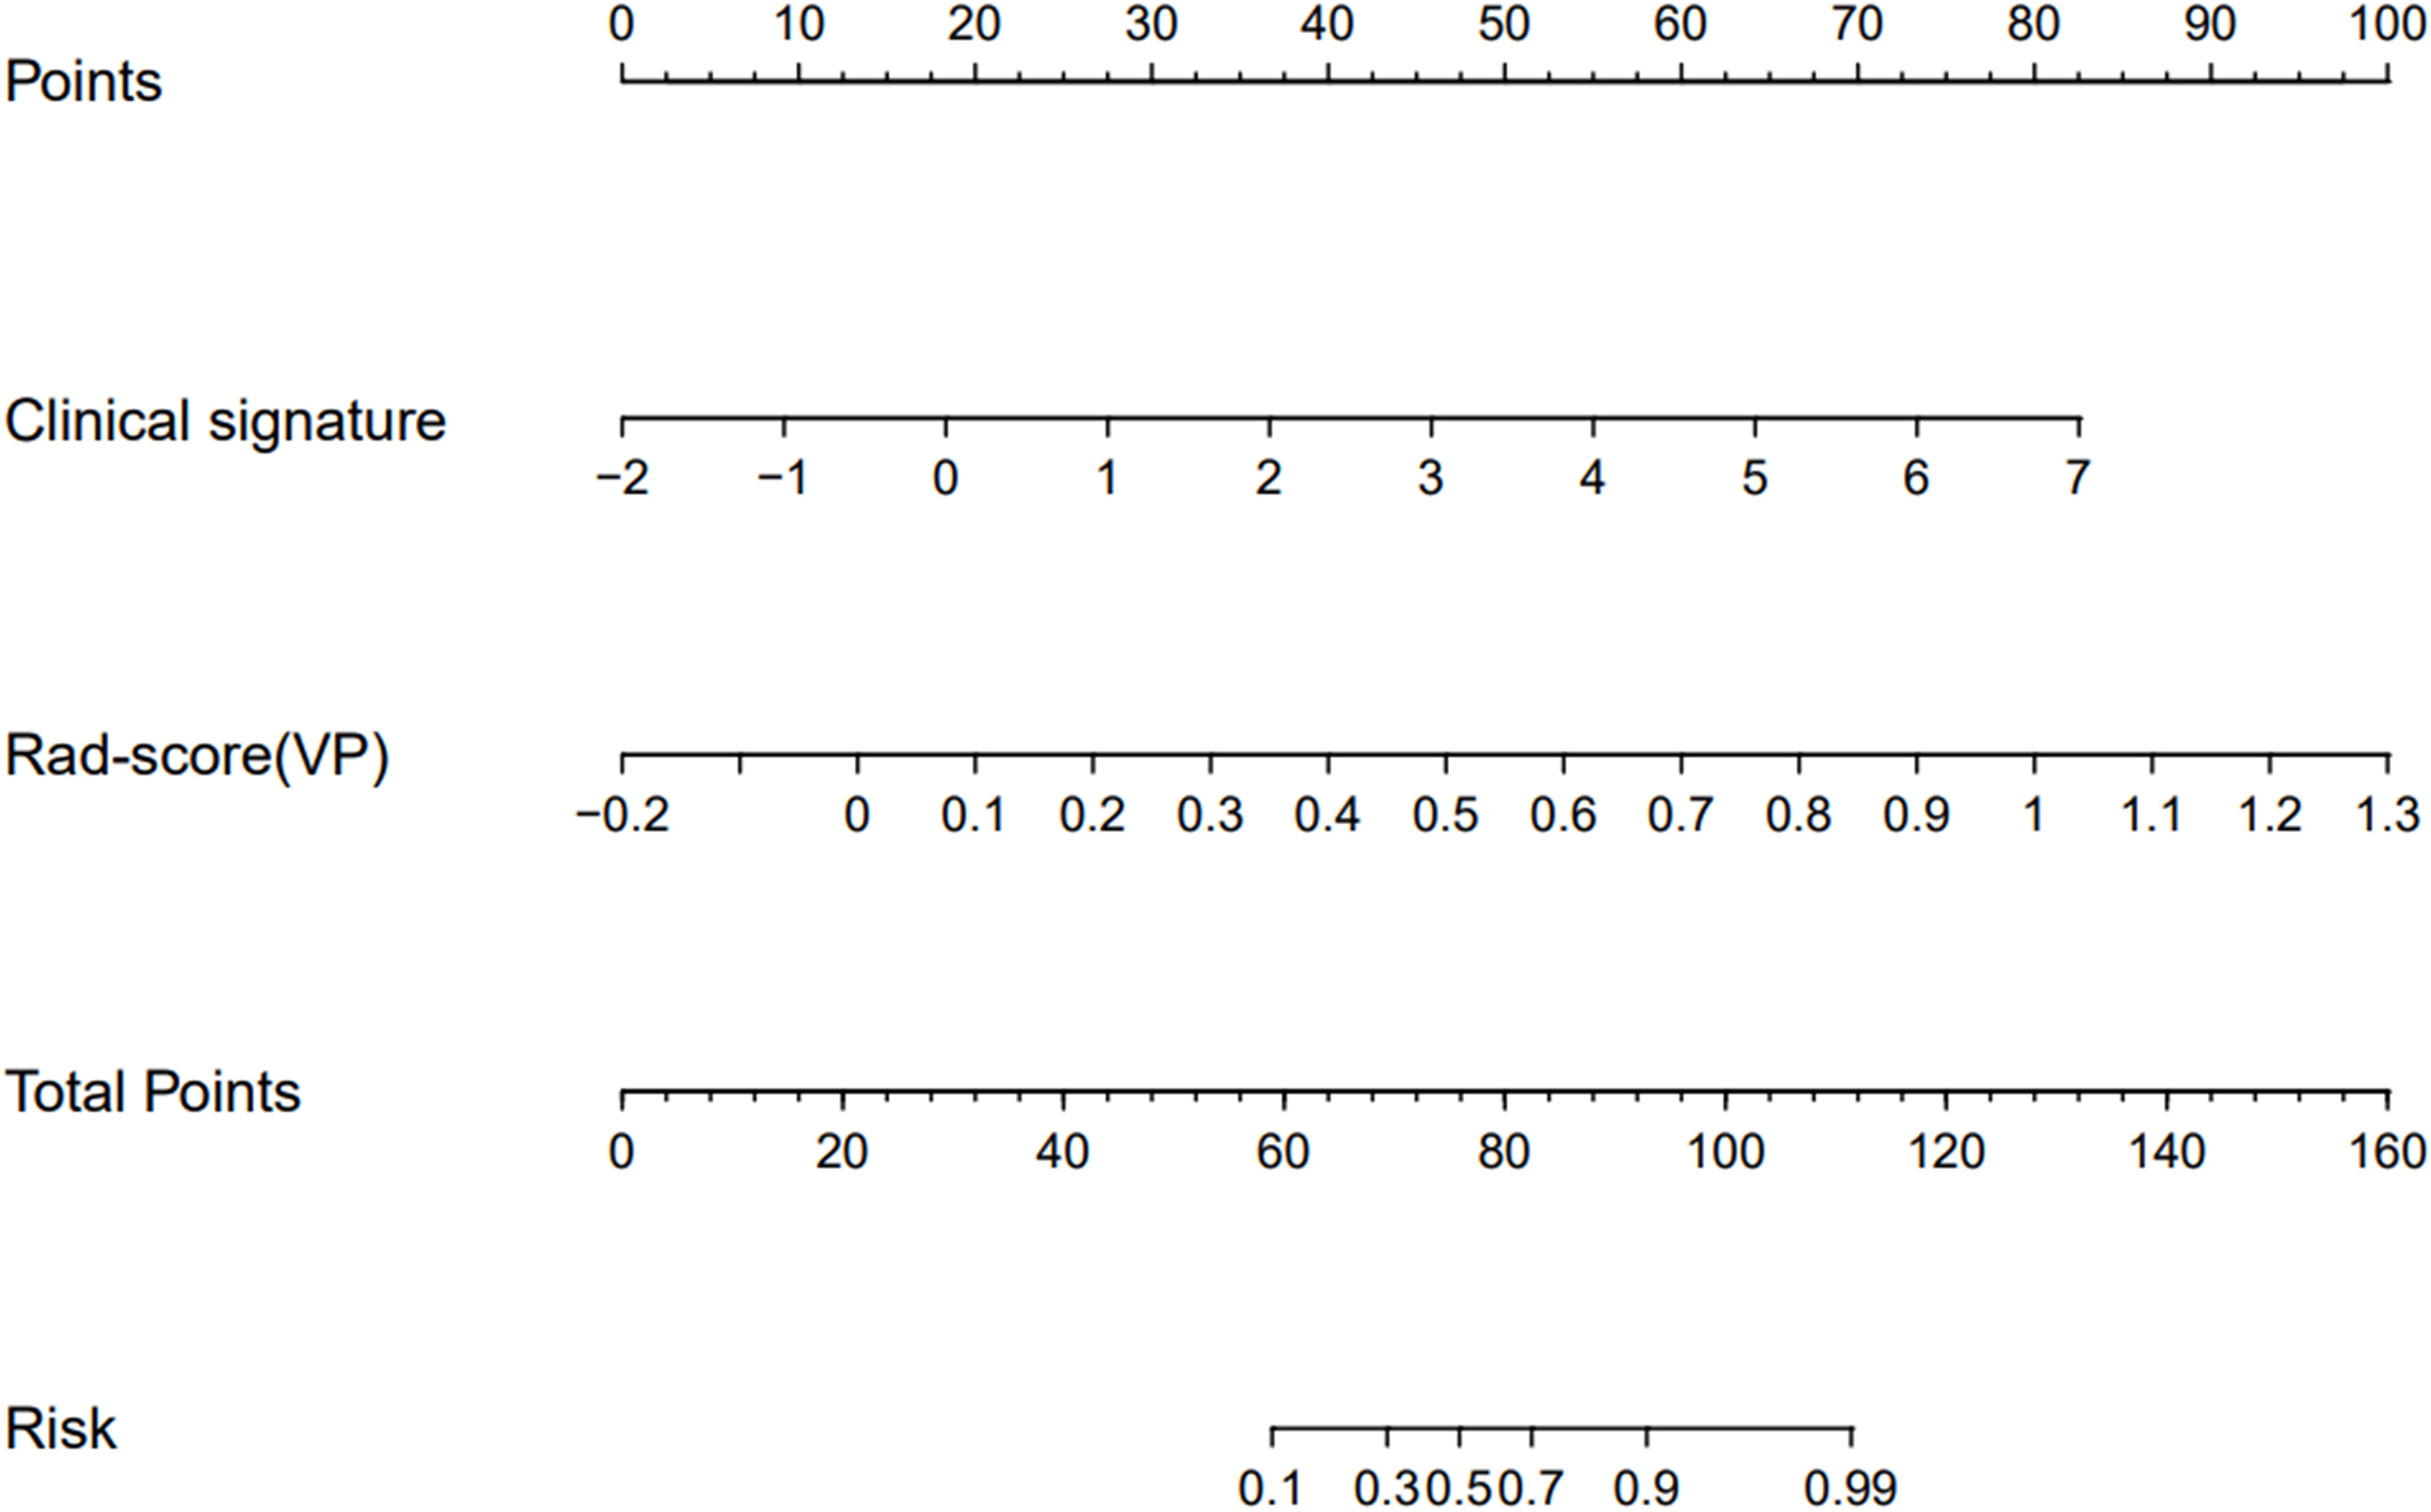
Figure 4 Nomogram based on the clinical signature and radiomic signature in venous phase to predict the pathological subtypes of NSCLC patients.
The calibration curves (Figure 5A) of the nomogram demonstrated good agreement between the nomogram prediction and the actual observation. A nonsignificant difference in the accompanied Hosmer–Lemeshow test (p=0.384) indicated that the nomogram was adequately calibrated without departure from the ideal fit. DCAs (Figure 5B) were used to evaluate the clinical utility of the five predictive models by calculating the net benefit at various probability thresholds. According to the decision curves, Model 5 was the most reliable clinical treatment tool for predicting pathologic subtypes in NSCLC when the probability threshold was above 0.25 in a patient’s or physician’s clinical decision.
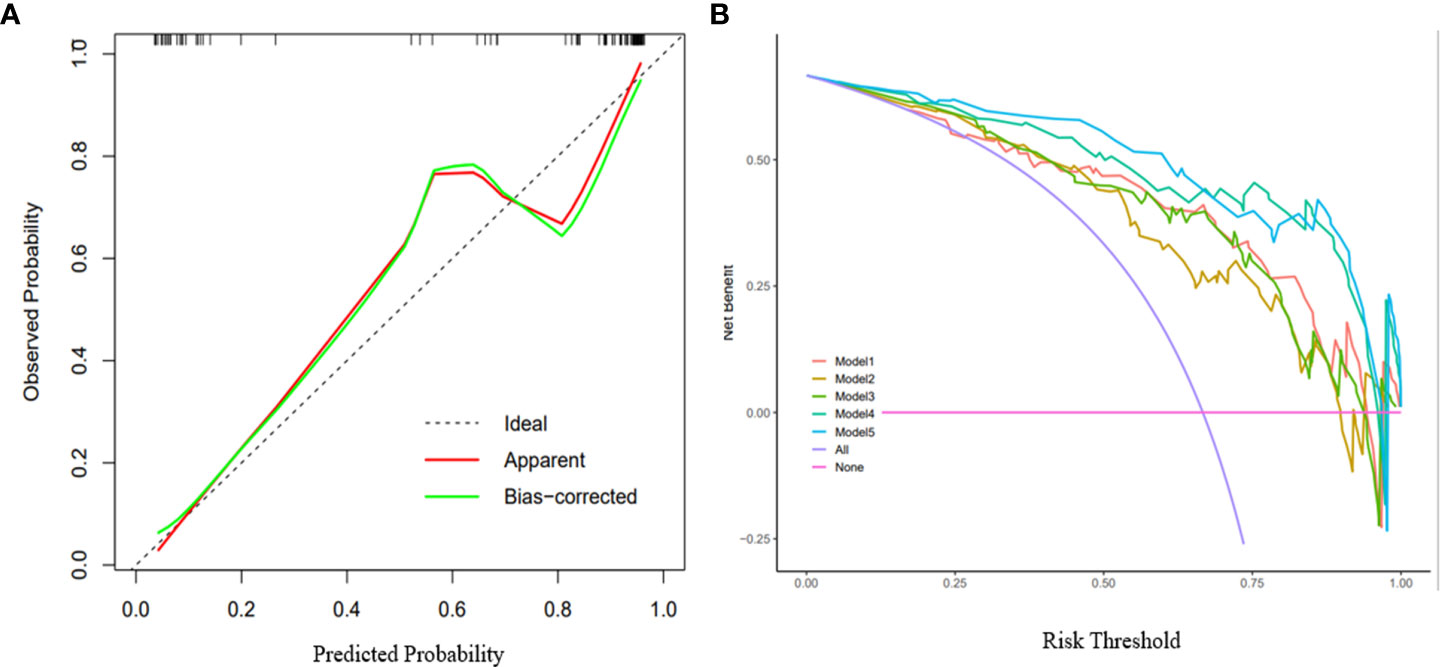
Figure 5 Calibration curves and decision curve analysis of the nomogram. (A) Calibration curves of the nomogram: The X-axis represented the predicted probability estimated by nomogram, whereas the Y-axis represented the actual observed rates. the red line represented the apparent prediction of nomogram, the green line represented the fitting line after bias-corrected. the dashed line represented the ideal estimation. Calibration curves showed the actual probability is relatively close to the prediction of nomogram. (B) Decision curve analysis for the models 1-5: The X-axis represented the threshold probability that was where the expected benefit of treatment was equal to the expected benefit of avoiding treatment. The Y-axis represented the net benefit. The purple line represents the hypothesis that all patients are ADC, and the red line represents the hypothesis that all patients are SCC. Other curves are shown in the figure, representing models 1-5 in turn.
4 Discussion
In this study, we successfully developed and validated a combined clinical-radiomics model based on DECT, which has excellent performance in noninvasively stratifying the pathological subtypes of NSCLC patients. Furthermore, we visualized this model as a nomogram and demonstrated the excellent performance of the nomogram by high AUC and low AIC. DCAs indicated that the nomogram is a reliable clinical treatment decision support tool for personalized prediction of the pathological subtypes of NSCLC patients.
Different pathological subtypes lead to different clinical treatment strategies and prognoses for NSCLC patients (20–22). Dual-energy imaging improves image quality to some degree, expands the capabilities of traditional CT, and has the potential to improve lesion detection and characterization (23–25).Several previous studies have combined DECT with radiomics or texture analysis (26–29). However, most feature extractions are based on virtual monoenergetic, 120 kV equivalent hybrid images or iodine images. Recently, some researchers have demonstrated in their studies that radiomic models based on multi-energy images can more effectively support the diagnosis and prediction of tumors compared with clinical and monoenergetic models As demonstrated by Liu et al. (19), the radiomics model based on multi-energy images can better predict the clinical response of systemic chemotherapy in advanced gastric cancer (AGC) compared to clinical and monoenergetic models. This study extracts the radiomics features from DECT multi-energy images and jointly constructs the model, which proves that the image radiomics features extracted from DECT multi-energy images can reflect the heterogeneity of NSCLC. Radiomics may serve as a promising technique to predict the pathological subtypes of NSCLC.
Among the clinical features selected in the combined model, SCC is more common in males, and this sex difference among NSCLC patients has been widely reported (30, 31). Distant metastasis is more common in patients with ADC than in those with SCC, which is also consistent with the biological characteristics that lung adenocarcinoma is prone to early hematogenous metastasis. In addition, the results of univariate and multivariate analyses in this study showed that NICVP was also an important clinical predictor. In enhanced DECT, IC represents iodine deposition in tissue. The quantification of IC can reflect the microvessel density (MVD) and perfusion of the tumor (32–34). In this study, the NIC of adenocarcinoma was higher than that of squamous cell carcinoma, indicating that the MVD of adenocarcinoma was greater, which is consistent with the results of previous pathological studies (35, 36). Moreover, this result was significantly different in the venous phase but not in the arterial phase. This may be due to the different microvessel densities and vascular permeabilities of different subtypes of tumors, resulting in different times of iodine contrast agent penetration into the intercellular space. This is consistent with the results of a previous study by Zhang et al (13).
In terms of image selection, in DECT scanning, due to the high X-ray attenuation at lower energy levels, when the photon energy gradually decreases from 100 keV to 40 keV, the contrast of the iodized structure gradually increases, but it is also accompanied by an increase in image noise at lower energy levels (37). Therefore, we selected 120 kV equivalent hybrid images with both high contrast and low background noise in evaluating the semantic features of CT lesions (38). In terms of monoenergetic selection for radiomics model establishment, we chose a 100 KeV image with fine detail but low contrast, and a 40 KeV image with higher contrast but more noise. As a result, the AUC of the multi-energy image-based radiomics model was 0.79 and 0.84 in the AP and VP, respectively. This shows that the combination of different energy images can deeply mine tumor information and effectively distinguish ADC from SCC.
In terms of radiomic features, three types of radiomic features were extracted: 1) “First-order statistics: Energy”, describing the overall density of the tumor volume; 2) “Shape: Compactness”, quantifying the compactness of the tumor volume relative to that of a sphere (i.e., the most compact shape); and 3) “texture features: spatial arrangement relationship between voxel gray levels”, describing intra-tumor heterogeneity (39, 40). Among the features we selected, compared with the AP, the VP increased the first-order statistics features (original first-order kurtosis, original first-order skewness), and the first-order statistics features reflected the overall density of the tumor. We believe that this is also related to the different MVD and vascular permeability of different subtypes of tumors, which may also lead to the slightly lower AUC in the AP-based model than VP.
Our study had some limitations. First, it is a retrospective study at a single center, which may lead to patient selection bias, and the number of samples is limited. Future plans include collaboration with other dual-energy CT centers to reduce bias and expand the sample size. Second, the previous radiomics model developed by He et al. (41) for the differential diagnosis of solitary pulmonary nodules showed better differential diagnosis performance based on the radiomics features of plain CT images than those of contrast-enhanced CT images. This study lacks a radiomics model based on plain CT. In the future, it is expected to build a radiomics model based on DECT plain scans to mine tumor features more comprehensively and improve the performance of the model. Finally, semi-automatic or semiautomatic and manual combined segmentation of lesions is time-consuming and variable. In the future, it is expected to combine radiomics with machine learning or deep learning to create better models.
5 Conclusion
In this study, we developed and validated a combined clinical-radiomics model based on pretherapy DECT to reliably predict ADC and SCC. Compared with the traditional single clinical model, the combined model significantly improved the prediction performance of ADC and SCC. The combined clinical-venous phase radiomics model was visualized as a nomogram, which could provide a relatively accurate, convenient, and noninvasive method for the individualized discrimination of ADC from SCC in NSCLC patients and assist in clinical decision-making.
Data availability statement
The raw data supporting the conclusions of this article will be made available by the authors, without undue reservation.
Ethics statement
The studies involving human participants were reviewed and approved by The Second Affiliated Hospital of Nanchang University Medical Research Ethics Committee. Written informed consent for participation was not required for this study in accordance with the national legislation and the institutional requirements.
Author contributions
MZ and ZC designed the study. ZC and JZ collected and classified the data. ZC, LY, ZZ, and ZP did the statistical analysis. YT, AH, ZL, and MJ made substantial revisions to the manuscript. All authors contributed to the article and approved the submitted version.
Funding
This study was supported by Jiangxi Provincial Education Department Key Projects (grant number GJJ200106).
Acknowledgments
We thank the Patient for his kind cooperation.
Conflict of interest
The authors declare that the research was conducted in the absence of any commercial or financial relationships that could be construed as a potential conflict of interest.
Publisher’s note
All claims expressed in this article are solely those of the authors and do not necessarily represent those of their affiliated organizations, or those of the publisher, the editors and the reviewers. Any product that may be evaluated in this article, or claim that may be made by its manufacturer, is not guaranteed or endorsed by the publisher.
Supplementary material
The Supplementary Material for this article can be found online at: https://www.frontiersin.org/articles/10.3389/fonc.2022.949111/full#supplementary-material
References
1. Sung H, Ferlay J, Siegel RL, Laversanne M, Soerjomataram I, Jemal A, et al. Global cancer statistics 2020: GLOBOCAN estimates of incidence and mortality worldwide for 36 cancers in 185 countries. CA Cancer J Clin (2021) 71(3):209–49. doi: 10.3322/caac.21660
2. Schabath MB, Cote ML. Cancer progress and priorities: Lung cancer. Cancer Epidemiol Biomarkers Prev (2019) 28(10):1563–79. doi: 10.1158/1055-9965.EPI-19-0221
3. Ren C, Zhang J, Qi M, Zhang J, Zhang Y, Song S, et al. Machine learning based on clinico-biological features integrated (18)F-FDG PET/CT radiomics for distinguishing squamous cell carcinoma from adenocarcinoma of lung. Eur J Nucl Med Mol Imaging. (2021) 48(5):1538–49. doi: 10.1007/s00259-020-05065-6
4. Hirsch FR, Scagliotti GV, Mulshine JL, Kwon R, Curran WJ Jr, Wu YL, et al. Lung cancer: Current therapies and new targeted treatments. Lancet (2017) 389(10066):299–311. doi: 10.1016/S0140-6736(16)30958-8
5. Osmani L, Askin F, Gabrielson E, Li QK. Current WHO guidelines and the critical role of immunohistochemical markers in the subclassification of non-small cell lung carcinoma (NSCLC): Moving from targeted therapy to immunotherapy. Semin Cancer Biol (2018) 52(Pt 1):103–9. doi: 10.1016/j.semcancer.2017.11.019
6. Thomas A, Liu SV, Subramaniam DS, Giaccone G. Refining the treatment of NSCLC according to histological and molecular subtypes. Nat Rev Clin Oncol (2015) 12(9):511–26. doi: 10.1038/nrclinonc.2015.90
7. Detterbeck FC, Boffa DJ, Kim AW, Tanoue LT. The eighth edition lung cancer stage classification. Chest (2017) 151(1):193–203. doi: 10.1016/j.chest.2016.10.010
8. Jotte RM, Spigel DR. Advances in molecular-based personalized non-small-cell lung cancer therapy: Targeting epidermal growth factor receptor and mechanisms of resistance. Cancer Med (2015) 4(11):1621–32. doi: 10.1002/cam4.506
9. Cadioli A, Rossi G, Costantini M, Cavazza A, Migaldi M, Colby TV. Lung cancer histologic and immunohistochemical heterogeneity in the era of molecular therapies: Analysis of 172 consecutive surgically resected, entirely sampled pulmonary carcinomas. Am J Surg Pathol (2014) 38(4):502–9. doi: 10.1097/PAS.0000000000000154
10. Beslic S, Zukic F, Milisic S. Percutaneous transthoracic CT guided biopsies of lung lesions; fine needle aspiration biopsy versus core biopsy. Radiol Oncol (2012) 46(1):19–22. doi: 10.2478/v10019-012-0004-4
11. Kong YC, Bhoo-Pathy N, O'Rorke M, Subramaniam S, Bhoo-Pathy NT, See MH, et al. The association between methods of biopsy and survival following breast cancer: A hospital registry based cohort study. Med (Baltimore). (2020) 99(6):e19093. doi: 10.1097/MD.0000000000019093
12. Goo HW, Goo JM. Dual-energy CT: New horizon in medical imaging. Korean J Radiol (2017) 18(4):555–69. doi: 10.3348/kjr.2017.18.4.555
13. Zhang Z, Zou H, Yuan A, Jiang F, Zhao B, Liu Y, et al. A single enhanced dual-energy CT scan may distinguish lung squamous cell carcinoma from adenocarcinoma during the venous phase. Acad Radiol (2020) 27(5):624–9. doi: 10.1016/j.acra.2019.07.018
14. Dong D, Fang MJ, Tang L, Shan XH, Gao JB, Giganti F, et al. Deep learning radiomic nomogram can predict the number of lymph node metastasis in locally advanced gastric cancer: An international multicenter study. Ann Oncol (2020) 31(7):912–20. doi: 10.1016/j.annonc.2020.04.003
15. Dong D, Tang L, Li ZY, Fang MJ, Gao JB, Shan XH, et al. Development and validation of an individualized nomogram to identify occult peritoneal metastasis in patients with advanced gastric cancer. Ann Oncol (2019) 30(3):431–8. doi: 10.1093/annonc/mdz001
16. Ligero M, Garcia-Ruiz A, Viaplana C, Villacampa G, Raciti MV, Landa J, et al. A CT-based radiomics signature is associated with response to immune checkpoint inhibitors in advanced solid tumors. Radiology (2021) 299(1):109–19. doi: 10.1148/radiol.2021200928
17. Mayerhoefer ME, Materka A, Langs G, Häggström I, Szczypiński P, Gibbs P, et al. Introduction to radiomics. J Nucl Med (2020) 61(4):488–95. doi: 10.2967/jnumed.118.222893
18. Zhu X, Dong D, Chen Z, Fang M, Zhang L, Song J, et al. Radiomic signature as a diagnostic factor for histologic subtype classification of non-small cell lung cancer. Eur Radiol (2018) 28(7):2772–8. doi: 10.1007/s00330-017-5221-1
19. Liu YY, Zhang H, Wang L, Lin SS, Lu H, Liang HJ, et al. Predicting response to systemic chemotherapy for advanced gastric cancer using pre-treatment dual-energy CT radiomics: A pilot study. Front Oncol (2021) 11:740732. doi: 10.3389/fonc.2021.740732
20. McAleese J, Taylor A, Walls GM, Hanna GG. Differential relapse patterns for non-small cell lung cancer subtypes adenocarcinoma and squamous cell carcinoma: Implications for radiation oncology. Clin Oncol (R Coll Radiol). (2019) 31(10):711–9. doi: 10.1016/j.clon.2019.07.008
21. Yuan C, Tao X, Zheng D, Pan Y, Ye T, Hu H, et al. The lymph node status and histologic subtypes influenced the effect of postoperative radiotherapy on patients with N2 positive IIIA non-small cell lung cancer. J Surg Oncol (2019) 119(3):379–87. doi: 10.1002/jso.25308
22. Abel S, Hasan S, White R, Schumacher L, Finley G, Colonias A, et al. Stereotactic ablative radiotherapy (SABR) in early stage non-small cell lung cancer: Comparing survival outcomes in adenocarcinoma and squamous cell carcinoma. Lung Cancer. (2019) 128:127–33. doi: 10.1016/j.lungcan.2018.12.022
23. Rassouli N, Chalian H, Rajiah P, Dhanantwari A, Landeras L. Assessment of 70-keV virtual monoenergetic spectral images in abdominal CT imaging: A comparison study to conventional polychromatic 120-kVp images. Abdom Radiol (NY). (2017) 42(10):2579–86. doi: 10.1007/s00261-017-1151-2
24. Silva AC, Morse BG, Hara AK, Paden RG, Hongo N, Pavlicek W. Dual-energy (spectral) CT: Applications in abdominal imaging. Radiographics (2011) 31(4):1031–46. doi: 10.1148/rg.314105159
25. Stiller W, Schwarzwaelder CB, Sommer CM, Veloza S, Radeleff BA, Kauczor HU. Dual-energy, standard and low-kVp contrast-enhanced CT-cholangiography: A comparative analysis of image quality and radiation exposure. Eur J Radiol (2012) 81(7):1405–12. doi: 10.1016/j.ejrad.2011.03.030
26. Reinert CP, Krieg EM, Bösmüller H, Horger M. Mid-term response assessment in multiple myeloma using a texture analysis approach on dual energy-CT-derived bone marrow images - a proof of principle study. Eur J Radiol (2020) 131:109214. doi: 10.1016/j.ejrad.2020.109214
27. Zhou Y, Su GY, Hu H, Tao XW, Ge YQ, Si Y, et al. Radiomics from primary tumor on dual-energy CT derived iodine maps can predict cervical lymph node metastasis in papillary thyroid cancer. Acad Radiol (2022) 29 Suppl 3:S222–s31. doi: 10.1016/j.acra.2021.06.014
28. Wang L, Zhang Y, Chen Y, Tan J, Wang L, Zhang J, et al. The performance of a dual-energy CT derived radiomics model in differentiating serosal invasion for advanced gastric cancer patients after neoadjuvant chemotherapy: Iodine map combined with 120-kV equivalent mixed images. Front Oncol (2020) 10:562945. doi: 10.3389/fonc.2020.562945
29. Zhou Y, Su GY, Hu H, Ge YQ, Si Y, Shen MP, et al. Radiomics analysis of dual-energy CT-derived iodine maps for diagnosing metastatic cervical lymph nodes in patients with papillary thyroid cancer. Eur Radiol (2020) 30(11):6251–62. doi: 10.1007/s00330-020-06866-x
30. Harichand-Herdt S, Ramalingam SS. Gender-associated differences in lung cancer: Clinical characteristics and treatment outcomes in women. Semin Oncol (2009) 36(6):572–80. doi: 10.1053/j.seminoncol.2009.10.007
31. Caldarella A, Crocetti E, Comin CE, Janni A, Pegna AL, Paci E. Gender differences in non-small cell lung cancer: A population-based study. Eur J Surg Oncol (2007) 33(6):763–8. doi: 10.1016/j.ejso.2007.01.001
32. Deniffel D, Sauter A, Fingerle A, Rummeny EJ, Makowski MR, Pfeiffer D. Improved differentiation between primary lung cancer and pulmonary metastasis by combining dual-energy CT-derived biomarkers with conventional CT attenuation. Eur Radiol (2021) 31(2):1002–10. doi: 10.1007/s00330-020-07195-9
33. Ren Y, Jiao Y, Ge W, Zhang L, Hua Y, Li C, et al. Dual-energy computed tomography-based iodine quantitation for response evaluation of lung cancers to Chemoradiotherapy/Radiotherapy: A comparison with fluorine-18 fluorodeoxyglucose positron emission Tomography/Computed tomography-based positron emission Tomography/Computed tomography response evaluation criterion in solid tumors. J Comput Assist Tomogr (2018) 42(4):614–22. doi: 10.1097/RCT.0000000000000734
34. Muenzel D, Lo GC, Yu HS, Parakh A, Patino M, Kambadakone A, et al. Material density iodine images in dual-energy CT: Detection and characterization of hypervascular liver lesions compared to magnetic resonance imaging. Eur J Radiol (2017) 95:300–6. doi: 10.1016/j.ejrad.2017.08.035
35. Zieliński KW, Kulig A. Morphology of the microvascular bed in primary human carcinomas of lung. part I: Three–dimensional pattern of microvascular network. Pathol Res Pract (1984) 178(3):243–50. doi: 10.1016/S0344-0338(84)80106-5
36. Yuan A, Yu CJ, Kuo SH, Chen WJ, Lin FY, Luh KT, et al. Vascular endothelial growth factor 189 mRNA isoform expression specifically correlates with tumor angiogenesis, patient survival, and postoperative relapse in non-small-cell lung cancer. J Clin Oncol (2001) 19(2):432–41. doi: 10.1200/JCO.2001.19.2.432
37. Kaza RK, Caoili EM, Cohan RH, Platt JF. Distinguishing enhancing from nonenhancing renal lesions with fast kilovoltage-switching dual-energy CT. AJR Am J Roentgenol. (2011) 197(6):1375–81. doi: 10.2214/AJR.11.6812
38. Li Q, Tan H, Lv F. Molecular characterization of solitary pulmonary nodules in dual-energy CT nonlinear image fusion technology. J Recept Signal Transduct Res (2022) 42(1):95–9. doi: 10.1080/10799893.2020.1853158
39. Leijenaar RT, Carvalho S, Hoebers FJ, Aerts HJ, van Elmpt WJ, Huang SH, et al. External validation of a prognostic CT-based radiomic signature in oropharyngeal squamous cell carcinoma. Acta Oncol (2015) 54(9):1423–9. doi: 10.3109/0284186X.2015.1061214
40. de Jong EEC, van Elmpt W, Rizzo S, Colarieti A, Spitaleri G, Leijenaar RTH, et al. Applicability of a prognostic CT-based radiomic signature model trained on stage I-III non-small cell lung cancer in stage IV non-small cell lung cancer. Lung Cancer. (2018) 124:6–11. doi: 10.1016/j.lungcan.2018.07.023
Keywords: dual-energy CT, dual-energy CT quantitative parameters, radiomics, lung adenocarcinoma, lung squamous cell carcinoma
Citation: Chen Z, Yi L, Peng Z, Zhou J, Zhang Z, Tao Y, Lin Z, He A, Jin M and Zuo M (2022) Development and validation of a radiomic nomogram based on pretherapy dual-energy CT for distinguishing adenocarcinoma from squamous cell carcinoma of the lung. Front. Oncol. 12:949111. doi: 10.3389/fonc.2022.949111
Received: 20 May 2022; Accepted: 26 October 2022;
Published: 23 November 2022.
Edited by:
Jiansong Ji, Lishui Central Hospital, ChinaReviewed by:
Stephanie Tanadini-Lang, University Hospital Zürich, SwitzerlandAsli Suner, Ege University, Turkey
Copyright © 2022 Chen, Yi, Peng, Zhou, Zhang, Tao, Lin, He, Jin and Zuo. This is an open-access article distributed under the terms of the Creative Commons Attribution License (CC BY). The use, distribution or reproduction in other forums is permitted, provided the original author(s) and the copyright owner(s) are credited and that the original publication in this journal is cited, in accordance with accepted academic practice. No use, distribution or reproduction is permitted which does not comply with these terms.
*Correspondence: Minjing Zuo, minjingzuo@163.com
†These authors have contributed equally to this work and share first authorship