 Alessia Lodi1,2*
 Renu Pandey1,2Jennifer Chiou1,2Ayon Bhattacharya3Shiliang Huang3
 Xingxin Pan4Brandon Burgman4,5
 S. Stephen Yi4,5,6,7
 Stefano Tiziani1,2,4,5,8Andrew J. Brenner3*
- 1Department of Nutritional Sciences, The University of Texas at Austin, Austin, TX, United States
- 2Dell Pediatric Research Institute, Dell Medical School, The University of Texas at Austin, Austin, TX, United States
- 3Mays Cancer Center, The University of Texas Health Science Center at San Antonio, San Antonio, TX, United States
- 4Department of Oncology, Dell Medical School, Livestrong Cancer Institutes, The University of Texas at Austin, Austin, TX, United States
- 5Institute for Cellular and Molecular Biology (ICMB), College of Natural Sciences, The University of Texas at Austin, Austin, TX, United States
- 6Department of Biomedical Engineering, Cockrell School of Engineering, The University of Texas at Austin, Austin, TX, United States
- 7Oden Institute for Computational Engineering and Sciences (ICES), The University of Texas at Austin, Austin, TX, United States
- 8Department of Pediatrics, Dell Medical School, The University of Texas at Austin, Austin, TX, United States
Glioblastomas (GBM) are the most common and aggressive form of primary malignant brain tumor in the adult population, and, despite modern therapies, patients often develop recurrent disease, and the disease remains incurable with median survival below 2 years. Resistance to bevacizumab is driven by hypoxia in the tumor and evofosfamide is a hypoxia-activated prodrug, which we tested in a phase 2, dual center (University of Texas Health Science Center in San Antonio and Dana Farber Cancer Institute) clinical trial after bevacizumab failure. Tumor hypoxic volume was quantified by 18F-misonidazole PET. To identify circulating metabolic biomarkers of tumor hypoxia in patients, we used a high-resolution liquid chromatography-mass spectrometry-based approach to profile blood metabolites and their specific enantiomeric forms using untargeted approaches. Moreover, to evaluate early response to treatment, we characterized changes in circulating metabolite levels during treatment with combined bevacizumab and evofosfamide in recurrent GBM after bevacizumab failure. Gamma aminobutyric acid, and glutamic acid as well as its enantiomeric form D-glutamic acid all inversely correlated with tumor hypoxia. Intermediates of the serine synthesis pathway, which is known to be modulated by hypoxia, also correlated with tumor hypoxia (phosphoserine and serine). Moreover, following treatment, lactic acid was modulated by treatment, likely in response to a hypoxia mediated modulation of oxidative vs glycolytic metabolism. In summary, although our results require further validation in larger patients’ cohorts, we have identified candidate metabolic biomarkers that could evaluate the extent of tumor hypoxia and predict the benefit of combined bevacizumab and evofosfamide treatment in GBM following bevacizumab failure.
Introduction
Glioblastoma (GBM) is the most common and aggressive form of primary malignant brain tumor in the adult population, with approximately 12,000 new cases diagnosed every year in the United States, and, despite modern therapies, it remains incurable (1). FDA-approved first line therapy options include temozolomide, radiation and tumor treatment fields (2). Recurrent disease uniformly develops, and salvage treatment usually includes the monoclonal antibody bevacizumab (Bev). Bev depletes vascular endothelial growth factor, a hypoxia induced factor (HIF)-driven gene which promotes tumoral angiogenesis and neovascularization. Yet, while bevacizumab typically results in radiographic responses, it has not significantly improved overall survival. Resistance to Bev has been shown to be driven by tumor hypoxia (3). Evofosfamide (Evo or TH302) is a hypoxia-activated nitroimidazole prodrug, which, when exposed to hypoxia, is reduced by intracellular reductases and releases the alkylating agent bromo-isophosphoramide mustard (Br-IPM). Br-IPM, a cytotoxin, can then crosslink cellular DNA (4–8). Our phase 2, dual center (University of Texas Health Science Center in San Antonio and Dana Farber Cancer Institute) clinical trial investigated the outcome of combined Bev/Evo in 33 Bev refractory GBM patients (5). The combined Bev/Evo treatment resulted in a statistically significant improvement over previous therapies, with a 31% progression free survival at 4 months (PFS-4). Moreover, hypoxia volume (HV) was calculated and both progression free survival and overall survival were negatively associated with hypoxia volume values (9).
Modulation of cell metabolism is a well-established feature that cancer cells use to thrive and is reflected intracellularly, in the tumor microenvironment, and in the levels of circulating metabolites. Metabolic profiling studies are typically performed using platforms based on mass spectrometry or magnetic resonance spectroscopy to characterize an ever-increasing number of metabolites in biosamples including cells, tissues and biofluids (10–18). Circulating metabolites are increasingly being investigated as potential biomarkers for disease detection (11, 19) and progression (20), survival prediction (21) and response to treatment (22). In addition, metabolite stereospecificity recognition is key in the identification of specific metabolic biomarkers in health and disease (23–33). The predominance of a specific amino or hydroxy acid stereoisomer form has been recognized in cancer as well as in other metabolic diseases. For instance, the relative levels of D- and L-2-hydroxyglutaric acid in cancer have been shown to depend on the mutation status of isocitrate dehydrogenase 1 and 2, and cellular hypoxia (34–38). To improve the detection of stereoisomers in biosamples, we have recently developed an untargeted, LC-MS-based method for the simultaneous detection of different classes of metabolites, including hydroxy and amino acids, in a single analytical run (39).
Here, we investigated the profiles of the circulating metabolites in patients with recurrent glioblastoma following Bev failure to evaluate candidate metabolic biomarkers associated with hypoxia in the tumor. In addition, on a very small number of patients, we also evaluated the association between patient specific metabolic changes observed early and at later stages of treatment to identify potential biomarkers of response to treatment.
Materials and methods
Patients and clinical trial design
All information about the patient characteristics, the criteria for admission in the clinical trial and the clinical trial design are included in (5). Briefly, 33 patients, ages 19 to 76 years (median age: 47 years) with progressive or recurrent glioblastoma following Bev were considered in the study. MGMT status was methylated in 26%, unmethylated in 32%, and unknown in 42%. IDH mutations were identified in 29%, not seen in 46%, and unknown in 25%. The clinical trial (phase 2, open label, single arm) evaluated Bev (10 mg/kg) in combination with Evo (670 mg/m2), following Bev failure. All patients had previously received radiation therapy and temozolomide chemotherapy, as well as Bev. Overall survival was defined as the interval from the start of Bev/Evo treatment until death. For all patients, serum was collected shortly prior to receiving the first dose of the combined Bev/Evo and with each cycle of therapy. The protocol was approved by the institutional review board at the University of Texas Health Science Center at San Antonio (UT) and at the Dana Farber Cancer Institute (DF). All patients provided written informed consent. All methods were carried out in accordance with Good Clinical Practice and in accordance with local guidelines and regulations. This trial was registered with www.clinicaltrials.gov (NCT02342379) on 19 Jan 2015.
Calculation of tumor hypoxia by FMISO-PET
In all cases, patients were injected intravenously with 3.7 MBq/kg of 18F-FMISO. A 20-minute static 18F-FMISO PET emission image was acquired at about 120 minutes after injection of 18F-FMISO. PET scans were performed on two devices, both of which were calibrated. On a CTI EXACT HR+ scanner and a Siemens Biograph40 mCT scanner as previously described (8). The tumor ROIs on the 18F-FMISO PET images included all regions where there was FMISO uptake, and two 2 cm diameter ROIs on both sides of the cerebellar cortex were used as the image derived blood surrogate to determine the surrogate of tissue to blood ratio (TB ratio). HV was determined by the number of pixels with TB ratio above 1.2.
Sample preparation for metabolic analysis
Serum samples were initially collected between June 2015 and August 2017 and stored in liquid nitrogen until analysis. Thirty serum samples were analyzed for the cycle 1 timepoint (prior to first dose of treatment). 10 serum samples were analyzed for the cycle 2 and end of treatment (EOT or cycle 5) timepoints. Additional sample details are included in Supplementary Data Table.
Plasma samples were thawed on ice. For each plasma sample, a volume of 200 µL was transferred to washed Nanosep 3K Omega centrifugal filters (Pall Corporation, Port Washington, NY, USA) and centrifuged for 24 hours at 8,000 rpm and at 4°C (16, 17, 40). The plasma filtrate (polar fraction) was recovered and split into two parts for the untargeted analyses of the polar metabolites and metabolite enantiomeric forms (chiral metabolomics).
Reagents
LC-MS grade water, methanol, acetonitrile, formic acid, ammonium acetate, ammonium formate, 2,6-di-tert-butyl-4-methylphenol (BHT) were used for the analysis (Thermo Fisher Scientific, Waltham, MA, USA). Commercial calibration solutions for the mass spectrometer were also purchased from Thermo Fisher Scientific (Waltham, MA, USA).
Untargeted polar metabolomics
For the untargeted polar metabolite profiling, the plasma filtrate was diluted in water (1:500 ratio) and transferred to LC-MS vials for analysis as previously described (16, 18). Pooled quality control samples were injected every 6-th sample. The metabolic profiling analysis was conducted on the Accela 1253 UPLC system with a quaternary pump in tandem with a Hybrid Quadrupole Orbitrap mass spectrometer (Q Exactive, Thermo Scientific, Bremen, Germany) equipped with electrospray ionization (ESI) operating in negative/positive ion switching mode (Thermo Fisher Scientific, San Jose, CA, USA). The chromatographic separation of metabolites was achieved via a Synergi 4 µm Hydro-RP 80 Å, 150 × 2 mm HPLC column (Phenomenex, Torrance, CA, USA). Mobile phases (A) HPLC water and (B) methanol were run at 99/1 for 2 minutes, then increased linearly from 70/30 to 20/80 in 8 minutes, with a wash of 2/98 for 5 minutes and a column equilibration time of 15 minutes. The total run time was 30 minutes with 5 µL injection volume and 250 µL/min flow rate, as previously described (18). Detection was completed in full MS mode with the following settings: spray voltage, 3.5 kV; capillary temperature, 320°C; sheath gas, 45 (arbitrary units); auxiliary gas, 10 (arbitrary units); m/z range, 70‐1000 (HILIC), 50 to 750 (RP); data acquisition, centroid mode; microscans, 10; AGC target, 1e6; maximum injection time, 200 ms; mass
Chiral metabolomics analysis
Chiral metabolomics was conducted on the Vanquish Flex UHPLC (Fisher Scientific, San Jose, CA, USA) equipped with an ACQUITY BEH C18 150 × 2.1 mm (1.7 μm, 130 Å) column (Waters, Milford, MA) in tandem with the Q Exactive Hybrid Quadrupole Orbitrap mass spectrometer (Thermo Scientific, Bremen, Germany) equipped with electrospray ionization (ESI) operating in negative/positive ion switching mode. Mobile phases (A) 0.06% formic acid and 10mM ammonium formate, (B) 0.1% formic acid in acetonitrile, (C) 0.1% formic acid in methanol were run at a ratio of 98/1/1 to 90/5/5 for 14 minutes, 90/5/5 to 95/5/0 from 14-14.5, 95/5/0 to 92/8/0 from 14.5-31 minutes, 92/8/0 to 67/33/0 from 31-62 minutes, 67/33/0 to 98/1/1 from 62-63 minutes with an equilibration time of 12 minutes. Total run time was 75 minutes. Quality control samples were made prior to undergoing derivatization by (+)-diacetyl-L-tartaric anhydride and (-)-diacetyl-D-tartaric anhydride as previously described (39). Detection was completed in full MS mode in positive ionization mode with the following settings: spray voltage, 4.0 kV; capillary temperature, 320°C; sheath gas, 45 (arbitrary units); auxiliary gas, 10 (arbitrary units); S-lens RF-level, 50; micro scans, 1; AGC target, 1e6; maximum injection time, 200 ms; mass resolution, 70,000/35,000 fwhm; m/z range, 70–1000. Pooled quality control samples were injected every 6-th sample.
Data processing and statistical analysis
SIEVE 2.2.0 SP2 software (Thermo Scientific, San Jose, CA, USA) was used to conduct peak picking and spectral alignment on raw data. Peak identities were assigned by matching the mass-to-charge ratio and retention time values to an in-house library of compounds. Peaks with a coefficient of variation (CV) greater than 25% in the pooled quality control repeat injections were excluded from the analysis. The Pearson and Spearman correlation coefficients and their significance were calculated to study the association between metabolite levels and survival data using Matlab. A False Discovery Rate correction was applied to p-values obtained from the correlation analysis and q-values <0.05 were considered significant. We conducted 100,000 sample permutation statistical tests to sample all patients.
Results
Peripheral blood metabolites as markers of tumor hypoxia
We investigated whether specific metabolites in the peripheral circulation were associated with the extent of tumor hypoxia evaluated in GBM patients via imaging techniques prior to the first dose of combined Bev/Evo. Blood plasma samples were profiled using untargeted, high resolution mass spectrometry (aimed at detecting a large number of metabolites) combined with a newly developed approach to differentiate the specific enantiomeric forms of amino and hydroxy acids, also in an untargeted fashion. 130 unique metabolites and 60 enantiomeric forms (30 enantiomeric pairs) were identified based on matching mass-to-charge ratio and retention time values to an in-house library of compounds.
We correlated the blood metabolite levels and patients’ HV to investigate any association between specific circulating metabolites and the extent of tumor hypoxia. The results below include metabolites that demonstrate significant Pearson and Spearman correlations with patients’ hypoxia in the tumor (hypoxia volume, HV) or survival. Blood samples from 30 patients (16 and 14 collected at UT and DF, respectively) with matched HV levels were available for this analysis. Our correlation of blood resulted in several circulating metabolites with significant associations. Serum levels of phosphoserine (Pearson r=-0.63, q-value=0.007; Spearman r=-0.72, q-value=0.002), glutamic acid (Pearson r=-0.50, q-value=0.008; Spearman r=-0.58, q-value=0.01) and gamma-aminobutyric acid (Pearson r=-0.47, q-value=0.007; Spearman r=-0.46, q-value=0.01) all resulted in significant correlations with HV (Figure 1A–C and Supplementary Figure 1A–C). Interestingly, the blood level of serine, a metabolite very closely related to phosphoserine, also resulted in a significant correlation with patient’s survival data (Figure 1D and Supplementary Figure 1D; Pearson r=0.48, q-value=0.043; Spearman r=0.47, q-value=0.031). Phosphoserine, glutamic acid and gamma-aminobutyric acid, while significantly correlated to HV, were not correlated to OS (data in Supplementary Data Table 1). Other detected metabolites in the glycolysis and serine pathways did not correlate to either HV or OS (data in Supplementary Data Table 2). Blood samples from 26 patients (14 and 12 collected at UT and DF, respectively) with matched OS data were available for this analysis (Supplementary Data Tables; for some patients with available HV levels, OS data were unknown),.
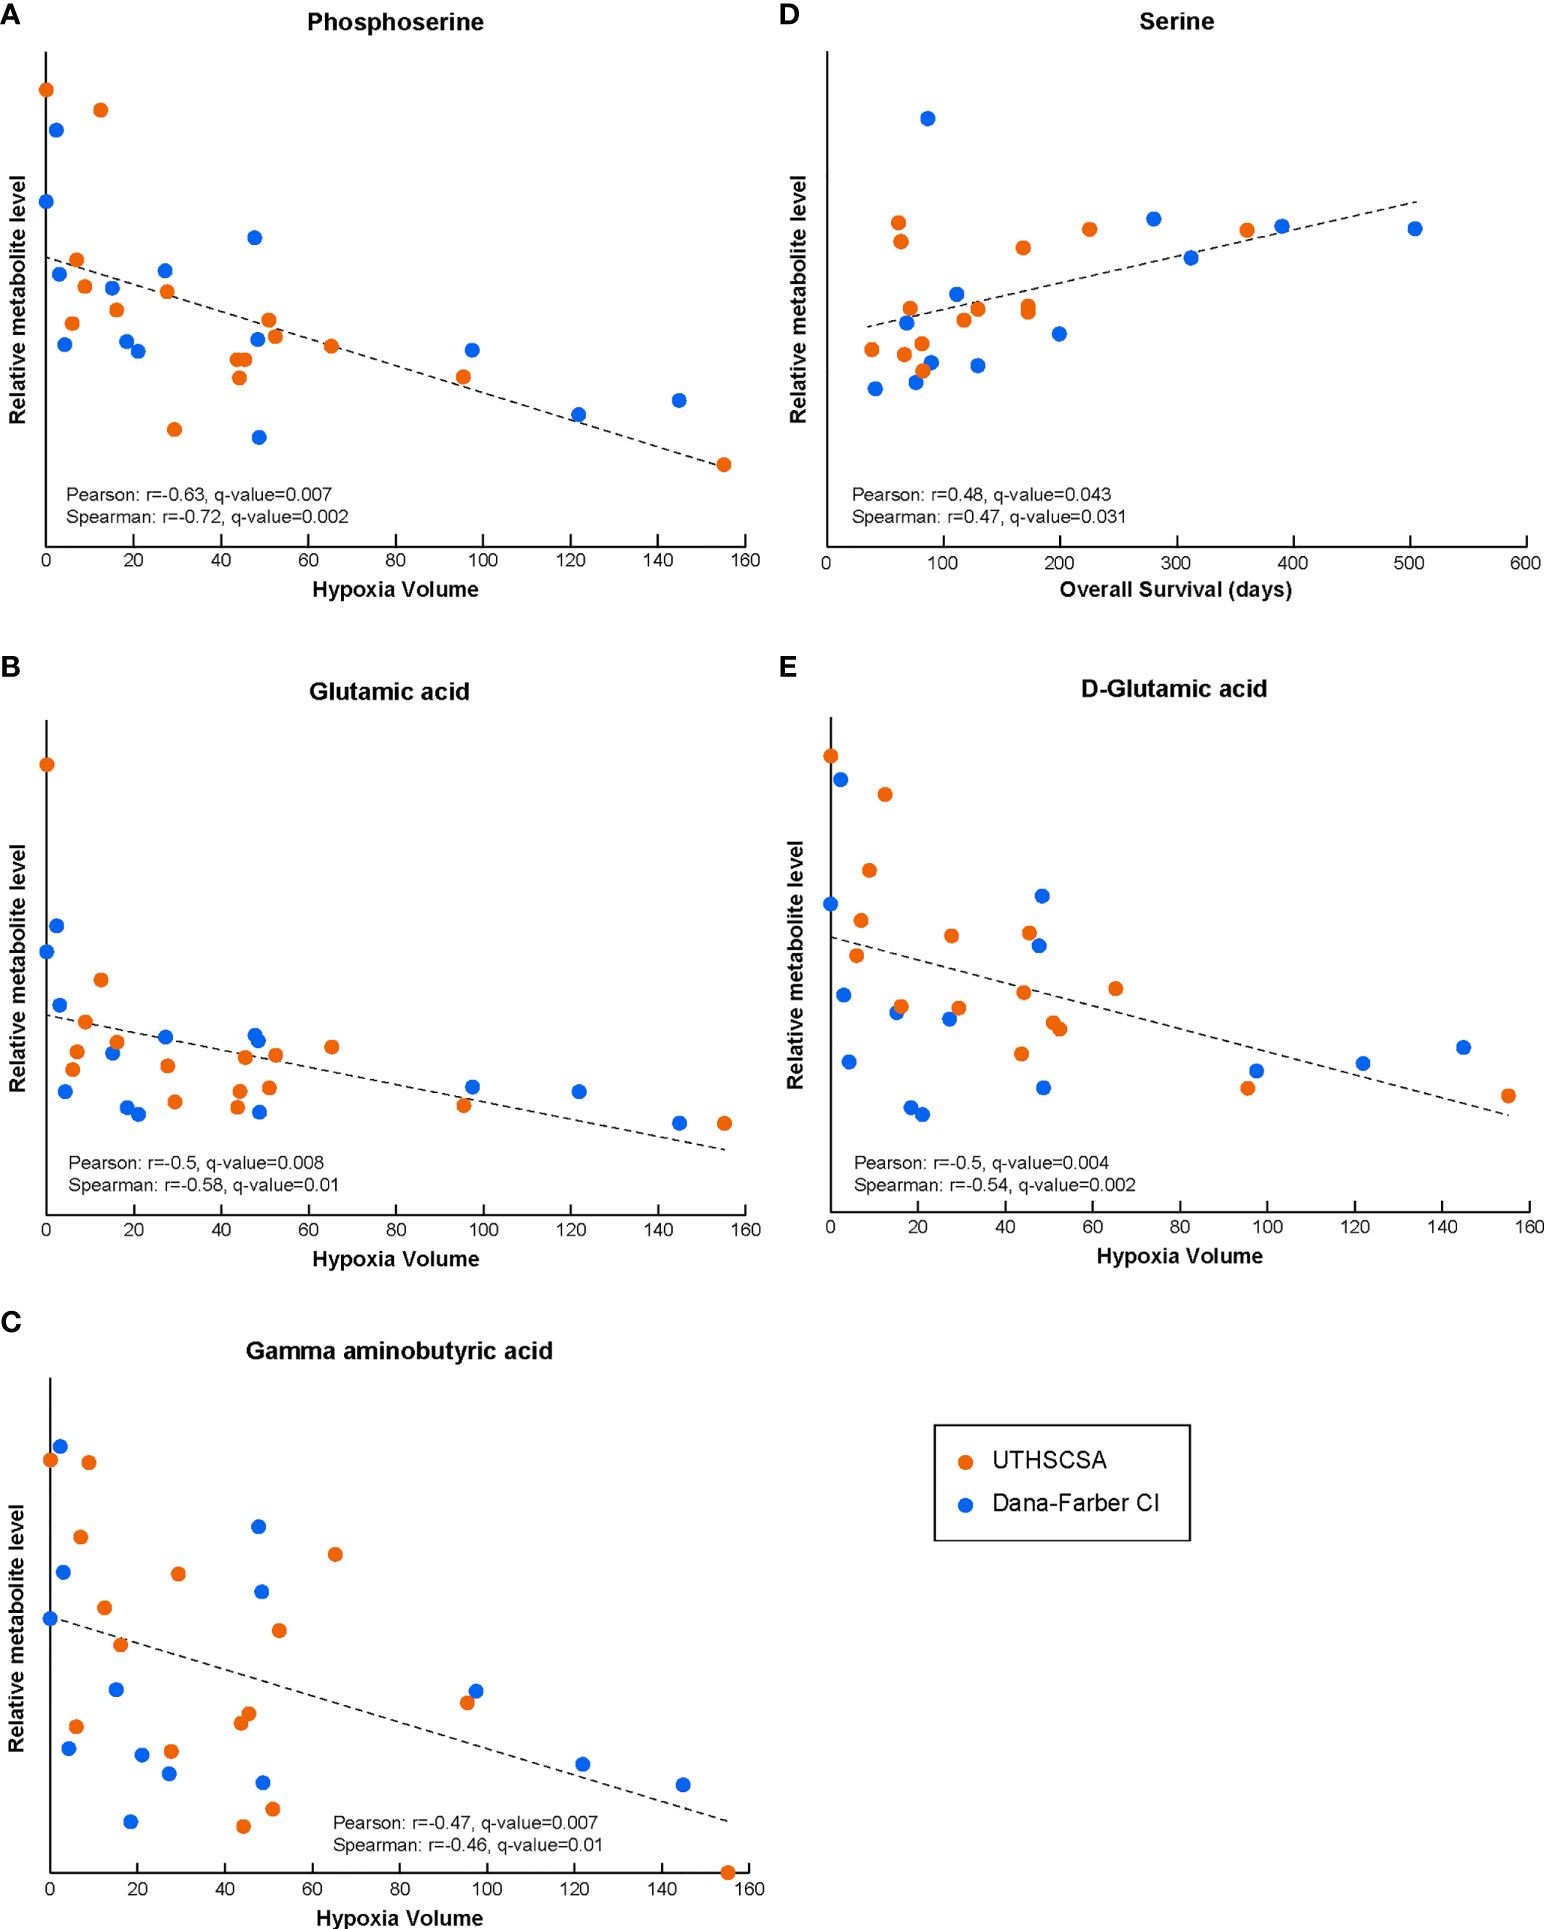
Figure 1 The levels of circulating metabolites in Bevacizumab-refractory GBM patients prior to treatment with Bev/Evo correlate with tumor hypoxia and OS. Phosphoserine, and gamma aminobutyric, glutamic and D-glutamic acids circulating levels result in significant correlation with HV (A–C, E). Serine levels significantly correlated with OS (D). In all panels, the Pearson correlation linear regression is shown with the black dashed line. Datapoints for each patient are shown in orange for patients enrolled at the University of Texas Health Science Center in San Antonio (UTHSCSA; 16 and 14 patient samples for HV and OS correlations, respectively) and in blue for patients enrolled at Dana-Farber Cancer Institute (CI; 14 and 12 patient samples for HV and OS correlations, respectively). Evaluation of significance included corrections for repeated measurements and sample permutation (100,000 permutations) statistical tests (included in Supplementary Figure 1).
Moreover, the analysis of the correlation between the HV data and the levels of the specific enantiomeric forms of amino and hydroxy acids resulted in a significant correlation coefficient for D-glutamic acid (Pearson r=-0.50, q-value=0.004; Spearman r=-0.54, q-value=0.002; Figure 1E and Supplementary Figure 1E), but not L-glutamic acid (not shown; both forms trended similarly vs HV and did not correlate with OS).
Peripheral blood metabolites as markers of response
Patients’ blood samples were collected immediately prior to treatment and at several times points during treatment. To identify blood metabolites that might offer insight into the patient’s response to treatment, we investigated whether the extent of the metabolite level changes during treatment in matched patient samples (compared to prior to the start of treatment) correlated with HV and/or survival. More specifically, for each patient, the ratio of the metabolite levels at a given time during treatment (either cycle 2 or cycle 5 of treatment) and the metabolite level prior to treatment was calculated, and correlations with HV or survival were evaluated. These analyses were limited by the small number of samples available, specifically 10 samples for both the cycle 2 timepoint (7 from DF and 3 from UT), and end of treatment (cycle 5; 2 from DF and 8 from UT).
Interestingly, and although the number of patient samples available for this analysis was very limited, changes lactic acids serum levels after cycle 2 of treatment (as compared to the levels before treatment) significantly correlated with HV (Pearson r=0.79, q-value=0.01; Spearman r=0.76, q-value=0.048; Figure 2 and Supplementary Figure 1F).
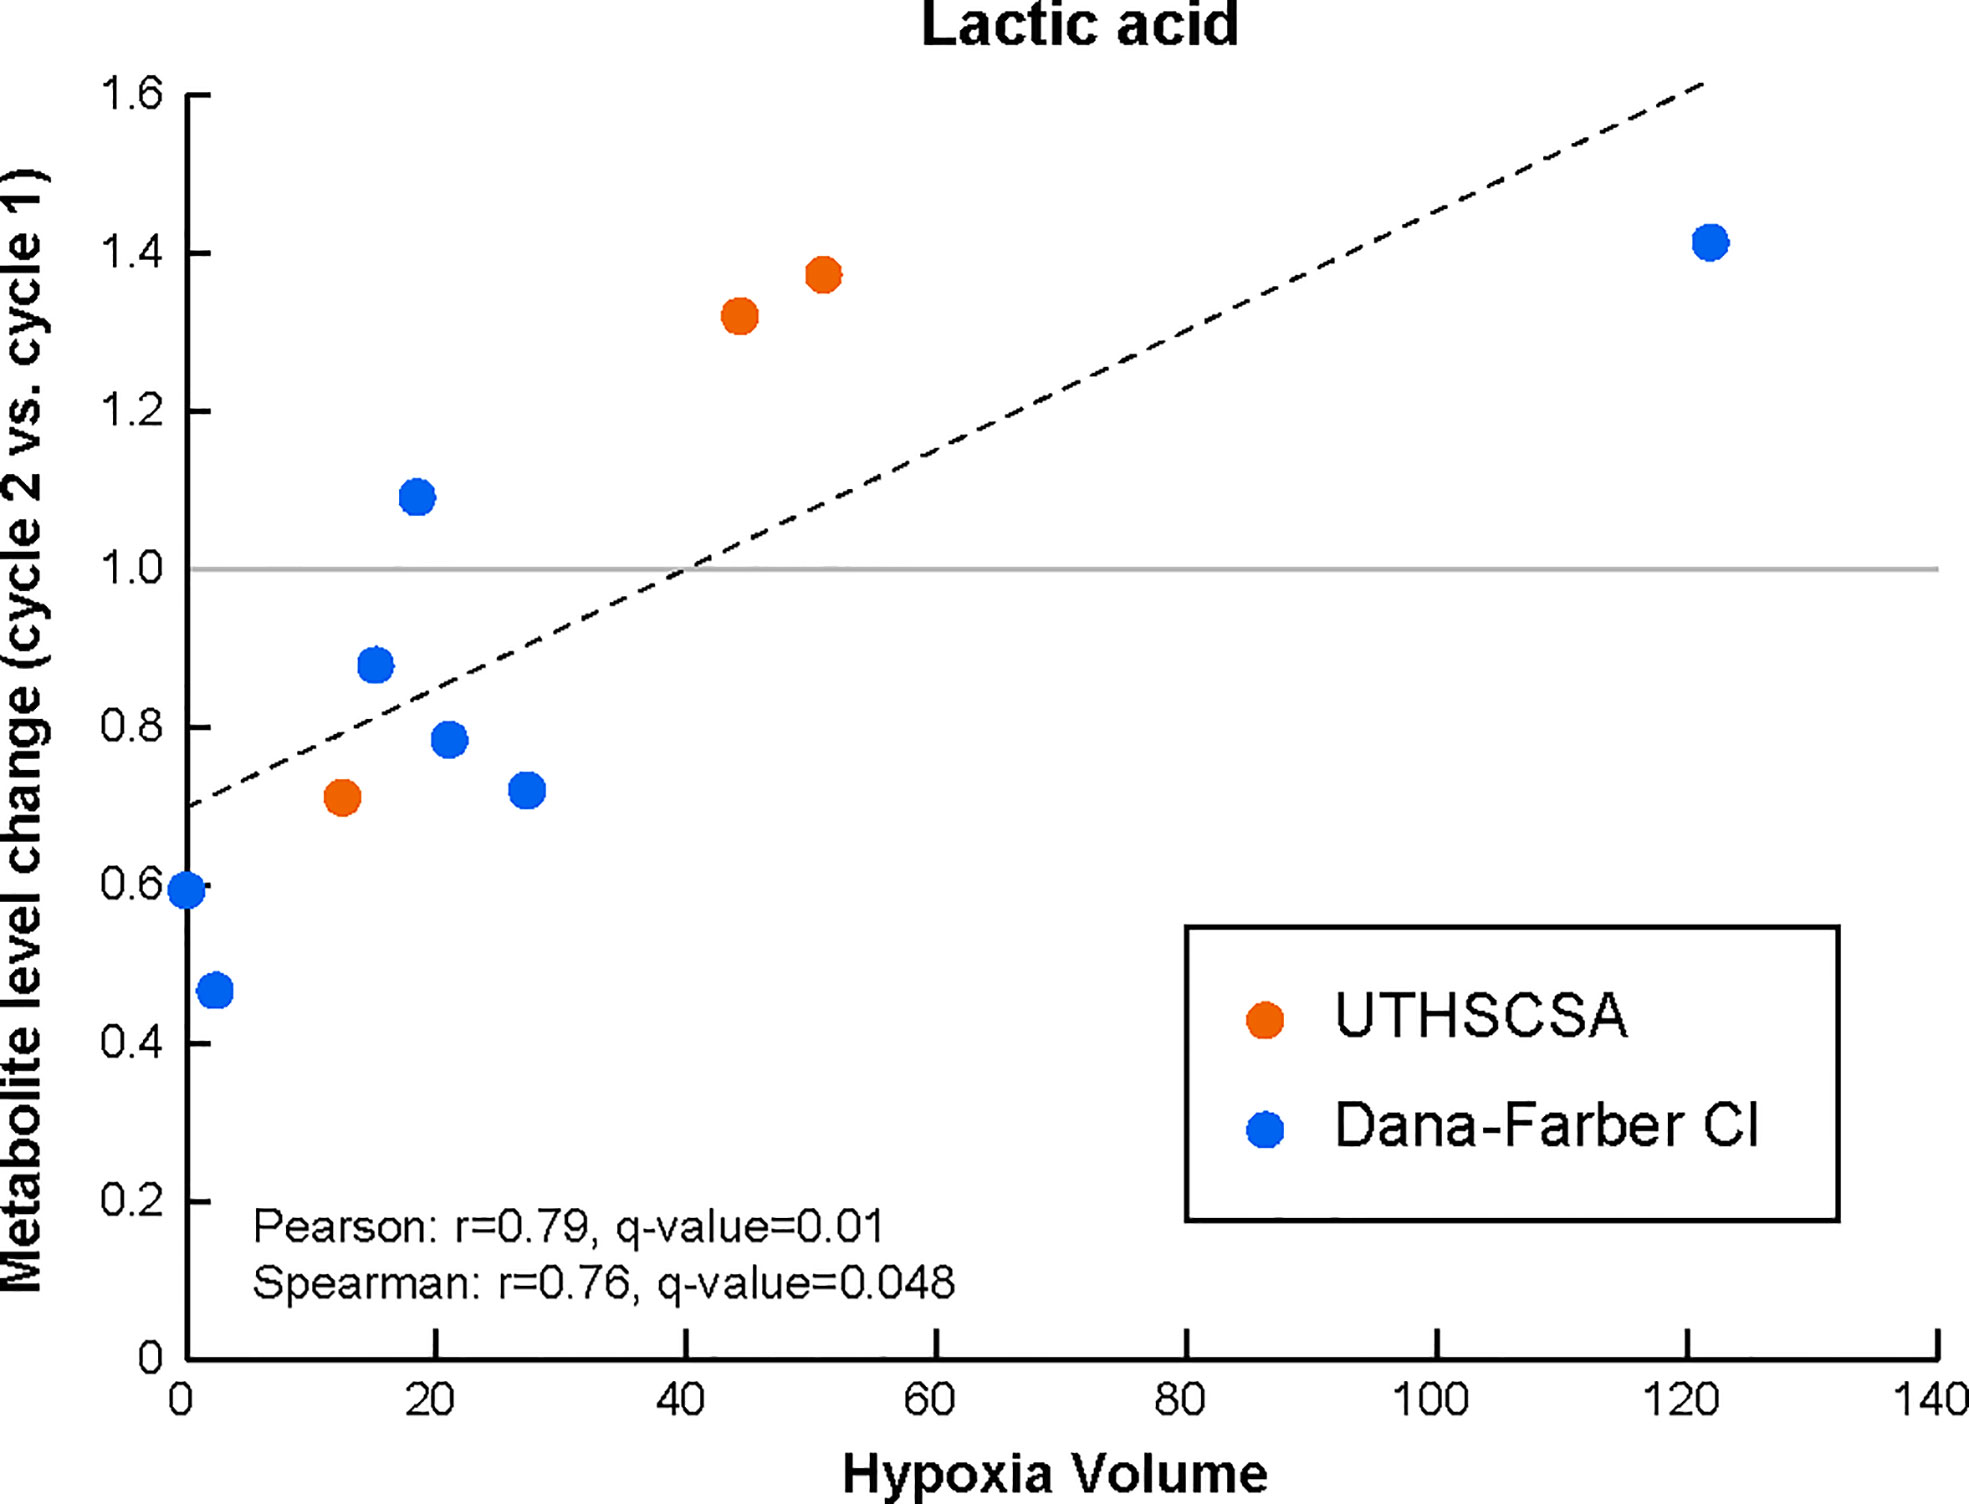
Figure 2 Lactic acid levels in the peripheral circulation are modulated early during treatment with Bev/Evo to an extent that is associated with tumor hypoxia levels prior to treatment. Changes in the levels of the blood metabolite after treatment (i.e. levels at cycle 2 normalized to the matched levels prior to treatment) significantly correlate with HV. The Pearson correlation linear regression is shown with the black dashed line. Datapoints for each patient are shown in orange for patients enrolled at the University of Texas Health Science Center in San Antonio (UTHSCSA; 3 patient samples) and in blue for patients enrolled at Dana-Farber Cancer Institute (CI; 7 patient samples). Evaluation of significance included corrections for repeated measurements and sample permutation (100,000 permutations) statistical tests (included in Supplementary Figure 1).
No significant correlations were identified between HV before treatment and changes in serum metabolite levels at the end of treatment (cycle 5 compared to before treatment).
Peripheral blood metabolites do not reflect MGMT or IDH status
We investigated the presence of associations between circulating metabolite levels and MGMT or IDH status in our GBM patient cohort. MGMT status was methylated in 26%, unmethylated in 32%, and unknown in 42% of the patients. IDH mutations were identified in 29%, not seen in 46%, and unknown in 25%. Metabolite levels in the peripheral circulation were found not to reflect either MGMT or IDH status.
Discussion
The combination of Evo and Bev was evaluated in recurrent glioblastoma patients following Bev failure in a dual center, phase 2 trial (5). As previously reported, the Bev/Evo combination resulted in improved outcomes in patient’s PFS. A number of brain imaging readings (such as hypoxic volume, perfusion and anatomic radiographic features) were evaluated to determine if any of these could provide a non-invasive mean to predict the benefits of the combined Bev/Evo treatment (9). Based on those measurements, the hypoxic volume in the tumor was determined to be negatively associated with PFS and OS (9).
Even though the imaging parameters provide a direct reflection of the localized status near the tumor area, the multivariate nature of the metabolic profiling in the peripheral circulation has the potential to provide complementary information to identify patients that could benefit from this regimen following Bev failure.
The metabolic profiling was performed using untargeted, high-resolution LC-MS-based metabolomics approaches to profile total pool metabolite levels as well as the relative levels of the enantiomeric forms of amino and hydroxy acid compounds. These include, for example, the D- form of amino acids (e.g., D-serine). While the D- amino acids have been deemed “unnatural” in the past and are still generally not receiving much attention in human studies, we and others have shown that these metabolites are present not only in human biofluids (possibly deriving from the microbiome) but also in human cell lines (in some cases at levels comparable to the “natural” L- enantiomeric form) and are important in the search of metabolic biomarkers to evaluate aspects including disease development and progression, and response to treatment (23–25, 27–32, 37–39).
Here, we investigated (i) whether the blood level of metabolites in the peripheral circulation could reflect the severity of hypoxia in the tumor and offer an alternative or additional way to assess hypoxia levels in the tumor and (ii) whether the changes in circulating metabolites during treatment could provide early response information to evaluate treatment efficacy. Given the limited number of patients involved in this study, the candidate metabolic biomarkers we report here will need to be further validated.
Among several other circulating metabolites, phosphoserine serum levels prior to treatment significantly correlated with HV. In addition, serine levels before treatment were positively correlated with OS. In the serine synthesis pathway, phosphoserine is formed from 3-phosphoglycerate via phosphoglycerate dehydrogenase (PHGDH) and phosphoserine aminotransferase 1 (PSAT1). Phosphoserine phosphatase (PSPH) then converts phosphoserine to serine. Hypoxia has been shown to induce expression of PHGDH, PSAT1 and PSPH in breast cancer cells (41) and PHGDH has been shown to be overexpressed in various cancer types, including colorectal, non-small cell lung, cervical and breast cancers (42–44). Taken together, the blood level of phosphoserine and serine suggest the potential usefulness of these circulating metabolites in accessing the extent of tumor hypoxia and the identifying patients that could benefit from combined Bev/Evo following Bev failure.
In addition to phosphoserine, also glutamic and gamma aminobutyric acid blood levels prior to treatment were both negatively correlated with HV. In addition, the enantiomeric analysis of the relative amounts of stereoisomer compounds, revealed that D-glutamic acid, but not L-glutamic acid, significantly negatively correlated with HV at diagnosis. Glutamic acid and gamma aminobutyric acid are both key metabolites/neurotransmitters in the normal brain (45, 46). Active neurons have been shown to impact glioma growth and progression (46, 47), therefore, while their function and modulation in glioblastomas and hypoxia has not been clarified, one could speculate that these neurotransmitter metabolites might also have key roles in glioblastoma progression and growth. Moreover, glioma cells and many other cancer cell types, are highly dependent on glutamine (from which glutamic acid is derived) for their heightened biosynthetic and energetic needs (48, 49). Glutamic acid and gamma aminobutyric acid are closely related to D-glutamic acid which points to the potential of the enantiomeric form to further improve the relevance of metabolic signatures of disease.
Interestingly, the magnitude of the changes in the blood levels of lactic acid early on during treatment (compared to prior to treatment) were positively associated with the pre-treatment extent of hypoxia in the tumor. Hypoxia was shown to induce transcription of glycolytic enzymes mediated by HIF-1, including activation of pyruvate dehydrogenase kinase 1 (PDK1) and lactate dehydrogenase A (LDHA) leading to a switch in cell metabolism to glycolysis (50). The observed changes might therefore reflect changes in tumor hypoxia following treatment and, if confirmed in larger studies could serve as a means of non-invasively following treatment response and efficacy.
Given the lack of effective circulating tumor markers for glioblastoma and the known issues in radiographic assessment of response including pseudo-response and pseudo-progression, the potential of serum metabolites as ancillary markers of response is clinically significant. Additional studies are needed that include a larger number of patients to confirm the finding that the levels of these circulating metabolites represent a reflection of tissue hypoxia, possible hypoxia biomarkers and predictors of treatment efficacy.
In summary, as a general finding our study highlights the importance to consider metabolic profiles in human biosamples that include the specific enantiomeric forms of various metabolites to further improve our ability to discover novel multivariate metabolic signatures of disease and treatment response. Specifically, as it relates to the Bev/Evo treatment being considered here, the plasma levels of circulating intermediates related to serine synthesis pathway and glycolysis prior to treatment and their changes during treatment might provide important indicators associated with tissue hypoxia and valuable predictors of the efficacy of the combined Bev/Evo treatment.
Data availability statement
The original contributions presented in the study are included in the article/Supplementary Material. Further inquiries can be directed to the corresponding authors.
Ethics statement
The studies involving human participants were reviewed and approved by institutional review board at the University of Texas Health Science Center at San Antonio and at the Dana Farber Cancer Institute. The patients/participants provided their written informed consent to participate in this study.
Author contributions
All authors listed have made a substantial, direct, and intellectual contribution to the work and approved it for publication.
Funding
This study was supported by an FDA Orphan Products Research Project Grant (TH-302, R01FD004400).
Acknowledgments
We are grateful to the patients who participated in this study. SY was supported by the National Institutes of Health grant R35GM133658.
Conflict of interest
The authors declare that the research was conducted in the absence of any commercial or financial relationships that could be construed as a potential conflict of interest.
Publisher’s note
All claims expressed in this article are solely those of the authors and do not necessarily represent those of their affiliated organizations, or those of the publisher, the editors and the reviewers. Any product that may be evaluated in this article, or claim that may be made by its manufacturer, is not guaranteed or endorsed by the publisher.
Supplementary material
The Supplementary Material for this article can be found online at: https://www.frontiersin.org/articles/10.3389/fonc.2022.900082/full#supplementary-material
References
1. Ostrom QT, Patil N, Cioffi G, Waite K, Kruchko C, Barnholtz-Sloan JS. CBTRUS statistical report: Primary brain and other central nervous system tumors diagnosed in the united states in 2013-2017. Neuro Oncol (2020) 22(12 Suppl 2):iv1–iv96. doi: 10.1093/neuonc/noaa200
2. Stupp R, Taillibert S, Kanner AA, Kesari S, Steinberg DM, Toms SA, et al. Maintenance therapy with tumor-treating fields plus temozolomide vs temozolomide alone for glioblastoma: A randomized clinical trial. JAMA. (2015) 314(23):2535–43. doi: 10.1001/jama.2015.16669
3. Mahase S, Rattenni RN, Wesseling P, Leenders W, Baldotto C, Jain R, et al. Hypoxia-mediated mechanisms associated with antiangiogenic treatment resistance in glioblastomas. Am J pathol (2017) 187(5):940–53. doi: 10.1016/j.ajpath.2017.01.010
4. Brenner A, Zuniga R, Sun JD, Floyd J, Hart CP, Kroll S, et al. Hypoxia-activated evofosfamide for treatment of recurrent bevacizumab-refractory glioblastoma: a phase I surgical study. Neuro Oncol (2018) 20(9):1231–9. doi: 10.1093/neuonc/noy015
5. Brenner AJ, Floyd J, Fichtel L, Michalek J, Kanakia KP, Huang S, et al. Phase 2 trial of hypoxia activated evofosfamide (TH302) for treatment of recurrent bevacizumab-refractory glioblastoma. Sci Rep (2021) 11(1):2306. doi: 10.1038/s41598-021-81841-0
6. Baran N, Konopleva M. Molecular pathways: Hypoxia-activated prodrugs in cancer therapy. Clin Cancer Res (2017) 23(10):2382–90. doi: 10.1158/1078-0432.CCR-16-0895
7. Wojtkowiak JW, Cornnell HC, Matsumoto S, Saito K, Takakusagi Y, Dutta P, et al. Pyruvate sensitizes pancreatic tumors to hypoxia-activated prodrug TH-302. Cancer Metab (2015) 3(1):2. doi: 10.1186/s40170-014-0026-z
8. Matsumoto S, Kishimoto S, Saito K, Takakusagi Y, Munasinghe JP, Devasahayam N, et al. Metabolic and physiologic imaging biomarkers of the tumor microenvironment predict treatment outcome with radiation or a hypoxia-activated prodrug in mice. Cancer Res (2018) 78(14):3783–92. doi: 10.1158/0008-5472.CAN-18-0491
9. Huang S, Michalek JE, Reardon DA, Wen PY, Floyd JR, Fox PT, et al. Assessment of tumor hypoxia and perfusion in recurrent glioblastoma following bevacizumab failure using MRI and 18 f-FMISO PET. Sci Rep (2021) 11(1):1–12. doi: 10.1038/s41598-021-84331-5
10. Pandey R, Caflisch L, Lodi A, Brenner AJ, Tiziani S. Metabolomic signature of brain cancer. Mol Carcinog. (2017) 56(11):2355–71. doi: 10.1002/mc.22694
11. Zeleznik OA, Eliassen AH, Kraft P, Poole EM, Rosner BA, Jeanfavre S, et al. A prospective analysis of circulating plasma metabolites associated with ovarian cancer risk. Cancer Res (2020) 80(6):1357–67. doi: 10.1158/0008-5472.CAN-19-2567
12. Lodi A, Tiziani S, Khanim FL, Gunther UL, Viant MR, Morgan GJ, et al. Proton NMR-based metabolite analyses of archived serial paired serum and urine samples from myeloma patients at different stages of disease activity identifies acetylcarnitine as a novel marker of active disease. PloS One (2013) 8(2):e56422. doi: 10.1371/journal.pone.0056422
13. Wang AS, Lodi A, Rivera LB, Izquierdo-Garcia JL, Firpo MA, Mulvihill SJ, et al. HR-MAS MRS of the pancreas reveals reduced lipid and elevated lactate and taurine associated with early pancreatic cancer. NMR Biomed (2014) 27(11):1361–70. doi: 10.1002/nbm.3198
14. Zeleznik OA, Balasubramanian R, Zhao Y, Frueh L, Jeanfavre S, Avila-Pacheco J, et al. Circulating amino acids and amino acid-related metabolites and risk of breast cancer among predominantly premenopausal women. NPJ Breast Cancer. (2021) 7(1):54. doi: 10.1038/s41523-021-00262-4
15. Tiziani S, Lopes V, Gunther UL. Early stage diagnosis of oral cancer using 1H NMR-based metabolomics. Neoplasia. (2009) 11(3):269–76. doi: 10.1593/neo.81396
16. Lodi A, Saha A, Lu X, Wang B, Sentandreu E, Collins M, et al. Combinatorial treatment with natural compounds in prostate cancer inhibits prostate tumor growth and leads to key modulations of cancer cell metabolism. NPJ Precis Oncol (2017) 1:1–18. doi: 10.1038/s41698-017-0024-z
17. Lu WC, Saha A, Yan W, Garrison K, Lamb C, Pandey R, et al. Enzyme-mediated depletion of serum l-met abrogates prostate cancer growth via multiple mechanisms without evidence of systemic toxicity. Proc Natl Acad Sci U S A. (2020) 117(23):13000–11. doi: 10.1073/pnas.1917362117
18. Sweeney SR, Collins M, Pandey R, Chiou J, Lodi A, Tiziani S. Identification of a synergistic combination of dimethylaminoparthenolide and shikonin alters metabolism and inhibits proliferation of pediatric precursor-b cell acute lymphoblastic leukemia. Mol Carcinog. (2020) 59(4):399–411. doi: 10.1002/mc.23163
19. Suzuki M, Nishiumi S, Matsubara A, Azuma T, Yoshida M. Metabolome analysis for discovering biomarkers of gastroenterological cancer. J Chromatogr B Analyt Technol BioMed Life Sci (2014) 966:59–69. doi: 10.1016/j.jchromb.2014.02.042
20. Zhang H, Ge T, Cui X, Hou Y, Ke C, Yang M, et al. Prediction of advanced ovarian cancer recurrence by plasma metabolic profiling. Mol Biosyst (2015) 11(2):516–21. doi: 10.1039/C4MB00407H
21. Xie H, Hou Y, Cheng J, Openkova MS, Xia B, Wang W, et al. Metabolic profiling and novel plasma biomarkers for predicting survival in epithelial ovarian cancer. Oncotarget. (2017) 8(19):32134–46. doi: 10.18632/oncotarget.16739
22. Mahapatra S, Hess AM, Johnson JL, Eisenach KD, DeGroote MA, Gitta P, et al. A metabolic biosignature of early response to anti-tuberculosis treatment. BMC Infect Dis (2014) 14:53. doi: 10.1186/1471-2334-14-53
23. Ariyoshi M, Katane M, Hamase K, Miyoshi Y, Nakane M, Hoshino A, et al. D-glutamate is metabolized in the heart mitochondria. Sci Rep (2017) 7:43911. doi: 10.1038/srep43911
24. Billard JM. D-amino acids in brain neurotransmission and synaptic plasticity. Amino Acids (2012) 43(5):1851–60. doi: 10.1007/s00726-012-1346-3
25. Du S, Wang Y, Alatrash N, Weatherly CA, Roy D, MacDonnell FM, et al. Altered profiles and metabolism of l- and d-amino acids in cultured human breast cancer cells vs. non-tumorigenic human breast epithelial cells. J Pharm Biomed Anal (2019) 164:421–9. doi: 10.1016/j.jpba.2018.10.047
26. Ilie-Mihai RM, Stefan-van Staden RI, Magerusan L, Coros M, Pruneanu S. Enantioanalysis of tryptophan in whole blood samples using stochastic sensors-a screening test for gastric cancer. Chirality. (2020) 32(2):215–22. doi: 10.1002/chir.23155
27. Kimura R, Tsujimura H, Tsuchiya M, Soga S, Ota N, Tanaka A, et al. Development of a cognitive function marker based on d-amino acid proportions using new chiral tandem LC-MS/MS systems. Sci Rep (2020) 10(1):804. doi: 10.1038/s41598-020-57878-y
28. Kimura T, Hamase K, Miyoshi Y, Yamamoto R, Yasuda K, Mita M, et al. Chiral amino acid metabolomics for novel biomarker screening in the prognosis of chronic kidney disease. Sci Rep (2016) 6:26137. doi: 10.1038/srep26137
29. Lorenzo MP, Dudzik D, Varas E, Gibellini M, Skotnicki M, Zorawski M, et al. Optimization and validation of a chiral GC-MS method for the determination of free d-amino acids ratio in human urine: application to a gestational diabetes mellitus study. J Pharm BioMed Anal (2015) 107:480–7. doi: 10.1016/j.jpba.2015.01.015
30. Nagata Y, Sato T, Enomoto N, Ishii Y, Sasaki K, Yamada T. High concentrations of d-amino acids in human gastric juice. Amino Acids (2007) 32(1):137–40. doi: 10.1007/s00726-006-0262-9
31. Stefan-van Staden RI, Ilie-Mihai RM, Magerusan L, Coros M, Pruneanu S. Enantioanalysis of glutamine-a key factor in establishing the metabolomics process in gastric cancer. Anal Bioanal Chem (2020) 412(13):3199–207. doi: 10.1007/s00216-020-02575-y
32. Suzuki M, Imanishi N, Mita M, Hamase K, Aiso S, Sasabe J. Heterogeneity of d-serine distribution in the human central nervous system. ASN Neuro. (2017) 9(3):1759091417713905. doi: 10.1177/1759091417713905
33. Zhang Z, Liu Y, Liu P, Yang L, Jiang X, Luo D, et al. Non-invasive detection of gastric cancer relevant d-amino acids with luminescent DNA/silver nanoclusters. Nanoscale. (2017) 9(48):19367–73. doi: 10.1039/C7NR07337B
34. Dang L, White DW, Gross S, Bennett BD, Bittinger MA, Driggers EM, et al. Cancer-associated IDH1 mutations produce 2-hydroxyglutarate. Nature. (2009) 462(7274):739–44. doi: 10.1038/nature08617
35. Rakheja D, Konoplev S, Medeiros LJ, Chen W. IDH mutations in acute myeloid leukemia. Hum Pathol (2012) 43(10):1541–51. doi: 10.1016/j.humpath.2012.05.003
36. Dang L, Jin S, Su SM. IDH mutations in glioma and acute myeloid leukemia. Trends Mol Med (2010) 16(9):387–97. doi: 10.1016/j.molmed.2010.07.002
37. Intlekofer AM, Dematteo RG, Venneti S, Finley LW, Lu C, Judkins AR, et al. Hypoxia induces production of l-2-Hydroxyglutarate. Cell Metab (2015) 22(2):304–11. doi: 10.1016/j.cmet.2015.06.023
38. Oldham WM, Clish CB, Yang Y, Loscalzo J. Hypoxia-mediated increases in l-2-hydroxyglutarate coordinate the metabolic response to reductive stress. Cell Metab (2015) 22(2):291–303. doi: 10.1016/j.cmet.2015.06.021
39. Pandey R, Collins M, Lu X, Sweeney SR, Chiou J, Lodi A, et al. Novel strategy for untargeted chiral metabolomics using liquid chromatography-high resolution tandem mass spectrometry. Anal Chem (2021) 93(14):5805–14. doi: 10.1021/acs.analchem.0c05325
40. Tiziani S, Emwas AH, Lodi A, Ludwig C, Bunce CM, Viant MR, et al. Optimized metabolite extraction from blood serum for 1H nuclear magnetic resonance spectroscopy. Anal Biochem (2008) 377(1):16–23. doi: 10.1016/j.ab.2008.01.037
41. Samanta D, Park Y, Andrabi SA, Shelton LM, Gilkes DM, Semenza GL. PHGDH expression is required for mitochondrial redox homeostasis, breast cancer stem cell maintenance, and lung metastasis. Cancer Res (2016) 76(15):4430–42. doi: 10.1158/0008-5472.CAN-16-0530
42. DeNicola GM, Chen P-H, Mullarky E, Sudderth JA, Hu Z, Wu D, et al. NRF2 regulates serine biosynthesis in non–small cell lung cancer. Nat Genet (2015) 47(12):1475–81. doi: 10.1038/ng.3421
43. Jia X-Q, Zhang S, H-J Z, Wang W, J-H Z, X-D W, et al. Increased expression of PHGDH and prognostic significance in colorectal cancer. Trans Oncol (2016) 9(3):191–6. doi: 10.1016/j.tranon.2016.03.006
44. Jing Z, Heng W, Aiping D, Yafei Q, Shulan Z. Expression and clinical significance of phosphoglycerate dehydrogenase and squamous cell carcinoma antigen in cervical cancer. Int J Gynecol Cancer (2013) 23(8):1465–9. doi: 10.1097/IGC.0b013e3182a0c068
45. Bak LK, Schousboe A, Waagepetersen HS. The glutamate/GABA-glutamine cycle: aspects of transport, neurotransmitter homeostasis and ammonia transfer. J neurochem (2006) 98(3):641–53. doi: 10.1111/j.1471-4159.2006.03913.x
46. Gillespie S, Monje M. An active role for neurons in glioma progression: making sense of scherer’s structures. Neuro-oncology. (2018) 20(10):1292–9. doi: 10.1093/neuonc/noy083
47. Worthington JJ, Kelly A, Smedley C, Bauché D, Campbell S, Marie JC, et al. Integrin αvβ8-mediated TGF-β activation by effector regulatory T cells is essential for suppression of T-cell-mediated inflammation. Immunity. (2015) 42(5):903–15. doi: 10.1016/j.immuni.2015.04.012
48. Márquez J, Alonso FJ, Matés JM, Segura JA, Martín-Rufián M, Campos-Sandoval JA. Glutamine addiction in gliomas. Neurochem Res (2017) 42(6):1735–46. doi: 10.1007/s11064-017-2212-1
49. Obara-Michlewska M, Szeliga M. Targeting glutamine addiction in gliomas. Cancers. (2020) 12(2):310. doi: 10.3390/cancers12020310
Keywords: glioblastoma (GBM), bevacizumab (BEV), evofosfamide (TH-302), metabolomics (OMICS), circulating metabolites, enantiomers, D-glutamic acid (D-Glu)
Citation: Lodi A, Pandey R, Chiou J, Bhattacharya A, Huang S, Pan X, Burgman B, Yi SS, Tiziani S and Brenner AJ (2022) Circulating metabolites associated with tumor hypoxia and early response to treatment in bevacizumab-refractory glioblastoma after combined bevacizumab and evofosfamide. Front. Oncol. 12:900082. doi: 10.3389/fonc.2022.900082
Received: 19 March 2022; Accepted: 07 September 2022;
Published: 26 September 2022.
Edited by:
Ubaldo Emilio Martinez-Outschoorn, Thomas Jefferson University, United StatesReviewed by:
Joydeep Mukherjee, University of California, San Francisco, United StatesIyad Alnahhas, Thomas Jefferson University, United States
Copyright © 2022 Lodi, Pandey, Chiou, Bhattacharya, Huang, Pan, Burgman, Yi, Tiziani and Brenner. This is an open-access article distributed under the terms of the Creative Commons Attribution License (CC BY). The use, distribution or reproduction in other forums is permitted, provided the original author(s) and the copyright owner(s) are credited and that the original publication in this journal is cited, in accordance with accepted academic practice. No use, distribution or reproduction is permitted which does not comply with these terms.
*Correspondence: Alessia Lodi, alessialodi@utexas.edu; Andrew J. Brenner, dr_brenner@yahoo.com