 Clara Perrone1,2†
 Silvia Pomella1†
 Matteo Cassandri1,3†
 Michele Pezzella1‡
 Giuseppe Maria Milano1‡
 Marta Colletti1‡
 Cristina Cossetti1
 Giulia Pericoli1
 Angela Di Giannatale1
 Emmanuel de Billy1
 Maria Vinci1
 Stefania Petrini4
 Francesco Marampon3
 Concetta Quintarelli1,5
 Riccardo Taulli6
 Josep Roma7
 Soledad Gallego7
 Simona Camero8
 Paolo Mariottini2
 Manuela Cervelli2
 Roberta Maestro9
 Lucio Miele10
 Biagio De Angelis1
 Franco Locatelli1,11
 Rossella Rota1*
- 1Department of Hematology and Oncology, Cell and Gene Therapy, Bambino Gesù Children’s Hospital, IRCCS, Rome, Italy
- 2Department of Science, “Department of Excellence 2018-2022”, University of Rome “Roma Tre”, Rome, Italy
- 3Department of Radiotherapy, Sapienza University, Rome, Italy
- 4Confocal Microscopy Core Facility, Bambino Gesù Children’s Hospital, IRCCS, Rome, Italy
- 5Department of Translational Medical Sciences, University of Naples Federico II, Naples, Italy
- 6Department of Oncology, University of Torino, Torino, Italy
- 7Group of Translational Research in Child and Adolescent Cancer, Vall d’Hebron Research Insti-tute-Universitat Autònoma de Barcelona, Barcelona, Spain
- 8Department of Maternal, Infantile and Urological Sciences, Sapienza University of Rome, Rome, Italy
- 9Unit of Oncogenetics and Functional Oncogenomics, Centro di Riferimento Oncologico di Aviano (CRO Aviano) IRCCS, National Cancer Institute, Aviano, Italy
- 10Department of Genetics and Stanley S. Scott Cancer Center, Louisiana State University Health Sciences Center, New Orleans, LA, United States
- 11Department of Pediatrics, Sapienza University, Rome, Italy
Rhabdomyosarcoma (RMS) is a pediatric myogenic soft tissue sarcoma. The Fusion-Positive (FP) subtype expresses the chimeric protein PAX3-FOXO1 (P3F) while the Fusion-Negative (FN) is devoid of any gene translocation. FP-RMS and metastatic FN-RMS are often unresponsive to conventional therapy. Therefore, novel therapeutic approaches are needed to halt tumor progression. NOTCH signaling has oncogenic functions in RMS and its pharmacologic inhibition through γ-secretase inhibitors blocks tumor growth in vitro and in vivo. Here, we show that NOTCH signaling blockade resulted in the up-regulation and phosphorylation of the MET oncogene in both RH30 (FP-RMS) and RD (FN-RMS) cell lines. Pharmacologic inhibition of either NOTCH or MET signaling slowed proliferation and restrained cell survival compared to control cells partly by increasing Annexin V and CASP3/7 activation. Co-treatment with NOTCH and MET inhibitors significantly amplified these effects and enhanced PARP1 cleavage in both cell lines. Moreover, it severely hampered cell migration, colony formation, and anchorage-independent growth compared to single-agent treatments in both cell lines and significantly prevented the growth of FN-RMS cells grown as spheroids. Collectively, our results unveil the overexpression of the MET oncogene by NOTCH signaling targeting in RMS cells and show that MET pathway blockade sensitizes them to NOTCH inhibition.
Introduction
Rhabdomyosarcoma (RMS) is the most frequent soft tissue sarcoma of childhood that includes two major histological subtypes: embryonal and alveolar (1). About 80% of alveolar RMS shows chromosomal translocations that result in the expression of the oncogenic chimeric transcription factors (TFs) PAX3-FOXO1 or PAX7-FOXO1 (Fusion-Positive, FP) (1–3). The remaining alveolar and embryonal RMSs are Fusion-Negative (FN) and show chromosomal aberrations and often RAS mutations (3–5). Despite the improvement in the response to multimodal therapy, the prognosis for FP-RMS and metastatic FN-RMS remains dismal (1, 6), suggesting that novel therapeutic approaches are needed to halt the emergence of drug resistance. As a pediatric cancer, RMS shows a low mutational burden suggesting that de-regulation of pathways driving embryonal development, rather than gene mutations, strongly contribute to the pathogenesis (4, 7). As a matter of fact, RMS cells are thought to derive from mesenchymal progenitors of the skeletal muscle lineage that, despite the expression of the master muscle TFs such as MYOD and MYOG, are unable to differentiate and proliferate indefinitely. In line with this, we and others have demonstrated the involvement of regulators of embryonal tissue differentiation in RMS pathogenesis including the Polycomb proteins EZH2 (8, 9) and BMI1 (10), the Hippo (11–13), Hedgehog [ (14); and reviewed in (15)] and NOTCH pathways (16–18).
NOTCH signaling is an evolutionarily conserved pathway that crucially regulates cell fate during embryonal development balancing cell proliferation, differentiation, and survival [reviewed in (19)]. Human cells harbor four NOTCH genes located on different chromosomes, NOTCH1-4 [reviewed in (20)]. The NOTCH paralogues are surface membrane receptors involved in cell-to-cell communication that, once bound by their specific ligands of the Delta-like (DLL1, 3, and 4) and Serrate/Jagged (JAG1 and 2) families on the membrane of neighboring cells, are subjected to sequential proteolytic cleavages. The latter is made in the transmembrane domain by the multisubunit protease γ-secretase to release a NOTCH Intracellular Domain (ICD). Then, from the cytoplasm, NOTCH (N)ICD migrates into the nucleus where it binds the DNA-binding transcription factor CSL/RBP-Jk (CBF1/RBPj/Su (H)/Lag-1) and the mastermind-like proteins (MAML1-3) displacing the co-repressor complex and allowing the transcription of canonical NOTCH target genes of the basic helix-loop-helix (bHLH) Hes (HES1-7) and Hey (HEY1, 2, L) families of transcriptional repressors [reviewed in (20)]. Moreover, NOTCH pathway also has non-canonical functions that are still under investigation (21). Notably, NOTCH functions are strictly context- and tissue-dependent and often paralogue-specific [reviewed in (20)].
NOTCH pathway functions are deregulated in different types of hematological and solid tumors and the inhibition of NOTCH signaling through inhibitors of γ-secretase or monoclonal antibodies against specific NOTCH receptors are being evaluated in clinical settings [reviewed in (20)].
The role of NOTCH signaling during myogenesis is crucial in defining skeletal muscle fate and in promoting muscle stem cell expansion and migration [reviewed in (22–27)]. We and others have recently demonstrated that NOTCH signaling components are up-regulated and the pathway hyper-activated in RMS and that its blockade through genetic silencing or γ-secretase inhibitors leads to cell differentiation and cell cycle arrest in vitro and halts tumor growth in vivo (16, 28, 29). These findings suggest potential therapeutic value for an anti-NOTCH approach in RMS. However, clinical studies showed that treatment with agents targeting single molecules can fail due to the emergency of drug resistance and co-inhibition of multiple therapeutic targets is pursed as a strategy to give a durable clinical responses [reviewed in (28–30)].
NOTCH signaling has been reported to transcriptionally block the expression of the MET proto-oncogene in breast cancer cells (31). MET is a cell membrane-spanning receptor with tyrosine kinase activity [reviewed in (32)], which is induced by PAX3 during skeletal muscle tissue development (33) and by PAX3-FOXO1 in RMS (34). Its activation by the HGF ligand is needed in the early myogenic phases for myoblasts migration and proliferation and its expression is quickly down-regulated during the late myogenesis (35–37). MET signaling is often deregulated in cancer by over-activation, gene amplification and/or mutation, and supports tumorigenesis and metastases and drug resistance [reviewed in (38, 39)].
In RMS, MET has been shown to be over-expressed, amplified and correlated to poor prognosis in patients, and MET signaling hyper-activated and oncogenic (40–44). In line, pharmacologic or genetic inhibition of MET decreases RMS cell proliferation and migration in vitro and tumor growth and metastasis formation in vivo (45–48).
Therefore, based on this, here we evaluated whether the inhibition of NOTCH signaling affects MET expression/activation in RMS. Our findings show that genetic or pharmacologic NOTCH inhibition leads to MET up-regulation and activation in RMS cell lines known to be sensitive to NOTCH depletion, regardless of the presence of the fusion protein. In agreement, co-inhibition of NOTCH and MET signaling significantly enhanced growth inhibition and cell death of RMS cells compared to single treatments. Moreover, co-treatment with NOTCH inhibitors (NOTCHi) and MET inhibitors (METi) further limited the tumorigenic properties of RMS cells in vitro compared to each agent alone.
Altogether, our findings show that targeting NOTCH pathway in RMS could activate and up-regulate MET with a mechanism that needs to be clarified in future studies. They also suggest that MET inhibition could be a strategy to boost the effects of NOTCH blockade in this tumor.
Materials and Methods
Cell Culture and Reagents
RH30 and RH4 (PAX3-FOXO1 expressing alveolar RMS, fusion positive), and RD and JR1 (embryonal RMS, fusion negative) cell lines were gifts from Dr. Peter Houghton. Several first passage aliquots of each cell line were stored in liquid nitrogen for subsequent assays. Each aliquot was passaged for a maximum of 4 months. Cell lines were authenticated by genotyping. RH30 and RH4 cells were cultured in RPMI 1640 and RD and JR1 cells in DMEM high-glucose (Invitrogen, Carlsbad, CA, USA), both supplemented with 10% FBS, 1% L-glutamine, and 1% penicillin-streptomycin. Cells were cultured at 37°C in a humidified atmosphere of 5% CO2/95% air. All cell lines were routinely tested for Mycoplasma at the beginning of culture of each aliquot and then each two months.
Drugs
PF-03084014 (Nirogacestat, #S8018), ARQ197 (Tivantinib, #S2753), EMD-1214063 (Tepotinib, # S7067), SU11274 (#S1080) were purchased from Selleckchem (www.selleckchem.com). BMS-777607 (CT-BMS777) and Cabozantinb (CT-XL184) were purchased from ChemieTek (Indianapolis, IN, USA). GSI-XII (Z-Ile-Leu-aldehyde, HY-12465) was purchased from MedChemExpress (Monmouth Junction, NJ, USA). All compound were dissolved in DMSO to a final concentration of 10 mmol/L.
Determination of the IC50 and Cell Proliferation Assay
RH4, RH30, RD and JR1 cells were seeded on 384-well plates in 10% FBS-containing RPMI-1640 or DMEM high-glucose media and after 24h were treated with decreasing doses of each drug (PF-03084014 (40 µM-0.195 nM), GSI-XII (40 µM-0.195 nM), ARQ-197 (3 µM-0.0015 nM), BMS-907351 (10 µM-0.005 nM), SU-11274 (40 µM-0.195 nM), BMS-777607 (40 µM-0.195 nM), EMD-1214063 (40 µM-0.195 nM)) or with DMSO. Cells were plated to achieve 20% confluence at the time of drug treatment (1.2x10³/well) and monitored until 72h, when control (DMSO-treated) wells reached ~90% confluence. IC50 values were calculated 72h post treatment using the GraphPad™ Prism version 8. For proliferation experiments, were seeded on 96-well plates (3000 cells/well) and, after 24h (t0), new media containing DMSO or the drugs at the selected concentrations were added to the wells. The percentage of cell confluence was quantified under phase contrast every 24h using the Celigo Image Cytometer (Nexcelom Bioscience, Lawrence, MA, USA). Seventy-two hours post-treatment, RH30 and RD cells were stained with Calcein AM and Propidium Iodide (PI) and the percentage of Calcein- and PI-positive cells was quantified using Celigo Image Cytometer (Nexcelom Bioscience, Lawrence, MA, USA).
siRNA Transfection
Cells were transfected with 100nM (final concentration) siRNAs against human NOTCH1 (SASI_Hs01_00052328), human NOTCH3 (SASI_ Hs01_00101285) or a non-targeting siRNA as control (SIC001) (Sigma, St Louis, MO, USA) using Oligofectamine (Invitrogen, Carlsbad, CA), according to the manufacturer’s recommendations. Twenty-four hours later, the medium was replaced with fresh complete growth medium and transfected cells were harvested at different time points.
RNA Isolation, cDNA Synthesis and Real-Time qPCR
Total RNA was extracted using TRIzol (Invitrogen, Carlsbad, CA, USA) according to the manufacturer’s protocol. RNA concentration was quantified using a NanoDrop® 1000 Spectrophotometer (ThermoFisher Scientific). Reverse transcription was performed using the Improm-II Reverse Transcription System (Promega, Madison, WI, USA). The expression levels were measured by qRT-PCR for the relative quantification of the gene expression as described (49). TaqMan gene assay (Applied Biosystems, Life Technologies, Carlsbad, CA, USA) for MET (Hs01565584_m1), NOTCH1 (Hs01062014_m1), NOTCH3 (Hs01128541_m1), HES1 (Hs00172878_m1) were used. Values were normalized according to the glyceraldehyde-3-phosphate dehydrogenase (GAPDH) mRNA (Hs99999905_m1) levels. The QuantStudio 3 Real-Time PCR System (Applied Biosystems) was used for the measurements. The expression fold change was calculated by the 2-ΔΔCt method for each of the reference genes (49).
Western Blot
Western blotting was performed on whole-cell lysates by homogenizing cells in RI-PA lysis buffer (50 mM Tris pH 7.4, 150 mM NaCl, 1% Triton X-100, 1 mM EDTA, 1% sodium deoxycholate, 0.1% SDS), containing the protease inhibitor cocktail (Sigma, St Louis, MO, USA), NaF 1mM, Na3VO4 1mM and PMSF 1mM. Lysates were incubated on ice for 30 minutes (min) and centrifuged at 12,000xg for 20 min at 4°C. Supernatants were used as total lysates. Protein concentrations were estimated with the BCA protein assay (Pierce, Rockford, IL), according to the manufacturer’s protocol. The proteins (40 μg) were boiled in reducing SDS sample buffer (200 mM Tris–HCl pH 6.8, 40% glycerol, 20% β-mercaptoetanol, 4% sodium dodecyl sulfate, and bromophenol blue), and run on 8% SDS-polyacrylamide gels. Then, the proteins were transferred to Hybond ECL membranes (Amersham, GE HEALTHCARE BioScience Corporate Piscataway, NJ, USA). Membranes were blocked in 5% non-fat dried milk in Tris-buffered saline (TBS) for 1h and incubated overnight (ON) with the appropriate primary antibody at 4°C. After incubation, membranes were washed in TBS and incubated with the appropriate secondary antibody for 1h at room temperature (RT). Detection was performed by Pierce™ ECL Western Blotting Substrate (Thermo Scientific™) or Western Lightning ECL Pro (PerkinElmer, Waltham, MA, USA). Antibody against MET (sc-10) was from Santa Cruz Biotechnology Inc., (Santa Cruz, CA, USA); NOTCH1 (bTAN 20) was from Developmental Studies Hybridoma Bank (DSHB, University of Iowa, Iowa City, IA, USA); α-Tubulin (NB100-92249) was from Novus Biologicals (Littleton, CO, USA); β-ACTIN (A2066) was from Sigma-Aldrich (St Louis, MO, USA); NOTCH3 (PAB-10683) was from Orbigen Inc. (Orbigen, San Diego, CA, USA). Antibodies against Cleaved NOTCH1 (Val1744) #4147), Phospho-MET (Tyr1234/1235) (#3077), PARP1 (#9542), p21Cip1 (#2947); GAPDH (#5174) and all secondary antibodies were obtained from Cell Signaling Technology (Beverly, MA, USA). All antibodies were used in accordance with the manufacturer’s instructions.
Caspase Activity Assay
Cells were seeded into 96-well black, flat bottom plates at a density of 5000 cells per well and incubated for 24h to allow cell surface adhesion. Twenty-four hours after the cell seeding, the cells were treated with DMSO, PF-03084014, and ARQ-197 for 24h. The activity of Caspase-3/7 was determined with a Caspase-Glo-3/7 assay (Promega Company, Madison, WI, USA), according to the manufacturer’s protocol, using the EnSpire® Multimode Plate Reader (PerkinElmer, Waltham, MA, USA).
Annexin V Determination
Cells were seeded into 6-well plates (120.000 cells/well) and treated with DMSO, PF-03084014, and ARQ197 for 48h. After treatment, cells were harvested and cells suspension were incubated with PE-conjugated Annexin V and 7-Aminoactinomycin D (7-AAD) in binding buffer for 15 min in the dark, using Annexin V apoptosis detection kit (BD Pharmingen, San Diego, CA, USA), according to manufacturer’s recommendations. Cells were analyzed using FACS CantoII equipped with a FACSDiva 6.1 CellQuest software (Becton Dickinson Instrument, San Josè, CA, USA).
Immunofluorescence
RH30 and RD cells were fixed after 8 and 24 hours of either vehicle, each drug alone, or combination treatment in 4% paraformaldehyde (PFA)/PBS for 15 min at RT, permeabilized in 0.2% Triton X-100/PBS for 5 min at RT and incubated with either rabbit phospho-MET (Tyr1234/1235) (#3077 from Cell Signaling Technology, (CST) Danvers, MA, USA) and rabbit MET (sc-10 from Santa Cruz Biotechnology, Inc., Heidelberg, Germany) in 1% BSA/PBS. Alexa-488 goat α-rabbit (Invitrogen, Carlsbad, CA, USA) was used as secondary antibody. Cells were counterstained with DAPI and imaged using the Olympus microscope FV3000 with Olympus FV315S-SW image acquisition software. Images were processed by Adobe Photoshop. The intensity average of phospo-MET and MET fluorescences were calculated using FV315S-SW software, from cytometric measurements relative to total cell area in 5 digital images randomly selected and analyzed for each immunostained cellular sample. From 80 to 100 cells were counted for each sample analyzed.
Cell Migration Assay
Cells were seeded at 100% of confluence in medium supplemented with 10% FBS on 96-well plate using Oris Cell Migration Assay Kit (#CMA1.101) (Platypus Technologies, Madison, WI, USA). The day after, stoppers were removed and cells were cultured in 2% FBS for 24h. Analysis of cell migration into the detection zone was performed after fixing and staining with Diff-Quick® (Medion Diagnostic AG460.053, Switzerland). The images were taken using the Leica DMi8 with LAS X Navigator image acquisition software.
Colony Formation Assay
Cells were seeded at the density of 103/well in 6-well plates with 2 mL of complete growth medium. Medium with drug was replaced 24h post seeding. After 14 days cells were fixed, stained with Diff-Quik® (Medion Diagnostic AG460.053, Switzerland) following the manufacturer’s instructions and the colonies containing >50 cells counted.
Soft Agar Colony Formation Assay
Cells were assayed for their capacity to form colonies in soft-agar, as described (50). Cells (104/well) were suspended in complete growth media containing 0.5% Agar (NuSieve GTG Agarose, Lonza, Rockland, ME, USA). Then, they were seeded on a layer of 1% Agar in complete growth media in 6-well plates. Medium with drug was replaced 24h post seeding and refreshed every 2 days. After 14 days the colonies were counted by microscopic inspection and images were acquired with a Leica DMi8 with LAS X Navigator image acquisition software.
Spheroid Generation and Image Acquisition
For 3D tumor spheroids assessment cells were seeded in 100 µl of complete growth media on 96 Ultra-Low Attachment plates (ULA, #7007) (CORNING, New York, NY, USA) to obtain tumor spheroids of 300 µm diameter in 96h. After 72h of drug treatments, diameter was measured by Celigo image cytometer (Nexcelom Bioscience, Lawrence, MA, USA). Then, after 2 or 3 days of treatment, 3D tumor spheroids were stained using PI (1 mg/ml final concentration), Calcein AM (1 mM final concentration) and Hoechst (1:10000). Image capture and analysis were performed using Celigo image cytometer (Nexcelom Bioscience, Lawrence, MA, USA).
Statistical Analysis
Results were expressed as the mean ± standard deviation (SD) calculated on three independent experiments, unless mentioned otherwise. P values were calculated using two-tailed Student’s t-test (comparison between two groups) and two-way ANOVA (multiple group comparison). Only the variations with a statistical significance (P) <0.05 were considered significant and reported on the related figure legends. Statistical analysis was performed using GraphPad Prism version 8 (GraphPad Software; www.graphpad.com).
Results
NOTCH Signaling Inhibition Drives MET Activation in RMS Cells
In order to evaluate whether MET levels are modulated after NOTCH signaling inhibition, we silenced NOTCH1 and NOTCH3, the two NOTCH receptors hyper-activated in our cell tumor context (16–18), in two FP-RMS (RH30 and RH4) and two FN-RMS (RD and JR1) cell lines. As shown in Figure 1A, MET protein levels [reviewed in (32)] were up-regulated after 48 hours (48h) of NOTCH1 and NOTCH3 depletion in all four cell lines compared to control siRNA cells. Even if MET transcript levels were increased by NOTCH1 knockdown (KD) in three of four cell lines, the modulation did not reach the statistical significance (Figure S1A). These results suggest that MET is indirectly down-regulated by NOTCH signaling in RMS cells.
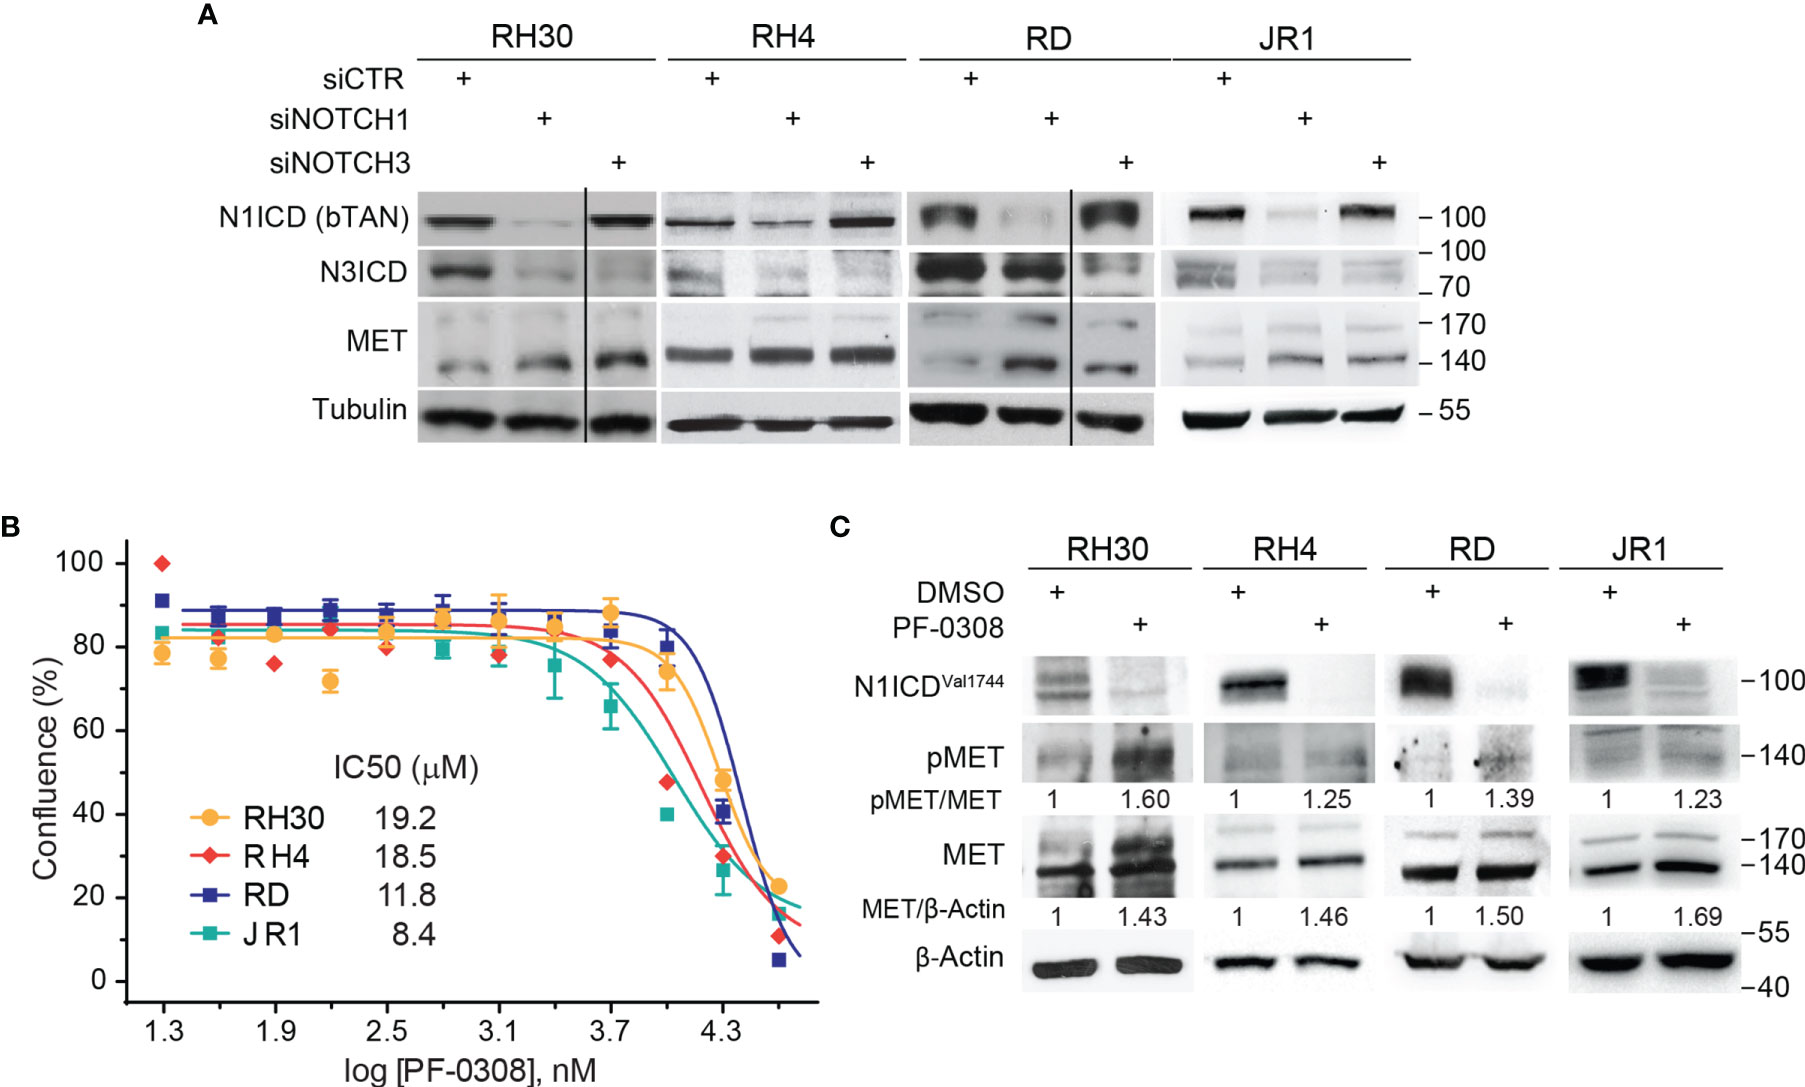
Figure 1 NOTCH signaling inhibition drives MET up-regulation and activation in RMS cells. (A) Representative (n=3 independent biological replicates) Western Blot depicting the effect of NOTCH1 and NOTCH3 silencing on MET protein levels in FP-RMS (RH30, RH4) and FN-RMS (RD, JR1) cells. Cells were harvested 48h post-transfection and the protein levels of the intracellular cleaved domain (ICD) of NOTCH1 and NOTCH3 (N1CD and N3ICD) were assessed (siCTR indicates the control siRNA sample). Migration of molecular weight markers is indicated on the right (kDa). Tubulin levels were used as loading control. (B) Dose-response curves of RH30, RH4, RD and JR1 cells treated with the NOTCH inhibitor PF-03084014 (PF-0308). Graph represents the mean of three independent experiment ± SEM. (C) Representative (n = 3 independent biological replicates) Western Blot of RH30 and RH4 cells treated with PF-03084014 (20 μM) for 48h and of RD and JR1 cells treated with PF-03084014 (10 μM) for 72h. The radiographs show total (MET) and activated/phosphorylated (pMET Y1234/1235) MET protein levels. N1ICDVal1744 levels have been used as treatment control and β-Actin as loading control. Migration of molecular weight markers is indicated on the right (kDa).
Then, we investigated whether pharmacologic inhibition of NOTCH signaling affected MET levels similarly. To this end, we used the γ-secretase inhibitor PF-03084014 (Nirogacestat), a pan-NOTCH inhibitor currently in advanced clinical development, which shows low toxicity in patients (www.clinicaltrials.gov Identifier NCT04195399) [reviewed in (20)], hereafter indicated as PF-0308. The drug affected cell proliferation of all four RMS cell lines 72h post-treatment in a µM range compared to vehicle (Figure 1B). MET modulation was molecularly investigated in response to PF-0308 used at 20 μM on RH30 and RH4 FP-RMS and 10 μM on RD and JR1 FN-RMS cells, respectively, throughout the study. Inhibition of NOTCH signaling by PF-0308 treatment was confirmed in four cell lines by the decrease of the levels of NOTCH1 cleaved intracellular domain (N1ICD), as revealed by the N1ICDVal1744-specific antibody, associated to the transcriptional down-regulation of the four canonical NOTCH target gene HES1 (Figure 1C and Figure S1B). PF-0308 treatment mirrored the effects of NOTCH1 and NOTCH3 gene silencing up-regulating the protein levels of total MET along with those of its activated form phosphorylated at the major phosphorylation site (pMETTyr1234-Tyr1235, hereafter indicated as pMET) (Figure 1C) in all RMS cell lines, while increased MET mRNA levels only in the two FN-RMS cell lines (Figure S1C). These results were confirmed on RH30 and RD cells using a different γ-secretase inhibitor, GSI-XII, already used in RMS (17), which also promoted MET up-regulation/phosphorylation in both cell lines (Figures S2A, B).
Altogether, these findings indicate that NOTCH signaling inhibition causes MET up-regulation and phosphorylation in RMS cells.
Pharmacologic Inhibition of NOTCH Signaling Halts RMS Cells Proliferation
Then, we functionally evaluated the effects on cell growth of NOTCH signaling inhibition by PF-0308 using the chosen doses of the compound. As reported in Figure 2A, cell proliferation of both RD and RH30 cells was significantly reduced 48h and 72h post-treatment compared to vehicle (DMSO)-treated (control) cells. Specifically, 72h post-treatment the reduction reached about 48 ± 1.9% in RH30 and 44 ± 1.5% in RD cells (Figure 2A). In agreement, 72h of treatment resulted in a significant decrease in the percentage of RH4 and JR1 cells when compared to vehicle-treated cells (53 ± 0.4% and 44 ± 5.8% reduction in RH4 and JR1 cells, respectively) (Figure S3A). Cell proliferation was also significantly reduced in RH30 and RD cells 72h after treatment with GSI-XII ruling out off-target effects of the PF-0308 (Figure S3B). At the molecular level, PF-0308 treatment markedly increased the expression of the Cyclin-Dependent Kinase (CDK) inhibitor p21Cip1, which is known to restrain cell proliferation, in all the cell lines (Figure 2B and Figure S7E) (18, 51, 52).
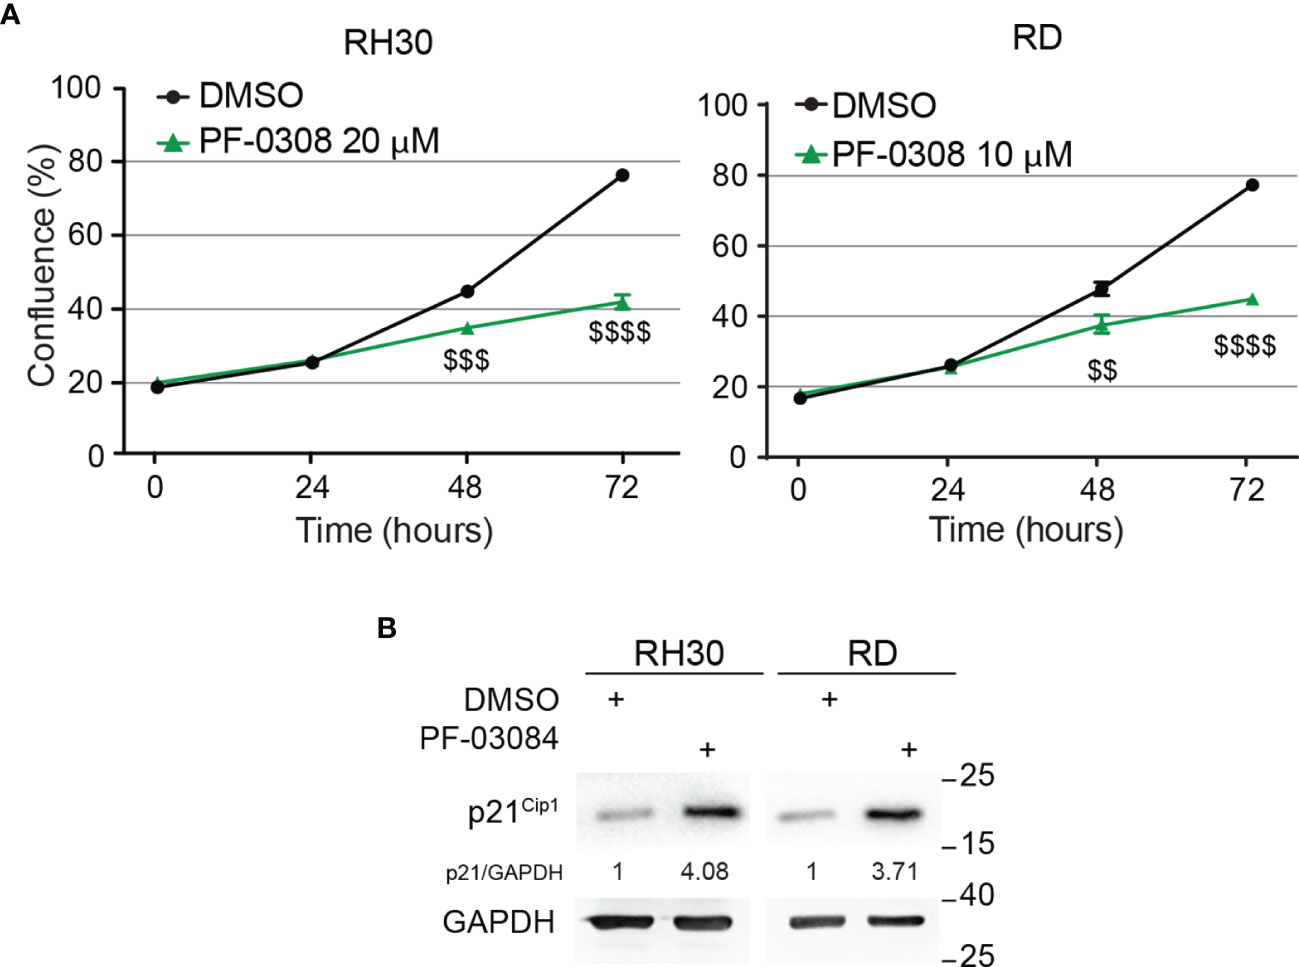
Figure 2 Pharmacologic inhibition of NOTCH signaling hampers RMS cells growth. (A) Growth-curve analysis of RH30 (left) and RD (right) cells treated with PF-03084014 (20 μM and 10 μM, respectively) for 24h, 48h and 72h. Graph represents the mean of three independent experiments ± SD, Student two-tailed T-Test. $$ P-value ≤ 0.01, $$$ P-value ≤ 0.001, $$$$ P-value ≤ 0.0001 for drug-treated vs vehicle-treated (DMSO) cells. (B) Representative radiographs showing p21Cip1 protein levels in RH30 and RD cells treated with PF-03084014 (20 μM for 48h and 10 μM for 72h, respectively). Migration of molecular weight markers is indicated on the right (kDa). GAPDH was used as loading control.
These findings indicate that pharmacologic inhibition of NOTCH signaling affects the ability of RMS cells to proliferate in vitro.
MET Inhibition Affects RMS Cells Proliferation
To identify a METi useful for a potential combinatorial approach with the NOTCHi, we tested, on RH30 and RD cells, five MET inhibitors with different mechanisms of action, some of which were already used in RMS cells (45–47) (Figure S4). ARQ-197 (Tivantinib), hereafter indicated as ARQ, was then chosen for the highest effects on cell growth at nM doses compared to vehicle-treated cells. As this MET inhibitor had never been tested on RMS cells, we evaluated whether it specifically targets MET. The decrease of phosphorylated MET levels observed in the four RMS cell lines demonstrated a specific MET targeting upon ARQ 400 nM treatment (Figure 3A and Figure S7D).
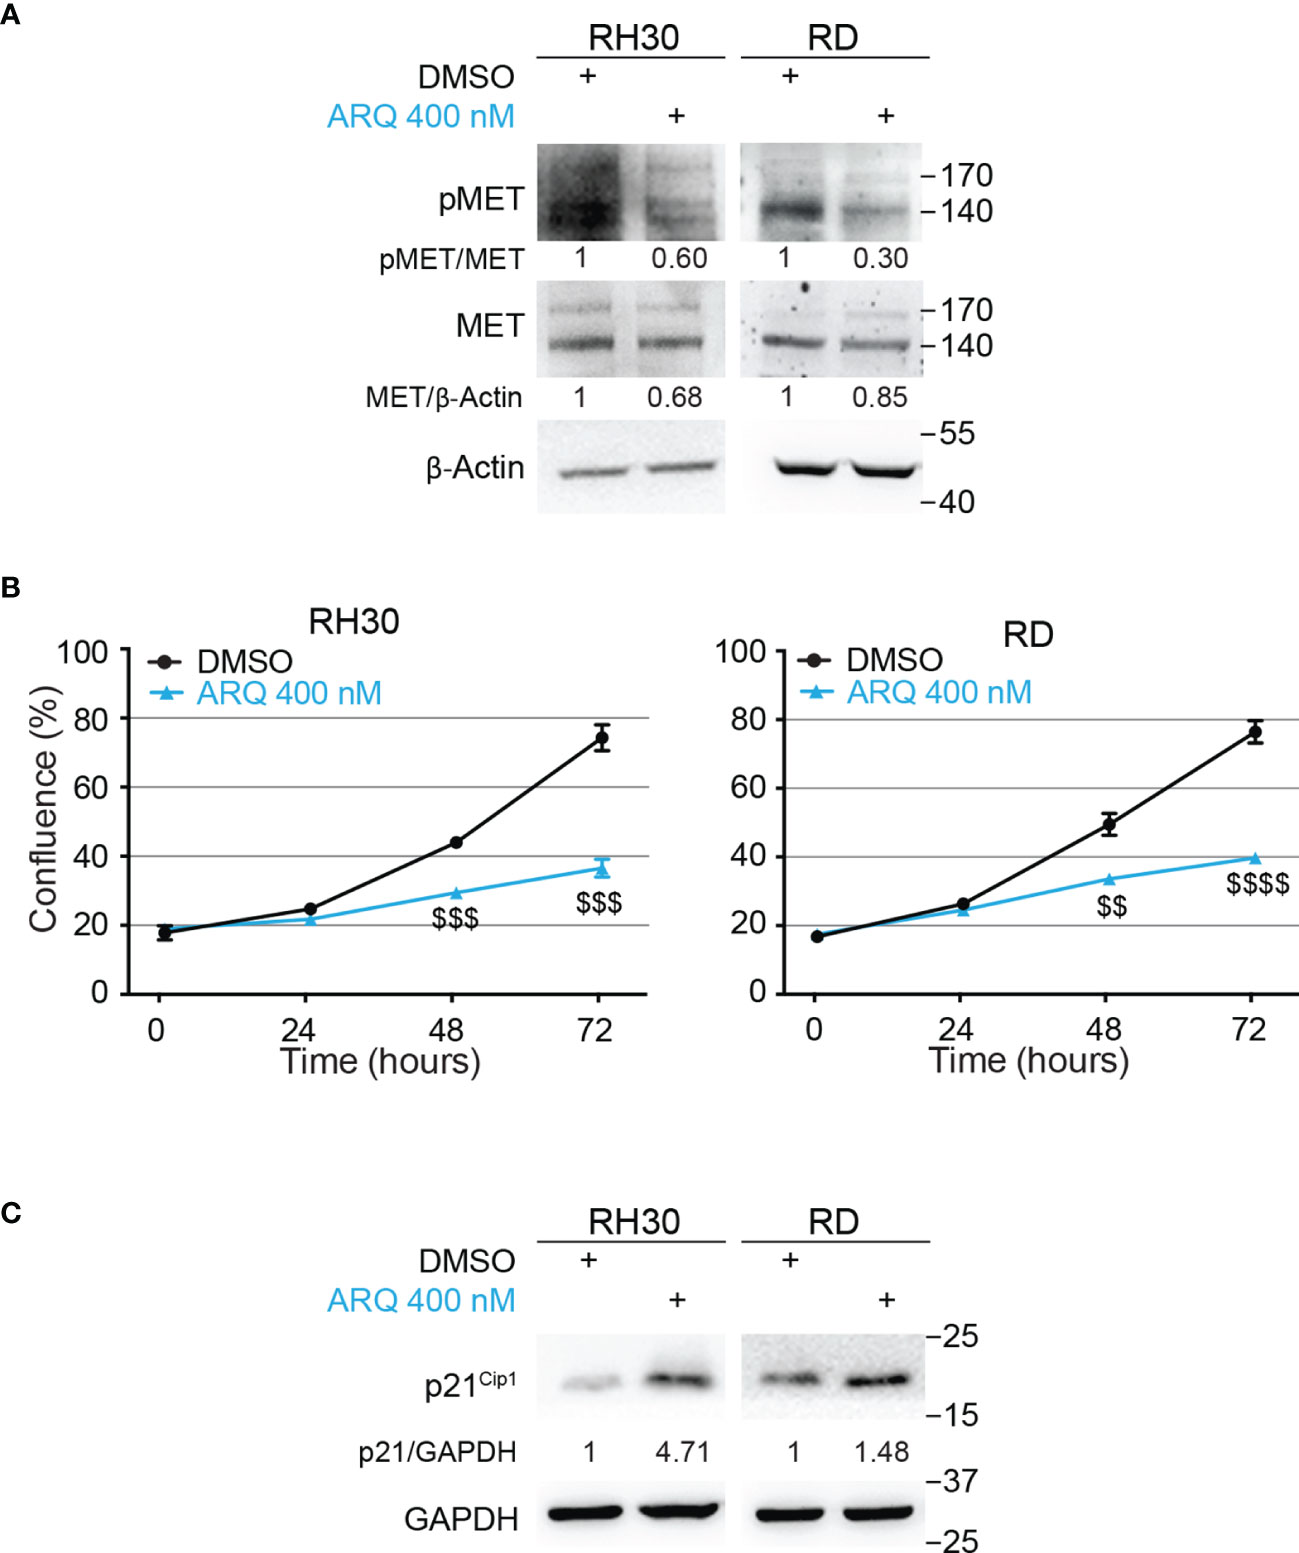
Figure 3 Pharmacologic inhibition of MET signaling causes RMS cells growth arrest. (A) Representative radiographs showing the effect of ARQ197 (ARQ 400 nM) on RH30 cells (48h) and RD cells (72h) on total and phosphorylated (pMETY1234/1235) MET protein levels. Migration of molecular weight markers is indicated on the right (kDa). β-Actin was the loading control. (B) Growth-curves of RH30 (left) and RD (right) cells treated with ARQ197 (ARQ 400 nM) for 24h, 48h and 72h. Graphs represent the mean of three independent experiments ± SD, Student two-tailed T-Test. $$ P-value ≤ 0.01, $$$ P-value ≤ 0.001, $$$$ P-value ≤ 0.0001 for drug-treated cells vs vehicle-treated (DMSO) cells. (C) Representative radiographs showing p21Cip1 protein levels in RH30 and RD cells treated with 400 nM of ARQ197 for 48h and 72h, respectively. Migration of molecular weight markers is indicated on the right (kDa). GAPDH was used as loading control.
Moreover, ARQ 400 nM significantly reduced cell proliferation 72h post-treatment in RMS cell lines compared to vehicle-treated cells (54 ± 2.6%, 41 ± 1.8%, 42 ± 3.0% and 33 ± 0.4% growth reduction in RH30, RD, RH4 and JR1 cells, respectively) (Figure 3B and Figures S5A, B). It also increased p21Cip1 protein levels (Figure 3C and Figure S7E).
Altogether, these findings suggest that the METi ARQ reduces MET phosphorylation and significantly affects RMS cell proliferation.
Combined Inhibition of NOTCH and MET Signaling Enhances RMS Cells Apoptosis
Then, we evaluated whether a combinatorial approach by simultaneously inhibiting both NOTCH and MET signaling could potentiate the effects of single treatments on RMS cells. To this end, RD and RH30 cells were treated with PF-0308 and ARQ as single agents or in combination. As shown in Figure 4A and Figure S6, the combination significantly slowed down cell proliferation 72h post-treatment in all the RMS cell lines compared to each treatment alone, with more marked effects in FP-RMS cells.
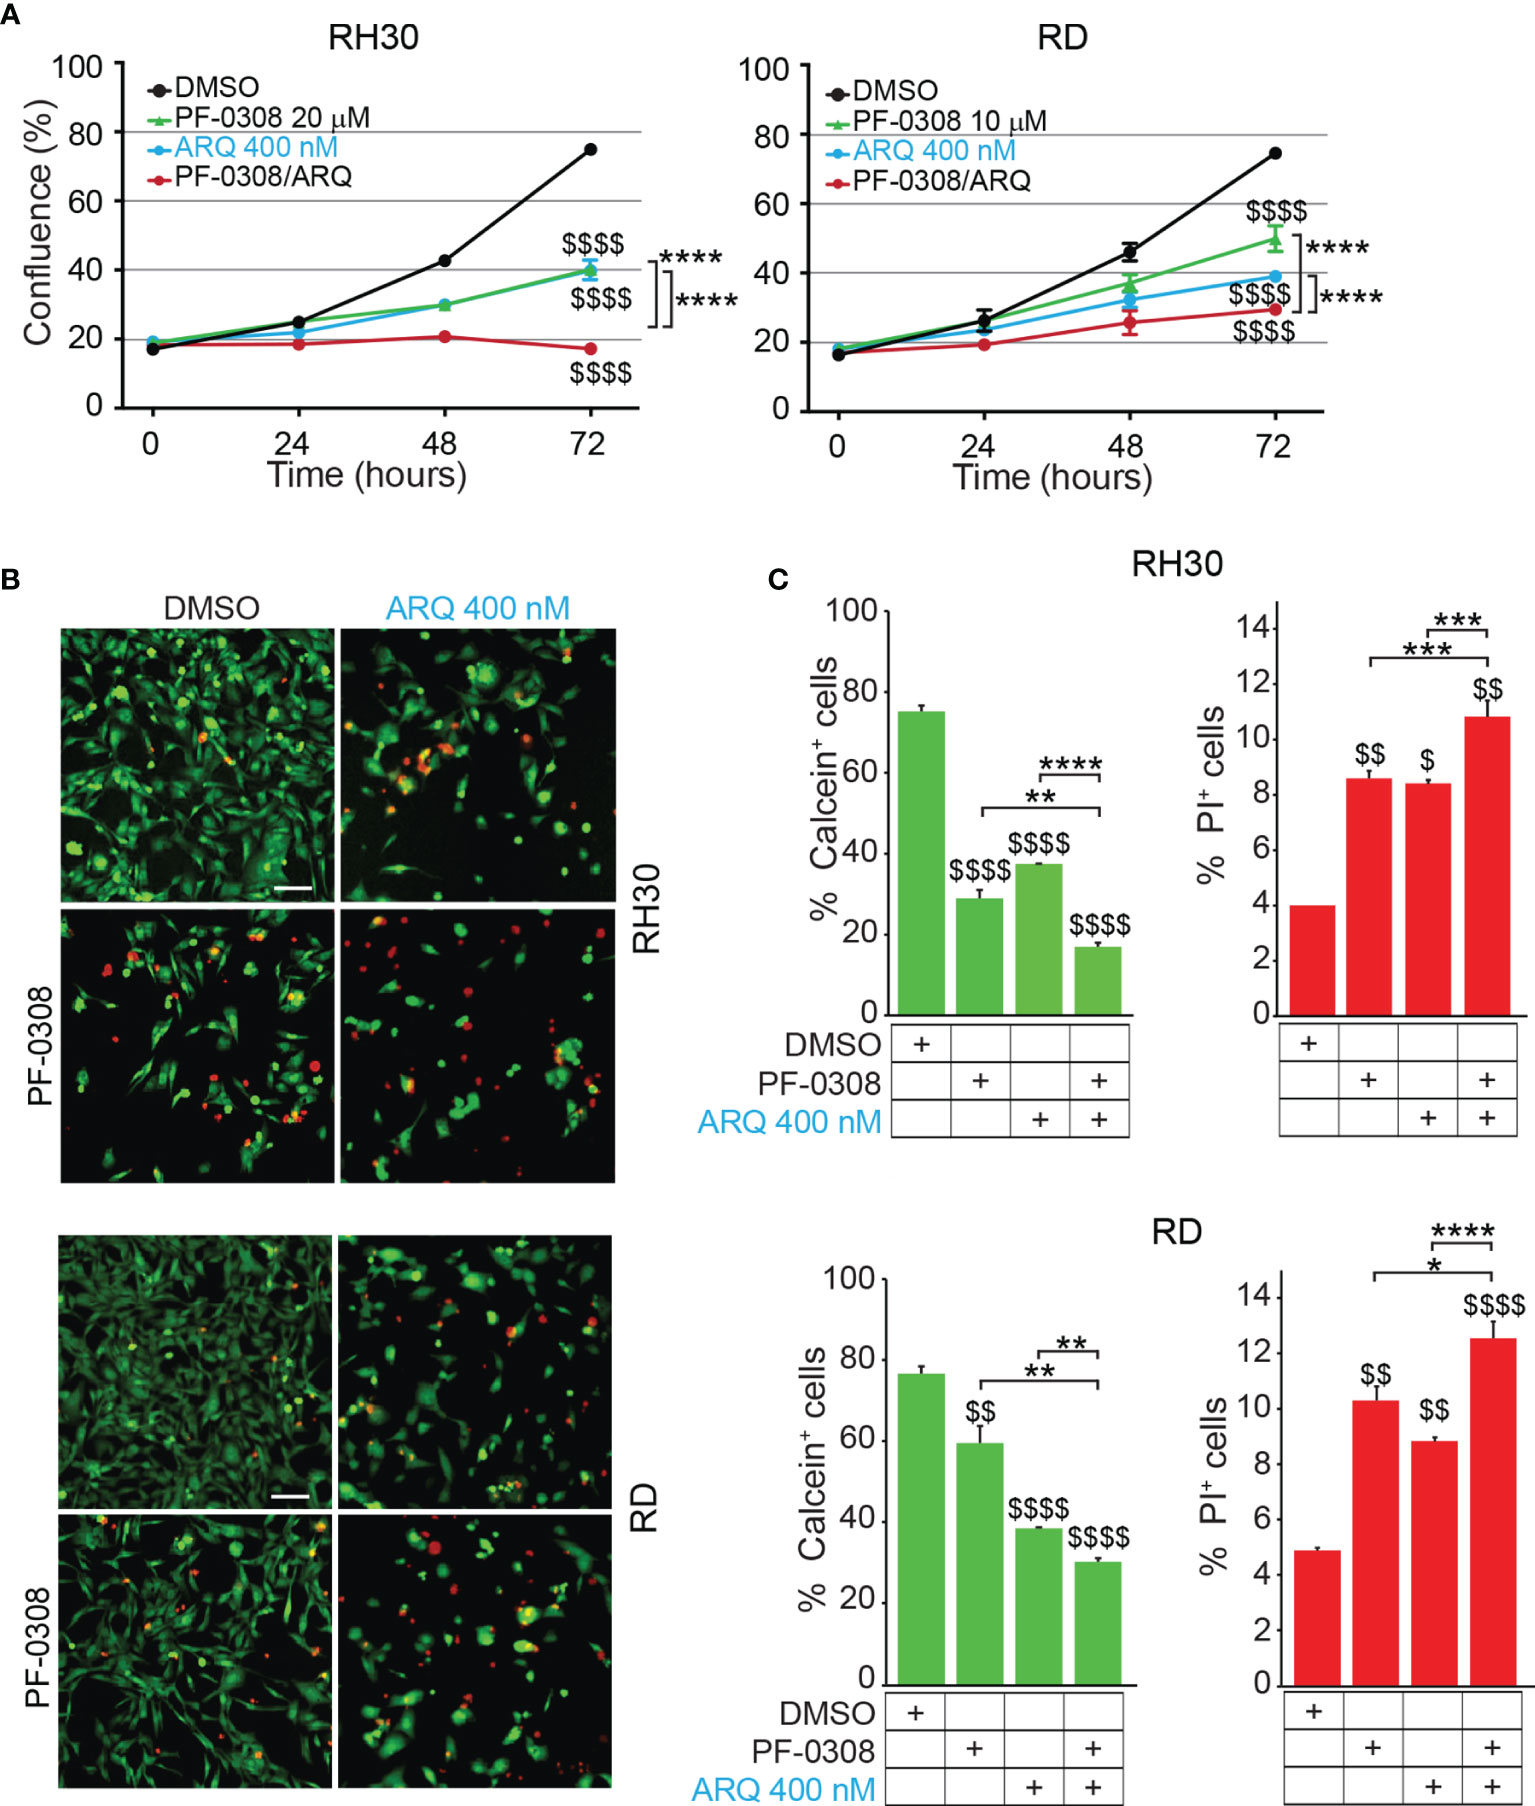
Figure 4 NOTCH and MET signaling co-inhibition hampers RMS cells growth and induces cell death. (A) Growth-curves of RH30 and RD cells treated for 24h, 48h and 72h with either 20 µM or 10 µM of PF-03084014, respectively, or 400 nM of ARQ197 or with the drug combination. Graphs represent the mean of three independent experiments ± SD, 2-way ANOVA test. $$$$ P-value ≤ 0.0001 for drug-treated vs vehicle-treated (DMSO) cells, and ****P-value ≤ 0.0001 for drug combination-treated cells vs single agents. (B) Representative images of Calcein AM (green: alive cells) and Propidium Iodide (PI; red: dead cells) staining of RH30 and RD cells treated for 72h with either 20 μM and 10 μM PF-03084014, respectively, or 400 nM of ARQ197 (ARQ 400 nM) or with the drug combination. Scale bars = 50 μm. (C) Histograms represent quantitative analysis of Calcein AM (green: alive cells) and Propidium Iodide (PI; red: dead cells) positive cells for RH30 and RD treated as in (B). Graphs represent the mean of three independent experiments ± SD, 2-way ANOVA test. $ P-value ≤ 0.05, $$ P-value ≤ 0.01, $$$$ P-value ≤ 0.0001 for drug-treated cells vs vehicle-treated (DMSO) cells, and *P-value ≤ 0.05, **P-value ≤ 0.01, ***P-value ≤ 0.001, ****P-value ≤ 0.0001 for drug combination-treated cells vs single agents.
In particular, the co-treatment resulted in a complete blockade of cell proliferation in RH30 cells (18.3 ± 0.5% and 17.2 ± 0.7% confluence at t0 and t72, respectively) (Figure 4A). In RD cells the drug combination resulted in ~62.0 ± 1.8% cell growth reduction compared to vehicle-treated cells (Figure 4A). Consistent with the reduction in cell confluence obtained with PF-0308 and ARQ as single agents, both inhibitors were able to decrease cell survival (percentage of Calcein-stained live cells) concomitantly increasing cell death (percentage of PI-stained dead cells) 72h post-treatment compared to cells treated with vehicle (Figures 4B, C). The drug combination further decreased cell survival and increased cell death in RH30 and RD cells vs single treatments (Figures 4B, C).
A very considerable decrease of cell growth in RH4 cells (83 ± 0.7% confluence) and a marked cell growth reduction reaching ~60 ± 4.3% in JR1 cells was also detected 72h post-treatment (Figure S6).
Then, we, evaluated whether the reduction in cell proliferation and the increase in PI-positive cells could be due to apoptotic cell death by measuring caspase 3/7 (CASP3/7) cell activity and Annexin V cell positivity, two markers of apoptosis. As shown in Figure 5A and Figure S7A, the drug combination significantly and markedly increased CASP3/7 activation in all the cell lines compared to each single agents, which individually were effective compared to vehicle. In line with these findings, the drug combination considerably increased Annexin V cell positivity compared to single treatments in all cell lines (Figures 5B, C and Figures S7B, C).
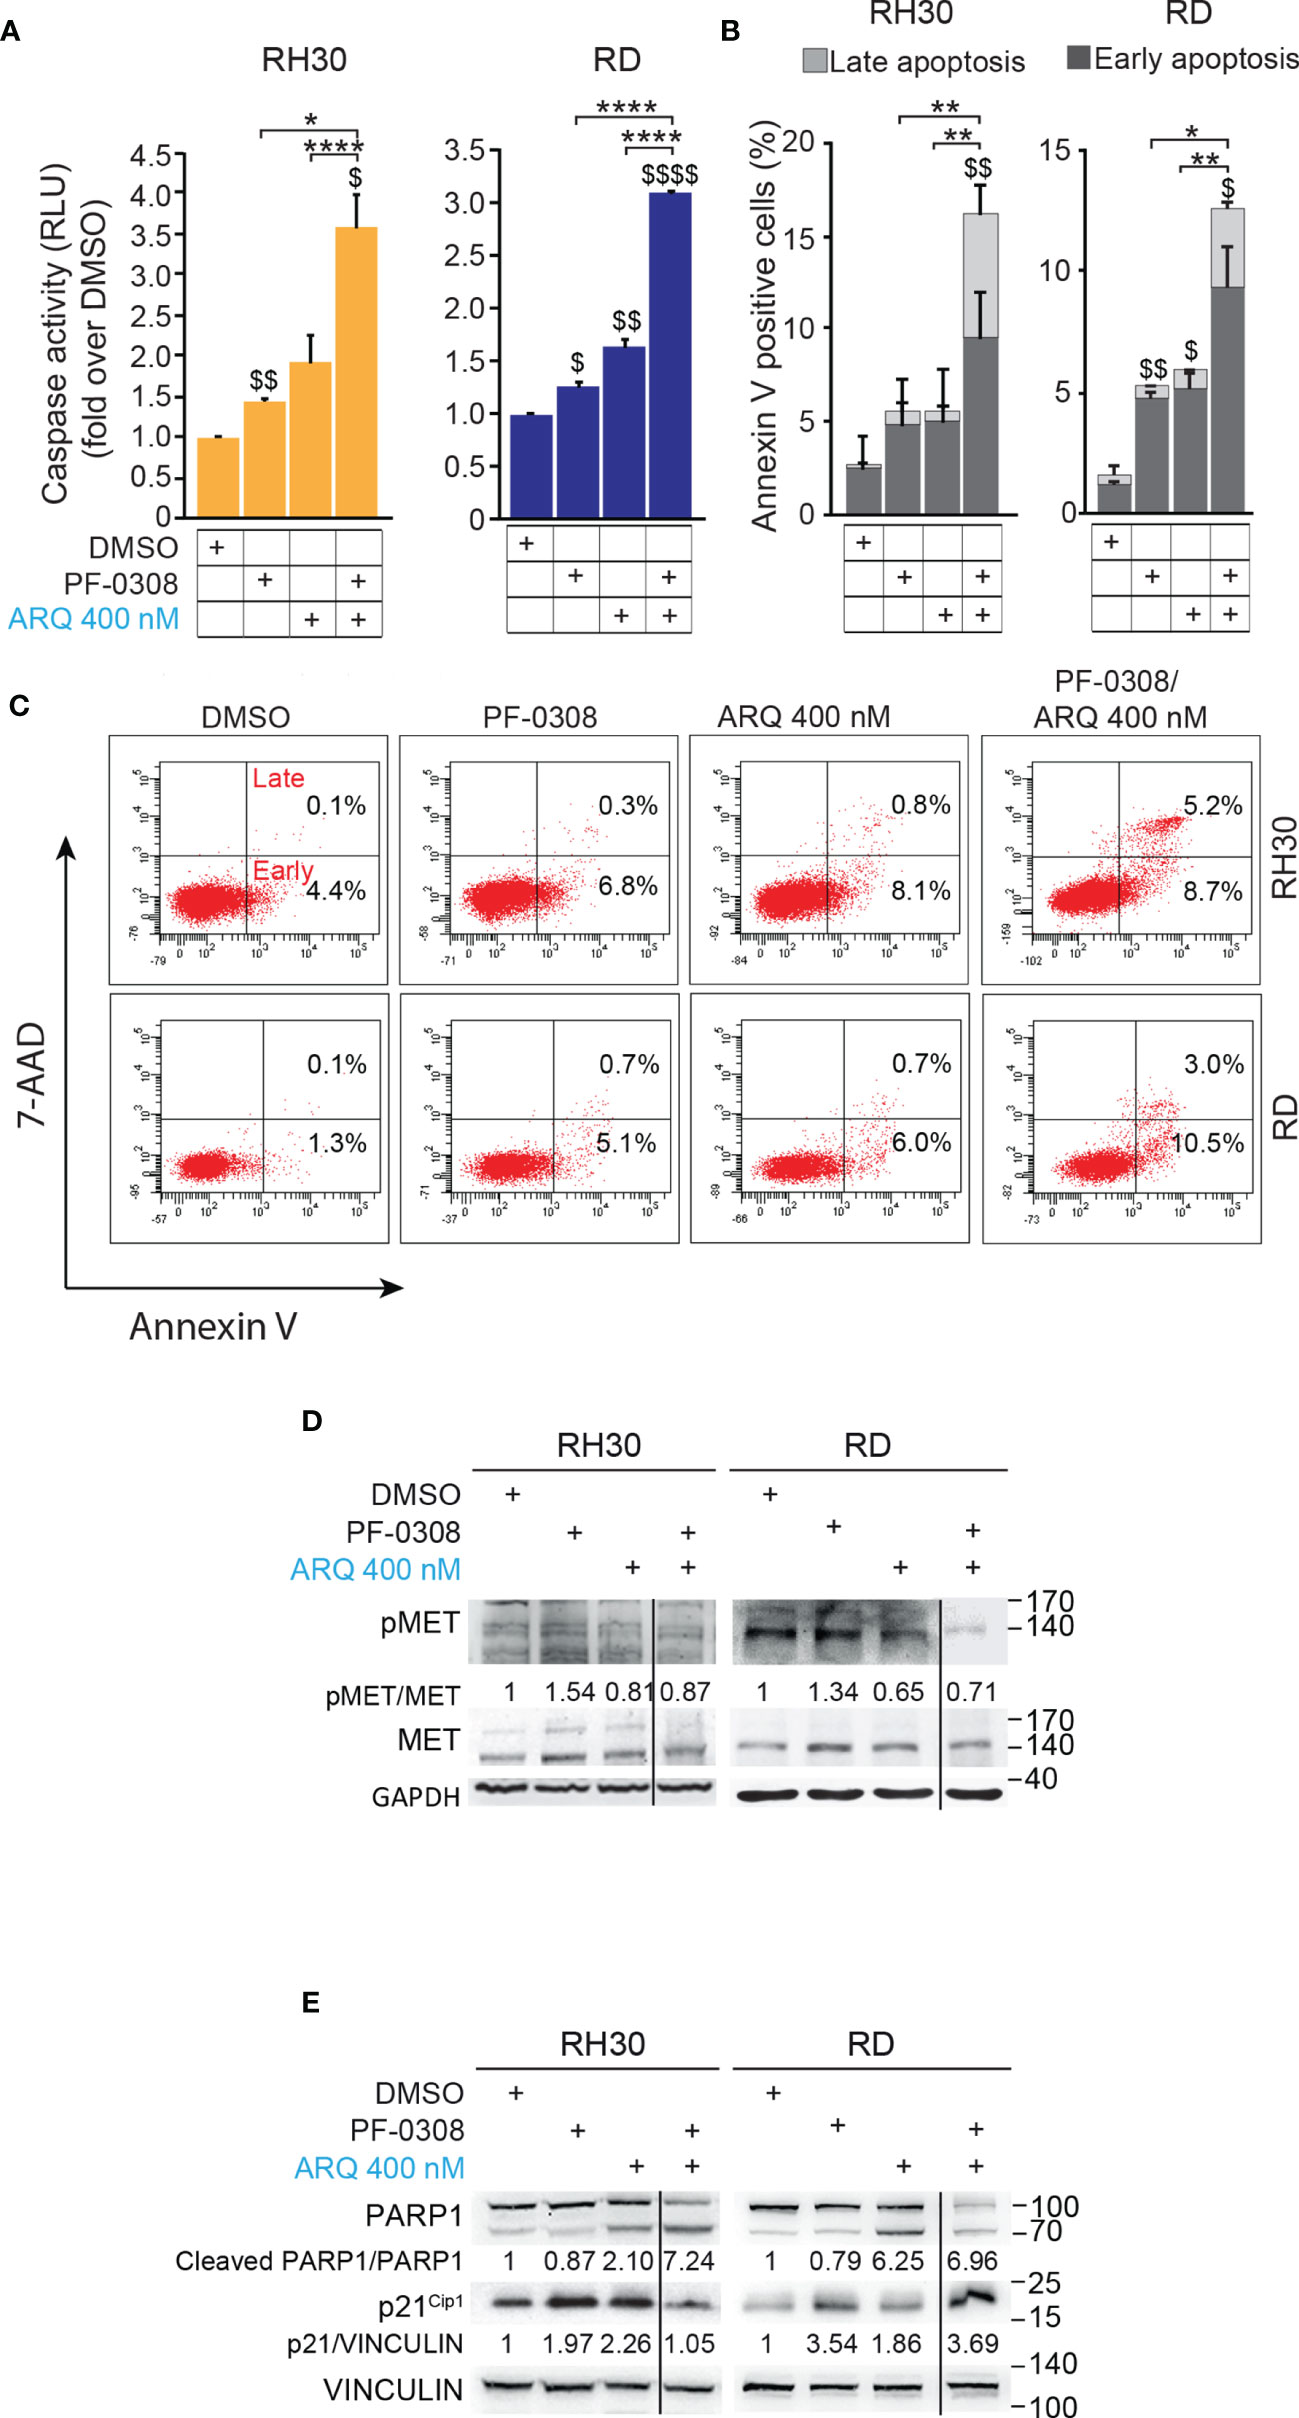
Figure 5 NOTCH and MET signaling co-inhibition induces caspase-dependent apoptosis. (A) Histograms depict Caspase-3/7 activity in RH30 and RD cells treated for 24h with either PF-03084014 (20 μM and 10 μM, respectively) or ARQ197 (400 nM) or with the drug combination. Graphs represent the mean of three independent experiments ± SD, 2-way ANOVA test. $ P-value ≤ 0.05, $$ P-value ≤ 0.01, $$$$ P-value ≤ 0.0001 for drug-treated cells vs vehicle-treated (DMSO) cells, and *P-value ≤ 0.05, ****P-value ≤ 0.001 for drug combination-treated cells vs single agents. (B) Graphs represent the mean of three independent experiments ± SD of Annexin V/7-AAD staining of RD and RH30 cells treated as in (A). $ P-value ≤ 0.05, $$ P-value ≤ 0.01 drug-treated cells vs vehicle-treated (DMSO) cells, and *P-value ≤ 0.05, **P-value ≤ 0.01 for drug combination-treated cells vs single agents, 2-way ANOVA test. (C) Representative cytofluorimetric plots showing Annexin V/7-AAD staining of RH30 and RD cells treated as in (A). Dot plots depict the percentage of Annexin-V/7-AAD single- and double-positive cells. (D) Representative radiographs of RH30 and RD cells treated with either PF-03084014 (20 μM for 48h and 10 μM for 72h, respectively) or ARQ197 (400 nM) or with the drug combination. Radiographs show total and phosphorylated (pMETY1234/1235) MET protein levels. Migration of molecular weight markers is indicated on the right (kDa). GAPDH was used as loading control. (E) Representative radiographs of RH30 and RD cells treated with either PF-03084014 (20 μM for 48h and 10 μM for 72h, respectively) or ARQ197 (400 nM) or with the drug combination. Radiographs show PARP1 and p21Cip1 protein levels were also showed. Migration of molecular weight markers is indicated on the right (kDa). VINCULIN was used as loading control.
Interestingly, the percentage of Annexin V-positive cells was significantly enhanced by both inhibitors as single agents in RH4 and RD cells compared to vehicle. On the other hand, Annexin V-positive cells were increased only by ARQ in JR1 cells and did not reach the significance after both individual treatments in RH30 cells (Figures 5B, C and Figures S7B, C).
At the molecular level, combined treatment counteracted the increase of phosphorylated pMET due to PF-0308 and maintained pMET levels lower than those of the vehicle in all four cell lines (Figure 5D and Figure S7D). These results indicated that the combination treatment was able to counteract MET activation due to NOTCH inhibition.
Moreover, PF-0308 did not affect cleaved PARP1 levels while ARQ treatment strongly promoted PARP1 cleavage compared to vehicle, which is more marked in RH30 and RD cell lines (Figure 5E and Figure S7E). The drug combination dramatically enhanced this effect compared to single ARQ treatment in RH30, JR1 and RH4 cells (Figure 5E and Figure S7E). Conversely, increased PARP1 cleavage due to drug combination in RD cells was similar to single ARQ treatment (Figure 5E). This suggests that, in RD cells, the levels of PARP1 cleavage by the combination relies mostly on ARQ in the used experimental conditions. Moreover, the levels of p21Cip1 were not significantly affected by the two combinations vs single agents in all cell lines (Figure 5E and Figure S7E). The effects of treatments on the expression and localization of pMET/MET were then investigated in RH30 and RD cells by immunofluorescence (IF). Figure 6A shows that the staining for MET phosphorylation in vehicle-treated cells was mainly localized in the cytoplasm in both cell lines and it was more marked in RH30 cells than in RD cells.
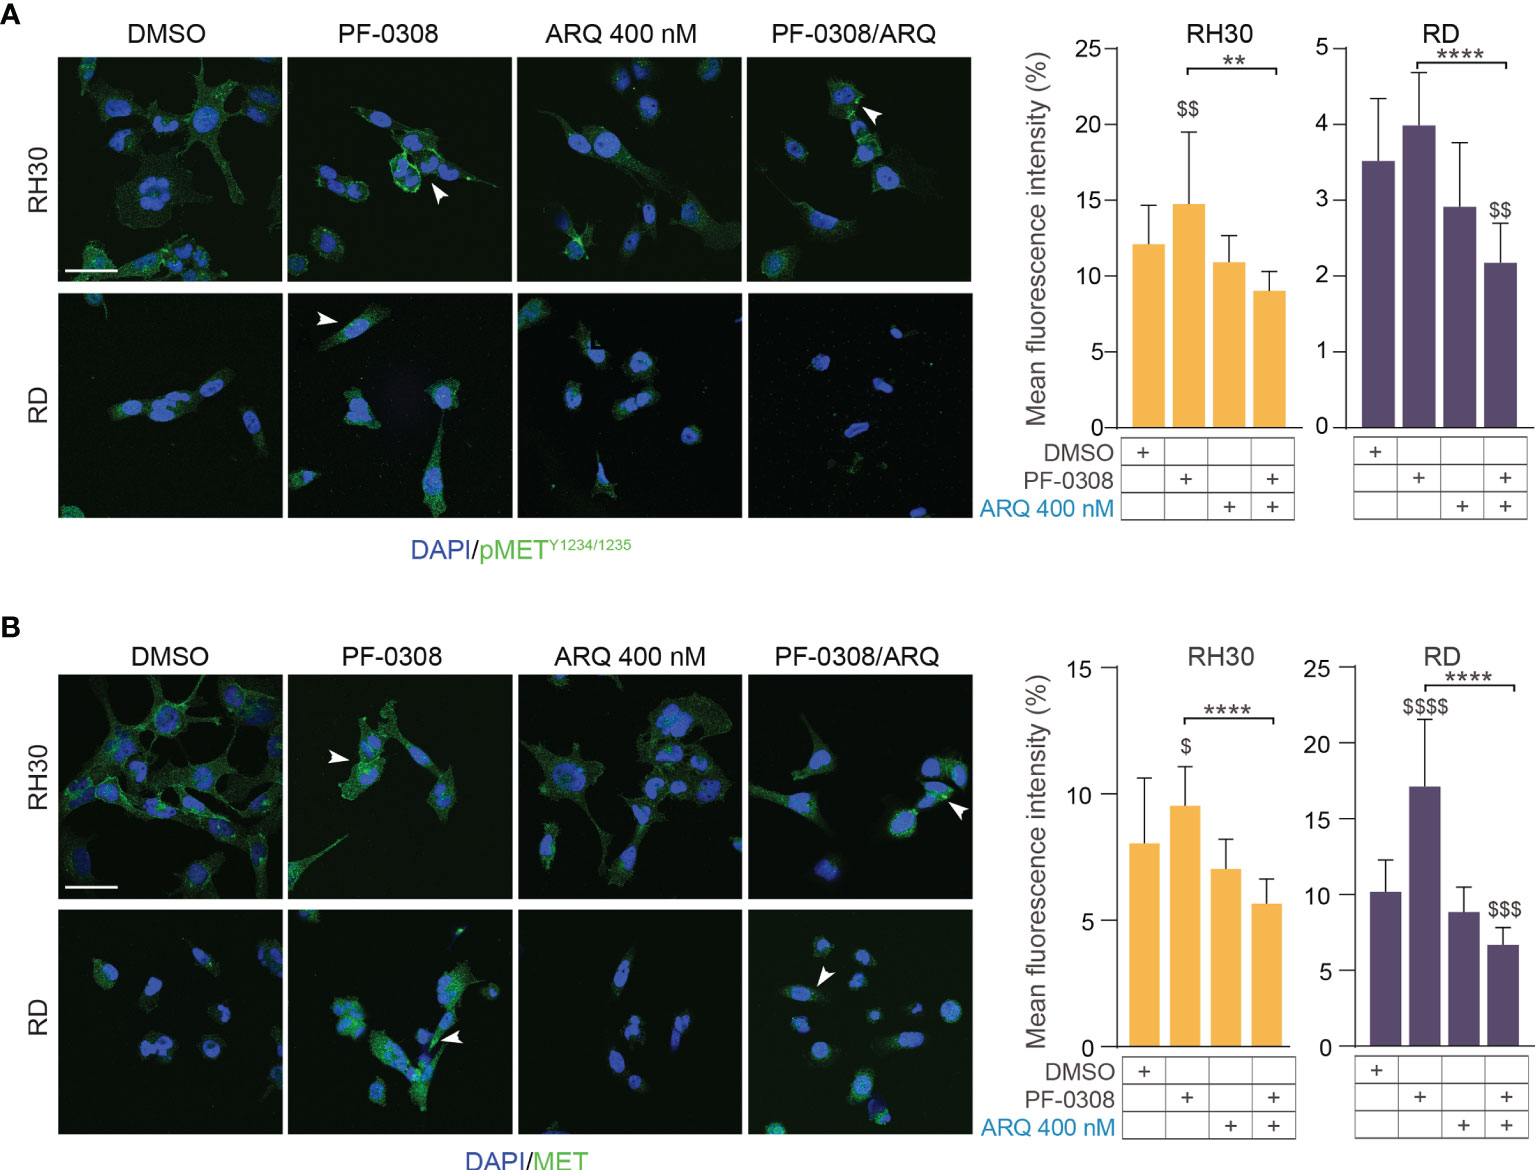
Figure 6 NOTCH and MET signaling co-inhibition affects MET expression and localization.0 (A) (left) Representative immunofluorescence images of pMETY1234/1235 (green) in RH30 and RD cells treated for 8h with either PF-03084014 (20 μM and 10 μM, respectively), or ARQ197 400 nM, or with the drug combination. DAPI (blue) was used for nuclear staining. (right) Histograms depicting % of pMET mean fluorescence intensity of RH30 and RD cells treated for 8h with either PF-03084014 (20 μM and 10 μM, respectively), or ARQ197 400 nM, or with the drug combination ± SD, 2-way ANOVA test. $$ P-value ≤ 0.01 drug-treated cells vs vehicle-treated (DMSO) cells, and **P-value ≤ 0.01, ****P-value ≤ 0.0001 for drug combination-treated cells vs single agents. (B) (left) Representative immunofluorescence images of total MET (green) in RH30 and RD cells treated as in (A) for 24h. DAPI (blue) was used for nuclear staining. 60X magnification; scale bar 50 μM. (right) Histograms depicting % of total MET mean fluorescence intensity of RH30 and RD cells treated for as in (A) ± SD, 2-way ANOVA test. $ P-value ≤ 0.05, $$$ P-value ≤ 0.001, $$$$ P-value ≤ 0.0001 drug-treated cells vs vehicle-treated (DMSO) cells, and ****P-value ≤ 0.001 for drug combination-treated cells vs single agents.
After PF-0308 treatment, pMET staining was localized more on the cell membrane especially in RH30 cells that also showed an increase in the expression levels, as indicated by the significant enhancement of the intensity of fluorescence vs vehicle-treated cells (Figure 6A). Conversely, ARQ reduced the intensity of pMET staining in both cell lines even if values did not reach the significance (Figure 6A). The drug combination counteracted the increase in pMET due to PF-0308 in both cell lines compared to NOTCHi alone and impaired its localization on the cell membrane (Figure 6A). In line with the immunoblot assays results, PF-0308 individually increased total MET staining and the combination was able to impair the PF-0308-inducer effect on MET expression and localization in both cell lines (Figure 6B).
Overall, these results suggest that co-inhibition of NOTCH and MET signaling amplifies the anti-proliferative effects of single pathways inhibition in RMS cells partly through the induction of apoptosis.
Combined Inhibition of NOTCH and MET Signaling Impairs the Tumorigenic Properties of RMS Cells
Since both NOTCH and MET pathways regulate RMS cell migration (16, 40), we evaluated the migratory phenotype of the four cell lines after pharmacologic co-inhibition of the two pathways. We used a short time point, i.e., 24h, and a low serum condition (see Materials and Methods) to avoid the confounding effects of the drugs on cell proliferation. The NOTCH inhibitor PF-0308 as single agent was able to significantly reduce the migration of RH30 and JR1 cells relative to the vehicle, as indicated by the increase in the cell-free area, while this effect was not significant neither in RD nor in RH4 cells, or rather in the latter the migration even seemed to be slightly increased (Figure 7A and Figure S8A). MET inhibition with ARQ enhanced the cell-free area in three cell lines with the exception of RH4 cells, while the combination significantly hampered the migratory phenotype of the four cell lines compared to single agents (Figure 7A and Figure S8A).
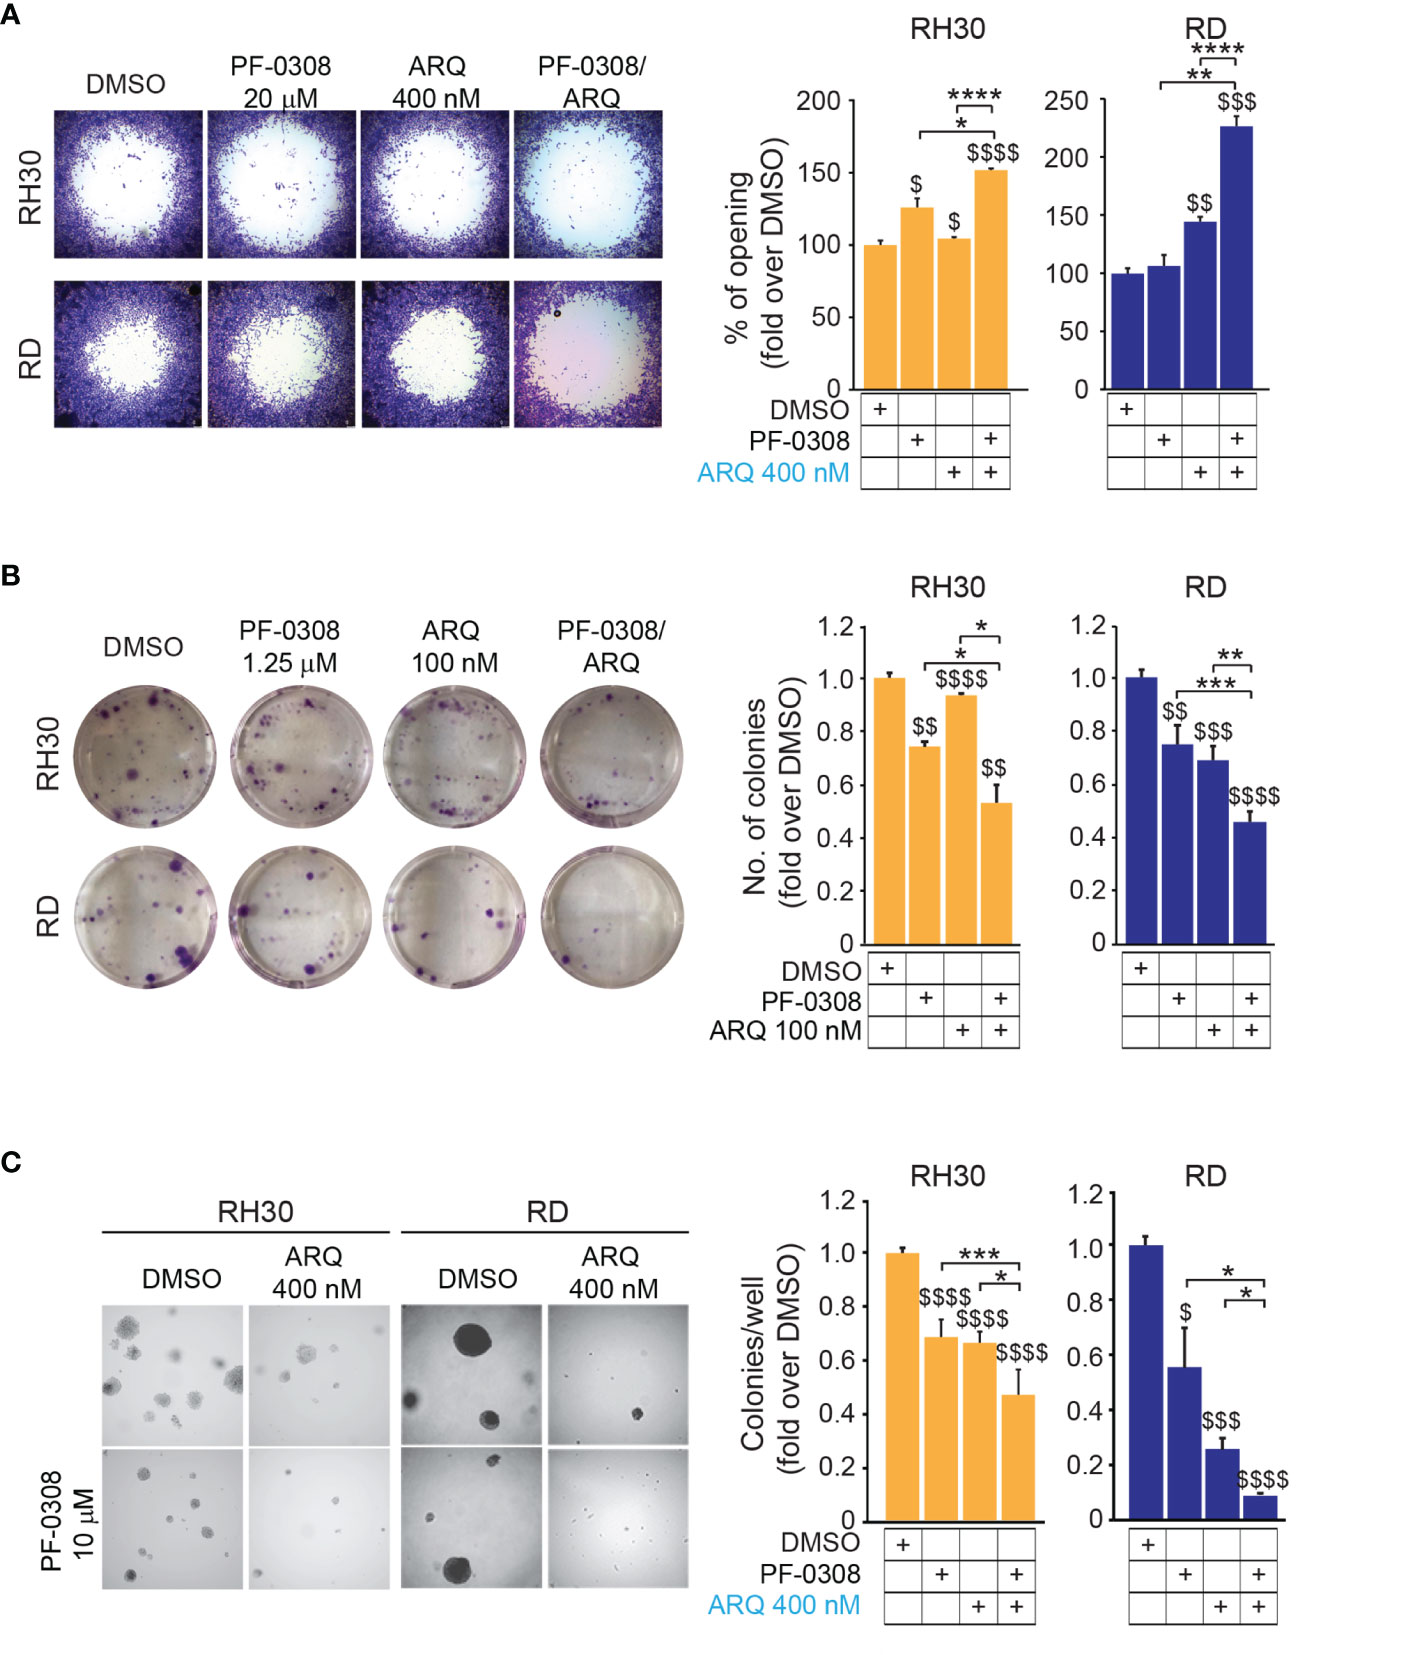
Figure 7 NOTCH and MET signaling co-inhibition reduces migration and tumorigenicity in vitro. (A) (left) Representative images of a migration assay of RH30 and RD cells treated for 24h with either PF-03084014 (20 μM and 10 μM, respectively) or ARQ197 400 nM or with the drug combination. (right) Histograms depict the percentage of the opening area in RH30 and RD cells. Graphs represent the mean of three independent experiments ± SD, 2-way ANOVA test. $ P-value ≤ 0.05, $$ P-value ≤ 0.01, $$$ P-value ≤ 0.001, $$$$ P-value ≤ 0.0001 for drug-treated cells vs vehicle-treated (DMSO) cells, and *P-value ≤ 0.05, **P-value ≤ 0.01, ****P-value ≤ 0.0001 for drug combination-treated vs single agent-treated cells. (B) (left) Representative images of a colony formation assay of RH30 and RD cells treated with either PF-03084014 1.25 μM or ARQ197 100 nM or with the drug combination. (right) Histogram of quantitation values of colony forming units. Graphs represent the mean of three independent experiments ± SD, 2-way ANOVA test. $$ P-value ≤ 0.01, $$$ P-value ≤ 0.001, $$$$ P-value ≤ 0.0001 for drug-treated cells vs vehicle-treated (DMSO) cells, and *P-value ≤ 0.05, **P-value ≤ 0.01, ***P-value ≤ 0.001 for drug combination-treated cells vs single agents. (C) (left) Representative images of a soft agar colony formation assay of RH30 and RD cells treated with either PF-03084014 (20 μM and 10 μM, respectively) or ARQ197 400 nM or with the drug combination. (right) Histograms of colony numbers/wells quantitation. Graphs represent the mean of three independent experiments ± SD, 2-way ANOVA test. $ P-value ≤ 0.05, $$$ P-value ≤ 0.001, $$$$ P-value ≤ 0.0001 for drug-treated cells vs vehicle-treated (DMSO) cells, and *P-value ≤ 0.05, **P-value ≤ 0.01, ***P-value ≤ 0.001 for drug combination-treated cells vs single agents.
We then tested the capacity of RMS cells to grow into single cell-derived colonies through a clonogenic assay. Using drug concentrations that allowed the formation of a measurable number of cell colonies in single agent-treated cells (i.e., PF-0308 1.25 µM and ARQ 100 nM) we observed that each drug was able to lower the number of colonies vs vehicle, with the condition of drug combination that further decreased colony formation (Figure 7B and Figure S8B). The capability of tumor cells to grow in an anchorage-independent manner, as a stringent feature of malignant transformation, was also determined by measuring the number of colonies grown in soft-agar. Single treatments significantly affected the capacity of RMS cells to form colonies relative to vehicle-treated cells, and this effect was further amplified by PF-0308 + ARQ in the four cell lines (Figure 7C and Figure S8C).
Then, we cultured RMS cells as spheroids (see Materials and Methods) to allow the formation of 3D structures more reminiscent of the in vivo growth, and treated them with drugs. PF-0308 as single agent significantly reduced spheroids growth vs vehicle-treated cells in RD, RH4 and JR1 cells, as shown by the decrease in spheroids’ diameter calculated on Calcein-stained live cells, while ARQ appeared ineffective (Figures 8A, B and Figures S9A, B).
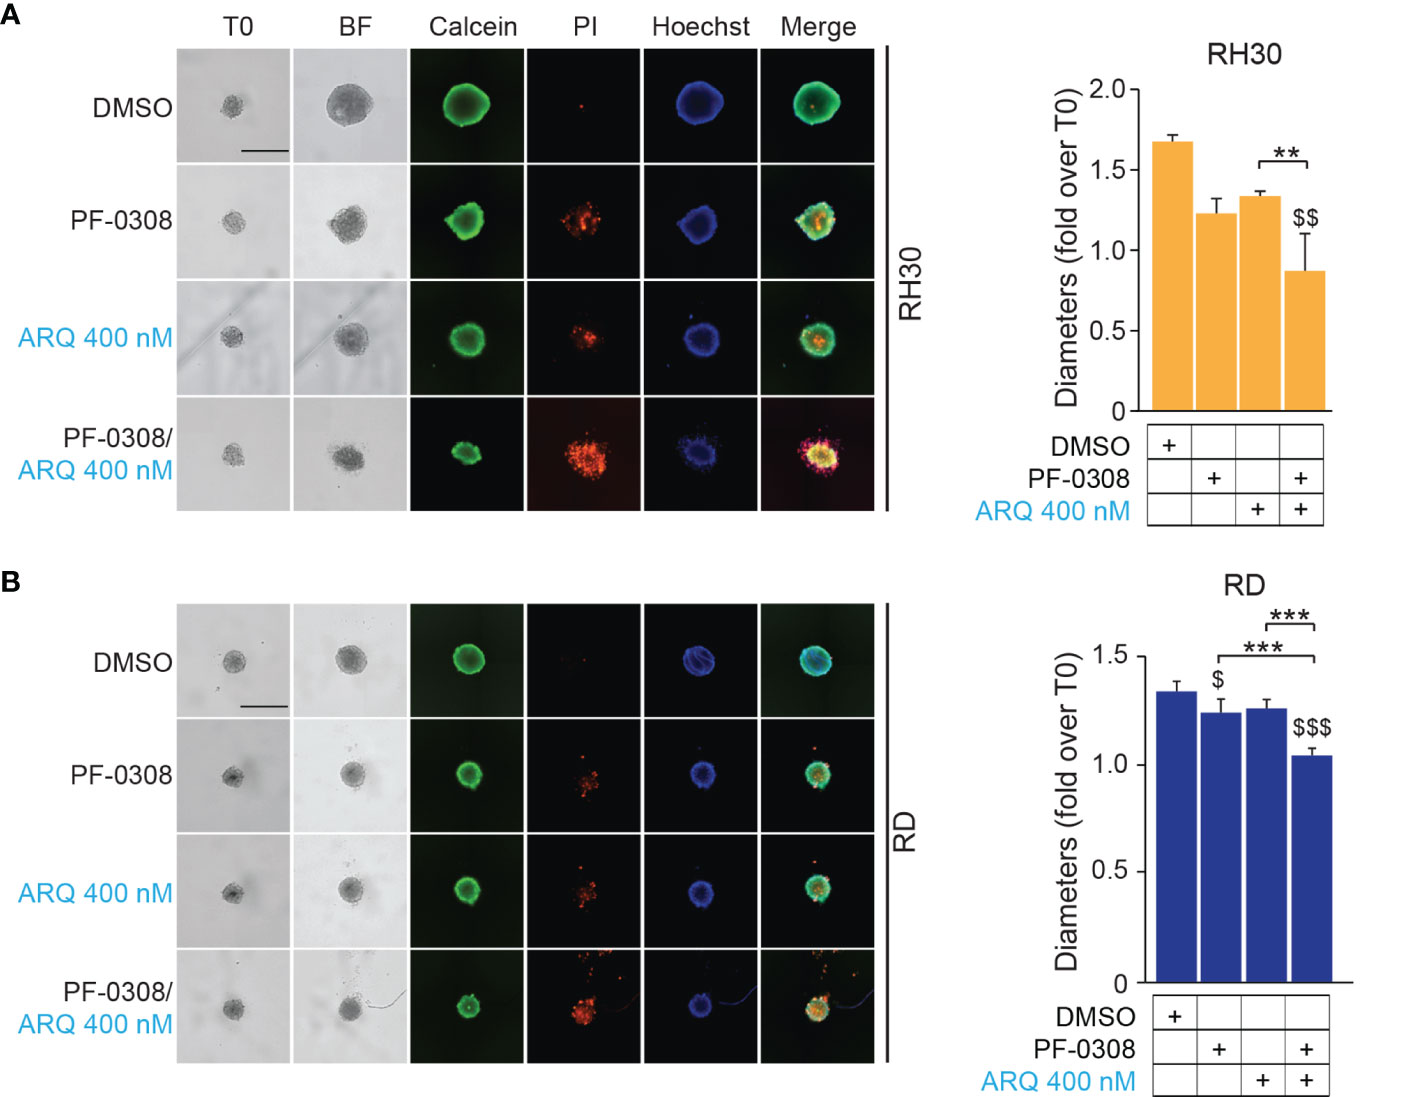
Figure 8 NOTCH and MET signaling co-inhibition induces growth arrest and cell death in RMS tumor spheroids. (A) (left) Representative images of RH30 tumor spheroids treated for 72h with PF-03084014 (20 μM) and ARQ197 (400 nM), alone or in combination. Scale bars = 500 μm. (right) Histogram of spheroids’ diameters quantification in RH30 cells. Graphs represent the mean of three independent experiments ± SD, 2-way ANOVA test. $$ P-value ≤ 0.01 for drug-treated cells vs vehicle-treated (DMSO) cells and **P-value ≤ 0.01 for drug combination-treated cells vs single agents. (B) (left) Representative images of RD tumor spheroids treated for 72h with PF-03084014 (10 μM) and ARQ197 (400 nM), alone or in combination. Scale bars = 500 μm. (right) Histogram of spheroids’ diameters quantification in RD cells. Graphs represent the mean of three independent experiments ± SD, 2-way ANOVA test. $ P-value ≤ 0.05, $$$ P-value ≤ 0.001 for drug-treated cells vs vehicle-treated (DMSO) cells, and ***P-value ≤ 0.001 for drug combination-treated cells vs single agents.
Although the combination significantly inhibited 3D cell growth in the four cell lines compared to the vehicle, the diameter of spheroids was significantly reduced compared to both single treatments in RD, RH4 and JR1 cells while its effects were significant only when compared to ARQ in RH30 cells (Figures 8A, B and Figures S9A, B). Of note, both drugs induced the appearance of a PI-positive dead cell population, suggesting a pro-death effect in RMS cell lines growing in 3D, which was strongly increased by the combinations (Figures 8A, B and Figures S9A, B).
Altogether, our findings demonstrate that combining NOTCH with MET inhibition severely hampers the migratory and in vitro tumorigenic properties of RMS cells compared to single treatments.
Discussion
NOTCH and MET signaling have been demonstrated pro-oncogenic in RMS and their genetic or pharmacologic inhibition prevents tumor cell growth and survival in vitro and in vivo (16–18, 40–42, 45, 47, 48). It has been reported that the MET oncogene can be repressed by NOTCH signaling in breast cancer (31). Moreover, NOTCH blockade using γ-secretase inhibitors have been shown unable to induce sustained anti-tumor effects in clinical studies [reviewed in (20)] suggesting mechanisms of resistance restraining their efficacy (53–57). Based on these evidences, in the present work we investigated whether MET is modulated in response to NOTCH inhibition in RMS with the aim to evaluate the effects of a combined NOTCH-MET inhibitory approach.
Our results show that in vitro blockade of the NOTCH pathway using the γ-secretase inhibitor PF-03084014 (PF-0308), investigated in clinical trials on other tumor types, resulted in the up-regulation of total and phosphorylated MET protein levels in both the FP-RMS RH30 and RH4 and the FN-RMS RD and JR1 cell lines.
Interestingly, MET mRNA levels were unmodified by the γ-secretase inhibitor in RH30 and slightly decreased in RH4 cells, suggesting that non-transcriptional mechanisms could be involved in the observed phenomenon in the FP-RMS subtype. Conversely, in the FN-RMS RD and JR1 cells MET transcripts increased after pharmacologic NOTCH signaling suppression suggesting transcriptional mechanisms concur to the enhancement of MET protein levels in this RMS subtype.
Notably, another different γ-secretase inhibitor, i.e., GSI-XII, also up-regulated MET levels when tested on RH30 and RD cells suggesting that this phenomenon is a general response to NOTCH signaling inhibition in RMS cells. Moreover, MET protein overexpression was also observed by individually silencing NOTCH1 and NOTCH3 receptors in all four cell lines indicating the effect was specifically due to NOTCH signaling inactivation. Of note, while MET transcript levels remained unaltered in FP-RMS cell lines after silencing of each NOTCH paralogue, they significantly increased in both FN-RMS cell lines suggesting that the blockade of both receptors, as after γ-secretase inhibition, is needed for a transcriptional effect.
Since in addition to MET amplification or mutation, MET pathway overexpression and hyper-activation has been correlated to the emergence of drug resistance after targeted and anti-kinase therapy [reviewed by (58, 59)]. So, we investigated the co-inhibition of NOTCH and MET pathways in our tumor cell context to evaluate potential synergies on malignant cell features. To this end, we screened five MET inhibitors already in clinical trials or previously used on RMS cells (45–47), and we decided to test ARQ197 (Tivantinib) due to the IC50 nanomolar range.
As already reported for other types of cancer cells (60), ARQ treatment showed a specific effect on MET in our cell lines since it lowered MET phosphorylation, suggesting down-regulation of MET activity. We show here that both the γ-secretase and MET inhibitors as single agents had anti-proliferative effects associated to p21Cip1 increase in both RMS cell subtypes.
However, although significant activation of caspase 3/7 was induced by NOTCHi in all four cell lines, it was able to significantly increase the percentage of Annexin V positive cells only in RD and RH4 cell lines. Similarly, a cell line-specific response was seen for ARQ, which activated caspase 3/7 and enhanced Annexin V positivity in three cell lines with the exception of RH30 cells. Furthermore, only METi promoted PARP1 cleavage in all the tested cell lines, even if the increase in cleavage is mild in RH4 cells. These results suggest that NOTCHi induces PARP1-independent while METi PARP1-dependent apoptosis in RMS cells. In RH30 and JR1 cells, where neither Annexin V positivity nor PARP-1 cleavage increase was seen in response to NOTCHi, cell death could be due to a transient cell activation of caspase 3/7 (61) or, alternatively, to an heterogeneous caspase 3/7 activation in some cell subpopulations (62). Further, these data also demonstrate that the response to pan-NOTCHi seems to be independent of the RMS subtype.
All these effects were significantly enhanced combining the two inhibitors. Indeed, in all the RMS cell lines treated with the combination, the levels of MET and its phosphorylated form were similar or even decreased compared to those in vehicle-treated control cells demonstrating that ARQ in the combination counteracted the PF-0308-induced increase of MET protein levels. In addition, the RMS cell lines proliferated significantly less than control cells under drug combination, with the stronger effect on FP-RMS cells. Furthermore, NOTCH-MET co-inhibition was capable of triggeringsustained apoptosis in RMS cells as testified by the marked enhancement of the activity of caspase 3/7 and the concomitant augmentation of Annexin V positivity and PARP1 cleavage vs each single drug. These findings suggest that this combinatorial targeting triggers apoptotic cell death, which is dependent by PARP1 in RMS cells.
Moreover, while single treatments mildly affected the capacity of RMS cells to migrate, form colonies, and grow in an anchorage-independent manner, the PF-0308 and ARQ combination had a remarkable inhibitory effect on these tumorigenic properties. NOTCH-MET co-inhibition also strongly affected the survival of RMS cells grown as spheroids increasing cell death as compared to individual drug treatments. The drug combination showed a different impact on the proliferation ability of the two RMS subtypes resulting in a larger inhibitory effect than the sum of the effects of each individual drug in FP-RMS but not in FN-RMS cells. Further, the marked activation of caspase 3/7 and the induction of Annexin V positivity in three cell lines were greater than that due to additive effects, with the exception of RH4 cells. However, further in vitro studies are needed to clarify whether the pharmacological co-inhibition of NOTCH and MET pathways have synergistic or additive effects or both on the different malignant features in our tumor context.
Recently, ARQ has shown partial results in clinical trials on patients with MET overexpression or amplification (63). Further, in vitro studies showed that ARQ affects cell proliferation in cells not expressing MET and does not inhibit MET phosphorylation in lung cancer cells with low basal levels of MET expression (64, 65) or in gastric carcinoma cells characterized by MET amplification and constitutive MET activation (66). In these cell contexts, its anti-tumor function has been correlated with the inhibition of molecular targets other than MET (64, 67). However, in RMS cell lines the reduction in both total and phosphorylated forms of MET seem to suggest that ARQ is capable of targeting the oncogene, as suggested by previous reports (60). In addition, in the high-risk RMS tumor cells used in the present work (68, 69) MET is basally overexpressed and activated and NOTCHi further increases its activation thus possibly making it a major target of ARQ inhibition.
Of note, the doses of the drugs used in the present work are in line with the literature. Indeed, the NOTCHi has been recently shown to inhibit cell renewal and proliferation of HCC cancer stem cells using doses up to 15 μM in vitro and to block tumor growth in vivo (70). Further, ARQ doses were similar to those that induced pMET down-regulation in several cancer cell lines and inhibit tumor growth in vivo (60). The inhibitors have been used for the first time in combination in the present work, so no data are available on the toxicity in vivo for this combination, which needs to be verified in preclinical models in future studies.
In conclusion, we unveil a novel mechanism of MET induction that on the one hand could potentially influence the anti-cancer effects of NOTCH signaling blockade in RMS cells and, on the other hand, could represent a novel vulnerability that can be targeted. In line with this, our results demonstrated that inhibiting both NOTCH and MET signaling overcomes the activation of MET following NOTCH signaling restriction and, even if they should be further evaluated in future preclinical studies, they deserve attention as they can have a translational impact.
Data Availability Statement
The original contributions presented in the study are included in the article/Supplementary Material. Further inquiries can be directed to the corresponding author.
Author Contributions
CP, MCa, and SPo performed and/or interpreted or supervised the experimental aspects. CP, SPo, MCa, CC, MP, MCo performed wet experiments and acquired result data. GP and MV helped with the 3D model. SPe performed confocal microscopy. JR, SG, and LM helped on the interpretation of NOTCH signaling inhibition. GMM, FM, CQ, SC, ADG, BDA, EdB, PM, RT, and MCe participated in the analysis of the data and provided reagents. RM, LM, and FL participated in the writing and critically revising the manuscript. RR designed and supervised the study, wrote and revised the final version of the manuscript. All authors read and approved the final version of the manuscript.
Funding
This research was funded by Associazione Italiana per la Ricerca sul Cancro (AIRC) #15312 to RR and #24696 to FM; Italian Ministry of Health (Ricerca Corrente) to BDA, CQ, and RR; AIRC 5xmille #9962 to FL; Italian Ministry of Health (Fondi 5xmille 2021-2022) to RR; Alleanza Contro il Cancro (ACC) Italian Network-Working Group Sarcomas to BDA, RM, and RR; Fondi Ateneo 2019 to FM; MIUR-Italy: Grant to Department of Science, Roma Tre University (Dipartimento di Eccellenza, ARTICOLO 1, COMMI 314—337 LEGGE 232/2016) to MCe and PM.
Conflict of Interest
The authors declare that the research was conducted in the absence of any commercial or financial relationships that could be construed as a potential conflict of interest.
Publisher’s Note
All claims expressed in this article are solely those of the authors and do not necessarily represent those of their affiliated organizations, or those of the publisher, the editors and the reviewers. Any product that may be evaluated in this article, or claim that may be made by its manufacturer, is not guaranteed or endorsed by the publisher.
Acknowledgments
We thank the Soft Tissue Sarcoma Working Group of Alleanza Contro il Cancro (ACC) for the fruitful discussion. CP was supported by the Italian Ministry of University and Research (MIUR) Ph.D. fellowship (Department of Science, Roma Tre University Doctorate), and SPo and MCo were supported by a “Fondazione Veronesi” fellowship. The NOTCH1 (bTAN 20) (Artavanis-Tsakonas, S.) antibody was obtained from the Developmental Studies Hybridoma Bank, developed under the auspices of the NICHD and maintained by The University of Iowa, Department of Biology, Iowa City, IA 52242, USA.
Supplementary Material
The Supplementary Material for this article can be found online at: https://www.frontiersin.org/articles/10.3389/fonc.2022.835642/full#supplementary-material
References
1. Skapek SX, Ferrari A, Gupta AA, Lupo PJ, Butler E, Shipley J, et al. Rhabdomyosarcoma. Nat Rev Dis Prim (2019) 5:1. doi: 10.1038/s41572-018-0051-2
2. Xia SJ, Pressey JG, Barr FG. Molecular Pathogenesis of Rhabdomyosarcoma. Cancer Biol Ther (2002) 1:97–104. doi: 10.4161/cbt.51
3. Williamson D, Missiaglia E, De Reyniès A, Pierron G, Thuille B, Palenzuela G, et al. Fusion Gene-Negative Alveolar Rhabdomyosarcoma is Clinically and Molecularly Indistinguishable From Embryonal Rhabdomyosarcoma. J Clin Oncol (2010) 28:2151–8. doi: 10.1200/JCO.2009.26.3814
4. Shern JF, Chen L, Chmielecki J, Wei JS, Patidar R, Rosenberg M, et al. Comprehensive Genomic Analysis of Rhabdomyosarcoma Reveals a Landscape of Alterations Affecting a Common Genetic Axis in Fusion-Positive and Fusion-Negative Tumors. Cancer Discov (2014) 4:216–31. doi: 10.1158/2159-8290.CD-13-0639
5. Shern JF, Selfe J, Izquierdo E, Patidar R, Chou H-C, Song YK, et al. Genomic Classification and Clinical Outcome in Rhabdomyosarcoma: A Report From an International Consortium. J Clin Oncol (2021) 39:2859–71. doi: 10.1200/JCO.20.03060
6. Missiaglia E, Williamson D, Chisholm J, Wirapati P, Pierron G, Petel F, et al. PAX3/FOXO1 Fusion Gene Status is the Key Prognostic Molecular Marker in Rhabdomyosarcoma and Significantly Improves Current Risk Stratification. J Clin Oncol (2012) 30:1670–7. doi: 10.1200/JCO.2011.38.5591
7. Monje M. Open Questions: Why are Babies Rarely Born With Cancer? BMC Biol (2018) 16:129. doi: 10.1186/s12915-018-0601-9
8. Marchesi I, Fiorentino FP, Rizzolio F, Giordano A, Bagella L. The Ablation of EZH2 Uncovers Its Crucial Role in Rhabdomyosarcoma Formation. Cell Cycle (2012) 11:3828–36. doi: 10.4161/cc.22025
9. Ciarapica R, Carcarino E, Adesso L, De Salvo M, Bracaglia G, Leoncini PP, et al. Pharmacological Inhibition of EZH2 as a Promising Differentiation Therapy in Embryonal RMS. BMC Cancer (2014) 14:139. doi: 10.1186/1471-2407-14-139
10. Shields CE, Potlapalli S, Cuya-Smith SM, Chappell SK, Chen D, Martinez D, et al. Epigenetic Regulator BMI1 Promotes Alveolar Rhabdomyosarcoma Proliferation and Constitutes a Novel Therapeutic Target. Mol Oncol (2021) 15:2156–71. doi: 10.1002/1878-0261.12914
11. Tremblay AM, Missiaglia E, Galli GG, Hettmer S, Urcia R, Carrara M, et al. The Hippo Transducer YAP1 Transforms Activated Satellite Cells and is a Potent Effector of Embryonal Rhabdomyosarcoma Formation. Cancer Cell (2014) 26:273–87. doi: 10.1016/j.ccr.2014.05.029
12. Crose LES, Galindo KA, Kephart JG, Chen C, Fitamant J, Bardeesy N, et al. Alveolar Rhabdomyosarcoma-Associated PAX3-FOXO1 Promotes Tumorigenesis via Hippo Pathway Suppression. J Clin Invest (2014) 124:285–96. doi: 10.1172/JCI67087
13. Mohamed A, Sun C, De Mello V, Selfe J, Missiaglia E, Shipley J, et al. The Hippo Effector TAZ (WWTR1) Transforms Myoblasts and TAZ Abundance Is Associated With Reduced Survival in Embryonal Rhabdomyosarcoma. J Pathol (2016) 240:3–14. doi: 10.1002/path.4745
14. Almazán-Moga A, Zarzosa P, Molist C, Velasco P, Pyczek J, Simon-Keller K, et al. Ligand-Dependent Hedgehog Pathway Activation in Rhabdomyosarcoma: The Oncogenic Role of the Ligands. Br J Cancer (2017) 117:1314–25. doi: 10.1038/bjc.2017.305
15. Ramadan F, Fahs A, Ghayad SE, Saab R. Signaling Pathways in Rhabdomyosarcoma Invasion and Metastasis. Cancer Metastasis Rev (2020) 39:287–301. doi: 10.1007/s10555-020-09860-3
16. Roma J, Masià A, Reventós J, De Toledo JS, Gallego S. Notch Pathway Inhibition Significantly Reduces Rhabdomyosarcoma Invasiveness and Mobility In Vitro. Clin Cancer Res (2011) 17:505–13. doi: 10.1158/1078-0432.CCR-10-0166
17. Belyea BC, Naini S, Bentley RC, Linardic CM. Inhibition of the Notch-Hey1 Axis Blocks Embryonal Rhabdomyosarcoma Tumorigenesis. Clin Cancer Res (2011) 17:7324–36. doi: 10.1158/1078-0432.CCR-11-1004
18. Raimondi L, Ciarapica R, De Salvo M, Verginelli F, Gueguen M, Martini C, et al. Inhibition of Notch3 Signalling Induces Rhabdomyosarcoma Cell Differentiation Promoting P38 Phosphorylation and P21 Cip1 Expression and Hampers Tumour Cell Growth In Vitro and In Vivo. Cell Death Differ (2012) 19:871–81. doi: 10.1038/cdd.2011.171
19. Siebel C, Lendahl U. Notch Signaling in Development, Tissue Homeostasis, and Disease. Physiol Rev (2017) 97:1235–94. doi: 10.1152/physrev.00005.2017
20. Majumder S, Crabtree JS, Golde TE, Minter LM, Osborne BA, Miele L. Targeting Notch in Oncology: The Path Forward. Nat Rev Drug Discov (2021) 20:125–44. doi: 10.1038/s41573-020-00091-3
21. Iso T, Kedes L, Hamamori Y. HES and HERP Families: Multiple Effectors of the Notch Signaling Pathway. J Cell Physiol (2003) 194. doi: 10.1002/jcp.10208
22. Krauss RS, Joseph GA, Goel AJ. Keep Your Friends Close: Cell–cell Contact and Skeletal Myogenesis. Cold Spring Harb Perspect Biol (2017) 9:a029298. doi: 10.1101/cshperspect.a029298
23. Rios AC, Serralbo O, Salgado D, Marcelle C. Neural Crest Regulates Myogenesis Through the Transient Activation of NOTCH. Nature (2011) 473:532–5. doi: 10.1038/nature09970
24. Shawber C, Nofziger D, Hsieh JJD, Lindsell C, Bögler O, Hayward D, et al. Notch Signaling Inhibits Muscle Cell Differentiation Through a CBF1-Independent Pathway. Development (1996) 122:3765–73. doi: 10.1242/dev.122.12.3765
25. Delfini MC, Hirsinger E, Pourquie O, Duprez D. Delta 1-Activated Notch Inhibits Muscle Differentation Without Affecting Myf5 and Pax3 Expression in Chick Limb Myogenesis. Development (2000) 127:5213–24. doi: 10.1242/dev.127.23.5213
26. Schuster-Gossler K, Cordes R, Gossler A. Premature Myogenic Differentiation and Depletion of Progenitor Cells Cause Severe Muscle Hypotrophy in Delta1 Mutants. Proc Natl Acad Sci USA (2007) 104:537–42. doi: 10.1073/pnas.0608281104
27. Vasyutina E, Lenhard DC, Wende H, Erdmann B, Epstein JA, Birchmeier C. RBP-J (Rbpsuh) Is Essential to Maintain Muscle Progenitor Cells and to Generate Satellite Cells. Proc Natl Acad Sci USA (2007) 104:4443–8. doi: 10.1073/pnas.0610647104
28. Dale B, Cheng M, Park KS, Kaniskan HÜ, Xiong Y, Jin J. Advancing Targeted Protein Degradation for Cancer Therapy. Nat Rev Cancer (2021) 21:638–54. doi: 10.1038/s41568-021-00365-x
29. Di Nicolantonio F, Vitiello PP, Marsoni S, Siena S, Tabernero J, Trusolino L, et al. Precision Oncology in Metastatic Colorectal Cancer — From Biology to Medicine. Nat Rev Clin Oncol (2021) 18:506–25. doi: 10.1038/s41571-021-00495-z
30. Dias MP, Moser SC, Ganesan S, Jonkers J. Understanding and Overcoming Resistance to PARP Inhibitors in Cancer Therapy. Nat Rev Clin Oncol (2021) 18:773–91. doi: 10.1038/s41571-021-00532-x
31. Stella MC, Trusolino L, Pennacchietti S, Comoglio PM. Negative Feedback Regulation of Met-Dependent Invasive Growth by Notch. Mol Cell Biol (2005) 25:3982–96. doi: 10.1128/mcb.25.10.3982-3996.2005
32. Zhang J, Babic A. Regulation of the MET Oncogene: Molecular Mechanisms. Carcinogenesis (2015) 37:345–55. doi: 10.1093/carcin/bgw015
33. Epstein JA, Shapiro DN, Cheng J, Lam PYP, Maas RL. Pax3 Modulates Expression of the C-Met Receptor During Limb Muscle Development. Proc Natl Acad Sci USA (1996) 93:4213–8. doi: 10.1073/pnas.93.9.4213
34. Ginsberg JP, Davis RJ, Bennicelli JL, Nauta LE, Barr FG. Up-Regulation of MET But Not Neural Cell Adhesion Molecule Expression by the PAX3-FKHR Fusion Protein in Alveolar Rhabdomyosarcoma. Cancer Res (1998) 58:3542–6. doi: 10.1097/00043426-199807000-00084
35. Bladt F, Riethmacher D, Isenmann S, Aguzzi A, Birchmeier C. Essential Role for the C-Met Receptor in the Migration of Myogenic Precursor Cells Into the Limb Bud. Nature (1995) 376:768–71. doi: 10.1038/376768a0
36. Prunotto C, Crepaldi T, Forni PE, Ieraci A, Kelly RG, Tajbakhsh S, et al. Analysis of Mlc-lacZ Met Mutants Highlights the Essential Function of Met for Migratory Precursors of Hypaxial Muscles and Reveals a Role for Met in the Development of Hyoid Arch-Derived Facial Muscles. Dev Dyn (2004) 231:582–91. doi: 10.1002/dvdy.20177
37. Anastasi S, Giordano S, Sthandier O, Gambarotta G, Maione R, Comoglio P, et al. A Natural Hepatocyte Growth Factor/Scatter Factor Autocrine Loop in Myoblast Cells and the Effect of the Constitutive Met Kinase Activation on Myogenic Differentiation. J Cell Biol (1997) 137:1057–68. doi: 10.1083/jcb.137.5.1057
38. Comoglio PM, Trusolino L, Boccaccio C. Known and Novel Roles of the MET Oncogene in Cancer: A Coherent Approach to Targeted Therapy. Nat Rev Cancer (2018) 18:341–58. doi: 10.1038/s41568-018-0002-y
39. Zhang Y, Xia M, Jin K, Wang S, Wei H, Fan C, et al. Function of the C-Met Receptor Tyrosine Kinase in Carcinogenesis and Associated Therapeutic Opportunities. Mol Cancer (2018) 17:45. doi: 10.1186/s12943-018-0796-y
40. Ferracini R, Olivero M, Di Renzo MF, Martano M, De Giovanni C, Nanni P, et al. Retrogenic Expression of the MET Proto-Oncogene Correlates With the Invasive Phenotype of Human Rhabdomyosarcomas. Oncogene (1996) 12:1697–705.
41. Sharp R, Recio JA, Jhappan C, Otsuka T, Liu S, Yu Y, et al. Synergism Between INK4a/ARF Inactivation and Aberrant HGF/SF Signaling in Rhabdomyosarcomagenesis. Nat Med (2002) 8:1276–80. doi: 10.1038/nm787
42. Taulli R, Scuoppo C, Bersani F, Accornero P, Forni PE, Miretti S, et al. Validation of Met as a Therapeutic Target in Alveolar and Embryonal Rhabdomyosarcoma. Cancer Res (2006) 66:4742–9. doi: 10.1158/0008-5472.CAN-05-4292
43. Diomedi-Camassei F, McDowell HP, De loris MA, Uccini S, Altavista P, Raschellà G, et al. Clinical Significance of CXC Chemokine Receptor-4 and C-Met in Childhood Rhabdomyosarcoma. Clin Cancer Res (2008) 14:4119–27. doi: 10.1158/1078-0432.CCR-07-4446
44. Du J, Wang Y, Meng L, Liu Y, Pang Y, Cui W, et al. C-MET Expression Potentially Contributes to the Poor Prognosis of Rhabdomyosarcoma. Int J Clin Exp Pathol (2018) 11:4083–92.
45. Lukasiewicz E, Miekus K, Kijowski J, Drabik G, Wilusz M, Bobis-Wozowicz S, et al. Inhibition of Rhabdomyosarcoma’s Metastatic Behavior Through Downregulation of MET Receptor Signaling. Folia Histochem Cytobiol (2009) 47:485–9. doi: 10.2478/v10042-009-0108-x
46. Hou J, Dong J, Sun L, Geng L, Wang J, Zheng J, et al. Inhibition of Phosphorylated C-Met in Rhabdomyosarcoma Cell Lines by a Small Molecule Inhibitor SU11274. J Transl Med (2011) 9:64. doi: 10.1186/1479-5876-9-64
47. Miekus K, Lukasiewicz E, Jarocha D, Sekula M, Drabik G, Majka M. The Decreased Metastatic Potential of Rhabdomyosarcoma Cells Obtained Through MET Receptor Downregulation and the Induction of Differentiation. Cell Death Dis (2013) 4:e459. doi: 10.1038/cddis.2012.199
48. Taulli R, Bersani F, Foglizzo V, Linari A, Vigna E, Ladanyi M, et al. The Muscle-Specific microRNA miR-206 Blocks Human Rhabdomyosarcoma Growth in Xenotransplanted Mice by Promoting Myogenic Differentiation. J Clin Invest (2009) 119:2366–78. doi: 10.1172/JCI38075
49. Ciarapica R, Russo G, Verginelli F, Raimondi L, Donfrancesco A, Rota R, et al. Deregulated Expression of miR-26a and Ezh2 in Rhabdomyosarcoma. Cell Cycle (2009) 8:172–5. doi: 10.4161/cc.8.1.7292
50. Vella S, Pomella S, Leoncini PP, Colletti M, Conti B, Marquez VE, et al. MicroRNA-101 Is Repressed by EZH2 and Its Restoration Inhibits Tumorigenic Features in Embryonal Rhabdomyosarcoma. Clin Epigenet (2015) 7:82. doi: 10.1186/s13148-015-0107-z
51. Hecker RM, Amstutz RA, Wachtel M, Walter D, Niggli FK, Schäfer BW. P21 Downregulation Is an Important Component of PAX3/FKHR Oncogenicity and Its Reactivation by HDAC Inhibitors Enhances Combination Treatment. Oncogene (2010) 29:3942–52. doi: 10.1038/onc.2010.145
52. Ciccarelli C, Marampon F, Scoglio A, Mauro A, Giacinti C, De Cesaris P, et al. P21waf1 Expression Induced by MEK/ERK Pathway Activation or Inhibition Correlates With Growth Arrest, Myogenic Differentiation and Onco-Phenotype Reversal in Rhabdomyosarcoma Cells. Mol Cancer (2005) 4:41. doi: 10.1186/1476-4598-4-41
53. O’Neil J, Grim J, Strack P, Rao S, Tibbitts D, Winter C, et al. FBW7 Mutations in Leukemic Cells Mediate NOTCH Pathway Activation and Resistance to γ-Secretase Inhibitors. J Exp Med (2007) 204:1813–24. doi: 10.1084/jem.20070876
54. Yashiro-Ohtani Y, Wang H, Zang C, Arnett KL, Bailis W, Ho Y, et al. Long-Range Enhancer Activity Determines Myc Sensitivity to Notch Inhibitors in T Cell Leukemia. Proc Natl Acad Sci USA (2014) 111:E4946–53. doi: 10.1073/pnas.1407079111
55. Palomero T, Sulis ML, Cortina M, Real PJ, Barnes K, Ciofani M, et al. Mutational Loss of PTEN Induces Resistance to NOTCH1 Inhibition in T-Cell Leukemia. Nat Med (2007) 13:1203–10. doi: 10.1038/nm1636
56. Mendes RD, Canté-Barrett K, Pieters R, Meijerink JPP. The Relevance of PTEN-AKT in Relation to NOTCH1-Directed Treatment Strategies in T-Cell Acute Lymphoblastic Leukemia. Haematologica (2016) 101:1010–17. doi: 10.3324/haematol.2016.146381
57. Franciosa G, Smits JGA, Minuzzo S, Martinez-Val A, Indraccolo S, Olsen JV. Proteomics of Resistance to Notch1 Inhibition in Acute Lymphoblastic Leukemia Reveals Targetable Kinase Signatures. Nat Commun (2021) 12:2507. doi: 10.1038/s41467-021-22787-9
58. Wood GE, Hockings H, Hilton DM, Kermorgant S. The Role of MET in Chemotherapy Resistance. Oncogene (2021) 40:1927–41. doi: 10.1038/s41388-020-01577-5
59. Ko B, He T, Gadgeel S, Halmos B. MET/HGF Pathway Activation as a Paradigm of Resistance to Targeted Therapies. Ann Transl Med (2017) 5:4. doi: 10.21037/atm.2016.12.09
60. Munshi N, Jeay S, Li Y, Chen CR, France DS, Ashwell MA, et al. ARQ 197, A Novel and Selective Inhibitor of the Human c-Met Receptor Tyrosine Kinase With Antitumor Activity. Mol Cancer Ther (2010) 9:1544–53. doi: 10.1158/1535-7163.MCT-09-1173
61. McComb S, Mulligan R, Sad S. Caspase-3 Is Transiently Activated Without Cell Death During Early Antigen Driven Expansion of CD8+ T Cells In Vivo. PloS One (2010) 5:e15328. doi: 10.1371/journal.pone.0015328
62. Telford WG, Komoriya A, Packard BZ. Detection of Localized Caspase Activity in Early Apoptotic Cells by Laser Scanning Cytometry. Cytometry (2002) 47:81–8. doi: 10.1002/cyto.10052
63. Rimassa L, Bozzarelli S, Pietrantonio F, Cordio S, Lonardi S, Toppo L, et al. Phase II Study of Tivantinib and Cetuximab in Patients With KRAS Wild-Type Metastatic Colorectal Cancer With Acquired Resistance to EGFR Inhibitors and Emergence of MET Overexpression: Lesson Learned for Future Trials With EGFR/MET Dual Inhibition. Clin Colorectal Cancer (2019) 18:125–132.e2. doi: 10.1016/j.clcc.2019.02.004
64. Remsing Rix LL, Kuenzi BM, Luo Y, Remily-Wood E, Kinose F, Wright G, et al. GSK3 Alpha and Beta Are New Functionally Relevant Targets of Tivantinib in Lung Cancer Cells. ACS Chem Biol (2014) 9:353–8. doi: 10.1021/cb400660a
65. Katayama R, Aoyama A, Yamori T, Qi J, Oh-hara T, Song Y, et al. Cytotoxic Activity of Tivantinib (ARQ 197) Is Not Due Solely to C-MET Inhibition. Cancer Res (2013) 73:3087–96. doi: 10.1158/0008-5472.CAN-12-3256
66. Basilico C, Pennacchietti S, Vigna E, Chiriaco C, Arena S, Bardelli A, et al. Tivantinib (ARQ197) Displays Cytotoxic Activity That Is Independent of Its Ability to Bind MET. Clin Cancer Res (2013) 19:2381–92. doi: 10.1158/1078-0432.CCR-12-3459
67. Kuenzi BM, Remsing Rix LL, Kinose F, Kroeger JL, Lancet JE, Padron E, et al. Off-Target Based Drug Repurposing Opportunities for Tivantinib in Acute Myeloid Leukemia. Sci Rep (2019) 9:606. doi: 10.1038/s41598-018-37174-6
68. Hinson ARP, Jones R, Crose LES, Belyea BC, Barr FG, Linardic CM. Human Rhabdomyosarcoma Cell Lines for Rhabdomyosarcoma Research: Utility and Pitfalls. Front Oncol (2013) 3:183. doi: 10.3389/fonc.2013.00183
69. Sokolowski E, Turina CB, Kikuchi K, Langenau DM, Keller C. Proof-Of-Concept Rare Cancers in Drug Development: The Case for Rhabdomyosarcoma. Oncogene (2014) 33:1877–89. doi: 10.1038/onc.2013.129
Keywords: rhabdomyosarcoma, NOTCH signaling, MET, soft tissue sarcoma, drug resistance, combination therapy, targeted therapy, γ-secretase
Citation: Perrone C, Pomella S, Cassandri M, Pezzella M, Milano GM, Colletti M, Cossetti C, Pericoli G, Di Giannatale A, de Billy E, Vinci M, Petrini S, Marampon F, Quintarelli C, Taulli R, Roma J, Gallego S, Camero S, Mariottini P, Cervelli M, Maestro R, Miele L, De Angelis B, Locatelli F and Rota R (2022) MET Inhibition Sensitizes Rhabdomyosarcoma Cells to NOTCH Signaling Suppression. Front. Oncol. 12:835642. doi: 10.3389/fonc.2022.835642
Received: 14 December 2021; Accepted: 25 March 2022;
Published: 27 April 2022.
Edited by:
Wen Zhou, Case Western Reserve University, United StatesReviewed by:
Mitsuru Miyachi, Kyoto Prefectural University of Medicine, JapanMonika Ehnman, Karolinska Institutet (KI), Sweden
Copyright © 2022 Perrone, Pomella, Cassandri, Pezzella, Milano, Colletti, Cossetti, Pericoli, Di Giannatale, de Billy, Vinci, Petrini, Marampon, Quintarelli, Taulli, Roma, Gallego, Camero, Mariottini, Cervelli, Maestro, Miele, De Angelis, Locatelli and Rota. This is an open-access article distributed under the terms of the Creative Commons Attribution License (CC BY). The use, distribution or reproduction in other forums is permitted, provided the original author(s) and the copyright owner(s) are credited and that the original publication in this journal is cited, in accordance with accepted academic practice. No use, distribution or reproduction is permitted which does not comply with these terms.
*Correspondence: Rossella Rota, rossella.rota@opbg.net
†These authors have contributed equally to this work and share first authorship
‡These authors have contributed equally to this work and share second authorship