 Baowen Yuan
 Hao Qin
 Jingyao Zhang
 Min Zhang1
 Yunkai Yang
 Xu Teng
 Hefen Yu
 Wei Huang
 Yan Wang
- 1Key Laboratory of Cancer and Microbiome, State Key Laboratory of Molecular Oncology, National Cancer Center/National Clinical Research Center for Cancer/Cancer Hospital, Chinese Academy of Medical Sciences and Peking Union Medical College, Beijing, China
- 2Beijing Key Laboratory of Cancer Invasion and Metastasis Research, Department of Biochemistry and Molecular Biology, School of Basic Medical Sciences, Capital Medical University, Beijing, China
Introduction: Recent research has confirmed the critical role that epigenetic factors play in regulating the immune response. Nonetheless, what role m6A methylation modification might play in the immune response of non-small cell lung cancer (NSCLC) remains vague.
Methods: Herein, the gene expression, copy number variations (CNVs), and somatic mutations of 31 m6A regulators in NSCLC and adjacent control samples from the GEO and TCGA databases were comprehensively explored. Using consensus clustering, m6A modification patterns were identified. Correlations between m6A modification patterns and immune cell infiltration traits in the tumor immune microenvironment (TME) were systematically analyzed. Differentially expressed genes were verified and screened by random forest and cox regression analysis by comparing different m6A modification patterns. Based on the retained gene panel, a risk model was built, and m6Ascore for each sample was calculated. The function of m6Ascore in NSCLC prognosis, tumor somatic mutations, and chemotherapy/immunotherapy response prediction were evaluated.
Results: Consensus clustering classified all NSCLC samples into two m6A clusters (m6A_clusterA and m6A_clusterB) according to the expression levels of 25 m6A regulator genes. Hierarchical clustering further divides the NSCLC samples into two m6A gene clusters: m6AgeneclusterA and m6AgeneclusterB. A panel of 83 genes was screened from the 194 differentially expressed genes between m6A gene clusters. Based on this, a risk score model was established. m6A modification clusters, m6A gene clusters, and m6Ascore calculated from the risk model were able to predict tumor stages, immune cell infiltration, clinical prognosis, and tumor somatic mutations. NSCLC patients with high m6Ascore have poor drug resistance to chemotherapy drugs (Cisplatin and Gemcitabine) and exhibit considerable therapeutic benefits and favorable clinical responses to anti-PD1 or anti-CTLA4 immunotherapy.
Discussion: In conclusion, methylation modification patterns mediated by the m6A regulators in individuals play a non-negligible role in prognosis prediction and immunotherapy response, which will facilitate personalized treatment and immunotherapeutic strategies for NSCLC patients in the future.
Introduction
As the second most frequent malignant oncologic disease worldwide, lung cancer accounts for the greatest number of mortality (1). 85% of lung cancers are non-small cell lung cancers (NSCLC). Due to the majority of NSCLC patients being diagnosed at an advanced stage, its overall 5-year survival rate is only 8% (2). Therefore, new approaches are urgently required to explore novel mechanisms of NSCLC that are susceptible to therapeutic inventions. Recent research has shown that tumor immune microenvironment (TME) immune cell infiltrating characteristics are closely correlated with m6A modifications, which might provide an alternative choice (3–5). N6-methyladenosine (m6A) RNA modification is the most prevalent kind of RNA modification in eukaryotic cells. It is essential for the regulation of epigenetic processes, a variety of physiological functions, and the development of disease (4, 6, 7).
Methyltransferases, also known as “writers”, promote m6A methylation modification in RNA; demethylases, also known as “erasers”, remove m6A methyl groups from RNA; and binding proteins, also known as “readers”, bind to the m6A methylation site in RNA and perform specific biological functions. Three types of proteins regulate the dynamic and reversible process of m6A modification (7, 8). Comprehending the functions of m6A modification in post-transcriptional regulation would be more accessible by comprehensively exploring the expression and function of m6A regulatory proteins (9, 10). The development of malignant tumors and immunomodulatory disorders are correlated with dysregulated expression and genetic alterations of m6A regulator genes (10–12), demonstrating that m6A regulators may be crucial in regulating the immunological microenvironment of malignancies.
An increasing number of research have revealed the relationships between m6A modifications and the immune cell infiltrating characteristics of the TME (3–5). Wang et al. reported that dendritic cell activation and maturation were aided by METTL3-mediated m6A modification. Co-stimulatory molecules CD80 and CD40 are expressed less when METTL3 is knocked out (13). Studies suggest the vital role of TME in cancer progression and therapeutic responses with increasing evidence (14, 15). The immune response and the benefit of chemotherapy are reflected in the TME context that was established at diagnosis (15, 16). Clinical outcomes in various cancers are correlated with changes in the compositions of CD8 and CD4 positive T cells, macrophages, and cancer-associated fibroblast infiltration in the TME (17, 18).
The immune checkpoint blockade (ICB) therapy, which specifically targets the cytotoxic T lymphocyte antigen 4 (CTLA-4) and programmed cell death 1 (PD-1) or its ligands (PD-L1), has been used for cancer immunotherapy and has shown promising clinical results (19). Only a small portion of patients, nevertheless, might benefit from ICB treatment. Thus, exploring the TME and its associated mechanisms is urgently needed to improve immunotherapy’s efficacy. As was previously stated, the microenvironment of malignancies and immune cells are closely correlated with m6A modifications. Therefore, our comprehension of immunological regulation in the TME and immunotherapeutic tactics development will be enhanced by fully exploiting the effects of the regulatory network of RNA m6A modification enzymes on TME cells.
By thoroughly analyzing the gene expression profile of m6A regulators in 1558 NSCLC samples, the present study could distinguish different m6A modification patterns. We systematically correlated the characteristics of TME cell infiltration with genomic traits as well as the clinical and pathologic characteristics of NSCLC. We estimated the patterns of TME infiltration in 1,558 NSCLC samples. Further, a risk model was constructed based on a panel of 83 genes with differential expression, and m6Ascore was calculated for each sample. Consequently, we developed a method for quantifying the m6Ascore and found that it is a robust prognostic biomarker and a significant predictor of response to chemotherapy (Cisplatin and Gemcitabine) and immunotherapy (anti-PD1 or anti-CTLA4 immunotherapy).
Materials and methods
Data collection and pre-processing
The study’s workflow is depicted in Figure S1. TCGA Gene expression data, genomic mutation data (including somatic mutation and copy number variation), and corresponding clinical data of NSCLC samples were downloaded from UCSC Xena (https://xenabrowser.net/datapages/). From the NCBI GEO database (https://www.ncbi.nlm.nih.gov/geo/), two additional datasets of NSCLC samples were downloaded. This project gathered 1705 samples in total, including TCGA-LUAD (N=568), TCGA-LUSC (N=545), GSE68465 (N=462), and GSE4573 (N=130) datasets (Table S1). Table S2 provides a summary of the clinical details of these samples. Table S3 lists the clinical details of each sample from TCGA dataset. Among the 1579 NSCLC samples, survival status and survival time are available for 1558 samples. Transcripts per kilobase million (TPM) values were generated from FPKM values of RNA sequencing data downloaded from TCGA. The raw “CEL” files for the Affymetrix-produced GEO microarray data were downloaded. R packages “affy” and “simpleaffy” were employed to adjust the background and perform quantile normalization. The ComBat function from the “SVA” R package was used to remove the batch effect between TCGA and GEO datasets and the integrated data after removing the batch effect is provided in Table S4. The genomic mutation status of NSCLC patients from the TCGA database was displayed in an oncoplot generated with the R package “maftools”.
Unsupervised consensus clustering of 25 m6A regulators
A total of 31 m6A regulators were gathered from the papers on m6A methylation modification. Due to the lacking of six m6A regulator genes (IGF2BP1, KIAA1429, METTL16, METTL14, ALKBH5, and RBMX) in GEO datasets, the remaining 25 m6A regulators were curated, including seven writers (METTL3, WTAP, RBM15, RBM15B, CBLL1, ZC3H13, and ZCCHC4), one eraser (FTO), 15 readers (YTHDF1, YTHDF2, YTHDF3, YTHDC1, YTHDC2, IGF2BP2, IGF2BP3, EIF3A, HNRNPA2B1, HNRNPC, FMR1, LRPPRC, ELAVL1, PRRC2A, and SND1), and two repellers (G3BP1 and G3BP2). Unsupervised consensus clustering was carried out using the expression levels of 25 m6A regulator genes to discriminate different m6A modification patterns with the R package “ConsensusClusterPlus”, which is based on a computational method called consensus clustering (20). Consensus Cumulative Distribution Function (CDF) and Delta area (relative change of area under the CDF curve) were used to select the proper clustering numbers within the high-throughput RNA-seq data. We use the parameters of a maximum evaluated k of 20, an 80% resampling rate, 1000 iterations, and Euclidean distance to determine the optimal number of clusters and to guarantee robustness.
Gene set variation analysis (GSVA) and functional annotation
Using the R package “GSVA”, gene set variation analysis (GSVA), an unsupervised and non-parametric method, was used to compute the pathway enrichment scores in order to explore the biological process variations among different m6A modification patterns (21). To conduct GSVA analysis, the well-defined KEGG gene sets of “c2.cp.kegg.v6.2.symbols” were downloaded from the MSigDB database (https://www.gsea-msigdb.org/gsea/index.jsp). Gene set enrichment analysis with a cutoff value of false discovery rate (FDR) < 0.01 was used to examine biological processes correlated with m6A regulators using the R package “clusterProfiler”.
Immune cell infiltration estimation
The single-sample gene-set enrichment analysis (ssGSEA) function from the R package “GSVA” was used to estimate the levels of immune cell infiltration. ssGSEA evaluates a specific gene set, including the gene expression data of 28 immune cells that represent different immune cell types, immune-related functions, and pathways in NSCLC (22). The enrichment scores representing the relative level of immune cell infiltration were compared between samples that belong to different m6A clusters by the Wilcox test. To illustrate their prognostic values, significantly different immune cells between m6A clusters were further analyzed by cox regression and visualized by the R package “forestplot”.
Identification of differentially expressed genes (DEGs) between distinct m6A clusters
Differential expression analysis was carried out using the R package “limma”, an empirical Bayesian approach, to identify DEGs associated with m6A (23). Genes with adjusted p < 0.05 (Benjamini-Hochberg adjustment) and |fold change| > 1.5 in expression were regarded as DEGs. Hierarchical cluster analysis was used to divide NSCLC patients into genomic clusters based on the DEGs. We used a bottoms-up approach called agglomerative clustering, in which the data points were initially isolated as separate groups and then merged iteratively based on similarity until one cluster had been formed. The similarity was measured with Ward’s linkage, namely the Euclidean distance between two clusters was defined by the increase in the sum of squared after the clusters were merged.
Dimension reduction and generation of m6A gene signatures
For all the identified differentially expressed genes between m6A clusters, the supervised machine learning algorithm random forest was applied for dimensionality reduction. After removing the redundant genes, the remaining genes more relevant to m6A modification went through survival analysis with the R package “Survminer”. Genes with significant survival results (p < 0.05) were added to a Cox regression model in further analysis. To explore the similarity between gene expression profile and prognosis efficiency, the m6A score was introduced. The m6A score was defined refer to the definition of gene expression grade index (GGI) (24), and the formula is as follows:
Where scale represents the transformation parameter of standardization and X and Y are the expression of gene sets with positive and negative Cox coefficients, respectively. The optimal cutoff value was computed using the surv-cutpoint function from the “survival” R package. All samples were subsequently stratified into m6Ascore-high and m6Ascore-low subgroups, and their relationships with prognosis were evaluated as well.
Correlation between m6A score and other pertinent biological processes
Mariathasan et al. have constructed a collection of genes to store genes related to a sort of biological processes, including Angiogenesis; CD8 T effector; Antigen processing machinery; Cell cycle; Cell cycle regulators; KEGG discovered histones; DNA damage repair; DNA replication; Fanconi anemia; FGFR3-related genes; Homologous recombination; Immune checkpoint; EMT1, EMT2, and EMT3 epithelial-mesenchymal transition (EMT) markers; Mismatch repair; Nucleotide excision repair; Pan-F-TBRS; WNT target (25). GSVA was used to quantify the above-mentioned biological processes in each sample with an enrichment score. Pearson correlation analysis was carried out between m6Ascore and enrichment score to reveal the relationship between m6Ascore and certain associated biological pathways.
Copy number variation (CNV) analysis
The Genomic Identification of Significant Targets in Cancer (GISTIC) method was used to identify the common CNV regions across all samples with TCGA Copy Number Segment data. The significance threshold of GISTIC was: False Discovery Rate (FDR), namely q-value ≤ 0. 05. The peak region for each significant region was identified with a confidence interval of 0.95. The GISTIC analysis made use of the MutSigCV module from GenePattern, an online analysis tool provided by the Broad Institute (https://cloud.genepattern.org/gp/pages/index.jsf).
Half maximal inhibitory concentration (IC50) prediction and tumor immune dysfunction and exclusion (TIDE) analysis
In order to predict the clinical chemotherapeutic response from tumor gene expression profiles, the IC50 values of clinical drugs (Cisplatin, Gemcitabine) were estimated using the R package “pRRophetic” (26). Then IC50 values between high m6Ascore samples and low m6Ascore samples were compared. In addition, signatures of T cell dysfunction and exclusion were analyzed using the online algorithm TIDE (http://tide.dfci.harvard.edu/) to predict the cancer immunotherapy response to immune checkpoint blockade (ICB) (27). A higher TIDE prediction score indicates a poor prognosis and a poor response to ICB therapy.
NSCLC cell line m6A score calculation and chemotherapy drug IC50 validation
The Cancer Cell Line Encyclopedia was used to download the gene expression data for NSCLC cell lines (CCLE: https://sites.broadinstitute.org/ccle/). The m6A score for each cell line was calculated using the m6Ascore formula. NSCLC cell lines were stratified into m6Ascore-high and m6Ascore-low groups based on the cutoff value. Genomics of Drug Sensitivity in Cancer (GDSC: https://www.cancerrxgene.org/) provided information on the drug sensitivity of the chemotherapeutic drugs Cisplatin and Gemcitabine. In general, a dose titration of Cisplatin and Gemcitabine (6 nM-6 μM for Cisplatin; 0.1 nM-0.1 μM for Gemcitabine) was administered to STRs-verified cell lines for 72 hours in culture media after they had been seeded in 96-well plates and grown for 24 hours at 37°C in 5% CO2. Cell viability was determined using either a metabolic test (Resazurin or CellTiter-Glo) or DNA dye (Syto60). Every screening plate was put through rigorous quality control procedures. GraphPad Prism 9 software was used to calculate the IC50 of Cisplatin and Gemcitabine in NSCLC cell lines and to generate dose-response curves.
Statistical analysis
The Wilcoxon test was used to determine whether scores between the two sample groups were statistically significant. The log-rank test from the R package “Survminer” was used to assess the statistical significance between the prognostic survival curves, which were generated using the Kaplan-Meier method. The prediction performance of immunotherapy by m6Ascore was assessed using the receiver operating character (ROC) curve, and the area under the ROC curve (AUC) was computed using the R package “pROC”. Patients with high and low m6Ascores had different mutational landscapes, which were visualized using the “maftools” R package.
Results
Genetic and transcriptional alteration landscapes of four types of RNA m6A methylation regulators in NSCLC
Table S5 lists the 31 RNA m6A modification regulators that were used in this study, which included ten methyltransferases “writers”, two demethylases “Erasers”, 17 RNA binding proteins “Readers”, and two “Repellers”. We first summarized the occurrence frequency of somatic mutations and copy number variations in 31 m6A regulator genes in TCGA NSCLC samples. Specifically, ZC3H13 and KIAA1429 had the greatest mutation frequency, reaching 4%. The most frequent mutation type was missense mutation (Figure 1A). Copy number variation (CNV) frequency analysis showed that copy numbers were generally changed among 31 regulatory factors. Copy number amplification commonly occurred in genes such as IGF2BP2, KIAA1429, and YTHDC1, while copy number deletion commonly occurred in genes such as RBM15, YTHDF2, and ZC3H13 (Figure 1B, Table S6). According to the expression of these 31 m6A regulator genes, principle component analysis could differentiate TCGA NSCLC samples from adjacent normal samples (Figure 1C). Gene expression analysis of 31 m6A regulators between TCGA NSCLC samples and adjacent control samples showed that most regulator genes were significantly overexpressed in NSCLC tissues, especially reader genes (IGF2BP1, IGF2BP2, and IGF2BP3) from the IGF2BPs family (Figure 1D).
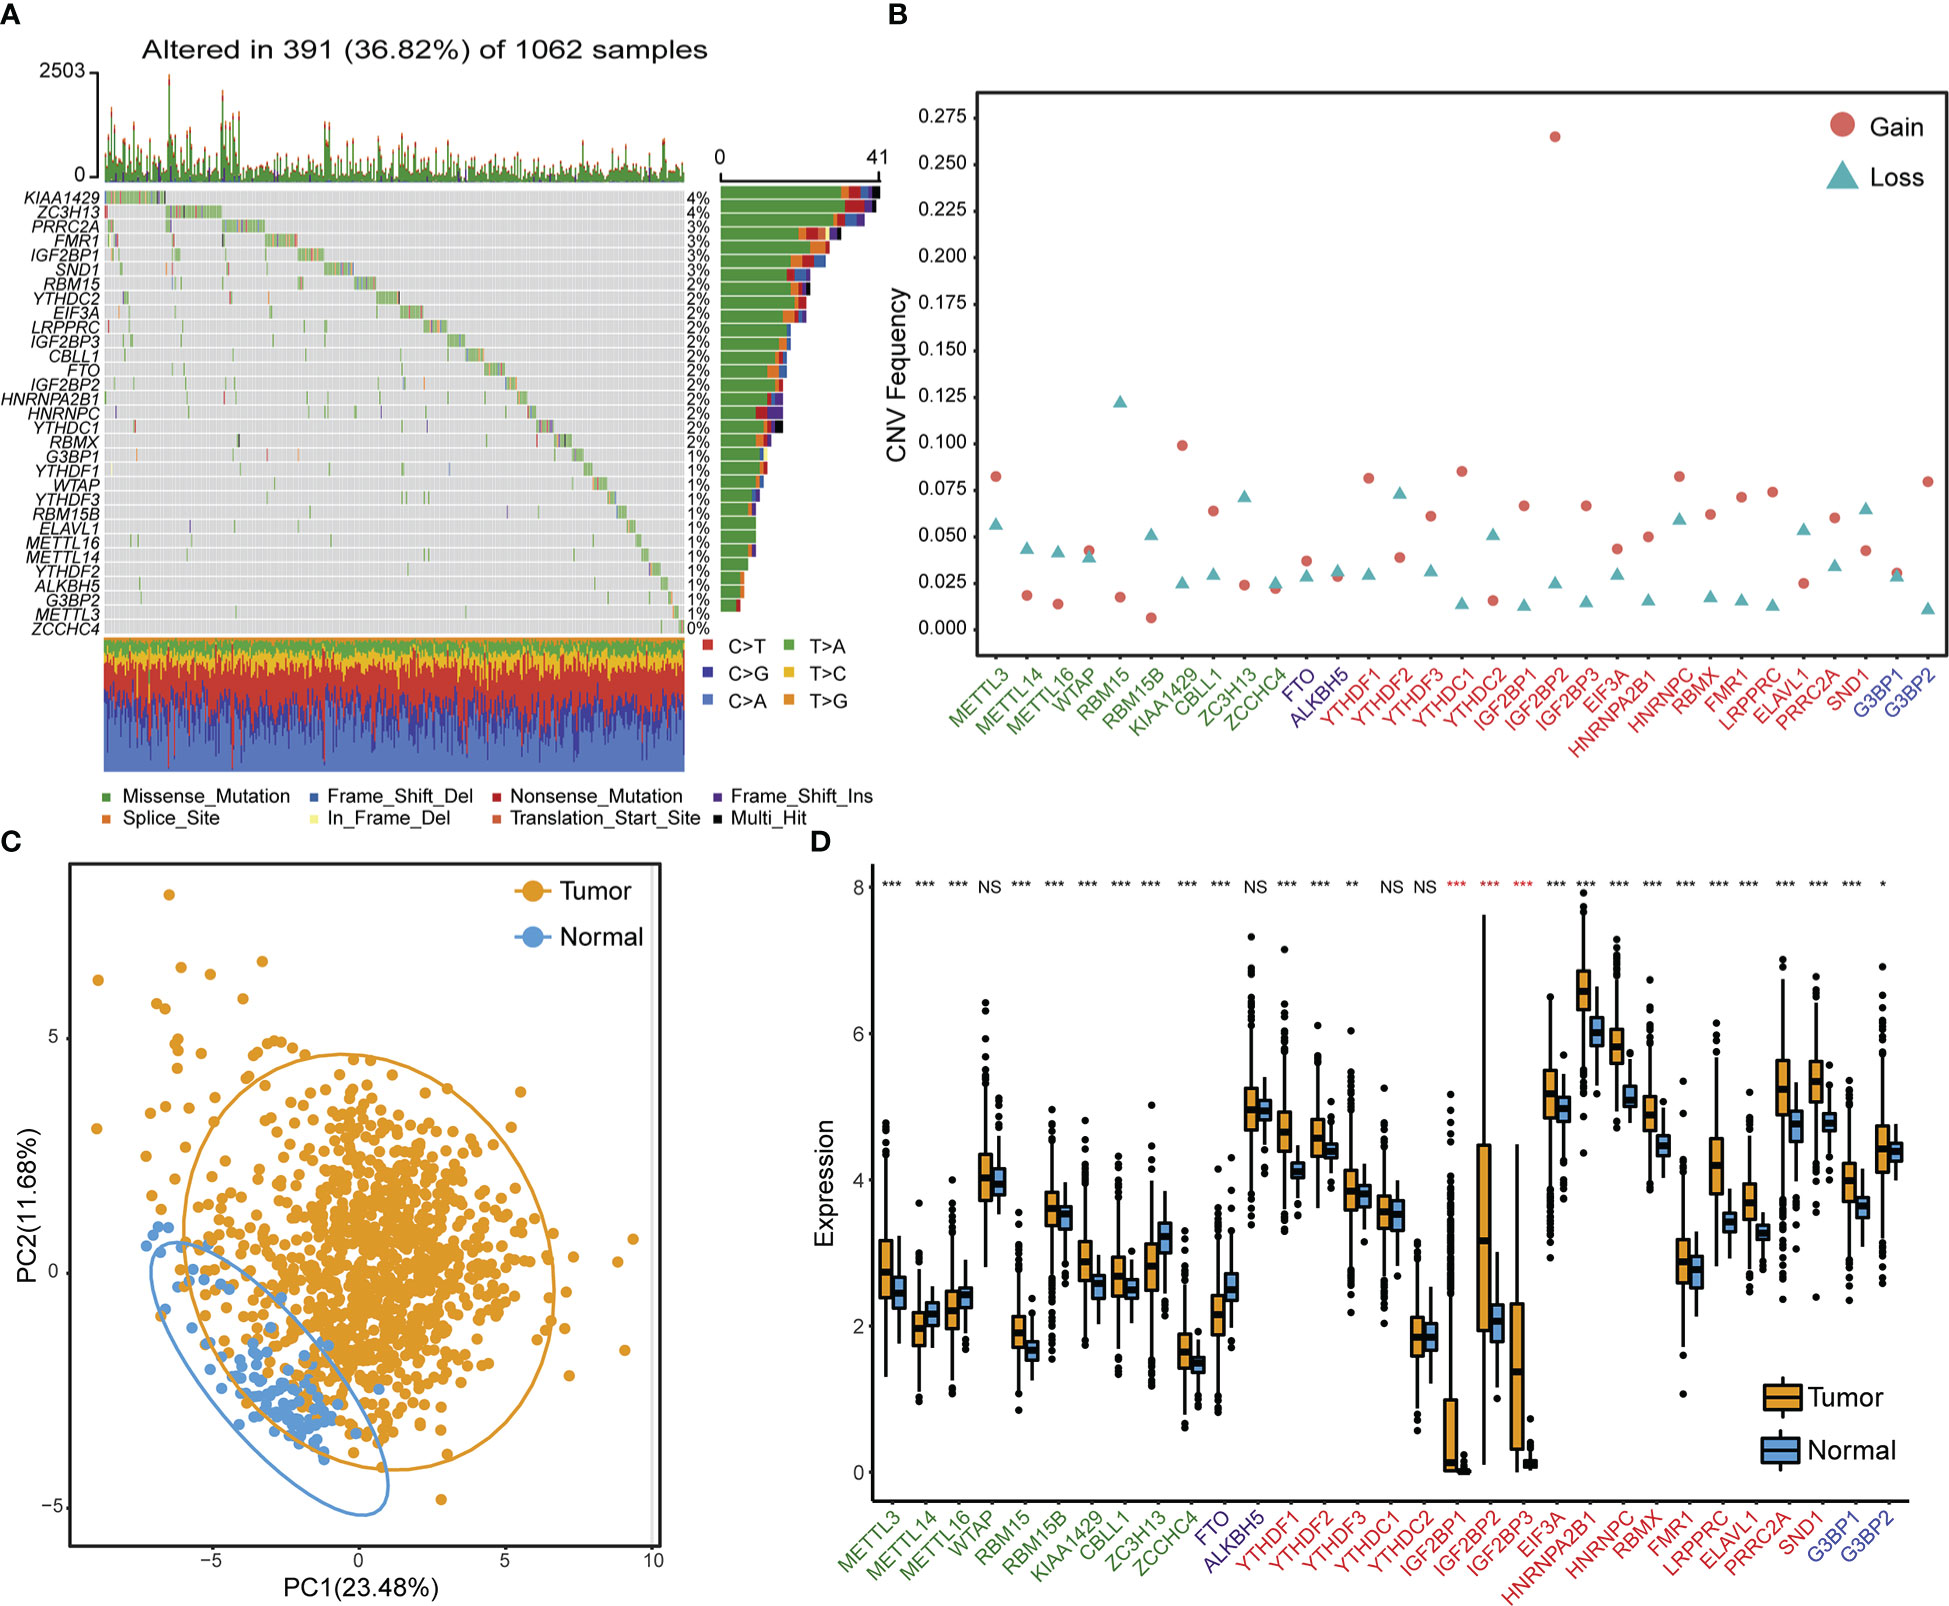
Figure 1 Genetic and transcriptional variation landscapes of RNA m6A modification regulator genes in the TCGA dataset. (A) The frequency of mutations and the distribution of mutation types of m6A regulator genes in NSCLC tissue samples. (B) The frequency of m6A regulator gene copy number variation in NSCLC tissue samples. Blue triangles denote deletion and red dots denote amplification. (C) Principle component analysis results to distinguish NSCLC samples from adjacent normal tissues based on the expression of m6A regulator genes. (D) The expression profile of m6A regulator genes in cancer samples and adjacent normal samples. Asterisks in red indicate genes belonging to the IGF2BPs family. NS p > 0.05; *p < 0.05; **p < 0.01; ***p < 0.001.
Unsupervised clustering of m6A regulator genes
An m6A regulatory network was constructed for 1557 NSCLC samples with expression data and survival information available to describe the spearman correlations within m6A regulator genes and the correlations between m6A regulator genes and NSCLC prognosis (Figure 2A). Results suggested that different m6A modification patterns might be significantly influenced by interactions between different functional types of m6A regulators. Due to the absence of IGF2BP1, KIAA1429, METTL16, METTL14, ALKBH5, and RBMX expression data in GEO datasets, the remaining 25 m6A regulator genes were included for consensus clustering. Two subgroups were identified using unsupervised consensus clustering, and their respective names were m6A_clusterA and m6A_clusterB (Figure 2B). Biological pathway differences between two m6A clusters were identified using GSVA enrichment analysis. m6A_clusterA significantly enriched metabolic-related biological processes like fatty acid metabolism and tryptophan metabolism, while m6A_clusterB considerably enriched replication- and transcription-related biological pathways such as DNA repair and mismatch repair (Figure 2C, Table S7). The two m6A clusters also had significantly different prognoses, as demonstrated by the Kaplan-Meier curve of overall survival (p = 0.007) (Figure 2D).
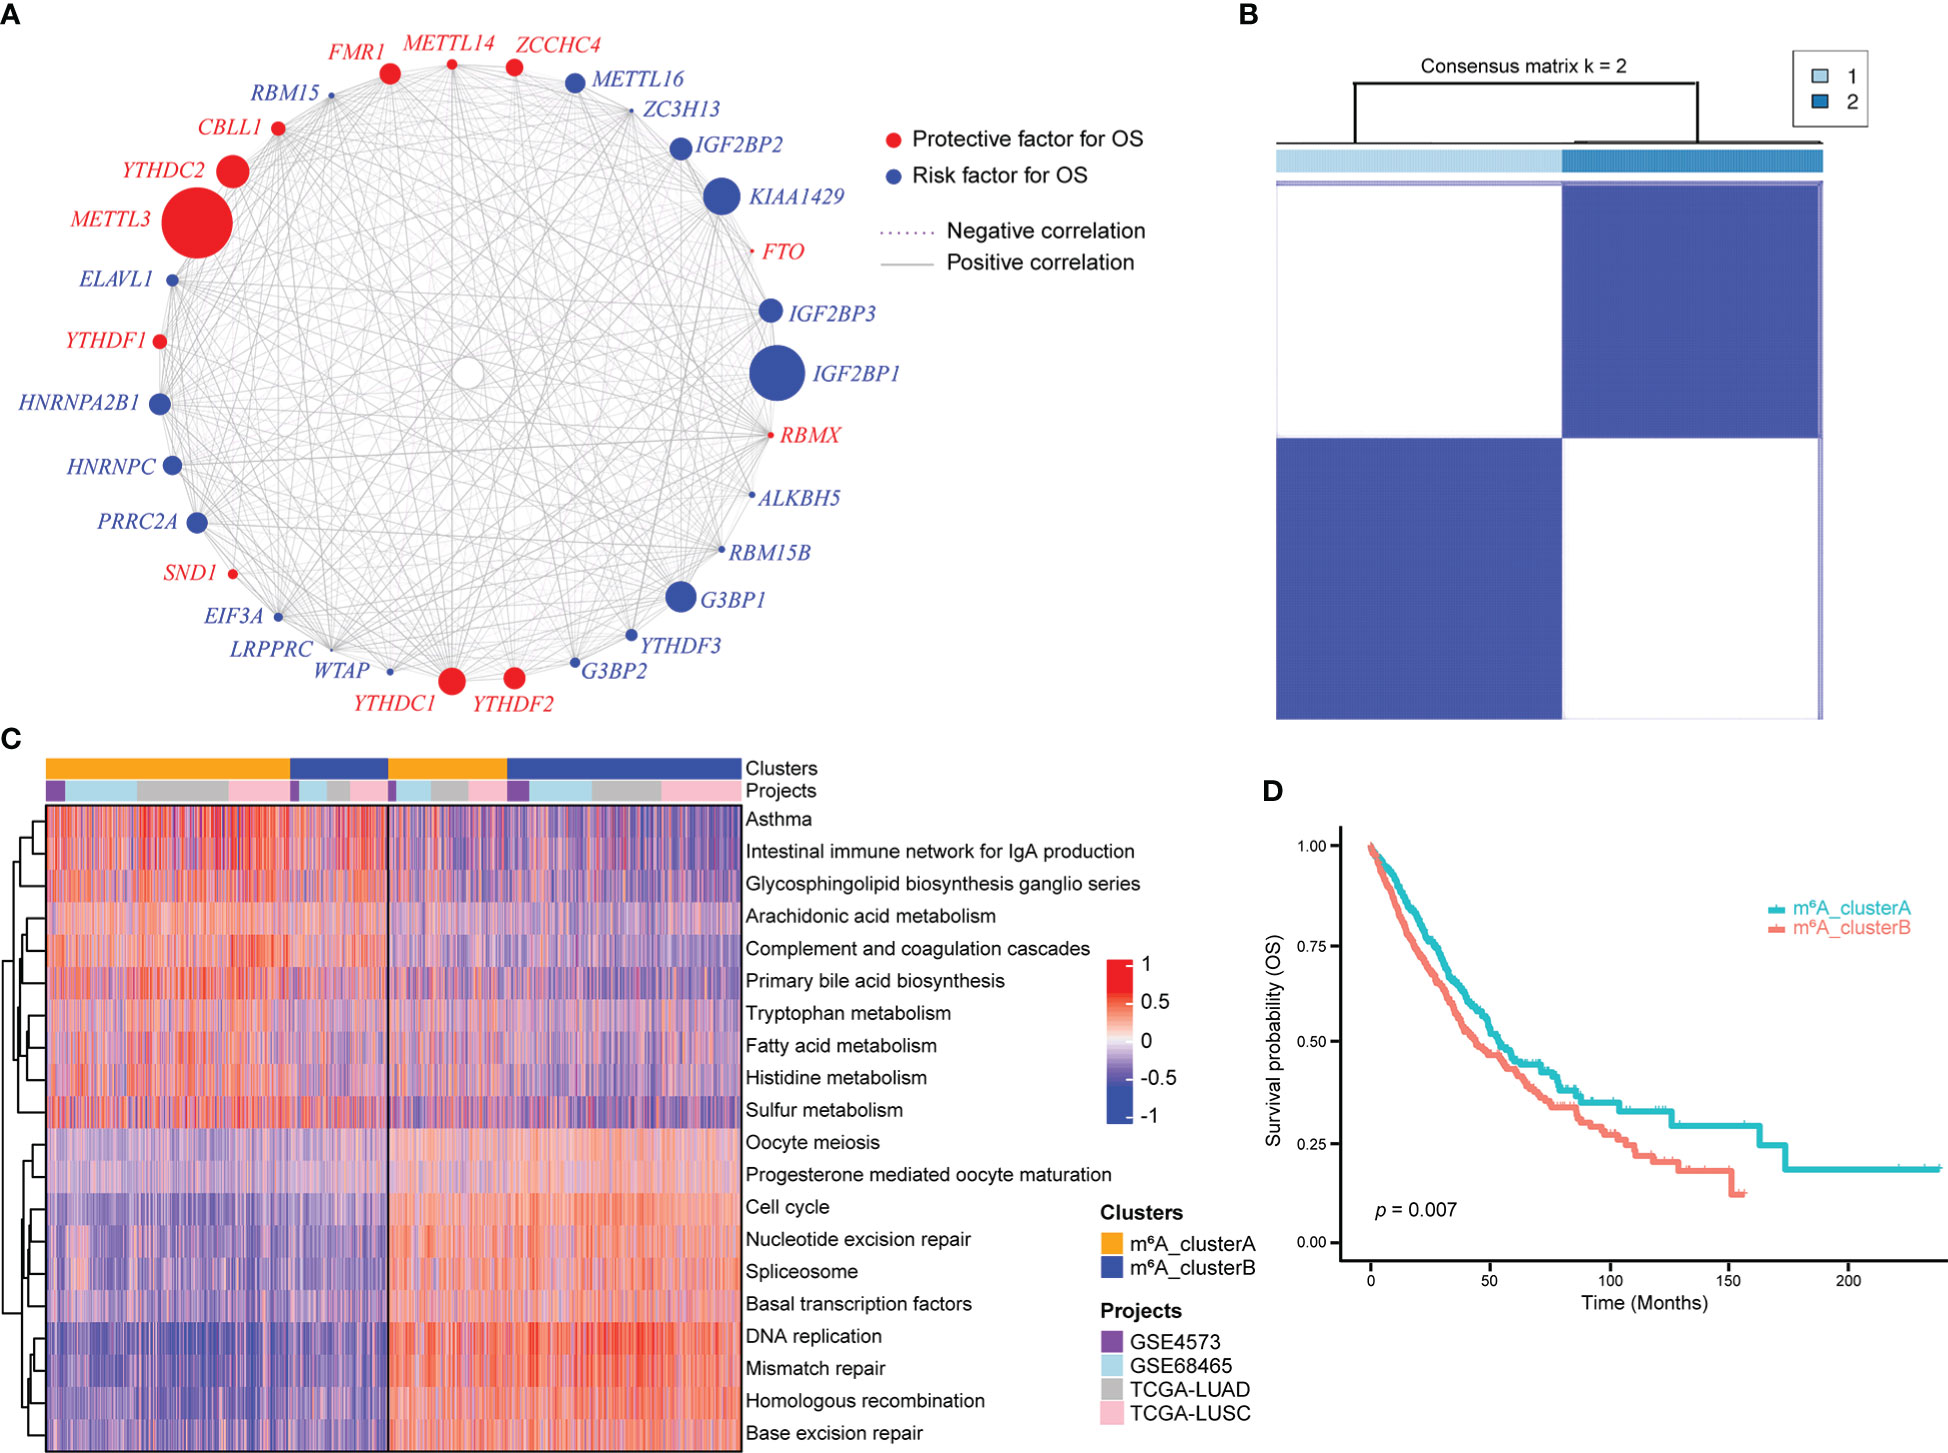
Figure 2 m6A regulator genes unsupervised clustering in NSCLC samples. (A) m6A regulator gene interactions in NSCLC. The circle size reflects how each gene affects the ability to predict survival. The stronger the association between gene expression and prognosis, the larger the circle. The red circle indicates prognostic protective factors and the blue circle indicates prognostic risk factors. The spearman correlations between genes are linked by lines connecting them, with positive correlations denoted by solid grey lines and negative correlations by purple dotted lines. The interaction strength between m6A regulators determines line thickness. (B) Consensus clustering of m6A regulator genes, 1 and 2 represent two subgroups. (C) GSVA enrichment analysis revealed the activation state of biological pathways with distinct m6A clusters. The heatmap was used to depict these biological processes, with red indicating activation and blue indicating inhibition. (D) Two m6A clusters showed a significant survival differences, as depicted in the Kaplan-Meier curve.
The heatmap of 25 m6A regulator genes, which was classified by two m6A clusters, showed the relationship between the expression level and matching clinical information, such as cancer type, smoking indicator, stage, sex, and age. The distribution of clinical information between the two m6A clusters does not significantly differ. Notably, NSCLC patients in m6A_clusterB were more likely to express the IGF2BPs family, including IGF2BP2 and IGF2BP3 (Figure 3A). Among the most common gene mutations in people with NSCLC, we analyzed the mutation status of nine genes: EGFR, ALK, ROS1, BRAF, KRAS, CD274, MET, RET, and ERBB2. Results showed that only the mutation status of KRAS (p = 7.74e-05) and RET (p = 0.015) were significantly different between m6A_clusterA and m6A_clusterB, while the other seven genes were not significant (Chi-square test, p > 0.05). Excluding KRAS, NSCLC samples without the above-mentioned gene mutations are more in m6A_clusterA than in m6A_clusterB (Figure 3B). Furthermore, to illustrate the impact of m6A regulators on immune cell infiltration, ssGSEA was conducted based on the sample expression data and obtained the proportion distribution of 28 immune cell types in two different m6A clusters of NSCLC samples (Figure 3C). Results showed that 22 of 28 immune infiltration cells had differential expression between the two m6A clusters and most of them were highly expressed in m6A_clusterA, except for activated CD4 T cells and memory B cells, which were highly expressed in m6A_clusterB (Figure 3C, Table S8). This suggests that m6A_clusterA has an immune microenvironment that is hot and suppressive. For the 22 differentially expressed immune infiltration cells, univariate Cox regression analysis revealed that activated CD4 T cells (p = 0.0085), monocytes (p = 0.024), and activated B cells (p = 0.0212) were significantly associated with the prognosis of two m6A clusters (Figure 3D, Table S9).
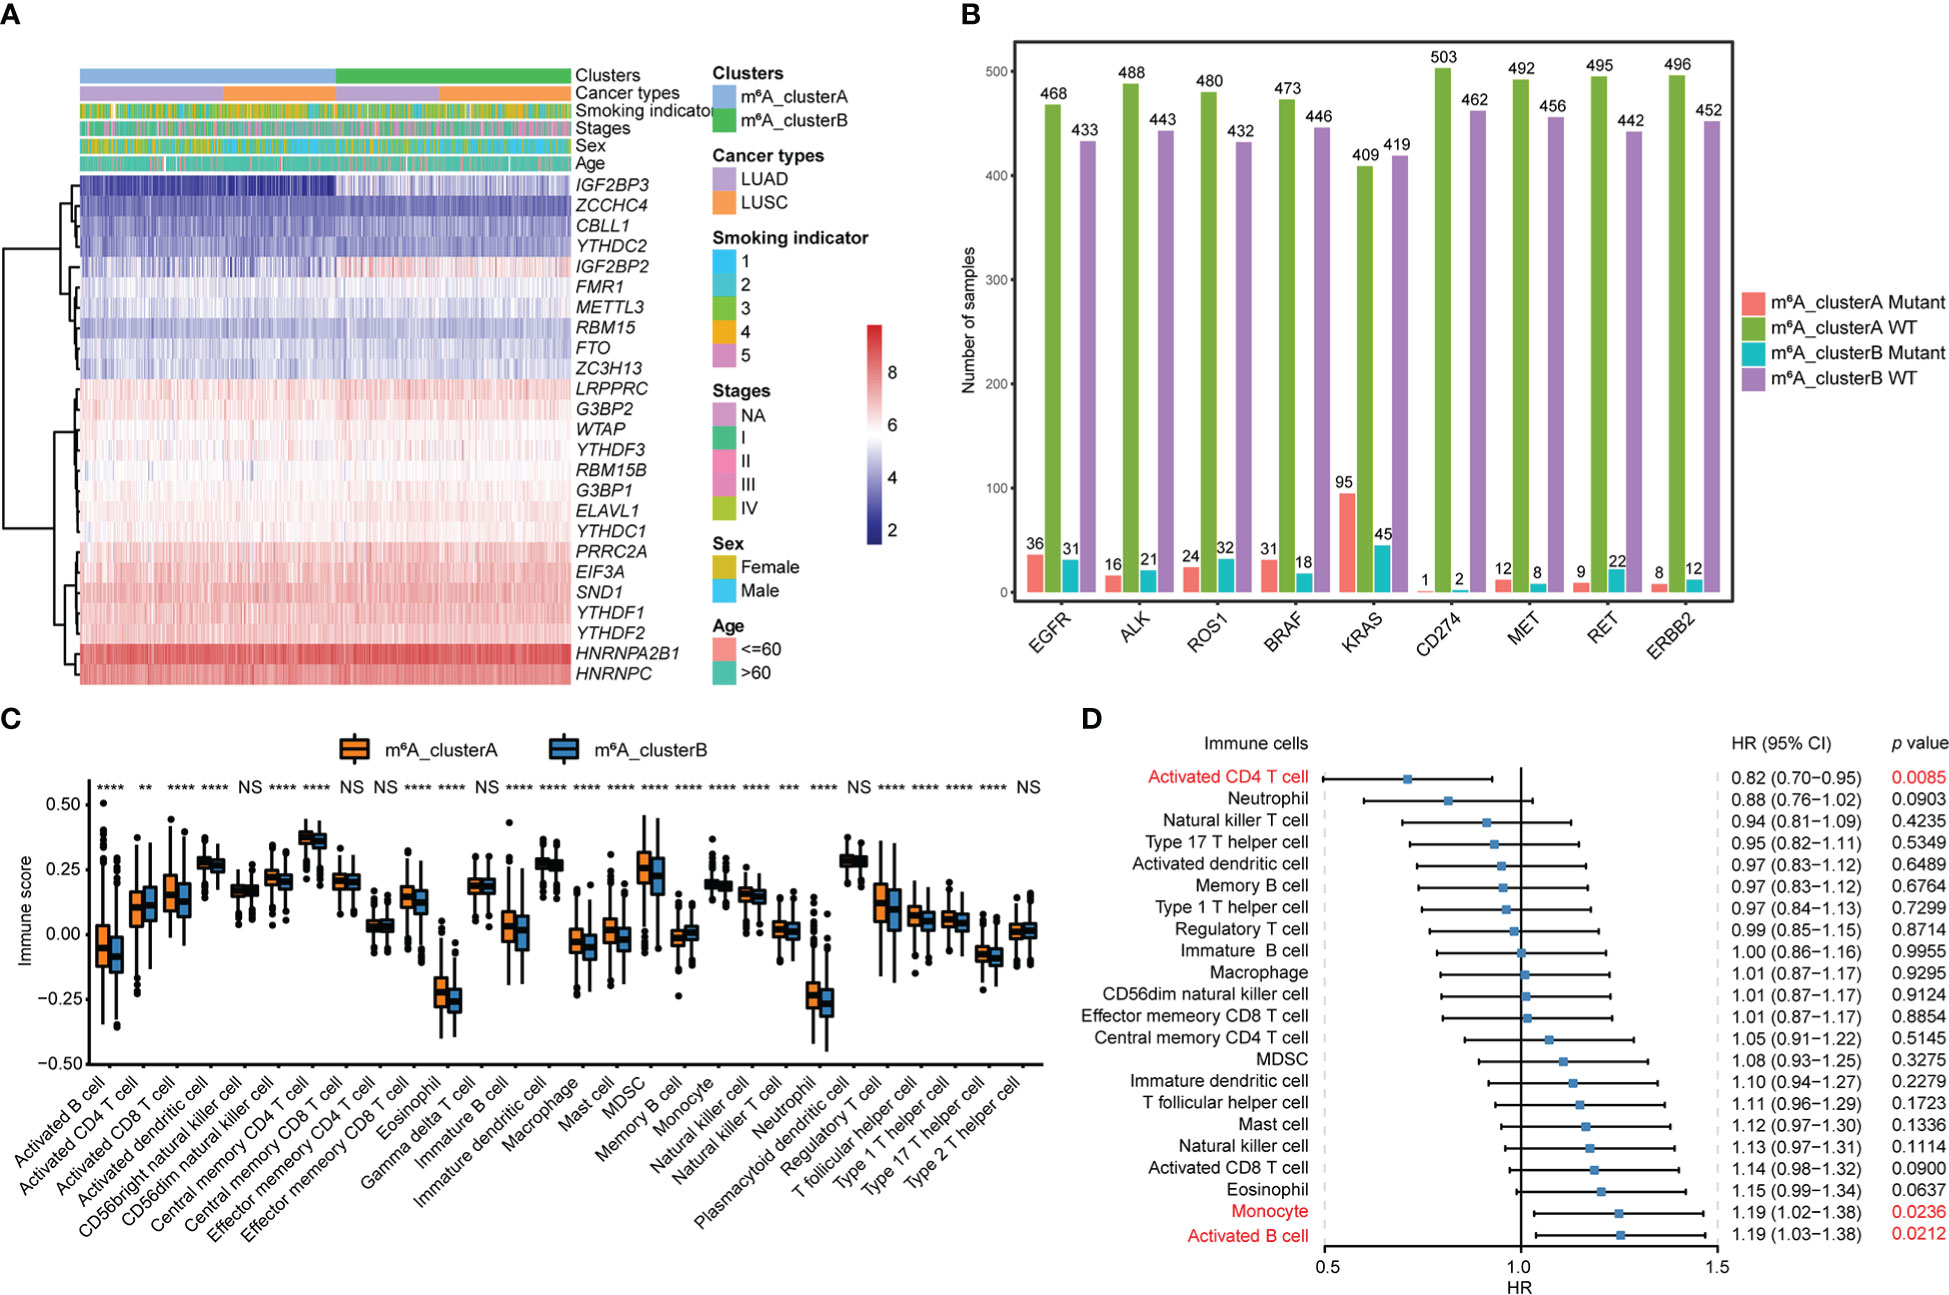
Figure 3 Transcriptome characteristics and immune cell infiltration features in two m6A regulator gene clusters. (A) The expression pattern of the m6A regulator genes between the two m6A clusters that matched the clinical information, including cancer type, smoking indicator, stage, sex, and age. (B) The nine most common gene mutation statuses in NSCLC. (C) The boxplot shows the abundance of 28 infiltrating immune cells among the two m6A clusters. NS p > 0.05; **p < 0.01; ***p < 0.001; ****p < 0.0001. (D) Forest plots of hazard ratios (HRs) for 22 immune infiltration cells associated with OS and meaningful immune cells were marked in red (p < 0.05).
Identification of m6A signature genes
Using the R package “limma”, 194 m6A phenotype-related differentially expressed genes between m6A clusters were identified in order to explore the probable biological functions of each m6Acluster (Table S10). Unsupervised hierarchical cluster analysis has classified the NSCLC patients into two genomic clusters, termed m6A_gene_clusterA and m6A_gene_clusterB, which are roughly in accordance with the m6A modification pattern, based on the expression of the 194 differentially expressed genes (Figure 4A, Table S11). The log-rank test and Kaplan-Meier curve indicate that the genomic phenotypes of m6A modification were significantly related to OS in NSCLC patients and patients in m6A_gene_clusterB had better prognoses (Figure 4B, p = 0.0014). Among the 25 m6A regulator genes, 17 were significantly more abundantly expressed in m6A_gene_clusterA than in m6A_gene_clusterB, while three were significantly highly expressed in m6A_gene_clusterB (Figure 4C).
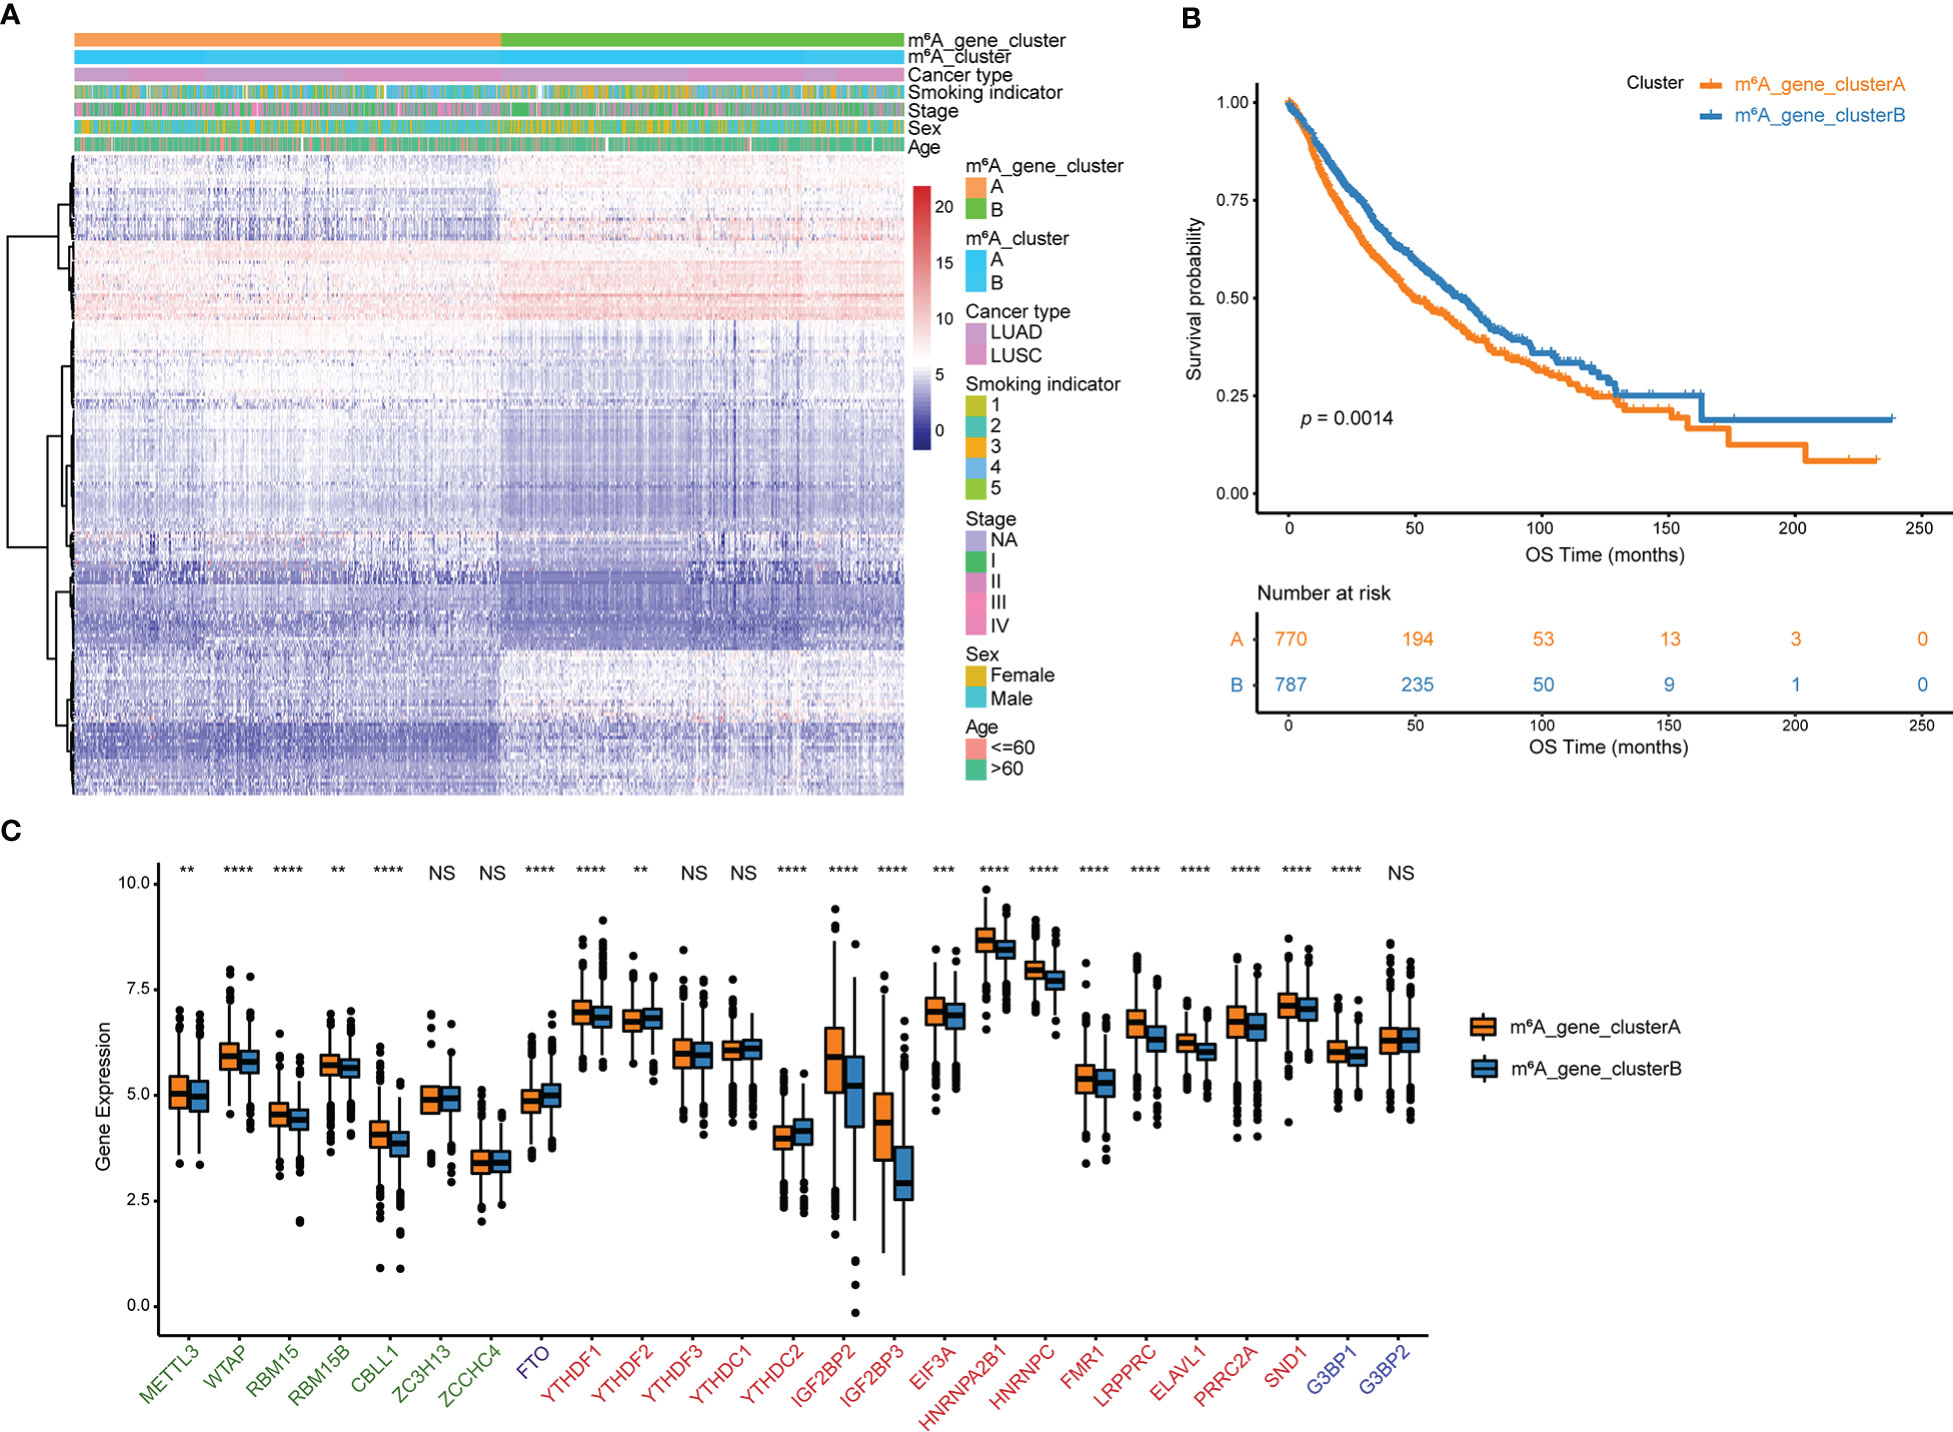
Figure 4 Genes that differ in expression are associated with m6A. (A) Unsupervised analysis and hierarchical clustering of differentially expressed genes associated with the m6A phenotype to divide NSCLC patients into two genomic groups.Patient annotations include m6A cluster, cancer type, smoking indicator, stage, sex, and age. (B) Kaplan-Meier curve depicts the association between m6A modification genomic phenotypes and OS. (C) The two m6A gene clusters’ expression of 25 m6A regulator genes. NS p > 0.05; **p < 0.01; ***p < 0.001; ****p < 0.0001.
Clinical and transcriptome features of m6A-related phenotypes
Among the 194 differentially expressed genes derived from the previous analysis, redundant genes were removed using the random forest algorithm, leaving 83 feature genes that were most closely related to the m6A relationship between these genes and NSCLC patient survival. These 83 genes were classified into two groups, a positive group with 30 genes and a negative group with 53 genes, based on the coefficient value of genes obtained from the Cox regression (Table S12). According to the m6Ascore formula, m6A scores for all samples were calculated and the best cutoff of m6Ascore (cutoff = -0. 7437558) was established by the “surv_cutpoint” function of the R package to classify NSCLC samples into m6Ascore high and low groups (Figure 5A, Table S13). Results of the survival analysis demonstrated that the m6Ascore might accurately characterize the prognosis of NSCLC patients (p < 0.0001), with the m6Ascore_low group has a good prognosis while the m6Ascore_high group has a bad prognosis (Figure 5B). To better depict the function of m6Ascore, GSVA was performed with known gene signatures. A significant positive correlation between m6Ascore and biological processes, including the cell cycle and DNA replication, has been found using pearson correlation analysis. In contrast, the correlation between m6Ascore and other biological processes, such as angiogenesis and EMT3, is significantly negative (Figure 5C, Table S14). m6Ascores between m6A clusters and between m6A gene clusters were compared using the Wilcox test. Results showed that m6A_clusterA had a substantially lower m6Ascore than m6A_clusterB, while m6A_gene_clusterA had a significantly higher m6Ascore than m6A_gene_clusterB (Figure 5D). Furthermore, as shown in Figure S2, there are significant differences in m6Ascores across several clinical categories, including EGFR mutation status, age, and sex (Figures S2A, B). Additionally, in both the TCGA and GEO datasets, NSCLC patients with high and low m6Ascores had significantly different overall survival probabilities (Figure S2C).
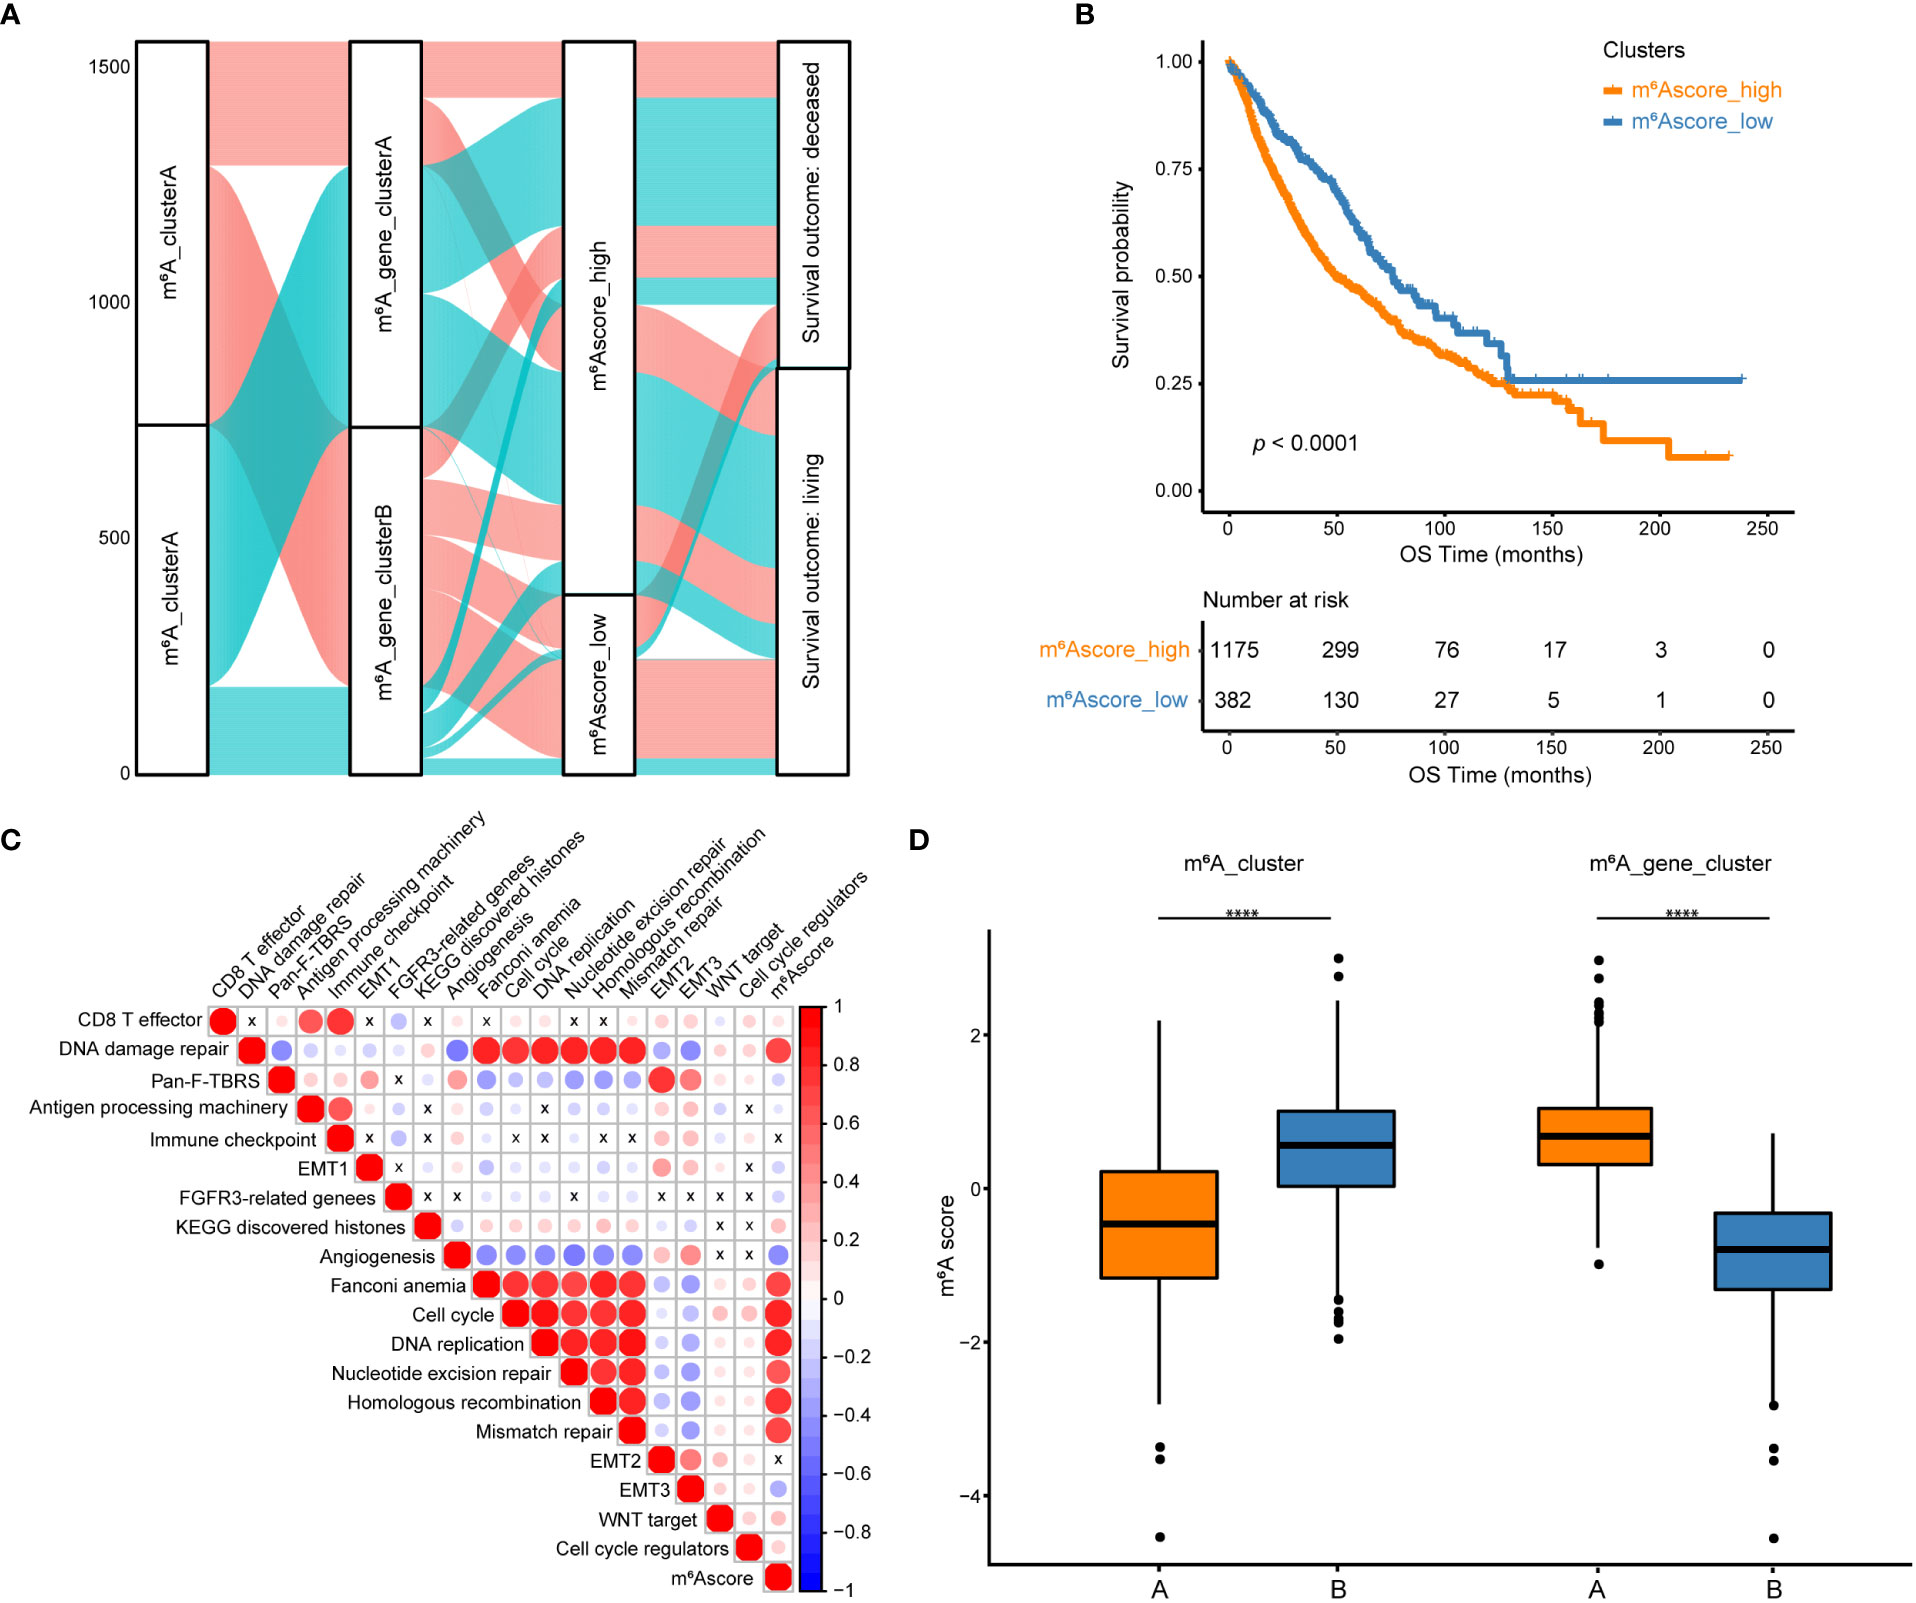
Figure 5 Construction of m6A scores. (A) An alluvial diagram of the m6A clusters showing different m6A gene clusters, m6Ascores, and survival outcomes. (B) The Kaplan-Meier curve demonstrated a significant correlation between m6A scores in the high and low groups and overall survival. (C) GSVA and Pearson correlation analysis show correlations between m6Ascore and biological pathways constructed with known gene signatures in NSCLC. A positive correlation is indicated by red, while a negative correlation is indicated by blue. The circle size is inversely proportional to the levels of significance, and X indicates no significant correlation. (D) Boxplots show the differences in m6A scores between m6A clusters and between m6A gene clusters. ****p < 0.0001.
Molecular characteristics of m6Ascore groups in TCGA datasets
The distribution of tumor somatic mutations in TCGA NSCLC datasets is visualized by the R package “maftools” (Figures 6A, B, left), and the GISTIC algorithm was used to evaluate and visualize the distribution of somatic copy number alterations in groups with high and low m6Ascores, respectively (Figures 6A, B, right). The mutational landscape revealed that the top 15 genes in the high m6Ascore group had higher tumor mutation frequencies than those in the low m6Ascore group. The most mutational gene was TP53 (80% vs. 37%). GISTIC plots revealed that the m6Ascore low group had significantly fewer copy number alterations than the m6Ascore high group, which is consistent with somatic mutations. Based on these data, we were able to more fully illustrate the impact that m6A score classification has on genomic variation and to demonstrate the potentially intricate interactions between individual somatic mutations/alterations and m6A modifications.
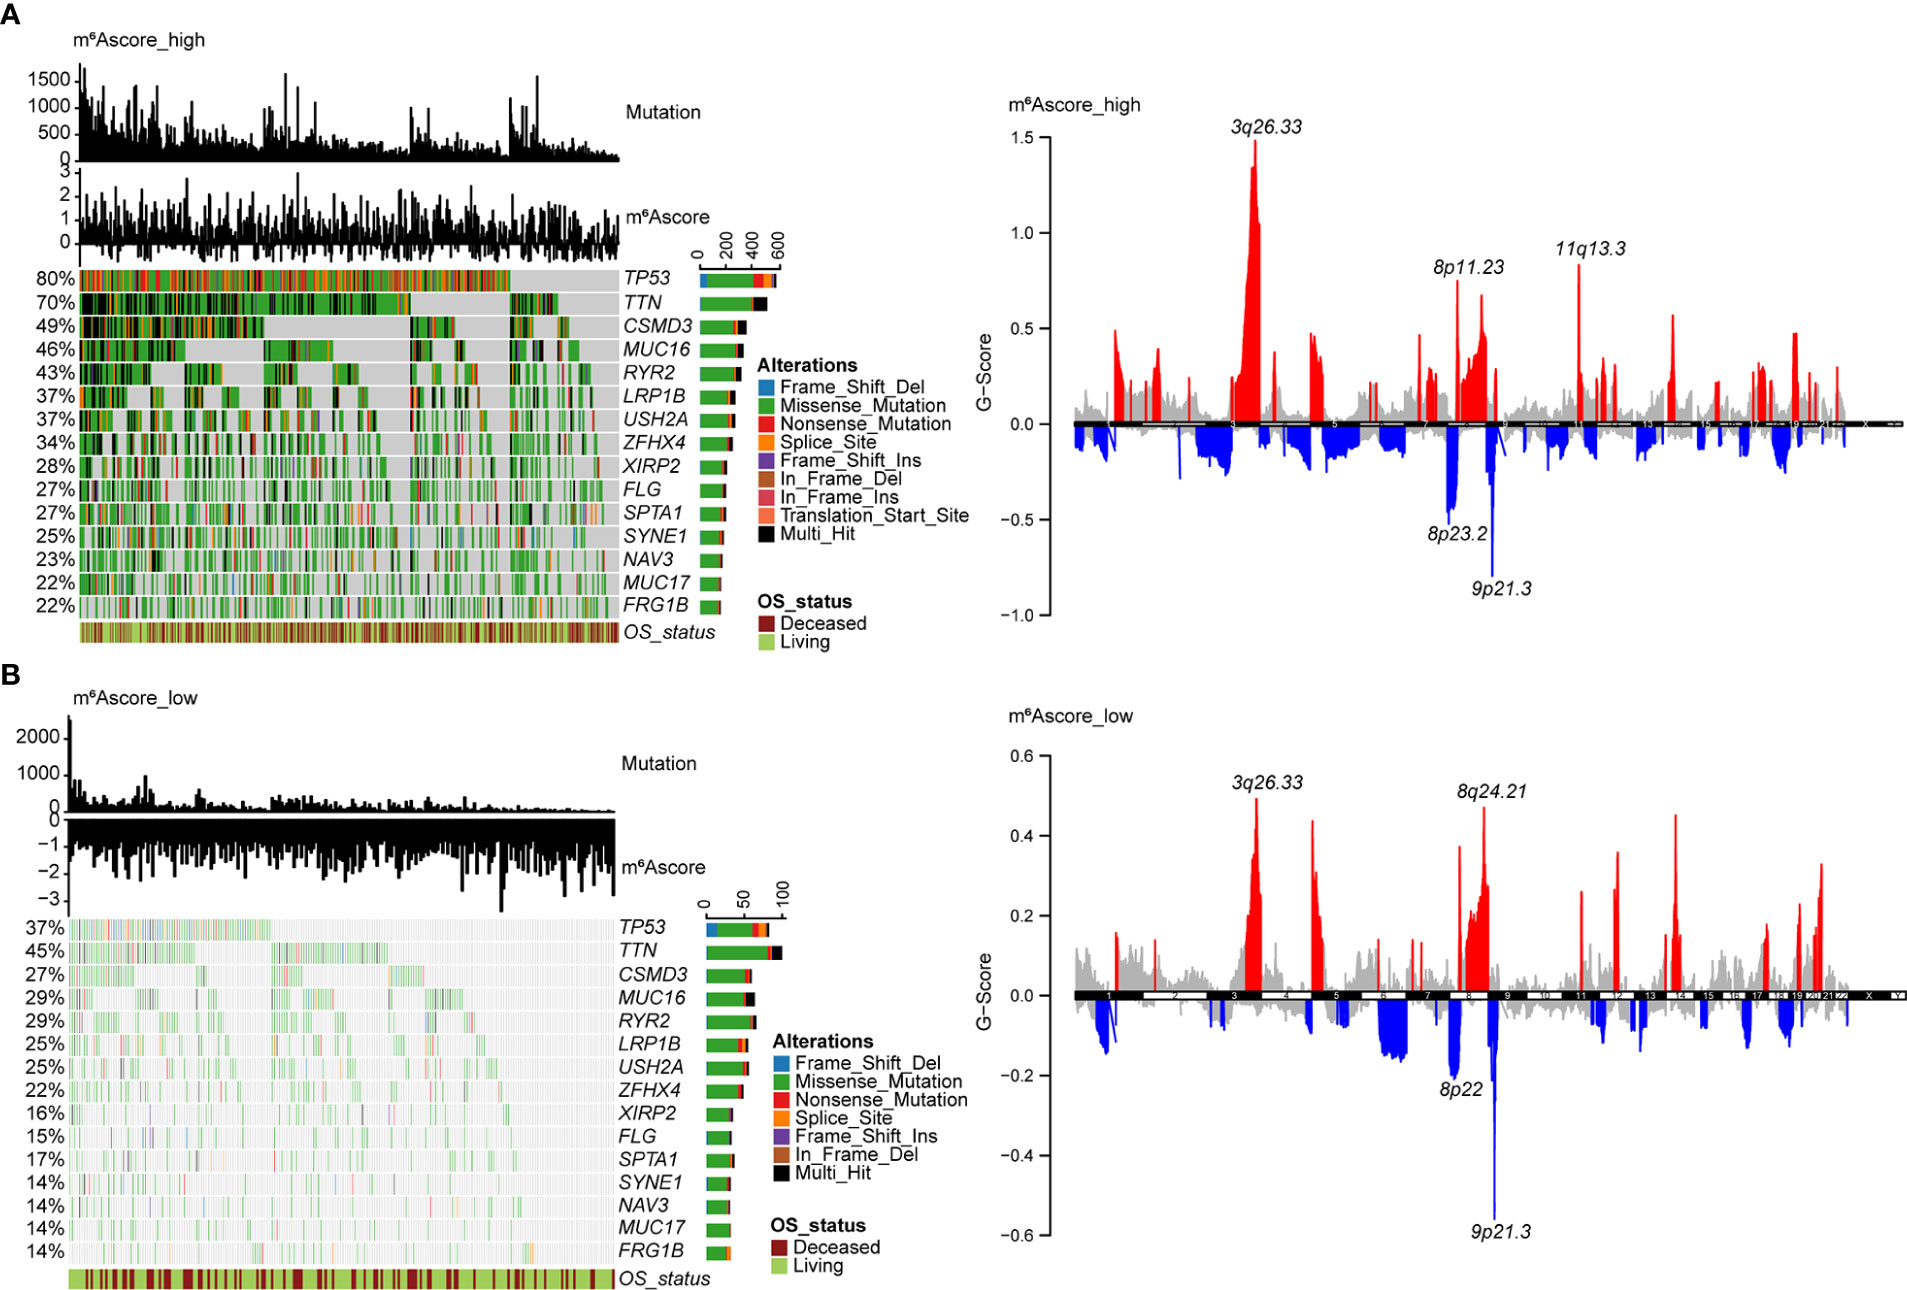
Figure 6 Molecular features of m6Ascore groups in TCGA datasets. (A) The distribution of tumor somatic mutations in NSCLC with a high m6Ascore is depicted in the waterfall plot. Each column represents a patient. TMB is depicted in the upper barplot, and each gene’s mutation frequency is indicated by the number on the left. The horizontal barplot on the right depicts the percentage of each variant type, and overall survival status is shown as patient annotations (left). GISTIC plot depicts the distribution of somatic copy number alterations in NSCLC with a high m6Ascore, regions of copy number amplification are highlighted in red, and regions of copy number deletion are highlighted in blue. Several significant gene names are marked (right). (B) The waterfall plot displays the somatic mutation distribution (left), and the GISTIC plot shows the distribution of somatic copy number alterations (right) in NSCLC with a low m6Ascore.
The value of m6Ascore in predicting chemotherapy and immunotherapy response
To extend the potential therapeutic use of m6Ascore, we explored whether the intrinsic m6Ascore in cancer cells could predict their response to various drugs, which was inspired by the cross-talk between m6Ascore and many key cancer-related pathways. Using the R package “pRRophetic” and the expression profile from TCGA and GEO datasets, IC50 values of chemotherapeutic drugs Cisplatin and Gemcitabine were calculated. According to a comparison of the relative distribution of Cisplatin and Gemcitabine IC50 values, the IC50 value in the low m6A score group was significantly higher than that in the high m6A score group, indicating that the high m6A score group had poor drug resistance (Figure 7A). Moreover, based on the mRNA expression profile in the TCGA data set, the TIDE algorithm was employed to assess the clinical effect of ICB treatment in the m6Ascore high and low groups. Results revealed that patients with high m6Ascores had TIDE scores that were significantly lower than those with low m6Ascores. That was to say, compared to patients with low m6Ascores, NSCLC patients with high m6Ascores exhibited a better therapeutic benefit and clinical response to anti-PD1 or anti-CTLA4 immunotherapy (Figure 7B). According to the ROC curve, the m6Ascore may be a reliable biomarker for predicting outcomes and evaluating the therapeutic efficacy of anti-PD1 and anti-CTLA4 treatments (AUC = 0.88) (Figure 7C).
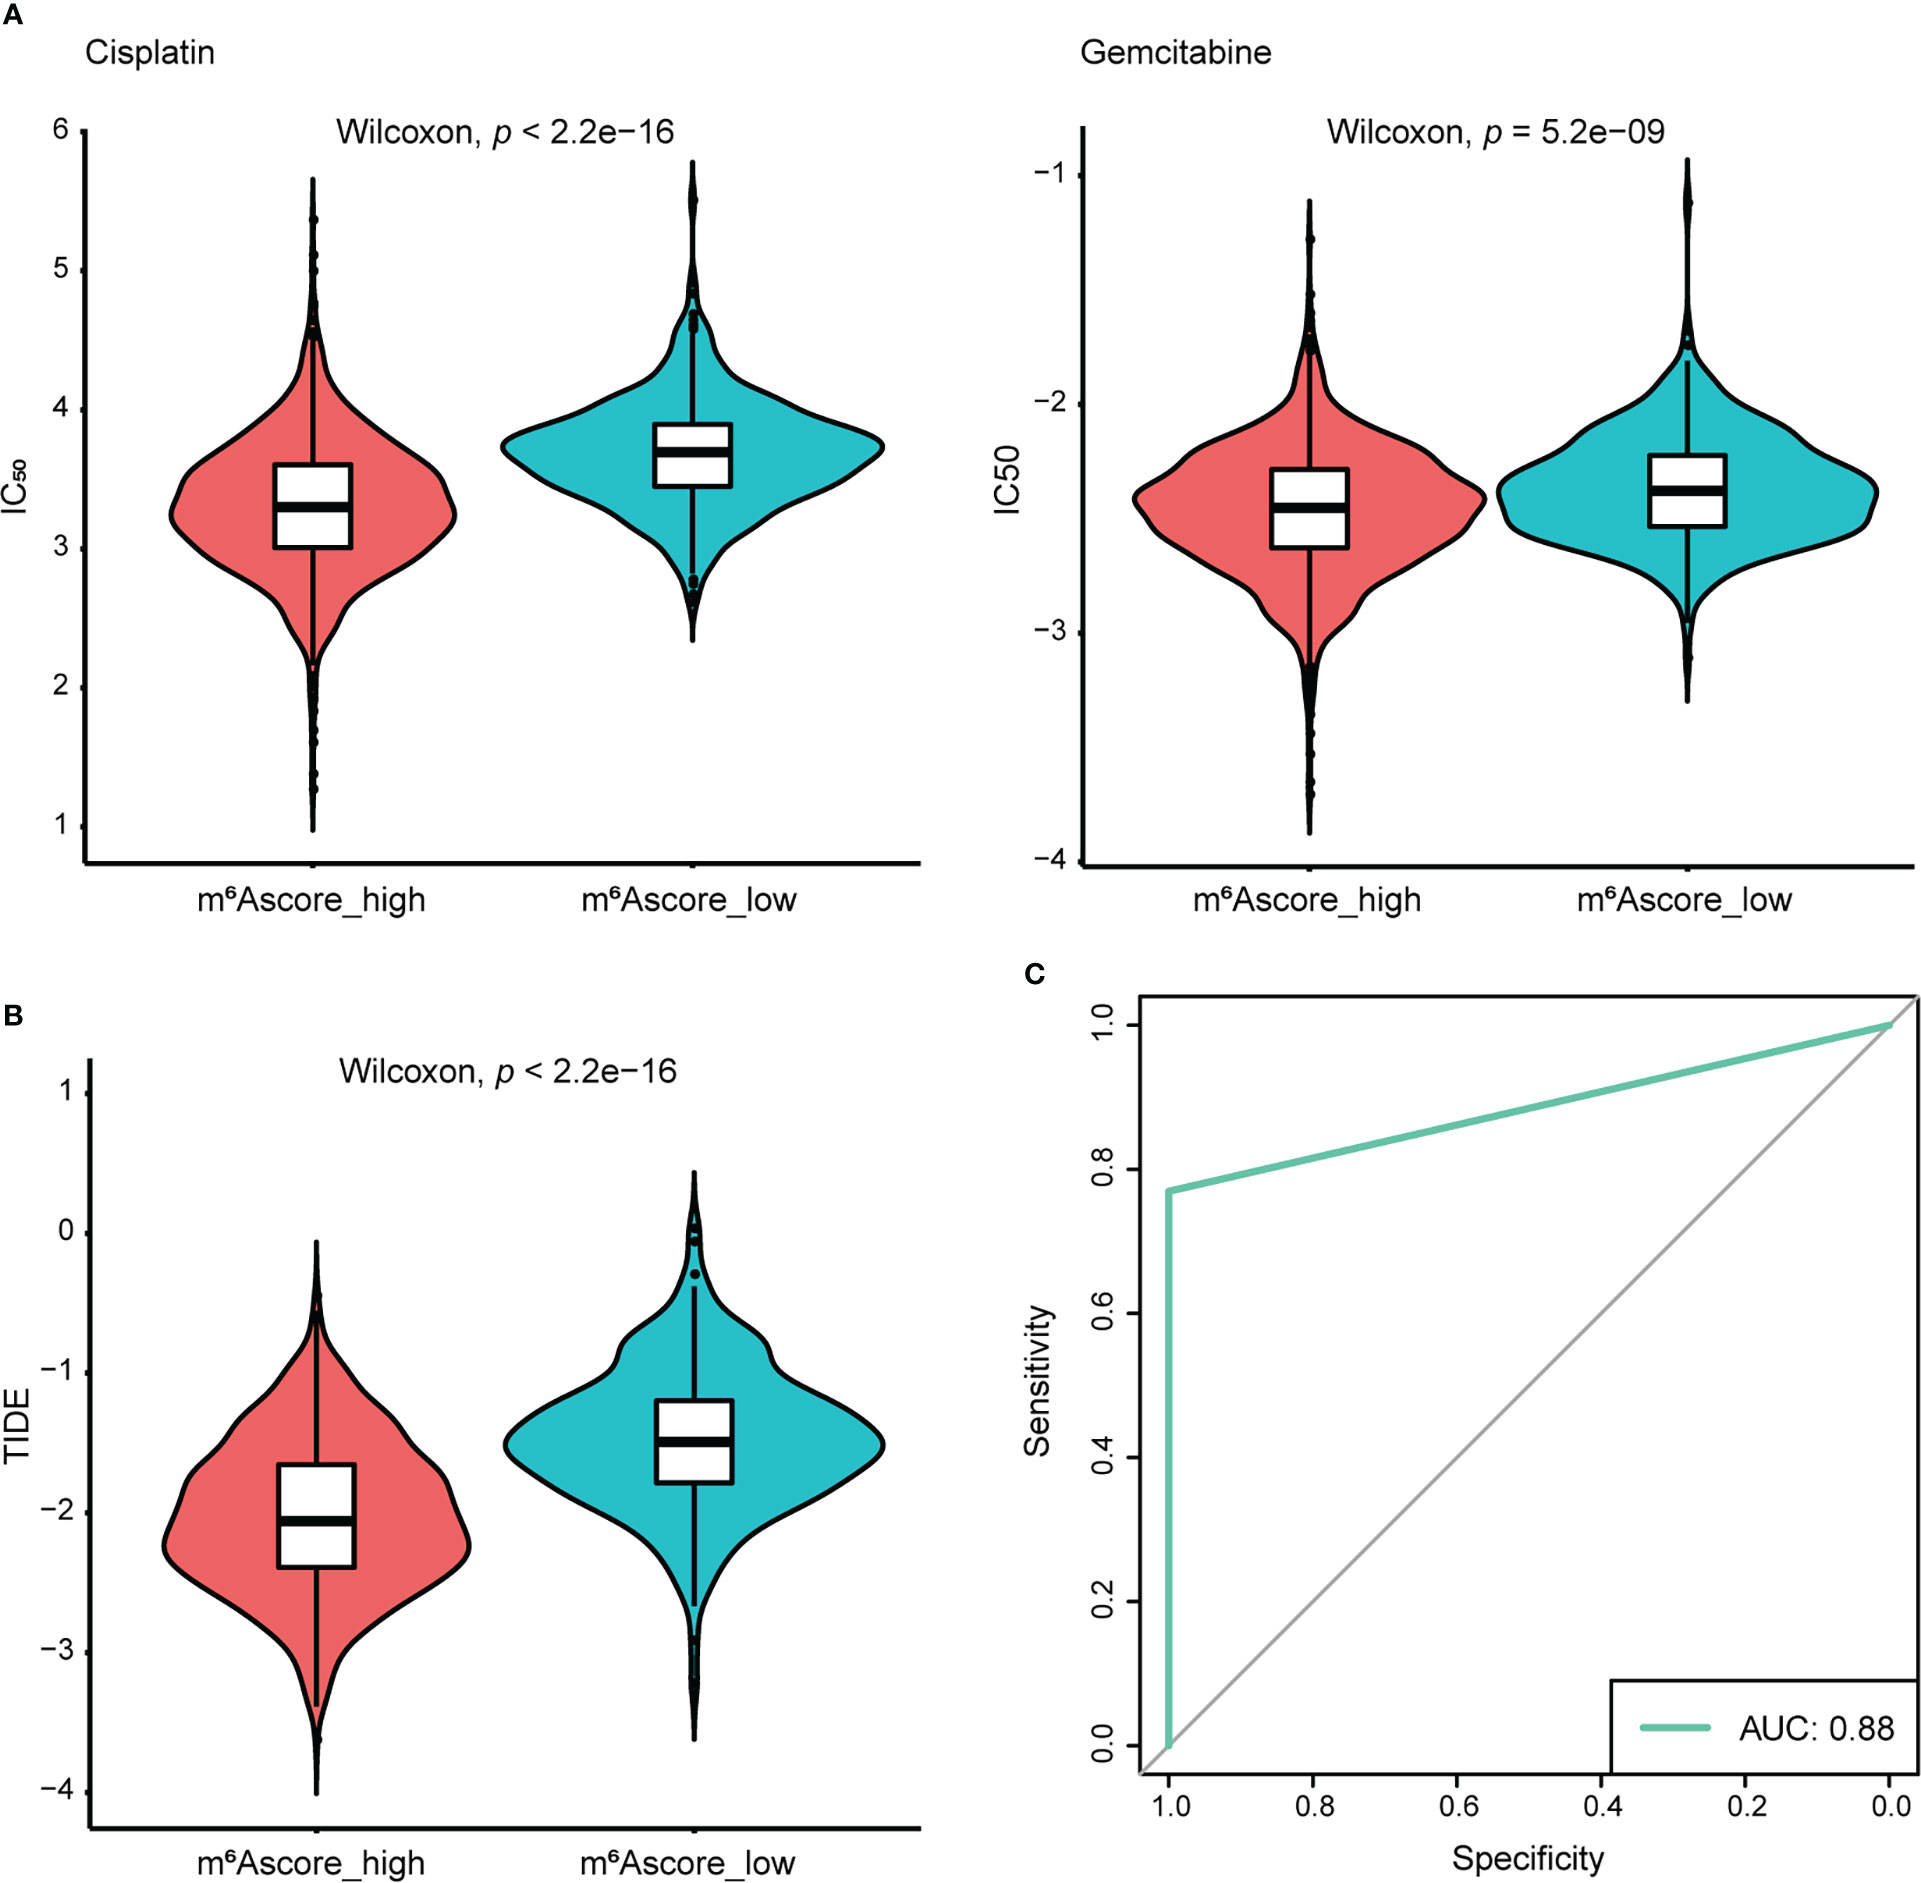
Figure 7 The response of the high and low m6Ascore groups to chemotherapy/immunotherapy. (A) Differences in IC50 of Cisplatin and Gemcitabine treatment. (B) Differences in TIDE prediction score. (C) The receiver operator characteristic curve (ROC) shows the predictive performance of m6Ascore in NSCLC patients receiving anti-PD1 and anti-CTLA4 therapy (AUC, 0.88).
To validate the chemotherapy response in high and low m6Ascore groups, we first classified NSCLC cells into m6Ascore-high (NCI-H23, NCI-H2023, COR-L32, NCI-H1781, and NCI-H2170) and m6Ascore-low (VMRC-LCD, NCI-H1838, NCI-H2342, NCI-H661, and NCI-H2347) groups with distinct differences. The dose-response curves and IC50 values indicated that Gemcitabine treatment is generally more effective in NSCLC cell lines. The m6Ascore-high group of NSCLC cell lines has higher anti-tumor activity when treated with Cisplatin and Gemcitabine (Figures 8A, B), which is in line with the predicted result that the group with a high m6A score has poor drug resistance.
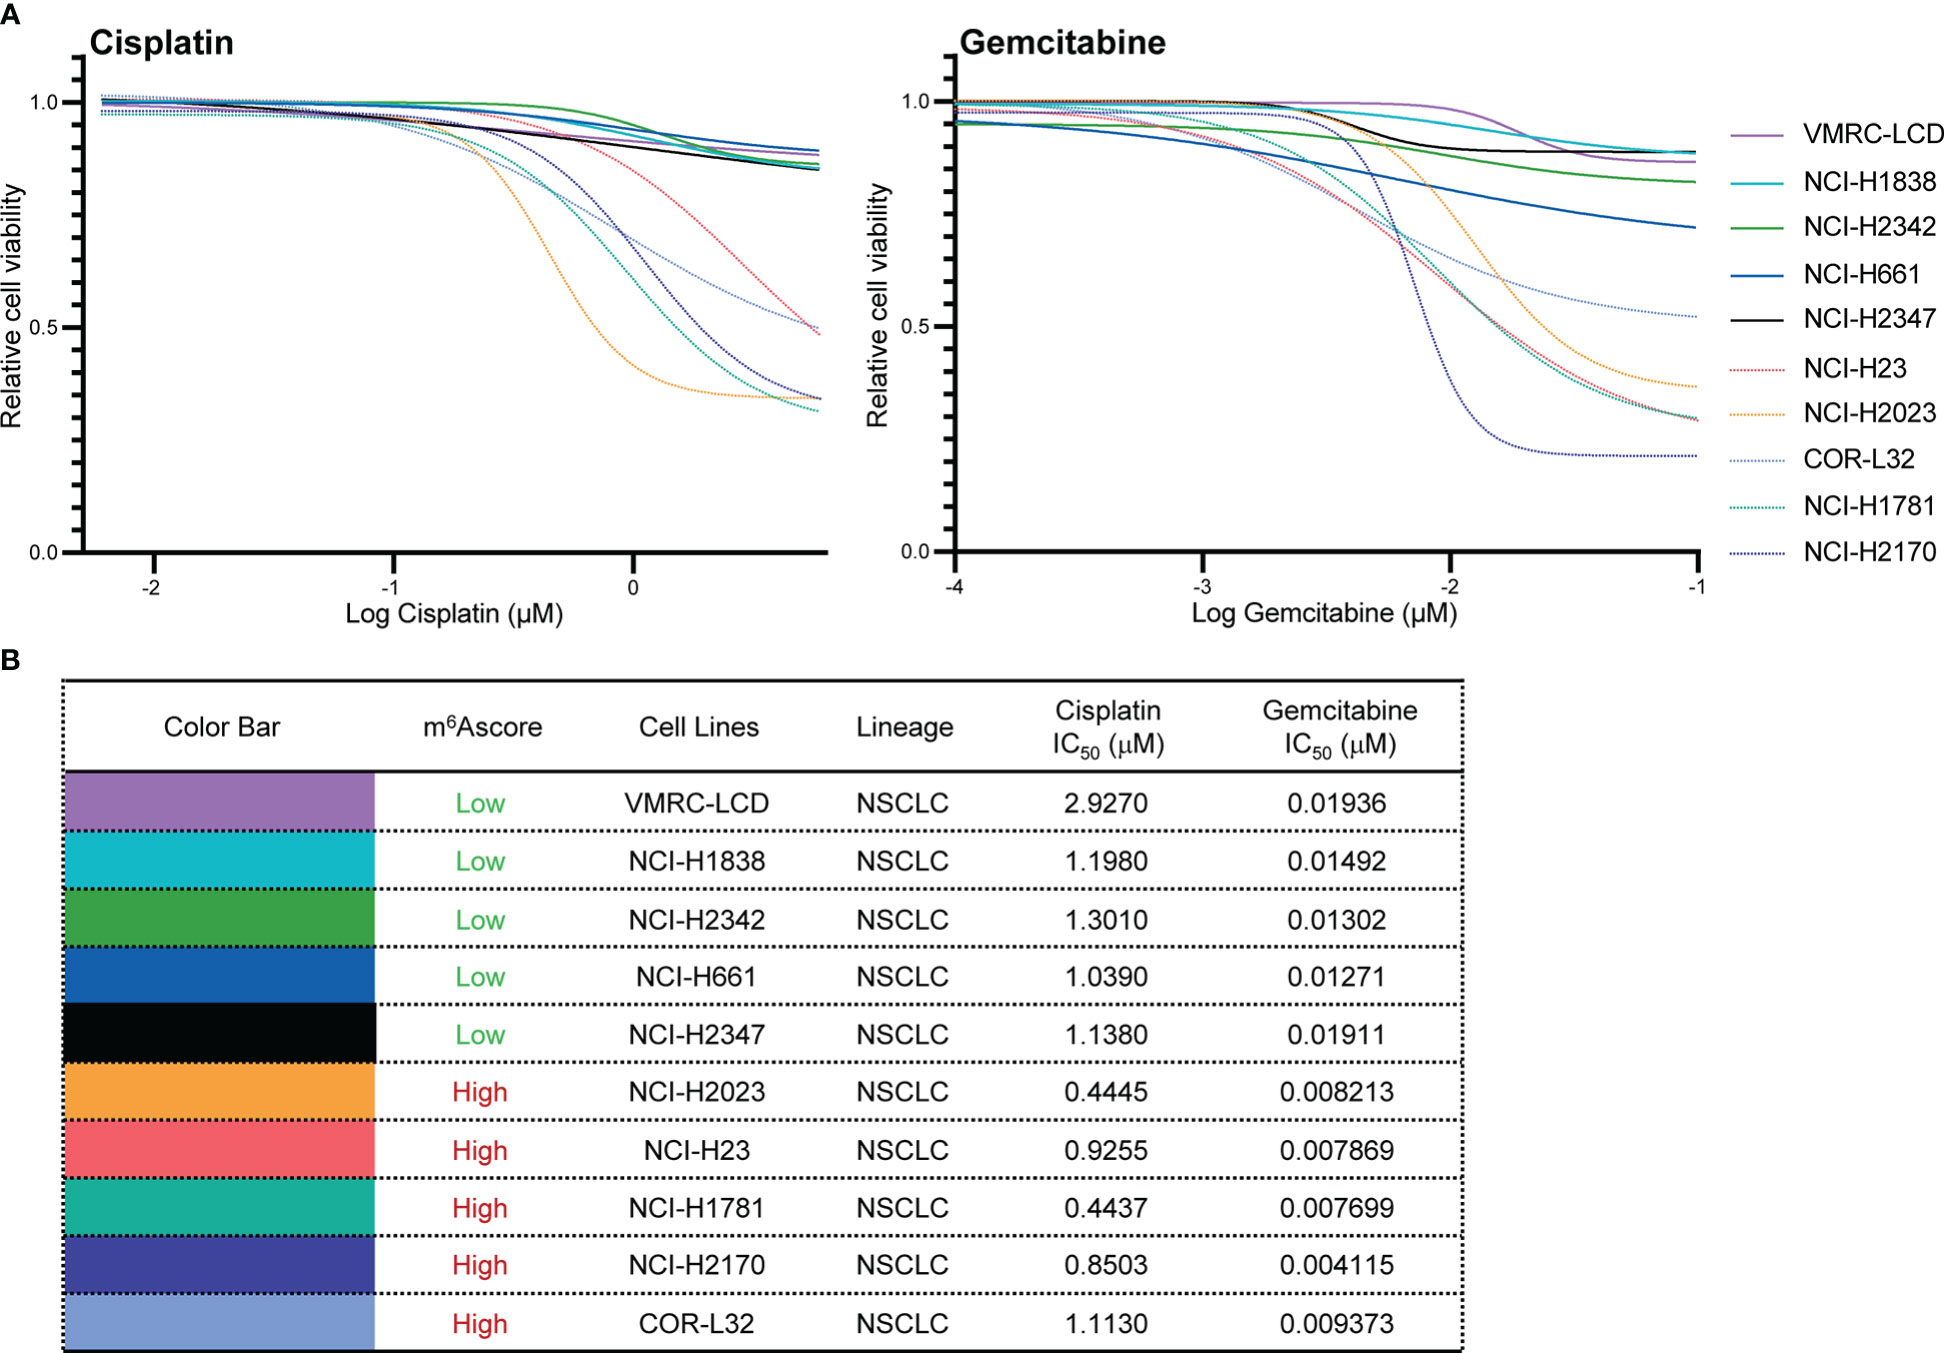
Figure 8 Validation of chemotherapy drugs’ IC50. (A, B) Measurement of IC50 by DNA dye or metabolic assay in NSCLC cell panels (VMRC-LCD, NCI-H1838, NCI-H2342, NCI-H661, NCI-H2347, NCI-H23, NCI-H2023, COR-L32, NCI-H1781, NCI-H2170) treated with Cisplatin and Gemcitabine.
Discussion
The immunological state of TME in diverse malignancies is regulated by RNA m6A modification (28, 29). Recent studies have uncovered the relationships between m6A regulators and immune cell infiltration. The accumulation of myeloid-derived suppressor cells necessary to maintain the activation and proliferation of CD4+ and CD8+ T cells was reduced when METTL3 was selectively depleted in colorectal cancer cells (30). Natural killer cell homeostasis and maturation, as well as their anti-tumor and antiviral activity, are positively regulated by YTHDF2 (31). YTHDF1 deficiency in classical dendritic cells could enhance antigen presentation, initiate anti-tumor responses, and improve the therapeutic effectiveness of PD-L1 checkpoint blockade (32). Nevertheless, these research concentrated on the single m6A modification regulators, and the integrated roles of various m6A regulators in modifying immune characteristics in NSCLC need to be further investigated. More efficient immunotherapy approaches will result from a knowledge of the involvement of distinct m6A modification patterns in TME cell infiltration and the TME anti-tumor immune response.
The global transcriptional and genetic profiles of m6A modification regulator genes and their mutual correlation in NSCLC were the focus of this study. When compared to healthy controls, the expression of METTL3 and METTL14 in NSCLC samples exhibited a contrary trend. As well-studied m6A writers, METTL3 and METTL14 are reasonably thought to have similar functions. Although a similar phenomenon exists in prostate cancer (33), further studies are required in the future to figure this out. m6A readers from the IGF2BPs family showed high expression levels and mutation frequency, especially IGF2BP2. According to Li et al., IGF2BP2 and IGF2BP3 was essential for lung cancer progression, and they could identify and stabilize m6A sites and function as ‘readers’ in the post-transcriptional regulation manner (34). A study found that IGF2BP2 regulated macrophage activation in an m6A-dependent manner, which indicated a potential therapeutic target of macrophages in inflammatory diseases (35). RBM15 and its paralogue RBM15B contain RNA-binding motifs, which make it easier to recruit m6A methyltransferase to specific sites in RNA (36, 37). Our results showed that RBM15 and RBM15B were significantly up-regulated in NSCLC samples and had frequent CNV alterations, indicating their potential role in promoting cancer cell migration and invasion (38). Our comprehension of how epigenetic regulation affects diverse physiological processes and TME cell-infiltrating characterization will be enhanced by a thorough evaluation of the patterns of m6A modification, which will highlight the heterogeneity of m6A modification. These regulators’ effects on immune infiltration mechanisms via m6A modification require additional biology studies utilizing cell culture and even PDX mice models.
With consistent clustering, we have identified two independent m6A modification patterns with significantly different TME immune cell infiltration traits, among which m6A_clusterA showed immune inflamed phenotype and enriched abundant immune cells, known as hot tumor. Immune checkpoint inhibitors are frequently associated with greater benefits in such tumors (39). Therefore, m6A_clusterA had a better prognosis. As defined by us, m6A signature genes are the genes that are expressed differently in different m6A modification patterns. Two genomic clusters were identified using m6A signature genes, which is consistent with m6A modification clusters. m6A regulator genes were also differentially expressed between genomic clusters. This phenomenon demonstrates once more how the m6A modification significantly shapes various TME landscapes. Taking into account the individual variability of m6A modification, an m6Ascore algorithm based on the m6A signature genes was developed to compute the m6Ascore of each sample. m6Agenecluster and m6Ascore groups have apparent differences in prognosis, clinical features, or molecular characteristics. As a result, we demonstrated that m6Ascore might be used to evaluate the clinicopathological traits of patients, such as tumor inflammation, prognosis, genetic variation, and so forth. This demonstrated that m6Ascore was robust and reliable and could be utilized to identify the tumor immune phenotypes by comprehensively assessing individual tumor m6A modification patterns. Therefore, m6Ascore could be utilized to predict the effectiveness of chemotherapy and the patient’s clinical response to anti-PD1 and anti-CTLA4 immunotherapy for NSCLC, in addition to being used as an independent prognostic biomarker to predict patients’ survival. Immunotherapy response results predicted from m6Ascore classification demonstrated that the predictive performance of the m6Ascore in NSCLC patients treated with drugs anti-PD1 and anti-CTLA4 reaches a meaningful result (AUC = 0.88). Several novel ideas for cancer immunotherapy that alter m6A modification patterns by targeting m6A regulators or m6A signature genes were presented in our study. By harnessing the immune system, firing up the TME cell infiltration characterization to turn tumors from “cold” to “hot” is a promising strategy to explore novel drug combinations or novel immunotherapeutic agents.
This study is the first to comprehensively and methodically analyze the relationships between m6A regulator modification patterns, immune infiltration, and treatment resistance in NSCLC. Their relationships attracted emerging attention in recent years (40). The numerous results generated from this study will provide hints for other researchers in deep mechanism study and direct m6A immunotherapy in lung cancer. In addition, in the analysis process, our study is the first to use public drug sensitivity experimental data to validate the value of m6Ascore in predicting chemotherapy response, making our prediction results more reliable. However, limitations exist in this study. Firstly, when merging two large TCGA cohorts and two GEO datasets of NSCLC patients, intra-tumor heterogeneity in different databases was not considered. A study has proven that tumor heterogeneity affects cancer immunotherapy (41). Secondly, this study confirmed the strong impact of m6A modification on the immune characteristics of NSCLC, but only theoretically valid. Bench works are warranted in the future to explore the underlying mechanisms. Thirdly, this study lacks an external clinical cohort to verify the results. Therefore, large external NSCLC cohorts are needed for further validation.
Conclusions
In this study, a thorough examination of m6A regulators in NSCLC was conducted with bioinformatics analysis. We initially screened DEGs of m6Aclusters, then separated NSCLC patients into two categories, and computed the m6Ascore in order to build a risk model with a good predictive value for prognosis. The results of this study may help us learn more about how m6A signaling influences the progression and prognosis of NSCLC. This work emphasizes the important clinical implications of RNA modifications’ cross-talks and contributes to developing individualized immune therapeutic approaches for NSCLC patients.
Data availability statement
The datasets presented in this study can be found in online repositories. The names of the repository/repositories and accession number(s) can be found in the article/Supplementary Material.
Author contributions
YW and BY conceived and designed this study. BY performed the analysis, interpreted the data, and wrote the manuscript. HQ, MZ, YY, XT, HY, and WH helped review the data and manuscript. YW supervised the study. All authors contributed to the article and approved the submitted version.
Funding
This study was supported by grants from The National Natural Science Foundation of China (42125707, 41931291), the Special Research Fund for Central Universities, Peking Union Medical College (3332022033), the Non-profit Central Research Institute Fund of Chinese Academy of Medical Sciences (2019PT310027), the Chinese Academy of Medical Sciences Innovation Fund for Medical Sciences (CIFMS: 2021-RC310-006, 2021-RC310-018, 2021-I2M-1-018), and the State Key Laboratory of Molecular Oncology (SKLMO-2021-21).
Conflict of interest
The authors declare that the research was conducted in the absence of any commercial or financial relationships that could be construed as a potential conflict of interest.
The reviewer YZ declared a shared affiliation, with no collaboration, with the authors BY, HQ, JZ, MZ, YY, and YW to the handling editor at the time of review.
Publisher’s note
All claims expressed in this article are solely those of the authors and do not necessarily represent those of their affiliated organizations, or those of the publisher, the editors and the reviewers. Any product that may be evaluated in this article, or claim that may be made by its manufacturer, is not guaranteed or endorsed by the publisher.
Supplementary material
The Supplementary Material for this article can be found online at: https://www.frontiersin.org/articles/10.3389/fonc.2022.1087753/full#supplementary-material
Abbreviations
- AUC, area under the ROC curves; CNV, copy number variation; CTLA4, cytotoxic T-lymphocyte associated protein 4; DEGs, differentially expressed genes; EMT, epithelial-mesenchymal transition; FDR, false discovery rate; GEO, gene expression omnibus; GISTIC, genomic identification of significant targets in cancer; GSVA, gene set variation analysis; IC50, half maximal inhibitory concentration; ICB, immune checkpoint blockade; m6A, N6-methyladenosine; NSCLC, non-small cell lung cancer; PD-L1, programmed death-ligand 1; ROC, receiver operating characteristic; ssGSEA, single sample gene set enrichment analysis; TCGA, the cancer genome atlas; TIDE, tumor immune dysfunction and exclusion; TME, tumor immune microenvironment.
References
1. Sung H, Ferlay J, Siegel RL, Laversanne M, Soerjomataram I, Jemal A, et al. Global cancer statistics 2020: GLOBOCAN estimates of incidence and mortality worldwide for 36 cancers in 185 countries. CA Cancer J Clin (2021) 71:209–49. doi: 10.3322/caac.21660
2. Thai AA, Solomon BJ, Sequist LV, Gainor JF, Heist RS. Lung cancer. Lancet (2021) 398:535–54. doi: 10.1016/s0140-6736(21)00312-3
3. Guo L, Yang H, Zhou C, Shi Y, Huang L, Zhang J. N6-methyladenosine RNA modification in the tumor immune microenvironment: Novel implications for immunotherapy. Front Immunol (2021) 12:773570. doi: 10.3389/fimmu.2021.773570
4. Dong M, Shen W, Yang G, Yang Z, Li X. Analysis of m6A methylation modification patterns and tumor immune microenvironment in breast cancer. Front Cell Dev Biol (2022) 10:785058. doi: 10.3389/fcell.2022.785058
5. Zhong J, Liu Z, Cai C, Duan X, Deng T, Zeng G. m(6)A modification patterns and tumor immune landscape in clear cell renal carcinoma. J Immunother Cancer (2021) 9:e001646. doi: 10.1136/jitc-2020-001646
6. Roundtree IA, Evans ME, Pan T, He C. Dynamic RNA modifications in gene expression regulation. Cell (2017) 169:1187–200. doi: 10.1016/j.cell.2017.05.045
7. Zaccara S, Ries RJ, Jaffrey SR. Reading, writing and erasing mRNA methylation. Nat Rev Mol Cell Biol (2019) 20:608–24. doi: 10.1038/s41580-019-0168-5
8. Yang Y, Hsu PJ, Chen YS, Yang YG. Dynamic transcriptomic m(6)A decoration: writers, erasers, readers and functions in RNA metabolism. Cell Res (2018) 28:616–24. doi: 10.1038/s41422-018-0040-8
9. Li XC, Jin F, Wang BY, Yin XJ, Hong W, Tian FJ. The m6A demethylase ALKBH5 controls trophoblast invasion at the maternal-fetal interface by regulating the stability of CYR61 mRNA. Theranostics (2019) 9:3853–65. doi: 10.7150/thno.31868
10. Yang S, Wei J, Cui YH, Park G, Shah P, Deng Y, et al. m(6)A mRNA demethylase FTO regulates melanoma tumorigenicity and response to anti-PD-1 blockade. Nat Commun (2019) 10:2782. doi: 10.1038/s41467-019-10669-0
11. Tong J, Cao G, Zhang T, Sefik E, Amezcua Vesely MC, Broughton JP, et al. m(6)A mRNA methylation sustains treg suppressive functions. Cell Res (2018) 28:253–6. doi: 10.1038/cr.2018.7
12. Zhang Q, Xu K. The role of regulators of RNA m6A methylation in lung cancer. Genes Dis (2022). doi: 10.1016/j.gendis.2021.12.017
13. Wang H, Hu X, Huang M, Liu J, Gu Y, Ma L, et al. Mettl3-mediated mRNA m(6)A methylation promotes dendritic cell activation. Nat Commun (2019) 10:1898. doi: 10.1038/s41467-019-09903-6
14. Zeng D, Zhou R, Yu Y, Luo Y, Zhang J, Sun H, et al. Gene expression profiles for a prognostic immunoscore in gastric cancer. Br J Surg (2018) 105:1338–48. doi: 10.1002/bjs.10871
15. Jiang Y, Zhang Q, Hu Y, Li T, Yu J, Zhao L, et al. ImmunoScore signature: A prognostic and predictive tool in gastric cancer. Ann Surg (2018) 267:504–13. doi: 10.1097/SLA.0000000000002116
16. Rosenberg JE, Hoffman-Censits J, Powles T, van der Heijden MS, Balar AV, Necchi A, et al. Atezolizumab in patients with locally advanced and metastatic urothelial carcinoma who have progressed following treatment with platinum-based chemotherapy: a single-arm, multicentre, phase 2 trial. Lancet (2016) 387:1909–20. doi: 10.1016/S0140-6736(16)00561-4
17. Turley SJ, Cremasco V, Astarita JL. Immunological hallmarks of stromal cells in the tumour microenvironment. Nat Rev Immunol (2015) 15:669–82. doi: 10.1038/nri3902
18. Fridman WH, Zitvogel L, Sautes-Fridman C, Kroemer G. The immune contexture in cancer prognosis and treatment. Nat Rev Clin Oncol (2017) 14:717–34. doi: 10.1038/nrclinonc.2017.101
19. Wieder T, Eigentler T, Brenner E, Rocken M. Immune checkpoint blockade therapy. J Allergy Clin Immunol (2018) 142:1403–14. doi: 10.1016/j.jaci.2018.02.042
20. Wilkerson MD, Hayes DN. ConsensusClusterPlus: a class discovery tool with confidence assessments and item tracking. Bioinformatics (2010) 26:1572–3. doi: 10.1093/bioinformatics/btq170
21. Hanzelmann S, Castelo R, Guinney J. GSVA: gene set variation analysis for microarray and RNA-seq data. BMC Bioinf (2013) 14:7. doi: 10.1186/1471-2105-14-7
22. Subramanian A, Tamayo P, Mootha VK, Mukherjee S, Ebert BL, Gillette MA, et al. Gene set enrichment analysis: a knowledge-based approach for interpreting genome-wide expression profiles. Proc Natl Acad Sci U.S.A. (2005) 102:15545–50. doi: 10.1073/pnas.0506580102
23. Ritchie ME, Phipson B, Wu D, Hu Y, Law CW, Shi W, et al. Limma powers differential expression analyses for RNA-sequencing and microarray studies. Nucleic Acids Res (2015) 43:e47. doi: 10.1093/nar/gkv007
24. Sotiriou C, Wirapati P, Loi S, Harris A, Fox S, Smeds J, et al. Gene expression profiling in breast cancer: understanding the molecular basis of histologic grade to improve prognosis. J Natl Cancer Inst (2006) 98:262–72. doi: 10.1093/jnci/djj052
25. Mariathasan S, Turley SJ, Nickles D, Castiglioni A, Yuen K, Wang Y, et al. TGFbeta attenuates tumour response to PD-L1 blockade by contributing to exclusion of T cells. Nature (2018) 554:544–8. doi: 10.1038/nature25501
26. Geeleher P, Cox N, Huang RS. pRRophetic: an r package for prediction of clinical chemotherapeutic response from tumor gene expression levels. PLoS One (2014) 9:e107468. doi: 10.1371/journal.pone.0107468
27. Jiang P, Gu S, Pan D, Fu J, Sahu A, Hu X, et al. Signatures of T cell dysfunction and exclusion predict cancer immunotherapy response. Nat Med (2018) 24:1550–8. doi: 10.1038/s41591-018-0136-1
28. Shulman Z, Stern-Ginossar N. The RNA modification n-6-methyladenosine as a novel regulator of the immune system. Nat Immunol (2020) 21:501–12. doi: 10.1038/s41590-020-0650-4
29. He XF, Tan LQ, Ni J, Shen GP. Expression pattern of m(6)A regulators is significantly correlated with malignancy and antitumor immune response of breast cancer. Cancer Gene Ther (2021) 28:188–96. doi: 10.1038/s41417-020-00208-1
30. Chen H, Pan Y, Zhou Q, Liang C, Wong CC, Zhou Y, et al. METTL3 inhibits antitumor immunity by targeting m(6)A-BHLHE41-CXCL1/CXCR2 axis to promote colorectal cancer. Gastroenterology (2022) 163:891-907. doi: 10.1053/j.gastro.2022.06.024
31. Ma S, Yan J, Barr T, Zhang J, Chen Z, Wang LS, et al. The RNA m6A reader YTHDF2 controls NK cell antitumor and antiviral immunity. J Exp Med (2021) 218:e20210279. doi: 10.1084/jem.20210279
32. Han DL, Liu J, Chen CY, Dong LH, Liu Y, Chang RB, et al. Anti-tumour immunity controlled through mRNA m(6)A methylation and YTHDF1 in dendritic cells. Nature (2019) 566:270. doi: 10.1038/s41586-019-0916-x
33. Liu Z, Zhong J, Zeng J, Duan X, Lu J, Sun X, et al. Characterization of the m6A-associated tumor immune microenvironment in prostate cancer to aid immunotherapy. Front Immunol (2021) 12:735170. doi: 10.3389/fimmu.2021.735170
34. Li B, Zhu L, Lu C, Wang C, Wang H, Jin H, et al. circNDUFB2 inhibits non-small cell lung cancer progression via destabilizing IGF2BPs and activating anti-tumor immunity. Nat Commun (2021) 12:295. doi: 10.1038/s41467-020-20527-z
35. Wang X, Ji Y, Feng P, Liu R, Li G, Zheng J, et al. The m6A reader IGF2BP2 regulates macrophage phenotypic activation and inflammatory diseases by stabilizing TSC1 and PPARgamma. Adv Sci (Weinh) (2021) 8:2100209. doi: 10.1002/advs.202100209
36. Patil DP, Chen CK, Pickering BF, Chow A, Jackson C, Guttman M, et al. m(6)A RNA methylation promotes XIST-mediated transcriptional repression. Nature (2016) 537:369–73. doi: 10.1038/nature19342
37. Cai X, Chen Y, Man D, Yang B, Feng X, Zhang D, et al. RBM15 promotes hepatocellular carcinoma progression by regulating N6-methyladenosine modification of YES1 mRNA in an IGF2BP1-dependent manner. Cell Death Discov (2021) 7:315. doi: 10.1038/s41420-021-00703-w
38. Wang T, Kong S, Tao M, Ju S. The potential role of RNA N6-methyladenosine in cancer progression. Mol Cancer (2020) 19:88. doi: 10.1186/s12943-020-01204-7
39. Chen DS, Mellman I. Elements of cancer immunity and the cancer-immune set point. Nature (2017) 541:321–30. doi: 10.1038/nature21349
40. Du A, Wu X, Gao Y, Jiang B, Wang J, Zhang P, et al. m6A regulator-mediated methylation modification patterns and tumor microenvironment infiltration characterization in acute myeloid leukemia. Front Immunol (2021) 12:789914. doi: 10.3389/fimmu.2021.789914
Keywords: m6A regulators, m6A modification, tumor immune microenvironment (TME), immunotherapy, non-small cell lung cancer (NSCLC)
Citation: Yuan B, Qin H, Zhang J, Zhang M, Yang Y, Teng X, Yu H, Huang W and Wang Y (2022) m6A regulators featured by tumor immune microenvironment landscapes and correlated with immunotherapy in non-small cell lung cancer (NSCLC). Front. Oncol. 12:1087753. doi: 10.3389/fonc.2022.1087753
Received: 02 November 2022; Accepted: 30 November 2022;
Published: 16 December 2022.
Edited by:
Lihong Ye, Nankai University, ChinaReviewed by:
Zhe Yang, Liaoning University, ChinaLongqiang Wang, University of Texas MD Anderson Cancer Center, United States
Yu Zhao, Chinese Academy of Medical Sciences and Peking Union Medical College, China
Copyright © 2022 Yuan, Qin, Zhang, Zhang, Yang, Teng, Yu, Huang and Wang. This is an open-access article distributed under the terms of the Creative Commons Attribution License (CC BY). The use, distribution or reproduction in other forums is permitted, provided the original author(s) and the copyright owner(s) are credited and that the original publication in this journal is cited, in accordance with accepted academic practice. No use, distribution or reproduction is permitted which does not comply with these terms.
*Correspondence: Yan Wang, yanwang@cicams.ac.cn