 Wenhao Xu1,2†
 Xi Tian1,2†
 Wangrui Liu3†
 Aihetaimujiang Anwaier1,2†
 Jiaqi Su1,2Wenkai Zhu1,2Fangning Wan1,2Guohai Shi1,2Gaomeng Wei3*
 Yuanyuan Qu1,2*Hailiang Zhang1,2*
 Dingwei Ye1,2*
- 1Department of Urology, Fudan University Shanghai Cancer Center, Shanghai, China
- 2Department of Oncology, Shanghai Medical College, Fudan University, Shanghai, China
- 3Department of Urology, Affiliated Hospital of Youjiang Medical College for Nationalities, Baise, China
Background: This study aims to establish an N6-methyladenosine (m6A) RNA methylation regulators-mediated methylation model and explore its role in predicting prognostic accuracy of immune contexture and characterizations of clear cell renal cell carcinoma (ccRCC).
Methods: The m6A modification subclasses (m6AMS) were identified by unsupervised cluster analysis and three clusters were determined by consensus clustering algorithm in a discovering cohort. Testing and real-world validation cohorts were used to identify predictive responses for immune checkpoint therapies (ICTs) of m6AMS.
Results: Prognostic implications landscape of m6A regulators in cancers and its differential expression levels in ccRCC patients were identified. Based on discovering cohort, ccRCC were automatically divided into three m6AMS, and cluster 3 showed significant worse survival than cluster 1/2. Importantly, it was found that the immune checkpoint molecules expression was significantly elevated in cluster 3. Besides, m6A scoreLow group (cluster 1&2) have significantly elevated TIDE score compared with m6A scoreHigh group (cluster 3). There was conspicuous tertiary lymphoid tissue, aggressive phenotype, elevated glycolysis, expression of PD-L1, abundance of CD8+ T cells, CD4+ FOXP3+ Treg cells and TCRn immune cells infiltration in the high m6A score group. Interestingly, there are significantly increased patients with clinical benefit in m6A scoreHigh group in 368 patients receiving ICTs from testing IMvigor210 (n = 292) and validation FUSCC (n = 55) cohorts.
Conclusion: Our discovery highlights the relationship between tumor epigenetic heterogeneity and immune contexture. Immune-rejection cluster 3 has pro-tumorigenic immune infiltration, and shows significant clinical benefits for ccRCC patients receiving ICTs, enabling patient selection for future clinical treatment.
Introduction
Renal cell carcinoma (RCC) has been widely recognized as a heterogeneous disease encompassing different histological subtypes (1). Clear cell RCC (ccRCC), the most frequent subtype (>80% of the cases) and primarily responsible for mortalities, remains one of the most burdensome genitourinary neoplasms, as its increasing incidence worldwide and a large proportion of patients present with metastasis at initial diagnosis (2). Currently, an increasing number of clinical trials demonstrated that targeted therapies, such as tyrosine-kinase inhibitors (TKIs), and immune checkpoint therapies (ICTs) have tremendously improved clinical benefits for patients with metastatic RCC (3). However, these first-line drugs are often not able to bring effective clinical relief to advanced ccRCC patients, largely due to differences in individual patient heterogeneity and lack of effective signature to predict efficacy (4–6). Therefore, it is urgently needed to reveal the intratumoral non-genomic heterogeneity, tumor microenvironment characteristics, and develop prediction model for early diagnosis, prevention and individual therapy of ccRCC.
Till now, more than 100 kinds of post-transcriptional chemical methylation have been found in organisms, and provided therapeutic potential of targeting regulators for cancer therapy (7, 8). RNA modification affects most aspects of mRNA function and reshaped the secondary structure of the RNA molecules, such as N6-methyladenosine (m6A), 2-O-dimethyladenosine (m6Am), N1-methyladenosine (m1A), 5-methylcytosine (m5C) and 7-methyl guanosine (m7G) (8). As the most prevalent mRNA modification, m6A is a process in which methyltransferase catalyzes the methylation modification of adenine mainly at the position of RRm6ACH (9). In 2011, He et al. revealed the reversible modification of m6A (10), mediated by an expanding list of N-methyladenosine (mA) readers, writer-complex components and eraser regulators (8). Currently, an increasing evidence demonstrated the dynamic transcriptomic mA decoration in RNA metabolism and epitranscriptome (11, 12). Therefore, the mechanism of m6A, the vital RNA epigenetic modification, and epigenetics cooperating to regulate gene expression is worthy of further exploration.
Recently, m6A are shown to be essential for tumor development and targeted drug development and outcome prediction (13, 14). The methyltransferases (m6A “writers”), demethylases (m6A “erasers”), and m6A “reader” proteins coordinate in the process of m6A modification. It is suggested that METTL3 could serve as a cytoplasmic m6A reader to promote the translation of target mRNA transcripts by interacting with the translation initiation mechanism, and promotes progressive progression in cancers (15, 16). YTH domain proteins, including YTHDF1, YTHDF2, YTHDF3, YTDHDC1 and YTHDC2, are the most reported m6A readers and promote the degradation of m6A modified mRNA and tumor progression (17–19). Additionally, splicing factor heterogeneous nuclear ribonucleoprotein A2B1 (hnRNPA2B1) significantly promotes malignant behaviors and tumorigenesis of various cancers (20, 21). Based on increasing cutting-edge scientific advances in the emerging field of phenomics, many m6A regulators have been identified as prognostic and showed favorable predictive value of ccRCC (22–24). Interestingly, RNA m6A modification could modulate the translation efficiency of lysosomal cathepsin in dendritic cells and affect a new mechanism of tumor antigen-specific T cell immune response (19). However, it is still urgently needed to comprehensively and rigorously explore the prognostic value of m6A regulators in ccRCC, and establish prognostic models to investigate its predictive efficiency for long-term survival and immunotherapy response.
Materials and Methods
Data Downloading and Extraction of 21 m6A Regulators
Gene expression profiles and clinical information of ccRCC were downloaded from the Cancer Genome Atlas (TCGA, https://portal.gdc.cancer.gov/). Data analysis begins with normalization of biological data. By matching the sample ID, 530 ccRCC cases with full data for gene expression and clinical information were obtained. A total of 21 m6A regulators were obtained from a previous study (25) and these 21 m6A regulators included eight writers (METTL3, RBM15, METTL14, RBM15B, KIAA1429, WTAP, CBLL1, ZC3H13), two erasers (FTO, ALKBH5) and 11 readers (YTHDF1, YTHDF2, YTHDF3, YTHDC1, YTHDC2, HNRNPC, IGF2BP1, HNRNPA2B1, LRPPRC, FMR1, ELAVL1). Gene expression of 21 m6A regulators in ccRCC was extracted using R software. Differentially expressed genes (DEGs) analysis was applied to evaluate the disparate expression level of m6A regulators between ccRCC and normal tissues adjacent to cancer from the TCGA cohort. Expression levels of 21 m6A regulators in pan-cancer from the TCGA cohort were also explored and compared.
Copy Number Variation (CNV) Profiles and Drug Sensitivity of 21 m6A Regulators in ccRCC
We obtained the 21 m6A regulators genetic mutation data, transcriptome data, and clinical data of ccRCC samples from the TCGA database. Mutation data were downloaded and visualized using the “maftools” package in R software. Horizontal histogram showed the top 10 genes with higher mutation frequency in ccRCC patients. Gene Set Cancer Analysis (GSCA), an integrated genomic and immunogenomic gene set cancer analysis database, was used to predict difference of immune infiltrates between 21 m6A regulators CNV groups and the correlation between gene expression and the sensitivity of GDSC drugs (top 30) in pan-cancer (26).
Correlation Analysis and Construction of m6A Regulators Transcriptomic Subclasses
Correlation analysis was applied to assess the association between m6A regulators using Spearson’s test. According to the expression of 21 m6A regulators, different m6A modification subclasses (m6AMS) were identified by unsupervised cluster analysis, and the patients were classified for further analysis. The number of clusters and their stability are determined by a consensus clustering algorithm. We performed the above steps using the ConsensusClusterPlus software package (27) and repeated for 1,000 times to ensure the stability of the classification. Principal component analysis was used to evaluate the differential distribution of the m6AMS.
Clinical Significance and Differential Gene Expression Patterns of m6AMS
Kaplan–Meier method was applied to estimate the overall survival between various m6AMS. T stage, clinical stage, grade, gender and age were also included in comparing the m6AMS (N and M stages were excluded due to the incompletion of the original data). Limma R package (28) was utilized to evaluate the differential gene expression patterns between m6AMS. Log2(Fold change) >1 and p value <0.01 was considered statistically significant.
Identification of Potential Alterations of Tumor Immune Microenvironment Characterizations Between the m6AMS Groups
The m6AMS were merged into two main subclasses according to similar survival benefits in different groups. A CIBERSORT (29) package is a deconvolution algorithm that uses a set of barcode gene expression values (corresponding to a “signature matrix” of 547 genes) to accurately determine the composition of immune cells in tumor sample data. In this research, a CIBERSORT was utilized to explore the potential alteration in immune cells infiltration between m6AMS. Functional enrichment analysis was used to find potential biological changes by using ClusterProfiler package (30). The expression of immune checkpoint-related genes between m6AMS was compared.
Exploration of the Association Between the m6AMS and ICTs Response of ccRCC
Using bivariate analysis, we obtained a formula (m6A score = 1.889 ∗ HNRNPA2B1 − 0.451 ∗ ALKBH5) to identify the m6AMS. As there were significant changes in immune checkpoint related genes between m6AMS, the potential association between m6AMS and immune checkpoint blockade response is worth further exploration. Given that there is little available public data about ICTs’ response of large-scale ccRCC patients, we explored the potential use of the classifier in cancers cohorts. IMvigor210 is a large phase 2 trial investigating the clinical activity of PD-L1 blockade with atezolizumab in metastatic urothelial cancer. In this research, gene expression profiles of 292 pre-treatment tumors from IMvigor210 cohort were obtained to identify the potential predictive function of the classifier. Furthermore, pre-treatment tumor tissues and paired normal tissues of 76 ccRCC patients previously treated with ICTs were collected from the Fudan University Shanghai Cancer Center (FUSCC). Patients’ responses to ICTs were collected retrospectively. RT-qPCR was utilized to evaluate the relative expression of HNRNPA2B1 and ALKBH5. The m6A score of each sample in both cohorts was calculated and patients were stratified into different groups. Bivariate analysis was utilized to determine the association between m6A score and ICTs response. Receiver operating characteristic (ROC) curve was constructed to analyze the diagnostic accuracy of the genomic classifier and the area under curve (AUC) was calculated.
Tumor Microenvironment Exploration and Opal Multispectral Imaging Between m6AMS of ccRCC
Tumor Immune Dysfunction and Exclusion (TIDE) was also utilized to evaluate the potential predictive ability of the genomic classifier (http://tide.dfci.harvard.edu/) (31). Tertiary lymphoid structure (TLS) was assessed using hematoxylin–eosin (HE) staining and immunohistochemistry (IHC) was utilized to evaluate the expression levels of Ki-67 (ab15580; Abcam), Glut-1 (ab115730; Abcam) and PD-L1 (ab205921; Abcam) according to procedures as previously described (32). After the slices in the repair solution (Tris-EDTA buffer, pH 9.0) are heated by an electric ceramic stove for antigen retrieval, these were rinsed with PBS (pH 7.4) for three times, and added to the prepared 3% hydrogen peroxide dropwise Block the endogenous peroxidase on the sectioned tissue, incubated at room temperature for 15 min, and then rinsed with TBS three times, each for 3 min. Goat serum was used for serum blocking for 30 min to reduce non-specific staining. CD3 (Kit-0003, Maxim, China), CD4, (RMA-0620, Maxim, China), CD8 (RMA-0514, Maxim, China), CD11C (Ab52632, Abcam), CD20 (Ab9475, Abcam), CD68 (76437, CST), CK (Kit-0009, Maxim, China), FOXP3 (98377, CST), and PD-L1 (13684, CST) antibodies were added to the slide and incubated overnight in a humidified chamber at 4°C. When using the multi-color labeling kit, the concentration of the primary antibody is 5–10 times diluted on the basis of the optimal concentration for immunohistochemistry. Then, HRP-labeled goat anti-rabbit/mouse secondary antibody was added dropwise and incubated at 37°C for 30 min. After washing with TBS, TSA-Fluorescein (Amplification Dilution dilution) is added dropwise, and incubated at 37°C for 10 min. Finally, the slices are imaged and quantitatively analyzed on a multispectral imaging system (Vectra® Polaris™, Shanghai).
Statistical Analysis
In the statistical analyses, the Wilcox test was used to compare the differences between the two groups of samples. When performing model verification in the TCGA data set, according to the correlation between different groups of m6ATS and patient survival, the survminer of the R package was used to determine the best cutoff value. The survival curve was analyzed by Kaplan–Meier, and the log-rank test was used to determine the significance of the difference. The receiver operating characteristic (ROC) is used to evaluate prediction sensitivity and specificity of m6AMS in the disease progression, and the area under the curve (AUC) is used to evaluate the specificity and sensitivity of the model.
Results
The m6A modification has been implicated in various cellular and physiological events, including carcinogenesis, and the mechanism of m6A modification is simply depicted in Figure 1. This study was conducted in three phases. First, we assessed significant differential m6A regulators expression in pan-cancers and measured its novel prognostic implications in patients with ccRCC; m6AMS were identified using matching-learning algorithms. Second, we assessed relationships among the improved m6AMS and immune microenvironment characterizations of ccRCC in silico and in vitro. Third, m6A score was estimated in predictive responses to ICTs for ccRCC patients from two testing cohorts.
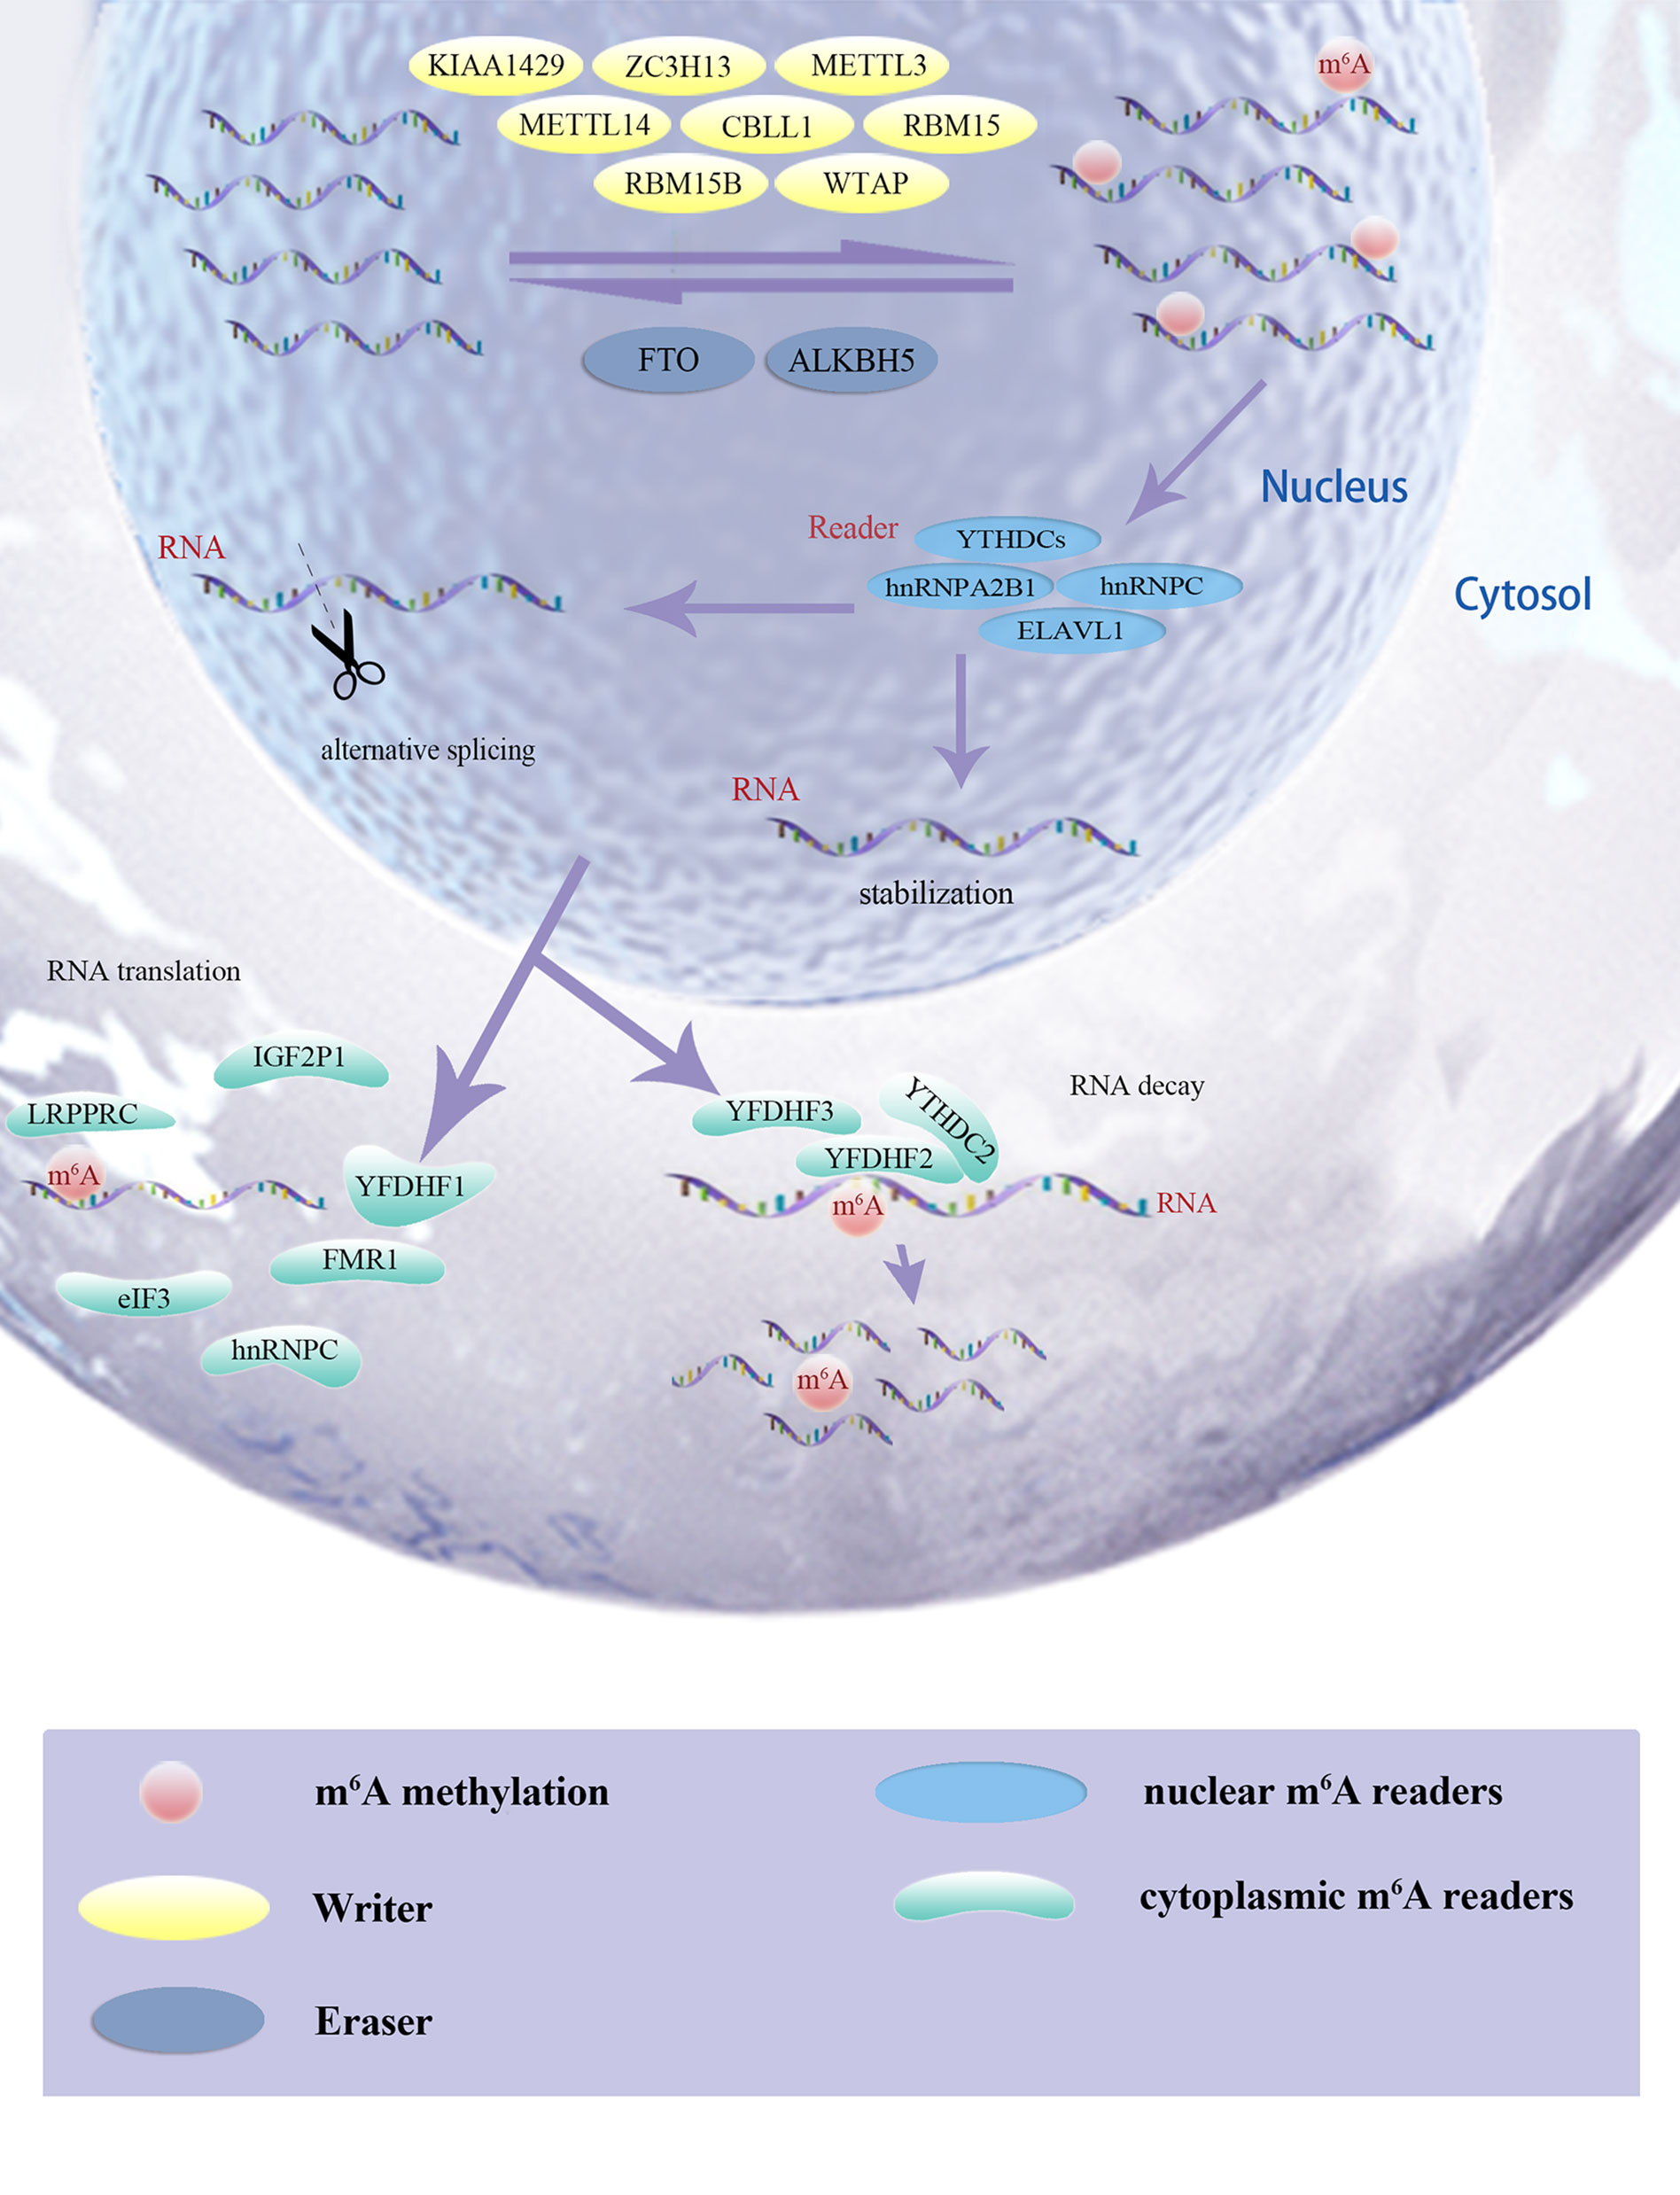
Figure 1 The m6A modification has been implicated in various cellular and physiological events, including carcinogenesis, and the mechanism of m6A modification was simply depicted.
Differential Expression Level of m6A Regulators Varies Between ccRCC and Normal Tissues
As shown in Figure 2A, expression level of 21 m6A regulators varies a lot between tumor and normal tissues. The expression levels of ALKBH5, FTO, KIAA1429, METTL3, RBM15, WTAP, and YTHDC2 were significantly higher in tumor tissues, while expression levels of FMR1, HNRNPA2B1, LRPPRC, METTL14, RBM15B, YTHDF2, YTHDF3 and ZC3H13 were significantly decreased in tumor tissues. Next, a heatmap clearly indicated that the m6A modification patterns were significantly different between tumor tissues and normal tissues (Figure 2B). Correlation heatmap indicated that FMR1, YTHDF3, CBLL1, ZC3H13, METTL14, YTHDC1, KIAA1429 and LRPPRC have strong association with others (most r2 >0.4; Figure 2C). Interestingly, Oncoplot displaying the somatic landscape of 21 m6A regulator in ccRCC samples from TCGA database. Mutation information of each gene in each sample was shown in the waterfall plot, where different colors with specific annotations at the bottom meant the various mutation types. It suggested that YTHDC2, LRPPRC, ZC3H13 and YTHDC1 have the highest mutation frequency, and nonsense mutations are the main variant classification (Figure 2D).
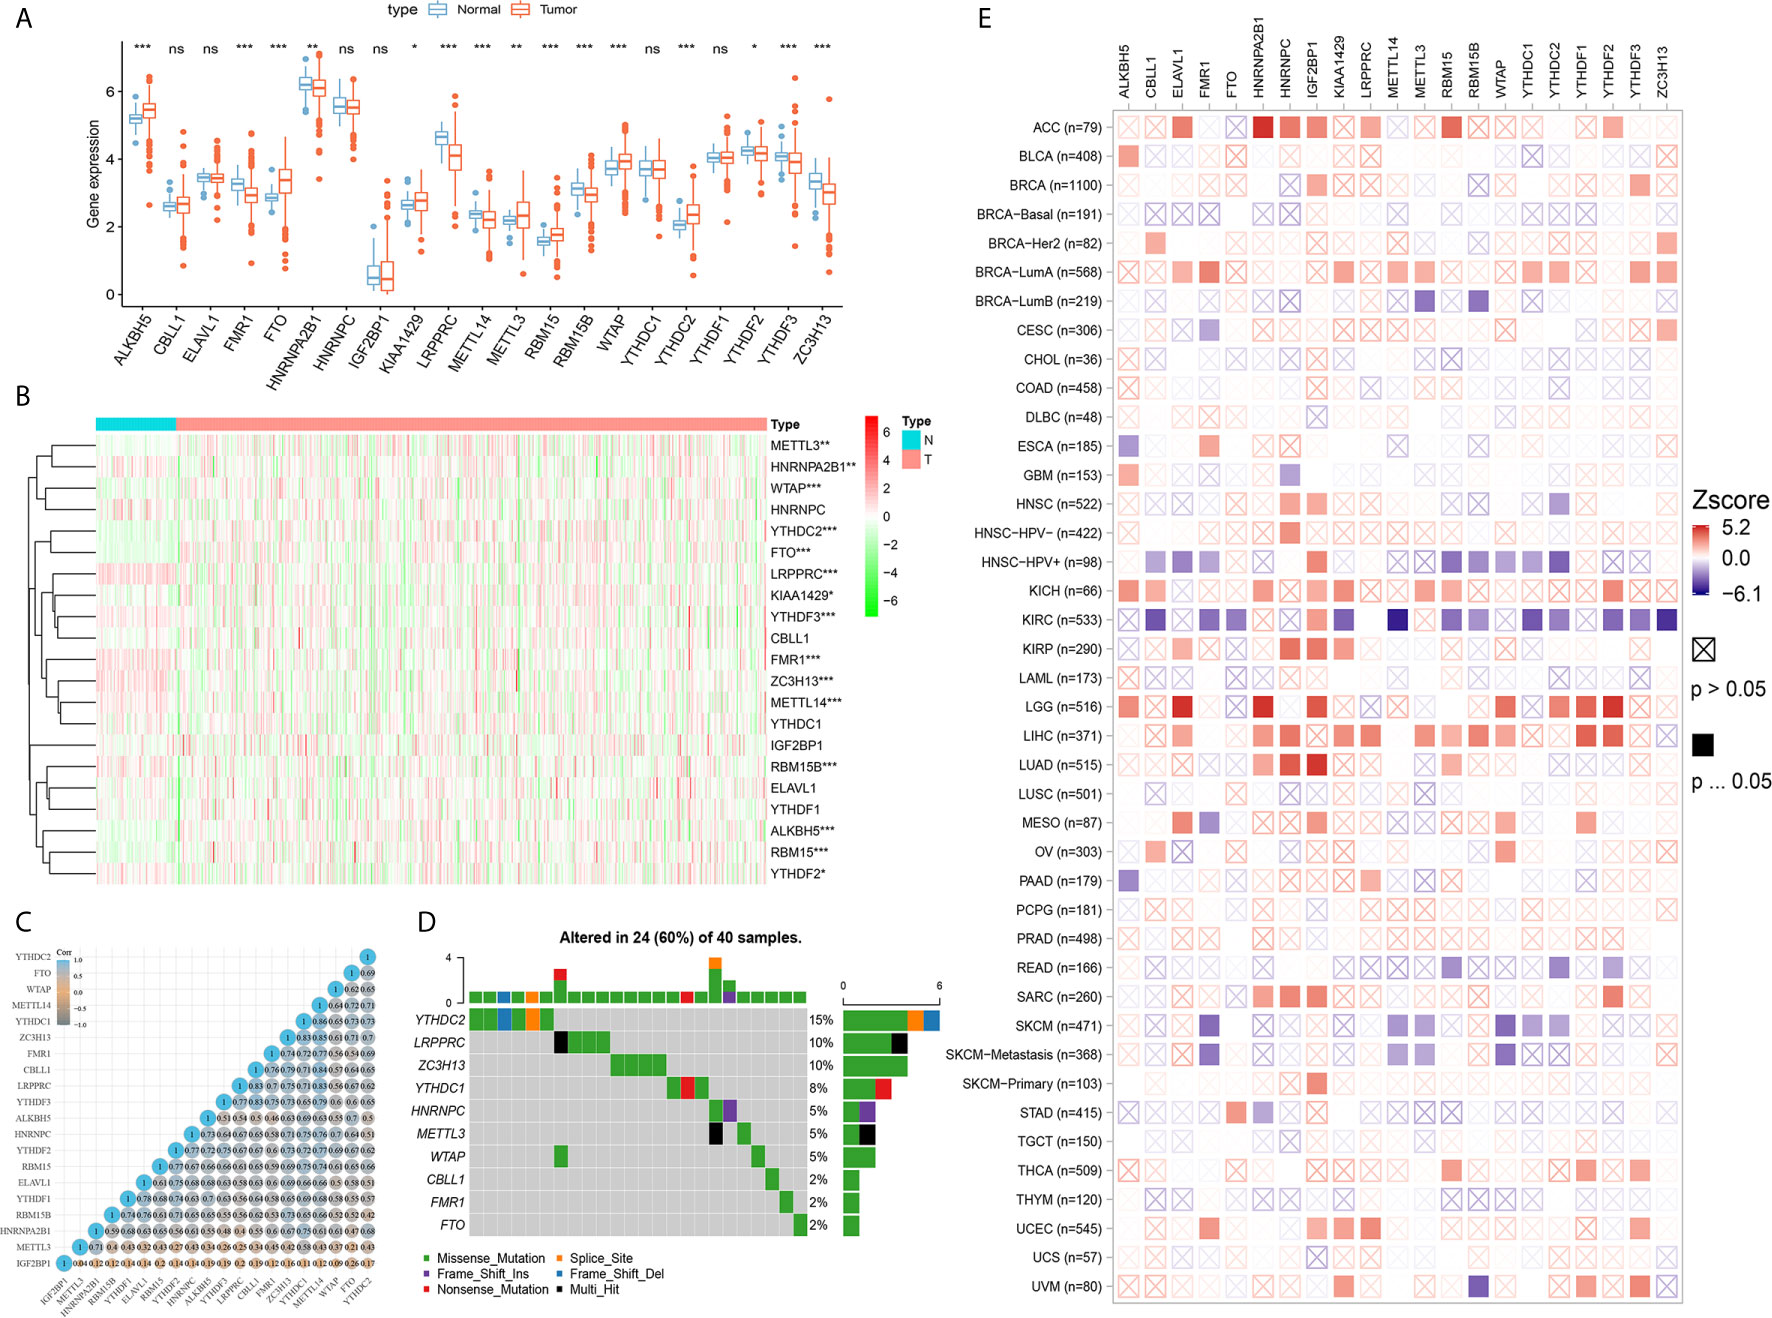
Figure 2 Differential expression, copy number variation landscape and prognostic implications of 21 m6A regulators in cancers. (A) Differential expression level of 21 m6A regulators in tumor and normal tissues were assessed using Student’s t test. (B) A heat map indicating the m6A modification patterns between tumor tissues and normal tissues. (C) A heat map of the correlation between 21 m6A regulators. The horizontal and vertical coordinates represent genes, and different colors represent correlation coefficients. (D) Oncoplot displaying the somatic landscape of 21 m6A regulator in ccRCC samples from TCGA database. Mutation information of each gene in each sample was shown in the waterfall plot, where different colors with specific annotations at the bottom meant the various mutation types. (E) Clinical implications of 21 m6A regulators expression across various cancer types was estimated in a heatmap using Cox regression methods (ns, not significant; *p < 0.05, **p < 0.01, ***p < 0.001).
Prognostic Implications of 21 m6A Regulators in Cancers
Clinical implications of 21 m6A regulators expression across various cancer types were estimated in a heatmap using the K–M method. The findings suggested that the elevated expression levels of m6A regulators, such as CBLL1, METTL14, YTHDC1-2, YTHDF2-3 and ZC3H13, were significantly associated with favorable prognosis of ccRCC, which showed relatively converse clinical implications in patients with other cancers, such as ACC, LGG, LIHC, LUAD, SARC, etcetera (Figure 2E).
Identification and Comparison of Various m6A Modification Patterns of ccRCC
By using a ConsensusClusterPlus algorithm, ccRCC samples from the TCGA cohort were automatically divided into three m6A modification subclasses, namely, clusters 1/2/3 (Figure 3A). Principal component analysis, a multivariate statistical algorithm of unsupervised clustering learning, indicated that the samples could be stratified into three clusters (Supplementary Figure 1). By integrating the clinical information, we found that patients in cluster 3 showed a significant worse overall survival than cluster 1/2 (p = 0.0018; Figure 3B). Besides, we investigated clinico-pathological implications of m6AMS and expression profiles of 21 m6A regulators. The heatmap indicated that the three clusters were of distinct expression pattern of 21 m6A regulators. Cluster 3 showed a relatively advanced AJCC stage and ISUP grade, significantly higher pathological T stage and more patient deaths. In addition, the expression of HNRNPA2B1 and METTL3 in the cluster 3 samples was higher, while the expression of ALKBH5 was lower. From another perspective, cluster 3 has the characteristics of high expression of m6A regulators, and clusters 1 and 2 have the characteristics of medium and lowest expressions of m6A regulatory factors, respectively (Figure 3C).
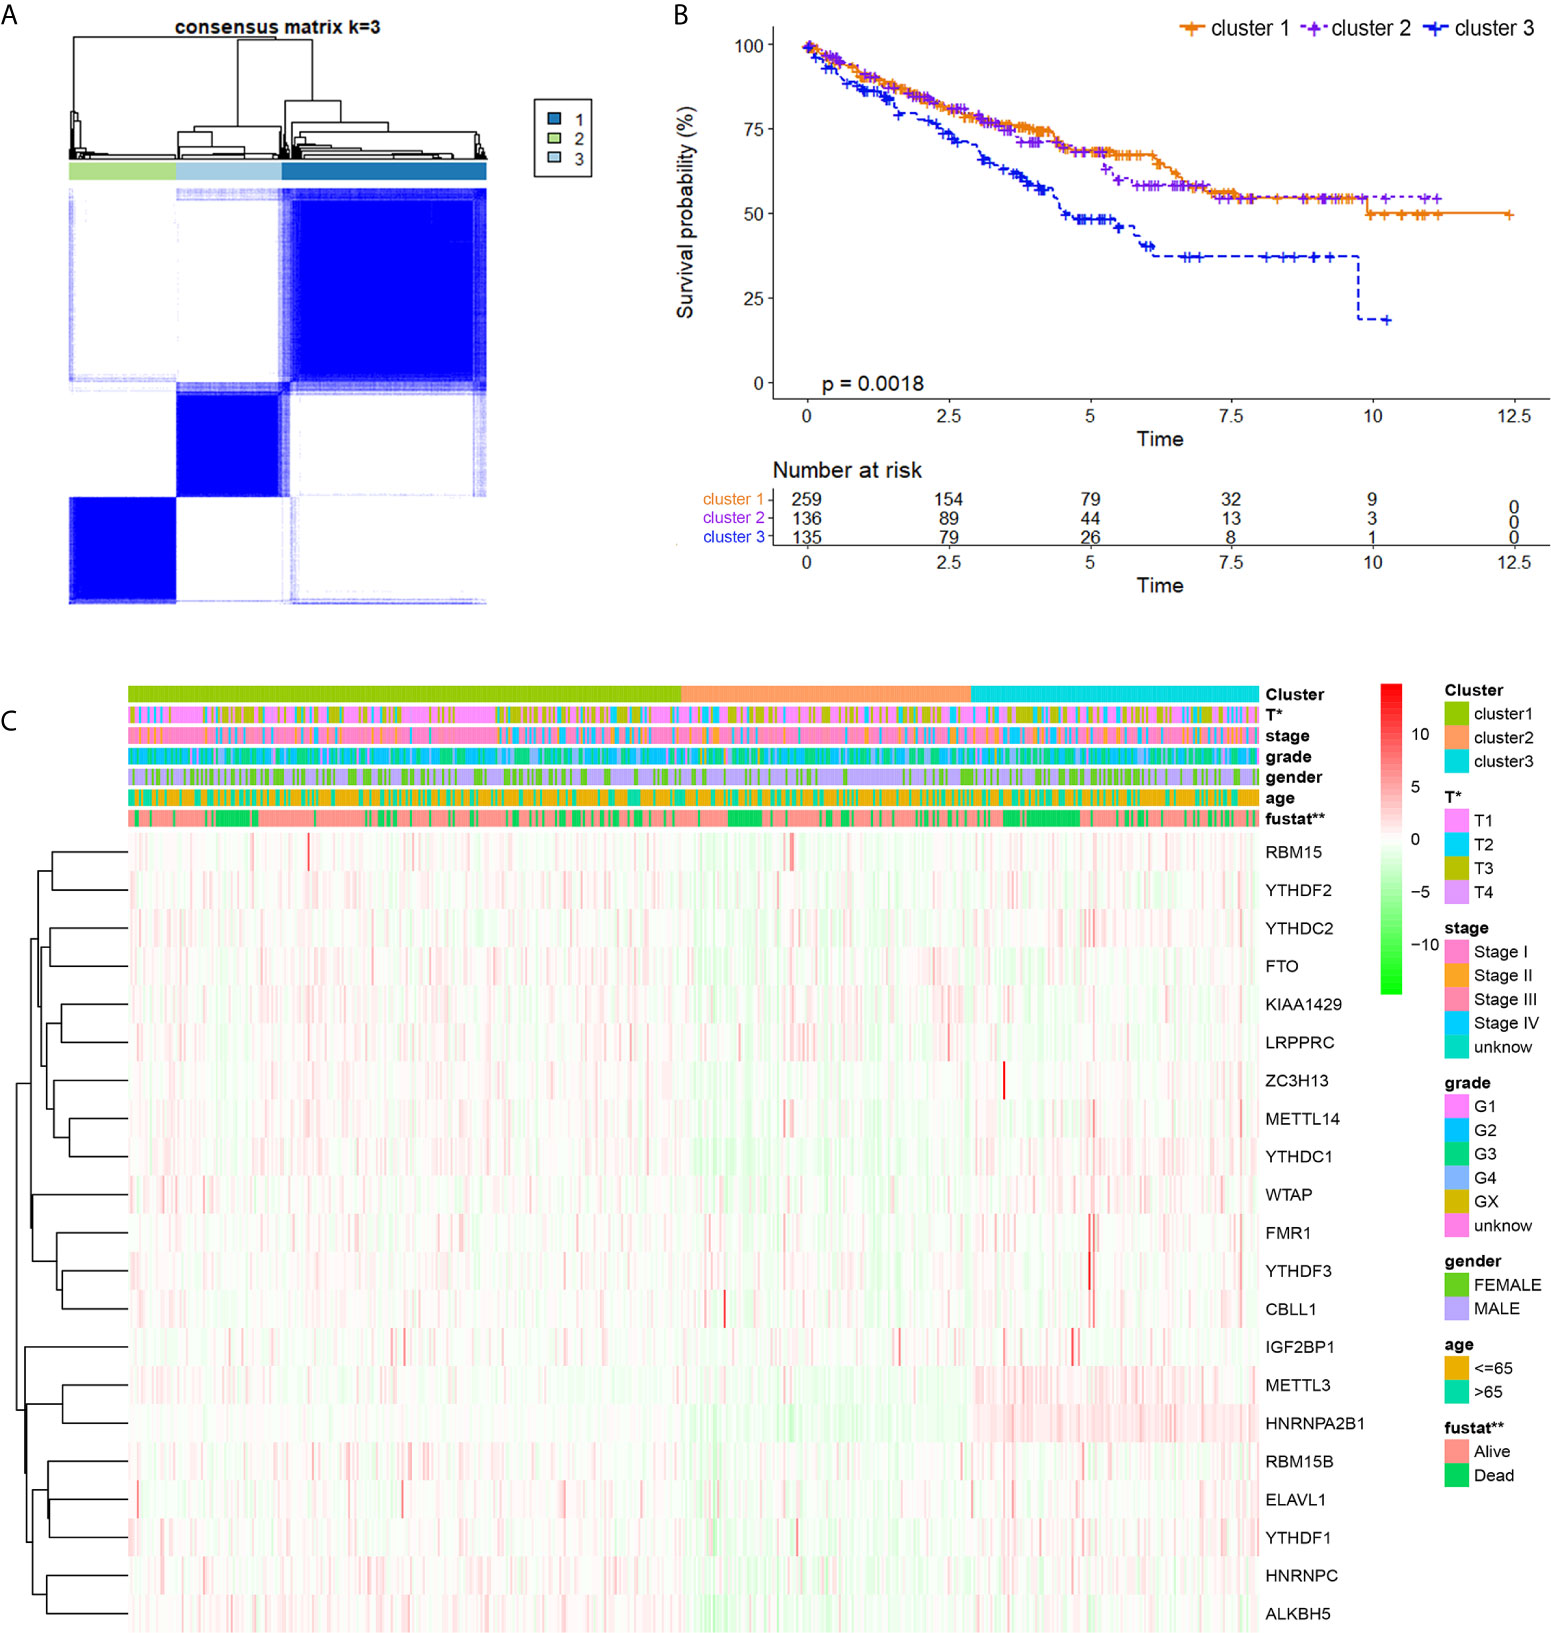
Figure 3 Identification and comparison of various m6A modification patterns of ccRCC. (A) By using ConsensusClusterPlus algorithm, ccRCC samples from TCGA cohort were automatically divided into three m6A modification subclasses, clusters 1/2/3. (B) K–M method was implemented to assess prognostic value between clusters for ccRCC patients from TCGA. (C) A heatmap displaying clinico-pathological implications of m6AMS and expression distributions of 21 m6A regulators (*p < 0.05, **p < 0.01).
Cluster 3 Exhibited Distinct Clinical Malignant Biological Phenotypes Than Clusters 1 & 2
As m6AMS cluster 1 has a similar clinical phenotype with cluster 2, we integrated clusters 1 and 2 and made comparisons of survival benefits between m6AMS cluster 3 (n = 135) and cluster 1&2 (n = 395). It indicated that cluster 3 was of significant worse overall survival (p <0.001, HR = 1.738; Figure 4A). In addition, we found that the expression levels of m6A regulators were significantly different between cluster 3 and cluster 1&2, such as significant higher expression of HNRNPA2B1, METTL3, YTHDC1 and YTHDC2 in cluster 3, while significantly down-regulated LRPPRC and FTO in cluster 3 (Figure 4B).
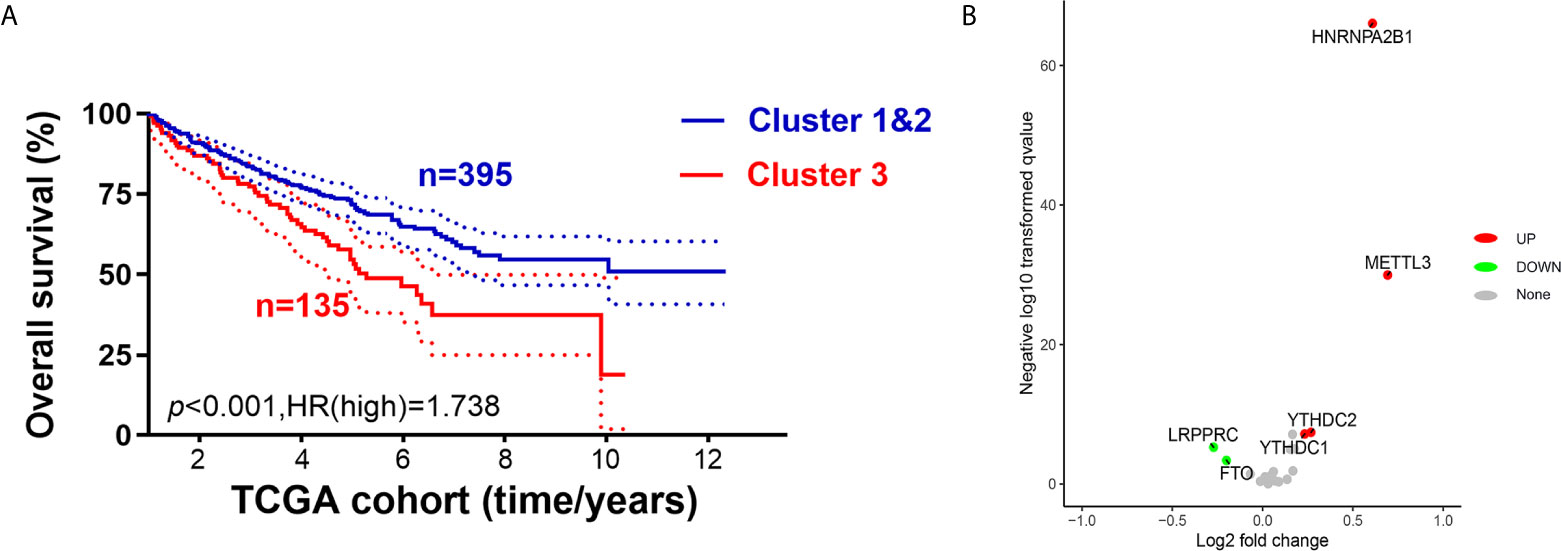
Figure 4 Cluster 3 exhibited distinct clinical malignant biological phenotype and suppressive immune microenvironment than cluster 1&2. (A) We integrated cluster 1&2 and made comparisons of survival benefits between m6AMS cluster 3 (n = 135) and cluster 1&2 (n = 395) using Kaplan–Meier method. (B) Volcano plots were constructed using fold-change values and adjusted P. The red point represents the up-regulated and the blue point indicates the down-regulated m6A regulators with statistical significance between cluster 3 and cluster 1&2.
Differential ccRCC Immune Microenvironment of m6AMS s and CNV Groups
To further explore the role of m6AMS involved in tumor immune microenvironment characterizations, a CIBERSORT algorithm was applied to evaluate the immune cells infiltration. The abundance of naïve B cells, macrophages M0, macrophages M2, mast cells resting, T cells CD4 memory resting was relatively higher in cluster 1&2. While the abundance of NK cells activated, T cells CD8 was relatively higher in cluster 3 (Figure 5A). Functional enrichment analysis indicated that compared with cluster 1&2, molecular pattern of cluster 3 was mostly enriched in steroid metabolic process, synaptic membrane, receptor ligand activity, etcetera (Figure 5B). Importantly, it was found that the expression levels of immune checkpoint related genes, such as PDCD1, LAG3, TNFSF14 and CTLA4, were significantly elevated in cluster 3, which indicated that ccRCC samples of cluster 3 are beneficial to reshape the immune-rejection microenvironment (Figure 5C).
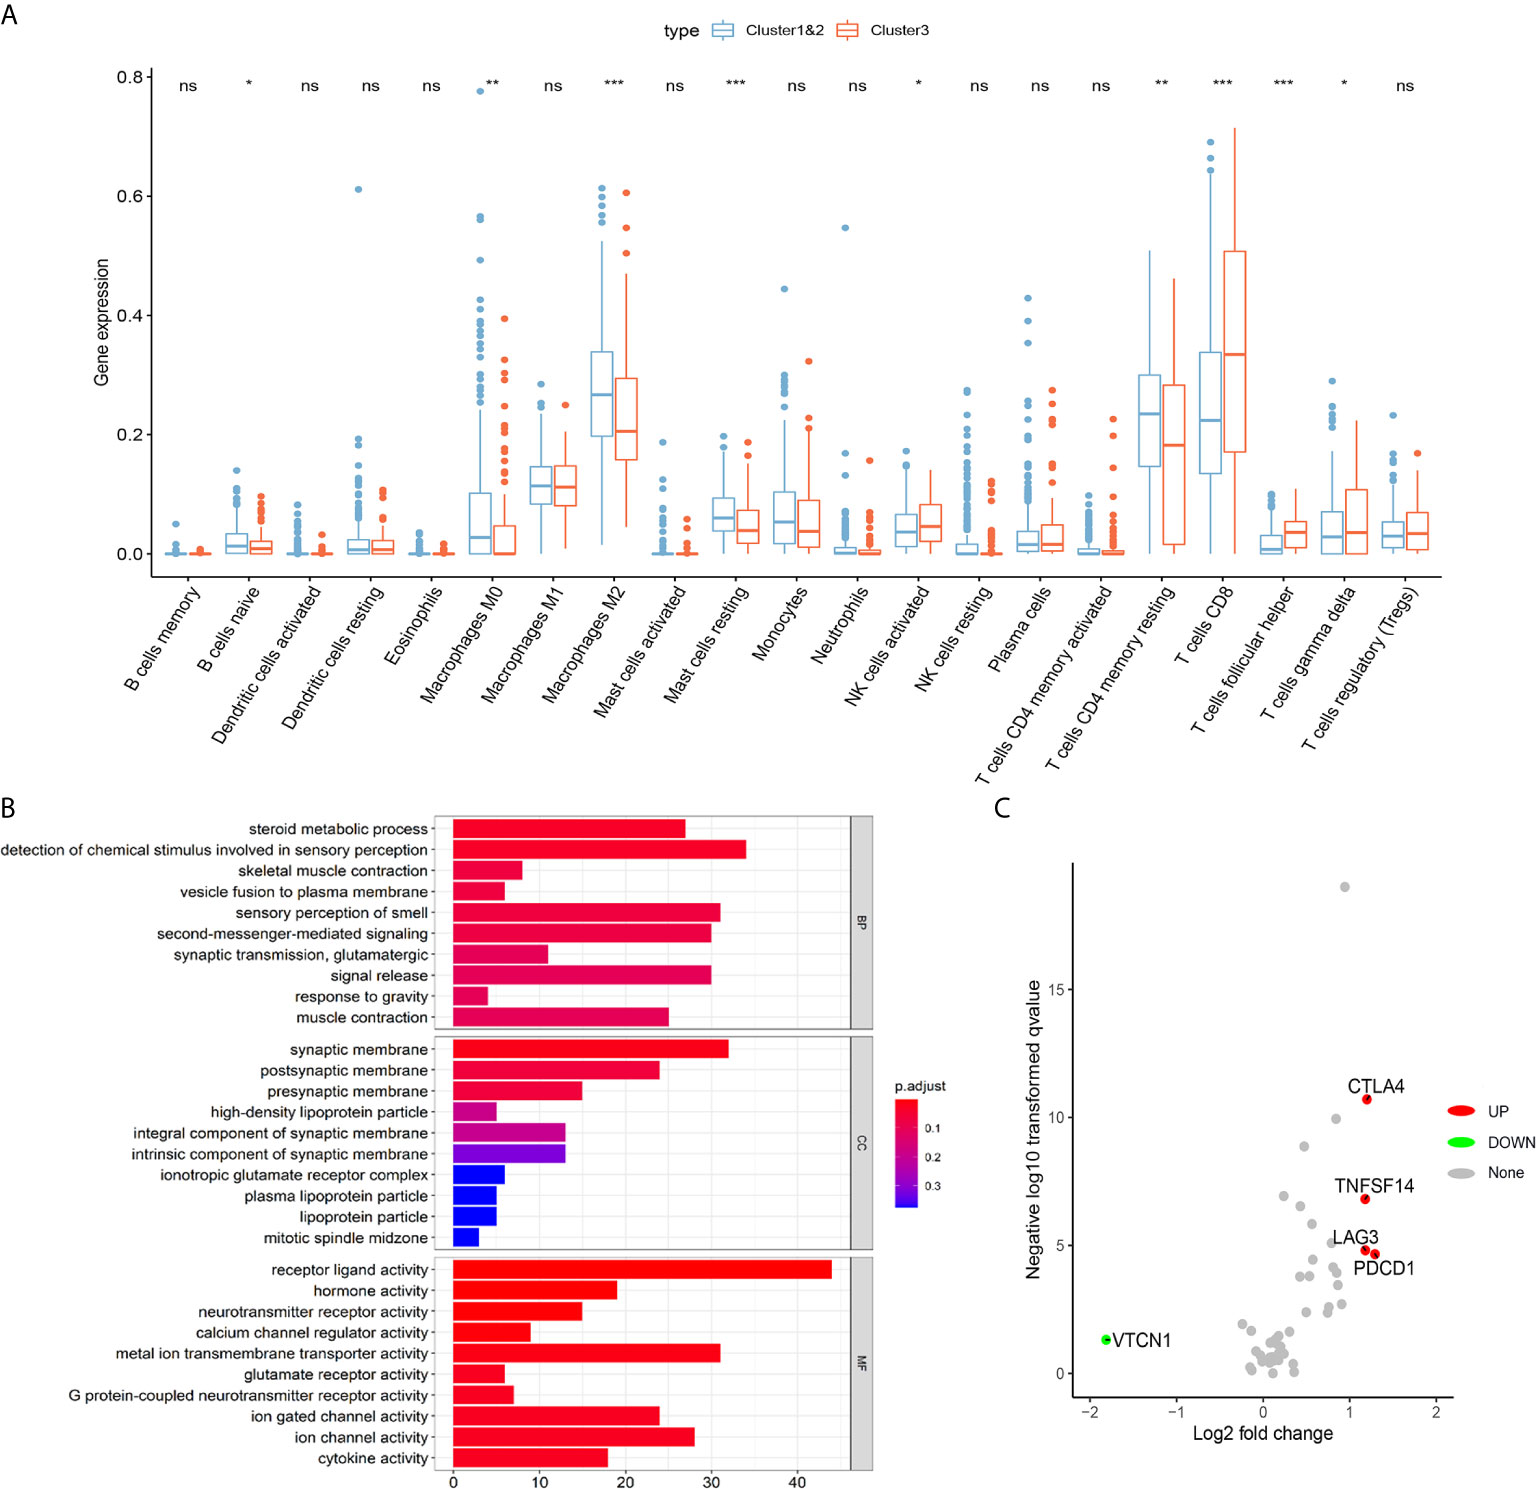
Figure 5 Distinct immune microenvironment of ccRCC between m6A scoreLow and m6A scoreHigh groups in silico. (A) To further explore role of m6AMS involved in tumor immune microenvironment characterizations, a CIBERSORT algorithm was applied to evaluate the immune cells infiltration. (B) Functional enrichment analyses were performed to indicate to annotate biological process, molecular function and cellular components of cluster 1&2 and cluster 3. (C) Volcano plots were constructed using fold-change values and adjusted P. The red point represents the up-regulated and the blue point indicates the down-regulated immune checkpoint molecules with statistical significance between cluster 3 and cluster 1&2 (ns, not significant; *p < 0.05, **p < 0.01, ***p < 0.001).
Besides, we summarized the difference of immune cells infiltrates between 21 m6A regulators CNV groups in Supplementary Figure 2A. Th1 cells was significantly amplificated in the wide-type group (n = 30) compared with the mutation group (n = 119) (p <0.001), while Th17, exhausted T cell and macrophages were significantly decreased in the wide-type group compared with the mutation group (p <0.01; Supplementary Figure 2B). To promote clinical translation, we explored the correlation between 21 m6A regulators expression and the sensitivity of GDSC drugs (top 30) in pan-cancer in Supplementary Figure 2C. It showed strong predictive value of anti-m6A regulators drugs, such as trametinib, PD-0325901, RDEA119, selumetinib and BHG712.
Distinct Immune Microenvironment of ccRCC Between m6A scoreLow and m6A ScoreHigh Groups In Silico and In Vitro
Significantly differential immune cells infiltrations and immune check-point expression were identified in silico, while the alterations of various immune indicators in ccRCC immune microenvironment of different m6AMS clusters remain unclear. In Figure 6A, a TIDE algorithm indicated that m6A scoreLow group (cluster 1&2) have significantly elevated TIDE score compared with m6A scoreHigh group (cluster 3), indicating that ccRCC patients in cluster 3 were more inclined to benefit from ICTs. Next, after identification and classification of ccRCC samples from FUSCC cohort, we performed H&E and immunohistochemistry (IHC) staining analysis in different m6AMS clusters. It was found that there was conspicuous tertiary lymphoid tissue (TLS) in the high m6A score group (Figure 6B). IHC analysis indicated that the high m6A score group were of more aggressive phenotype, elevated level of glycolysis and higher expression of PD-L1, which implicated that patients in high m6A score group could gain more survival benefits from ICTs. Interestingly, in the m6A scoreHigh group, the infiltration of CD8+ T cells, CD4+ FOXP3+ Treg cells and CD3+ CD4+ CD8+ TCRn immune cells were relatively higher (Figure 6C). Besides, the expression level of PD-L1 was also significantly elevated in the cluster 3 group, which implicated the high m6A score could be associated with suppressive tumor immune microenvironment and predictive response to ICTs.
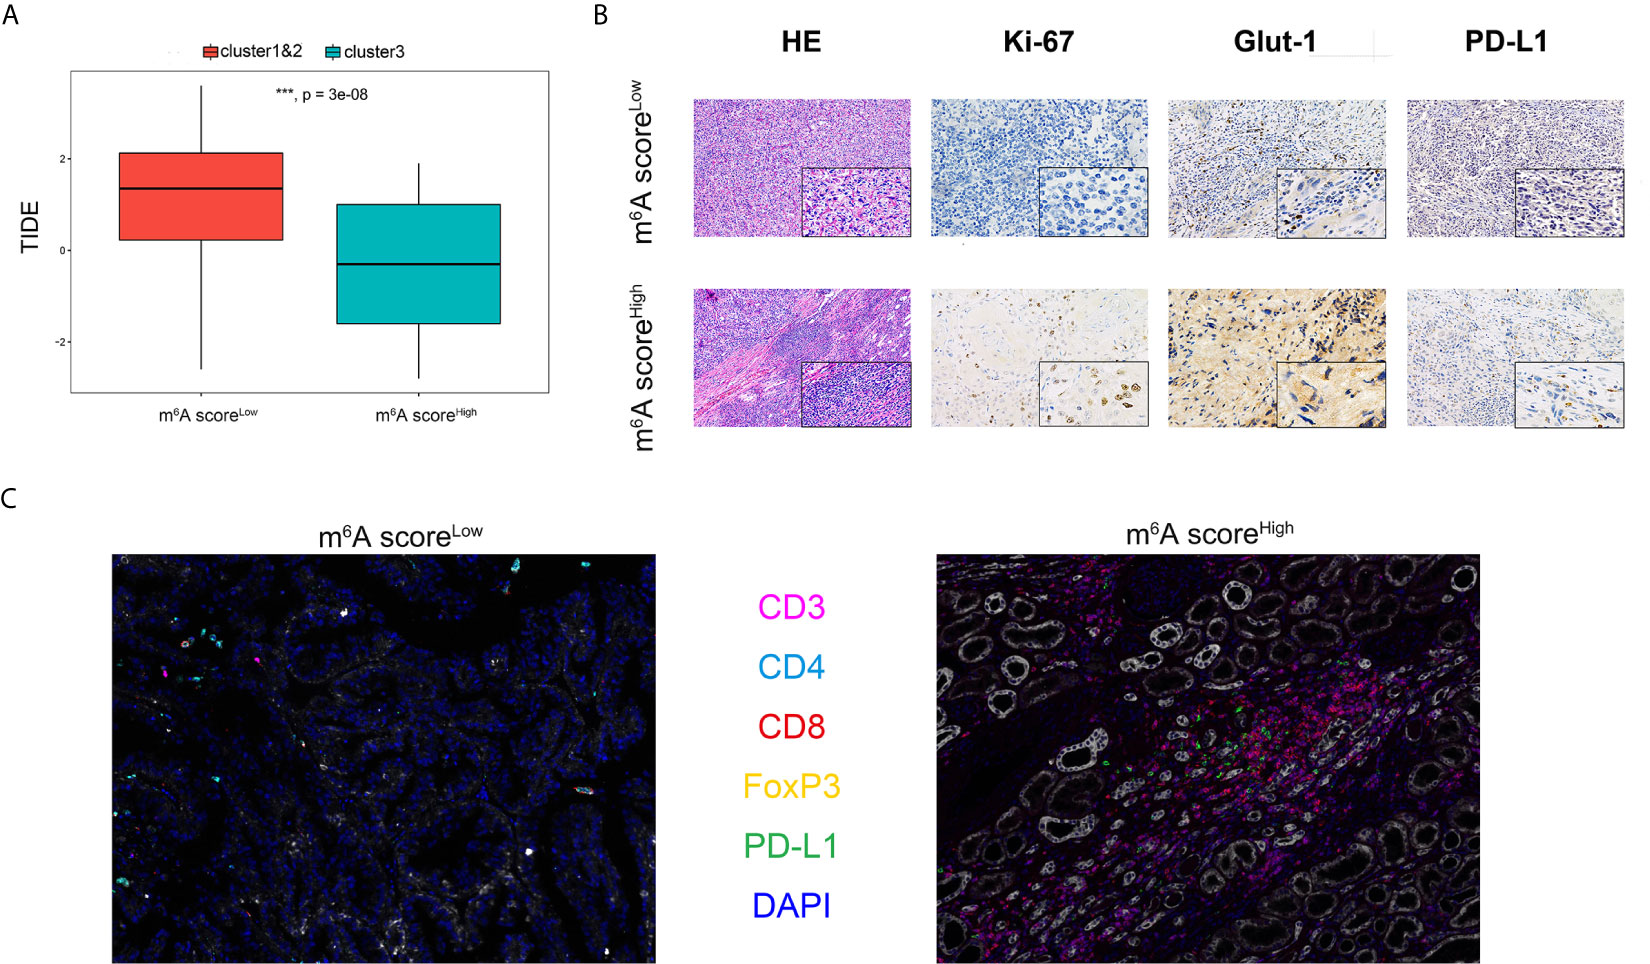
Figure 6 Distinct immune microenvironment of ccRCC between m6A scoreLow and m6A scoreHigh groups in silico and in vitro. (A) TIDE algorithm was used to indicate association between m6A score and predictive benefits for ccRCC patients receiving from ICTs. (B) H&E and immunohistochemistry staining were performed in different m6AMS clusters. (C) The infiltration of CD8+, CD4+, CD3+ and FOXP3+ immune cells and expression level of PD-L1 were evaluated using opal multispectral imaging (***p < 0.001).
The Genomic Classifier Showed Strong Ability in Predicting ICTs Response Based on Two Testing Cohorts
As the cluster 3 was of significant suppressive microenvironment, we tended to construct a genomic classifier and explored its ability of predicting ICTs response as described in the methods. The classifier could stratify the patients into m6A scoreLow (cluster 1&2) and m6A scoreHigh (cluster 3) group. In a total of 347 patients receiving ICTs from both IMvigor210 (n = 292) and FUSCC (n = 55) cohorts, there are significantly elevated patients with clinical benefit (PR/CR) in high m6A score group (Figures 7A, B). ROC curves indicated that the genomic classifier has a good accuracy and stability predicting responses to ICTs (IMvigor210 cohort: AUC = 0.65, p <0.001; FUSCC cohort: AUC = 0.741, p <0.001; Figures 7C, D).
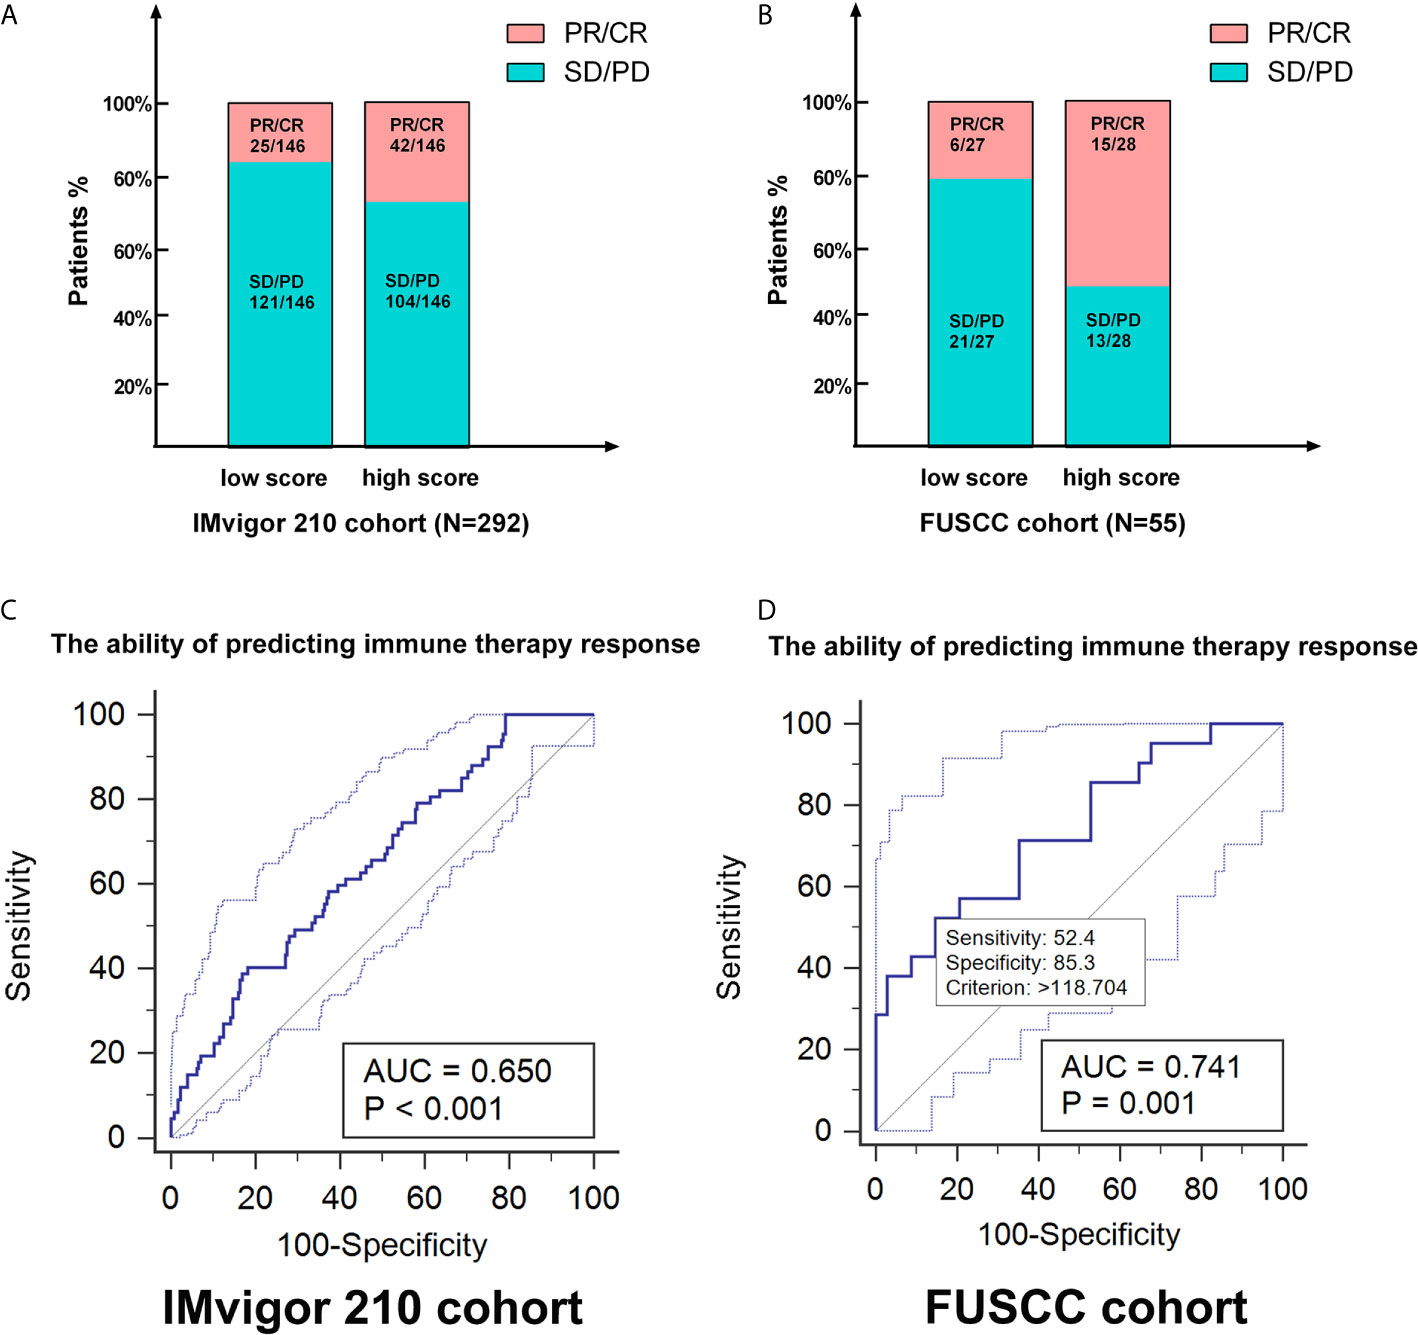
Figure 7 The genomic classifier showed strong ability in predicting ICTs response based on testing and validation cohorts. (A, B) As the cluster 3 was of significant suppressive microenvironment, we tended to construct a genomic classifier and explored its ability of predicting ICTs response. The classifier could stratify the patients into m6A scoreLow (cluster 1&2) and m6A scoreHigh (cluster 3) group. (C, D) ROC curves indicated that the genomic classifier has a good accuracy and stability predicting responses to ICTs (IMvigor210 cohort: AUC=0.65, p < 0.001; FUSCC cohort: AUC=0.742, p < 0.001).
Discussion
In the past years, many new strategies for the treatment of ccRCC have emerged, including partial or radical nephrectomy (33), targeted therapies (34), or ICTs. It is worth noting that the inherent phenotypic heterogeneity of ccRCC could aggravate tumor invasion, metastasis and drug resistance, and the non-genetic heterogeneity can be transmitted through epigenetic regulation and other mechanisms (35). Therefore, is an urgent need to construct an epigenetic genomic-based stratification model to analyze the prognosis and TME of ccRCC, thus guiding individual clinical diagnosis and treatment strategies. Based on large-scale pan cancer and ccRCC patients from public and real-world cohorts, this study first described an m6A regulators-mediated methylation modification model which improves the prognostic accuracy of immune contexture and characterizations in ccRCC microenvironment.
Increasing studies have shown that tumor metastasis and invasion are inseparable from the microenvironment and purity of tumor cells (36). A comprehensive analysis of the role of TME in ccRCC helps to identify the tumor immunophenotype of ccRCC, explores independent prognostic indicators and novel therapeutic targets, thereby improving the prognosis of patients and the ability to predict the effect of immunotherapy (37–39). Studies have shown that tumor purity of TME is significantly related to the clinical characteristics, genome expression, and biological characteristics of tumor patients. Previous studies also indicated that TME-based tumor purity plays a key role in tumor carcinogenesis and revealed significantly epigenetic regulators of ccRCC, opening up novel approaches in precise and personalized medicine (40).
Recent progress in the mapping of the m6A landscape in mRNAs, coupled with the ability to manipulate m6A deposition and recognition of enzymes, has begun to reveal the different molecular consequences associated with RNA methylation and its core role in different biological processes, including regulation anticancer immunity (41, 42). Despite the tremendous progress made in recent years, an understanding of how m6A modification affects immune phenotype is still in its infancy (19, 43, 44). In this study, differential m6AMS was significantly enriched in abundance of immune cells infiltration, metabolic and cancer-related immune pathways. It showed a significant immune carcinogenic status, antigen processing pathways, Macrophages M0, CD8+ T cells, CD4+ FOXP3+ Treg cells and TCRn cells. After analyzing the characteristics of different m6Acluster in different TME cells, we found that immunophenotypic classification has a strong association with suppressive tumor immune microenvironment and predictive response to ICTs for ccRCC patients. Interestingly, the m6AMS classifier has predictive responses to ICTs in testing cohorts, showing strong demonstrating higher predictive performance. However, more studies are needed to decipher the diversity of abnormal methylation or recognition abnormality of methylation position and tumor immunophenotype. Determining the role of various m6A modification modes in ccRCC microenvironment could improve our understanding of anti-tumor immune response and lay the foundation for personalized treatment of ccRCC patients (45–47).
However, this study has some limitations. First, our research failed to deeply clarify the underlying mechanism of m6A regulators and m6AMS involved in ccRCC. So, we investigated the TIME characterizations of the differential m6AMS on intra-tumoral heterogeneity of ccRCC in silico and in vivo. Second, although the classifier was constructed and validated using multiply datasets, due to the nature limitation of retrospective analysis, the results of our study needed to be validated in multicenter or prospective studies. Subsequently, we validated the predictive value of m6AMS in patients receiving ICTs or ICTs combined with from an Asian real-world cohort.
Conclusion
This study described a m6A regulators-mediated methylation modification model which improves the prognostic accuracy of immune contexture and characterizations in ccRCC microenvironment. Immune-rejection cluster 3 has pro-tumorigenic immune infiltration, and shows significant clinical benefits for ccRCC patients receiving ICTs. Our discovery of the novel independent prognostic indicators in ccRCC highlights the relationship between tumor epigenetic heterogeneity and immune contexture.
Data Availability Statement
The raw data supporting the conclusions of this article will be made available by the authors, without undue reservation.
Ethics Statement
All of the study designs and test procedures were performed in accordance with the Helsinki Declaration II. The Ethics approval and participation consent of this study was approved and agreed by the ethics committee of Fudan University Shanghai Cancer Center (FUSCC, Shanghai, China). The patients/participants provided their written informed consent to participate in this study. Written informed consent was obtained from the individual(s) for the publication of any potentially identifiable images or data included in this article.
Author Contributions
Conceptualization: WX, XT, and AA. Data curation: WX, XT, WL, AA, and JS. Formal analysis: WX, WL, GW, and XT. Funding acquisition: YQ, HZ, and DY. Investigation: WX, XT, WL, AA, and JS. Methodology: WX, XT, AA, JS, and WZ. Resources: FW, GS, GW, YQ, and HZ. Software: XT, WL, WZ, and GS. Supervision: YQ, GW, HZ, and DY. Validation: WX, XT, WL, and AA. Visualization: WX, XT, AA, and JS. Roles/Writing – original draft: WX, WL, and XT. Writing – review & editing: GW, YQ, HZ, and DY. All authors contributed to the article and approved the submitted version.
Funding
This work is supported by Grants from National Key Research and Development Project (No.2019YFC1316000), “Fuqing Scholar” Student Scientific Research Program of Shanghai Medical College, Fudan University (No. FQXZ202112B), the Natural Science Foundation of Shanghai (No.20ZR1413100) and Shanghai Municipal Health Bureau (No.2020CXJQ03) and high -level talent scientific research project of Affiliated Hospital of Youjiang Medical College for Nationalities (No. Y202011706).
Conflict of Interest
The authors declare that the research was conducted in the absence of any commercial or financial relationships that could be construed as a potential conflict of interest.
Acknowledgments
We are grateful to all patients for their dedicated participation in the current study. We expressed our sincere gratitude to Ms. ZOO for editing figures and drawing the schematic diagram of m6A of this study.
Supplementary Material
The Supplementary Material for this article can be found online at: https://www.frontiersin.org/articles/10.3389/fonc.2021.709579/full#supplementary-material
Abbreviations
AUC, area under curve; ccRCC, clear cell renal cell carcinoma; CNV, Copy number variation; FUSCC, Fudan University Shanghai Cancer Center; HE, hematoxylin–eosin; ICTs, immune check-point therapies; IHC, immunohistochemistry; mA, N-methyladenosine; m6A, N6-methyladenosine; m6AMS, m6A modification subclasses; RCC, Renal cell carcinoma; ROC, Receiver operating characteristic; TCGA, the Cancer Genome Atlas; TIDE, Tumor Immune Dysfunction and Exclusion; TLS, Tertiary lymphoid structure; TME, tumor microenvironment; TKIs, tyrosine-kinase inhibitors.
References
1. Siegel RL, Miller KD, Jemal A. Cancer Statistics, 2020. CA Cancer J Clin (2020) 70(1):7–30. doi: 10.3322/caac.21590
2. Capitanio U, Montorsi F. Renal Cancer. Lancet (2016) 387(10021):894–906. doi: 10.1016/S0140-6736(15)00046-X
3. Choueiri TK, Motzer RJ. Systemic Therapy for Metastatic Renal-Cell Carcinoma. N Engl J Med (2017) 376(4):354–66. doi: 10.1056/NEJMra1601333
4. Cancer Genome Atlas Research N. Comprehensive Molecular Characterization of Clear Cell Renal Cell Carcinoma. Nature (2013) 499(7456):43–9. doi: 10.1038/nature12222
5. Ma CG, Xu WH, Xu Y, Wang J, Liu WR, Cao DL, et al. Identification and Validation of Novel Metastasis-Related Signatures of Clear Cell Renal Cell Carcinoma Using Gene Expression Databases. Am J Transl Res (2020) 12(8):4108–26.
6. Clark DJ, Dhanasekaran SM, Petralia F, Pan J, Song X, Hu Y, et al. Integrated Proteogenomic Characterization of Clear Cell Renal Cell Carcinoma. Cell (2019) 179(4):964–983 e31. doi: 10.1016/j.cell.2019.10.007
7. Huang H, Weng H, Chen J. M(6)A Modification in Coding and Non-Coding RNAs: Roles and Therapeutic Implications in Cancer. Cancer Cell (2020) 37(3):270–88. doi: 10.1016/j.ccell.2020.02.004
8. Zaccara S, Ries RJ, Jaffrey SR. Reading, Writing and Erasing mRNA Methylation. Nat Rev Mol Cell Biol (2019) 20(10):608–24. doi: 10.1038/s41580-019-0168-5
9. Kane SE, Beemon K. Precise Localization of M6a in Rous Sarcoma Virus RNA Reveals Clustering of Methylation Sites: Implications for RNA Processing. Mol Cell Biol (1985) 5(9):2298–306. doi: 10.1128/MCB.5.9.2298
10. Jia G, Fu Y, Zhao X, Dai Q, Zheng G, Yang Y, et al. N6-Methyladenosine in Nuclear RNA Is a Major Substrate of the Obesity-Associated FTO. Nat Chem Biol (2011) 7(12):885–7. doi: 10.1038/nchembio.687
11. Wiener D, Schwartz S. The Epitranscriptome Beyond M(6)A. Nat Rev Genet (2020) 22(2). doi: 10.1038/s41576-020-00295-8
12. Zhang G, Zhang Y, Jin J. The Ultrafast and Accurate Mapping Algorithm FANSe3: Mapping a Human Whole-Genome Sequencing Dataset Within 30 Minute. Phenomics (2021) 1(1):22–30. doi: 10.1007/s43657-020-00008-5
13. Deng X, Su R, Weng H, Huang H, Li Z, Chen J. RNA N(6)-Methyladenosine Modification in Cancers: Current Status and Perspectives. Cell Res (2018) 28(5):507–17. doi: 10.1038/s41422-018-0034-6
14. Weng H, Huang H, Wu H, Qin X, Zhao BS, Dong L, et al. METTL14 Inhibits Hematopoietic Stem/Progenitor Differentiation and Promotes Leukemogenesis via mRNA M(6)A Modification. Cell Stem Cell (2018) 22(2):191–205 e9. doi: 10.1016/j.stem.2017.11.016
15. Lin S, Choe J, Du P, Triboulet R, Gregory RI. The M(6)A Methyltransferase METTL3 Promotes Translation in Human Cancer Cell. Mol Cell (2016) 62(3):335–45. doi: 10.1016/j.molcel.2016.03.021
16. Choe J, Lin S, Zhang W, Liu Q, Wang L, Ramirez-Moya J, et al. mRNA Circularization by METTL3-Eif3h Enhances Translation and Promotes Oncogenesis. Nature (2018) 561(7724):556–60. doi: 10.1038/s41586-018-0538-8
17. Liu T, Wei Q, Jin J, Luo Q, Liu Y, Yang Y, et al. The M6a Reader YTHDF1 Promotes Ovarian Cancer Progression via Augmenting EIF3C Translation. Nucleic Acids Res (2020) 48(7):3816–31. doi: 10.1093/nar/gkaa048
18. Shi Y, Fan S, Wu M, Zuo Z, Li X, Jiang L, et al. YTHDF1 Links Hypoxia Adaptation and Non-Small Cell Lung Cancer Progression. Nat Commun (2019) 10(1):4892. doi: 10.1038/s41467-019-12801-6
19. Han D, Liu J, Chen C, Dong L, Liu Yi, Chang R, et al. Anti-Tumour Immunity Controlled Through mRNA M(6)A Methylation and YTHDF1 in Dendritic Cells. Nature (2019) 566(7743):270–4. doi: 10.1038/s41586-019-0916-x
20. Yang Y, Wei Q, Tang Y, Yuanyuan W, Luo Q, Zhao H, et al. Loss of Hnrnpa2b1 Inhibits Malignant Capability and Promotes Apoptosis via Down-Regulating Lin28B Expression in Ovarian Cancer. Cancer Lett (2020) 475:43–52. doi: 10.1016/j.canlet.2020.01.029
21. Barcelo C, Etchin J, Mansour MR, Sanda T, Ginesta MM, Sanchez-Arevalo LVJ, et al. Ribonucleoprotein HNRNPA2B1 Interacts With and Regulates Oncogenic KRAS in Pancreatic Ductal Adenocarcinoma Cells. Gastroenterology (2014) 147(4):882–892 e8. doi: 10.1053/j.gastro.2014.06.041
22. Wang Y, Cong R, Liu S, Zhu B, Wang X, Xing Q. Decreased Expression of METTL14 Predicts Poor Prognosis and Construction of a Prognostic Signature for Clear Cell Renal Cell Carcinoma. Cancer Cell Int (2021) 21(1):46. doi: 10.1186/s12935-020-01738-2
23. Wang J, Zhang C, He W, Gou X. Effect of M(6)A RNA Methylation Regulators on Malignant Progression and Prognosis in Renal Clear Cell Carcinoma. Front Oncol (2020) 10:3. doi: 10.3389/fonc.2020.00003
24. Huang S, Wang Y, Zhou Z, Yu Q, Yu Y, Yang Y, et al. Distribution Atlas of COVID-19 Pneumonia on Computed Tomography: A Deep Learning Based Description. Phenomics (2021) 1(2):62–72. doi: 10.1007/s43657-021-00011-4
25. Zhang B, Wu Q, Li B, Wang D, Wang L, Zhou YL. mA Regulator-Mediated Methylation Modification Patterns and Tumor Microenvironment Infiltration Characterization in Gastric Cancer. Mol Cancer (2020) 19(1):53. doi: 10.1186/s12943-020-01170-0
26. Liu CJ, Hu FF, Xia MX, Han L, Zhang Q, Guo AY. GSCALite: A Web Server for Gene Set Cancer Analysis. Bioinformatics (2018) 34(21):3771–2. doi: 10.1093/bioinformatics/bty411
27. Wilkerson MD, Hayes DN. ConsensusClusterPlus: A Class Discovery Tool With Confidence Assessments and Item Tracking. Bioinf (Oxf Engl) (2010) 26(12):1572–3. doi: 10.1093/bioinformatics/btq170
28. Ritchie ME, Phipson B, Wu D, Hu Y, Law CW, Shi W, et al. Limma Powers Differential Expression Analyses for RNA-Sequencing and Microarray Studies. Nucleic Acids Res (2015) 43(7):e47. doi: 10.1093/nar/gkv007
29. Newman AM, Liu CL, Green MR, Gentles AJ, Feng W, Xu Y, et al. Robust Enumeration of Cell Subsets From Tissue Expression Profiles. Nat Methods (2015) 12(5):453–7. doi: 10.1038/nmeth.3337
30. Yu G, Wang L-G, Han Y, He Q-H. Clusterprofiler: An R Package for Comparing Biological Themes Among Gene Cluster. 16: (5):284–7. doi: 10.1089/omi.2011.0118
31. Jiang P, Gu S, Pan D, Fu J, Sahu A, Hu X, et al. Signatures of T Cell Dysfunction and Exclusion Predict Cancer Immunotherapy Response. Nat Med (2018) 24(10):1550–8. doi: 10.1038/s41591-018-0136-1
32. Wang J, Xu W, Wang B, Lin G, Wei Y, Abudurexiti M, et al. GLUT1 Is an AR Target Contributing to Tumor Growth and Glycolysis in Castration-Resistant and Enzalutamide-Resistant Prostate Cancers. Cancer Lett (2020) 485:45–55. doi: 10.1016/j.canlet.2020.05.007
33. Pierorazio PM, Johnson MH, Ball MW, Gorin MA, Trock BJ, Chang P, et al. Five-Year Analysis of a Multi-Institutional Prospective Clinical Trial of Delayed Intervention and Surveillance for Small Renal Masses: The DISSRM Registry. Eur Urol (2015) 68(3):408–15. doi: 10.1016/j.eururo.2015.02.001
34. Motzer RJ, Hutson TE, Cella D, Reeves J, Hawkins R, Guo J, et al. Overall Survival in Renal-Cell Carcinoma With Pazopanib Versus Sunitinib. N Engl J Med (2014) 370(18):1769–70. doi: 10.1056/NEJMc1400731
35. Black JRM, McGranahan N. Genetic and Non-Genetic Clonal Diversity in Cancer Evolution. Nat Rev Cancer (2021) 13(6). doi: 10.1038/s41568-021-00336-2
36. Zhang C, Cheng W, Ren X, Wang Z, Liu X, Li G, et al. Tumor Purity as an Underlying Key Factor in Glioma. Clin Cancer Res (2017) 23(20):6279–91. doi: 10.1158/1078-0432.CCR-16-2598
37. Yoshihara K, Shahmoradgoli M, Martínez E, Vegesna R, Kim H, Torres-Garcia W, et al. Inferring Tumour Purity and Stromal and Immune Cell Admixture From Expression Data. Nat Commun (2013) 4:2612. doi: 10.1038/ncomms3612
38. Rhee JK, Jung YC, Kim KR, Yoo J, Kim J, Lee YJ, et al. Impact of Tumor Purity on Immune Gene Expression and Clustering Analyses Across Multiple Cancer Type. Cancer Immunol Res (2018) 6(1):87–97. doi: 10.1158/2326-6066.CIR-17-0201
39. Xu W, Liu WR, Xu Y, Tian X, Anwaier A, Su JQ, et al. Hexokinase 3 Dysfunction Promotes Tumorigenesis and Immune Escape by Upregulating Monocyte/Macrophage Infiltration Into the Clear Cell Renal Cell Carcinoma Microenvironment. Int J Biol Sci (2021) 17(9):2205–22. doi: 10.7150/ijbs.58295
40. Xu WH, Xu Y, Wang J, Wan FN, Wang HK, Cao DL, et al. Prognostic Value and Immune Infiltration of Novel Signatures in Clear Cell Renal Cell Carcinoma Microenvironment. Aging (Albany NY) (2019) 11(17):6999–7020. doi: 10.18632/aging.102233
41. Shulman Z, Stern-Ginossar N. The RNA Modification N(6)-Methyladenosine as a Novel Regulator of the Immune System. Nat Immunol (2020) 21(5):501–12. doi: 10.1038/s41590-020-0650-4
42. Dominissini D, Moshitch-Moshkovitz S, Schwartz S, Salmon-Divon M, Ungar L, Osenberg S, et al. Topology of the Human and Mouse M6a RNA Methylomes Revealed by M6a-Seq. Nature (2012) 485(7397):201–6. doi: 10.1038/nature11112
43. Wang H, Hu X, Huang M, Liu J, Gu Y, Ma L, et al. Mettl3-Mediated mRNA M(6)A Methylation Promotes Dendritic Cell Activation. Nat Commun (2019) 10(1):1898. doi: 10.1038/s41467-019-09903-6
44. Zhang B, Wu Q, Li B, Wang D, Wang L, Zhou YL. M(6)A Regulator-Mediated Methylation Modification Patterns and Tumor Microenvironment Infiltration Characterization in Gastric Cancer. Mol Cancer (2020) 19(1):53. doi: 10.1186/s12943-020-01170-0
45. Wei J, Liu F, Lu Z, Fei Q, Ai Y, He PC, et al. Differential M(6)A, M(6)Am, and M(1)A Demethylation Mediated by FTO in the Cell Nucleus and Cytoplas. Mol Cell (2018) 71(6):973–85.e5. doi: 10.1016/j.molcel.2018.08.011
46. Zhu ZM, Huo FC, Pei DS. Function and Evolution of RNA N6-Methyladenosine Modification. Int J Biol Sci (2020) 16(11):1929–40. doi: 10.7150/ijbs.45231
Keywords: clear cell renal cell carcinoma, tumor microenvironment, N6-methyladenosine, m6A modification subclasses, immunotherapies
Citation: Xu W, Tian X, Liu W, Anwaier A, Su J, Zhu W, Wan F, Shi G, Wei G, Qu Y, Zhang H and Ye D (2021) m6A Regulator-Mediated Methylation Modification Model Predicts Prognosis, Tumor Microenvironment Characterizations and Response to Immunotherapies of Clear Cell Renal Cell Carcinoma. Front. Oncol. 11:709579. doi: 10.3389/fonc.2021.709579
Received: 14 May 2021; Accepted: 21 June 2021;
Published: 06 July 2021.
Edited by:
Bin Lu, Wenzhou Medical University, ChinaReviewed by:
Changliang Shan, Nankai University, ChinaGaya Punnia-Moorthy, Royal Prince Alfred Hospital, Australia
Copyright © 2021 Xu, Tian, Liu, Anwaier, Su, Zhu, Wan, Shi, Wei, Qu, Zhang and Ye. This is an open-access article distributed under the terms of the Creative Commons Attribution License (CC BY). The use, distribution or reproduction in other forums is permitted, provided the original author(s) and the copyright owner(s) are credited and that the original publication in this journal is cited, in accordance with accepted academic practice. No use, distribution or reproduction is permitted which does not comply with these terms.
*Correspondence: Dingwei Ye, dwyelie@163.com; Yuanyuan Qu, quyy1987@163.com; Hailiang Zhang, zhanghl918@163.com; Gaomeng Wei, 55800954@qq.com
†These authors have contributed equally to this work