 Xiaotong Huang
 Ziwei Wang1,2
- 1Department of Ultrasound, West China Second University Hospital, Sichuan University, Chengdu, China
- 2Key Laboratory of Birth Defects and Related Diseases of Women and Children, Sichuan University, Chengdu, China
Objectives: To evaluate the diagnostic accuracy of the ADNEX model for ovarian cancer at the 15% cut-off value.
Methods: Studies on the identified diagnosis of the ADNEX model for ovarian cancer published in PubMed, Embase, the Cochrane Library and Web of Science databases from January 1st, 2014 to February 20th, 2021 were searched. Two researchers independently screened the retrieved studies and extracted the basic features and parameter data. The quality of the eligible studies was evaluated by Quality Assessment of Diagnostic Accuracy Studies-2, and the result was summarized by Review Manager 5.3. Meta-Disc 1.4 and STATA 16.0 were used in statistical analysis. Heterogeneity of this meta-analysis was calculated. Meta-regression was performed to investigate the potential sources of heterogeneity. Sensitivity analysis and Deek’s funnel plot analysis were conducted to evaluate the stability and publication bias, respectively.
Results: 280 studies were initially retrieved through the search strategy, and 10 eligible studies were ultimately included. The random-effects model was selected for data synthesis. The pooled sensitivity, specificity, positive likelihood ratio, negative likelihood ratio, diagnostic odds ratio and the area under the summary receiver operating characteristic curve were 0.92 (95% CI: 0.89–0.94), 0.82 (95% CI: 0.78–0.86), 5.2 (95% CI: 4.1–6.4), 0.10 (95% CI: 0.07–0.13), 54.0 (95% CI: 37.0–77.0) and 0.95 (95% CI: 0.91–0.95). Meta-regression based on study design, country, enrollment and blind method was not statistically significant. This meta-analysis was stable with no obvious publication bias.
Conclusions: The ADNEX model at the 15% cut-off had high diagnostic accuracy in identifying ovarian cancer.
Introduction
Ovarian cancer is seen as the most aggressive gynecological tumor. The morbidity of ovarian cancer is second to cervical cancer and endometrial cancer, but the mortality ranks first of gynecological tumors. So it is called the “silent killer”. More than 310,000 new cases of ovarian cancer were diagnosed globally in 2020, with nearly 210,000 new deaths, significantly higher than in 2018 (1, 2). The diagnostic reference standard of ovarian cancer depends on pathological examination, but preoperative diagnosis influences doctors’ clinical decisions. Studies indicated that the stage of ovarian cancer is one of the decisive factors affecting the prognosis. For example, the 5-year survival rate of patients with stage IV ovarian cancer was approximately 20%, while patients with stage I ovarian cancer could reach 89% (3). Therefore, improving the accuracy of preoperative diagnosis is of great importance.
Ultrasound is widely used to diagnose and identify ovarian cancer in clinical practice. However, the diagnostic accuracy dramatically depends on the experience of sonographers (4, 5). Ovarian cancer is easily missed or misdiagnosed for its insidious onset and varied image features, especially for inexperienced sonographers. A randomized controlled trial demonstrated that level III (experienced) sonographers are significantly more accurate in diagnosing ovarian cancer than level II (inexperienced) sonographers (6).
To reduce the subjective differences and improve the diagnostic accuracy, International Ovarian Tumor Analysis (IOTA) defines the terms, definitions and measurements used to describe the ultrasonic appearance of ovarian tumors (7). Based on it, IOTA has proposed two logistic regression models (LR1, LR2) and Simple Rules (5, 8). In 2014, a new multiple risk prediction model, Assessment of Different NEoplasias in the adneXa (ADNEX) model, was proposed (9). It consists of six ultrasonic indexes and three clinical indexes. The ultrasonic indexes include the maximum diameter of the lesion, proportion of solid tissue, number of cyst locules (whether more than 10), number of papillary projections (1, 2, 3 or more), presence of acoustic shadows and ascites. Three clinical indexes include age, serum carbohydrate antigen 125 (CA-125) level and category types of centers (oncology center or others). The most significant advantage is that the ADNEX model is the first multi-classification model for ovarian tumors. Based on identifying ovarian cancer from benign tumors, it divides ovarian cancer into four subtypes (borderline, stage I, stages II–IV and metastasis). The overall risk for ovarian cancer and the risk for each subtype can be evaluated simultaneously.
There are limited studies on the diagnosis of the ADNEX model for ovarian cancer because it was published recently. Besides, the cut-off value of the overall risk for ovarian cancer is flexible. In the guideline, the cut-off selected should depend on the centers’ type and the patients’ clinical characteristics. Still, it did not give a recommended cut-off (10). In present studies, 10 and 15% are the most common selected cut-offs to identify the overall risk for ovarian cancer. In the original study, the diagnostic odds at the 10% cut-off and 15% cut-off were 69.2 and 54.7, respectively (9). While in a recent survey, the diagnostic performance of the ADNEX model at the 15% cut-off is better than the 10% cut-off (11). So we have to consider the selection of cut-off value in clinical practice. In a previous meta-analysis, the pooled sensitivity and specificity of the ADNEX model at the 10% cut-off were 0.96 and 0.69 (12). Meanwhile, we noticed that it only included three original studies, and the detailed information of heterogeneity, sensitivity analysis, publication bias was not presented.
To my best knowledge, there is no summary estimate of the 15% cut-off. Therefore, this meta-analysis aimed to discuss the diagnostic accuracy of the ADNEX model at the 15% cut-off of ovarian cancer.
Materials and Methods
Search Strategy
We conducted this meta-analysis in compliance with the Preferred Reporting Items for Systematic Reviews and Meta-analyses.
We searched for studies in PubMed, Web of Science, Embase and the Cochrane Library databases published from January 1st, 2014 to February 20th, 2021. A combination of Medical Subject Headings (MeSH) and free text were used to identify related articles. Search terms included “Ovarian Neoplasm”, “Neoplasm, Ovarian”, “Ovarian Neoplasm”, “Ovary Neoplasms”, “Neoplasm, Ovary”, “Neoplasms, Ovary”, “Ovary Neoplasm”, “Neoplasms, Ovarian”, “Ovary Cancer”, “Cancer, Ovary”, “Cancers, Ovary”, “Ovary Cancers”, “Ovarian Cancer”, “Cancer, Ovarian”, “Cancers, Ovarian”, “Ovarian Cancers”, “Cancer of Ovary”, “Cancer of the Ovary”, “Adnexal model”, “ADNEX model” and “Assessment of Different NEoplasias in the adneXa model”. The search was designed to identify all studies on the diagnosis of ovarian cancer with the ADNEX model. Reference lists of the retrieved studies were also screened manually.
Inclusion and Exclusion Criteria
The inclusion criteria in this meta-analysis were as follows: (1) the subjects were women with ovarian tumors; (2) the diagnostic method was the ADNEX model for ovarian cancer; (3) the reference standard was pathological examination after surgery; (4) retrospective or prospective diagnostic studies; (5) outcome indicators were sensitivity and specificity; and (6) true positive (TP), false positive (FP), true negative (TN), false negative (TN) could be extracted directly or indirectly from the study.
Studies were excluded from these criteria: (1) guidelines, case reports, systematic reviews, and conference studies; (2) lack of original data; (3) duplicate data; (4) unclear cut-off or other cut-off; and (5) inconsistent outcome indicators.
Data Extraction
The following information was extracted from the eligible studies and drawn into tables: name of the first author, country (Europe vs. others), publication year, study design (prospective vs. retrospective), enrollment type (consecutive vs. unreported), blind method (blind from the reference standard vs. unreported), patients’ number, malignant tumors’ number, benign tumors’ number, TP, FP, FN, TN, sensitivity and specificity.
Quality Assessment
Two investigators (XH and ZW) assessed the quality of the eligible studies by Quality Assessment of Diagnostic Accuracy Studies (QUADAS-2) independently. Every signature question in QUADAS-2 was rated as “yes”, “no” or “unclear”. QUADAS-2 consisted of four assessment sections. Only in one section did all the signature questions answer “yes”, and the corresponding risk of bias was rated as “low”; once any answer was “no”, the risk of bias was rated as “high”; in other cases, the risk of bias was rated as “unclear”. If the evaluations of the two investigators were inconsistent, it would be negotiated by discussion. The final result was presented by Review Manager 5.3 (13).
Statistical Analysis
Meta-Disc 1.4 and STAT 16.0 were used for statistical analysis (14, 15). Heterogeneity caused by the threshold effect and non-threshold effect was estimated respectively. The threshold effect was identified by the Spearman correlation coefficient between the logit of specificity and logit of 1-specificity. The P-value of the Spearman correlation coefficient >0.05 suggested no threshold effect. The non-threshold effect was evaluated by the inconsistency index (I-squared, I2). I2 ≦50% indicated no obvious non-threshold effect among the eligible studies. The result of heterogeneity analysis decided the model and effect size selected for data synthesis. The Moses–Shapiro–Littenber model was selected when P-value of the Spearman correlation coefficient <0.05. If so, the simple effect sizes like sensitivity, specificity, positive likelihood ratio (PLR), negative likelihood ratio (NLR) and diagnostic odds ratio (DOR) could not be pooled. Under the premise that P-value of the Spearman correlation coefficient >0.05, the simple effect sizes can be pooled. The fixed-effects model was selected when I2 ≦50%, and the random-effects model was selected when I2 >50%. Meta-regression analysis was performed to investigate the potential sources of heterogeneity, and the relative diagnostic odds ratio (RDOR) was the evaluation index. RDOR >1 indicated that the studies with this feature had higher diagnostic accuracy than those without, but it was statistically significant only when the corresponding P-value <0.05. Sensitivity analysis was conducted to evaluate the stability of the eligible studies, and Deek’s funnel plot analysis was used to evaluate the publication bias in this meta-analysis.
Results
Search Results and Study Characteristics
280 studies were initially retrieved through the search strategy. According to the inclusion and exclusion criteria, a total of 10 studies were ultimately included. There were 5,170 ovarian tumors included, 1,629 were ovarian cancer, and 3,541 were benign tumors. The specific selection process was presented in Figure 1. The basic features and parameter data extracted from the 10 eligible studies were shown in Tables 1, 2. The quality assessment by QUADAS-2 was shown in Figure 2.
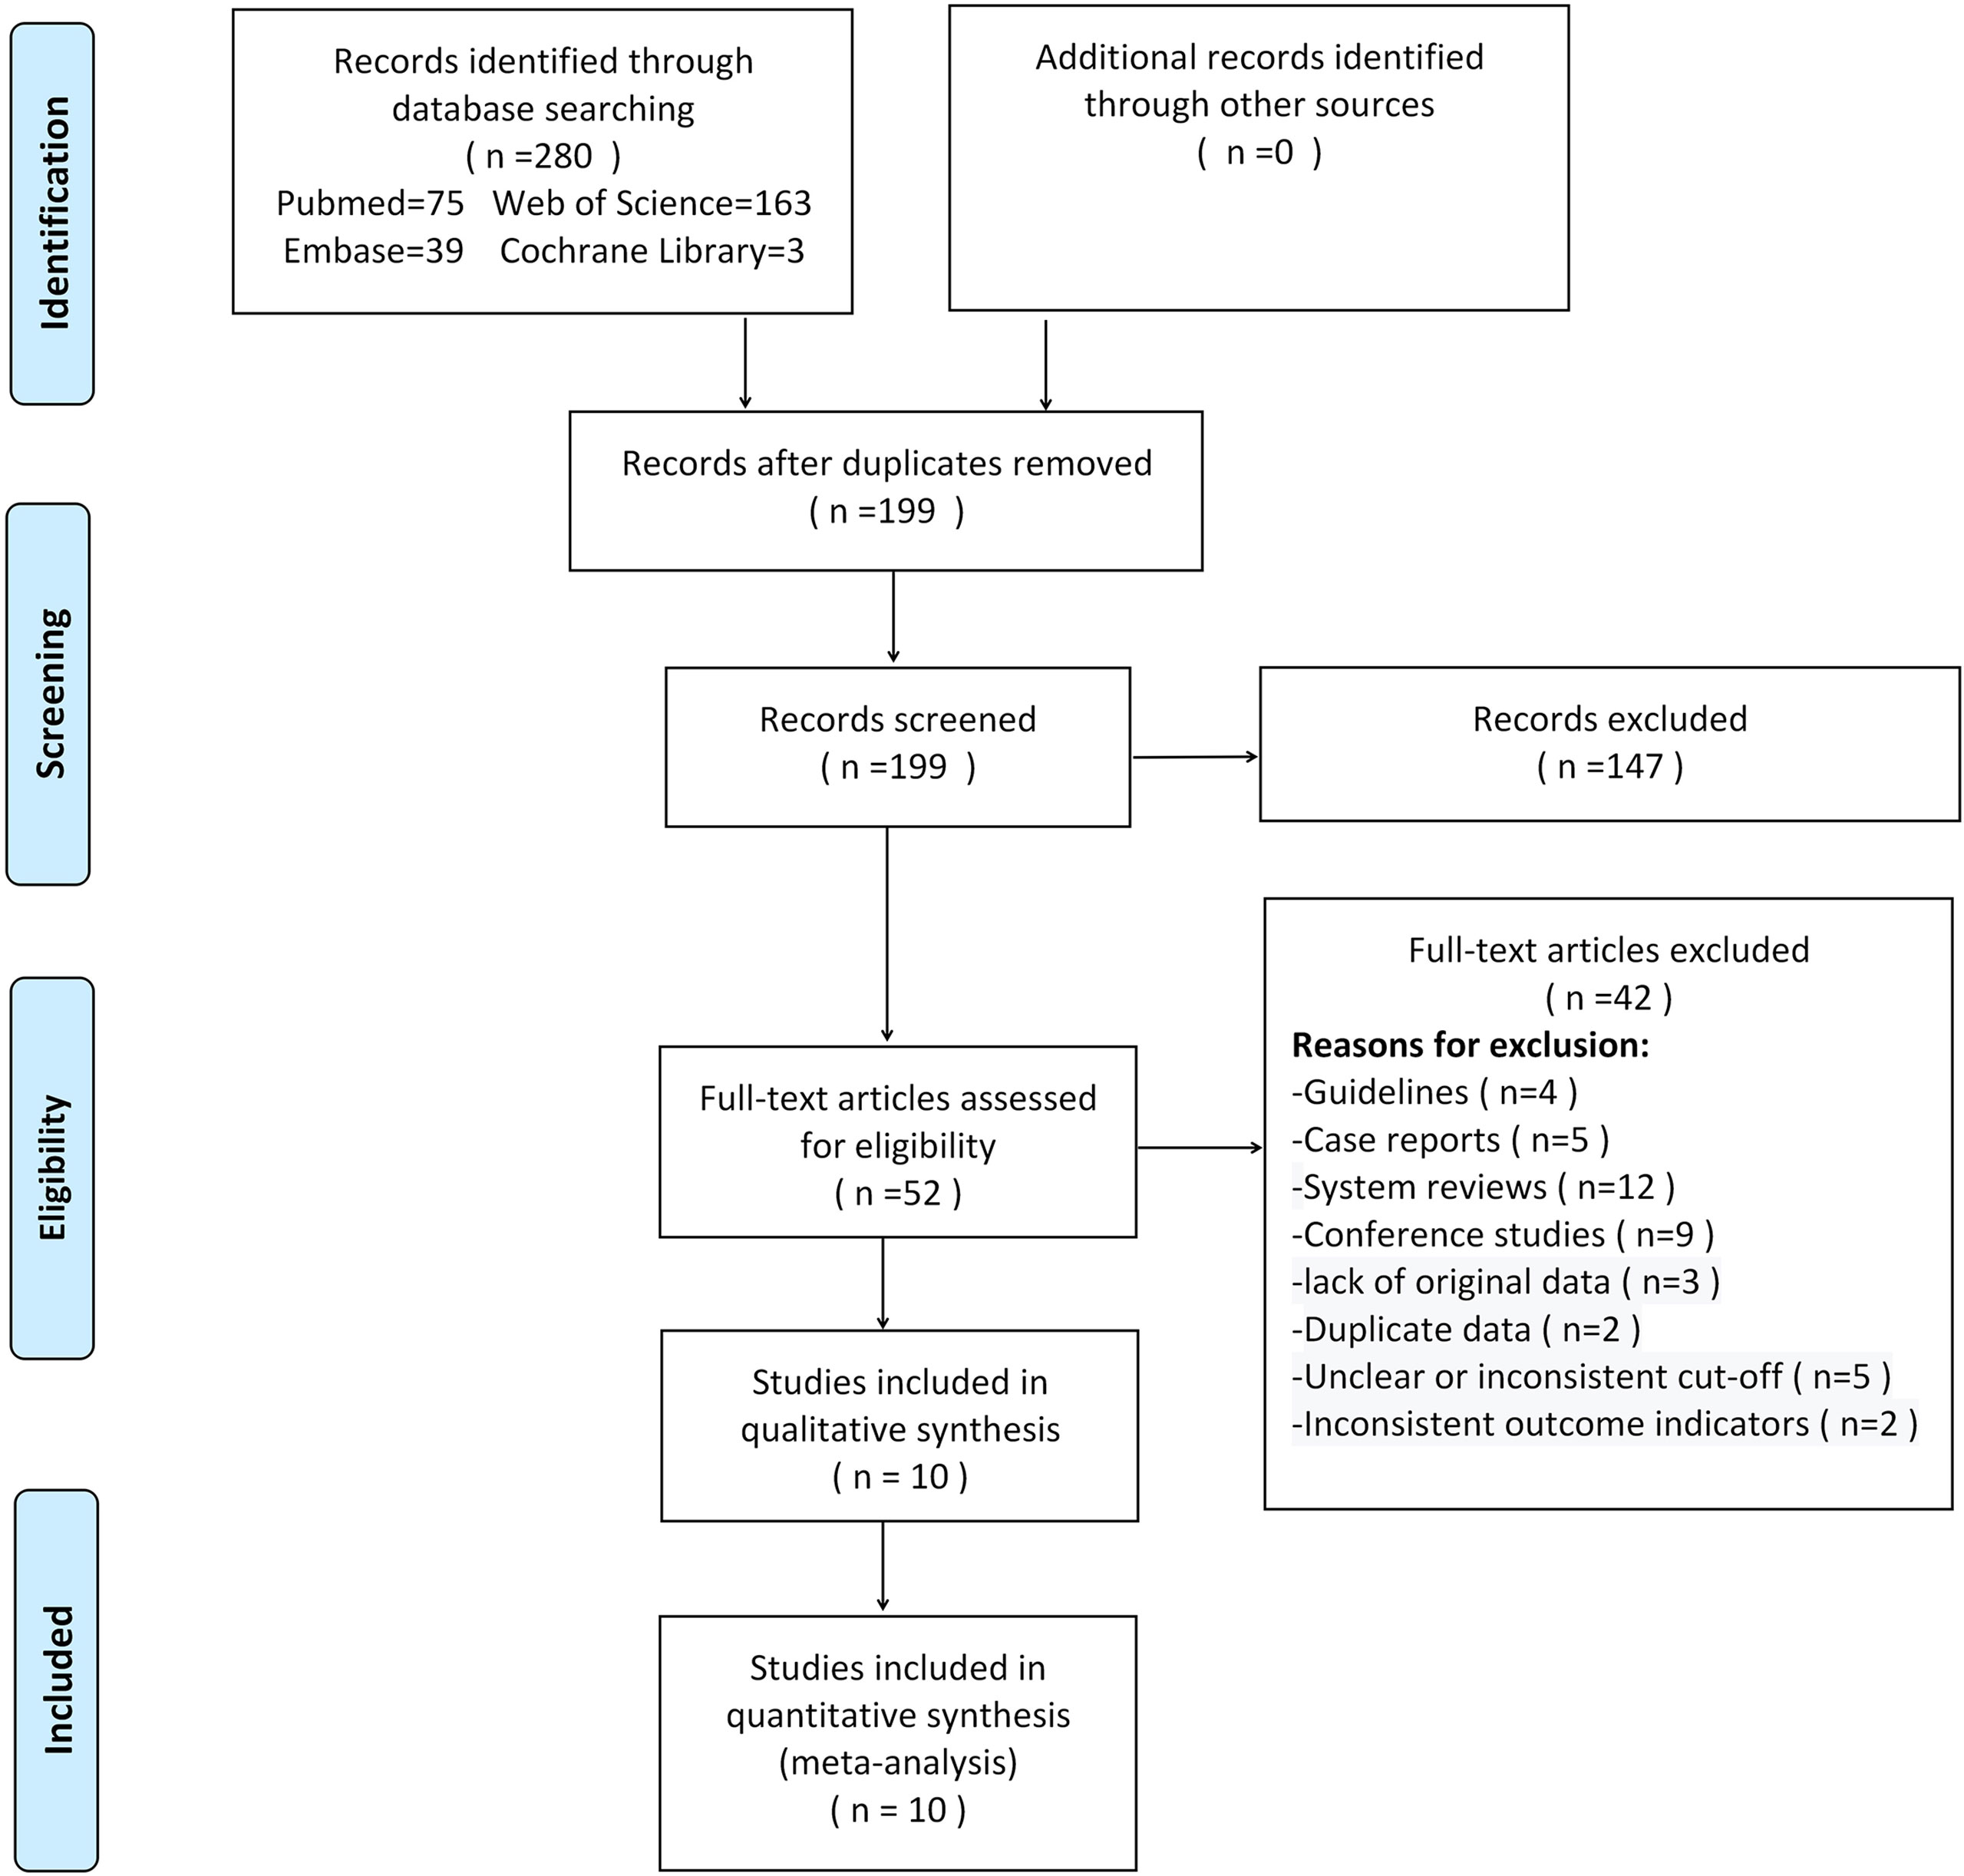
Figure 1 Flow chart of selection process.
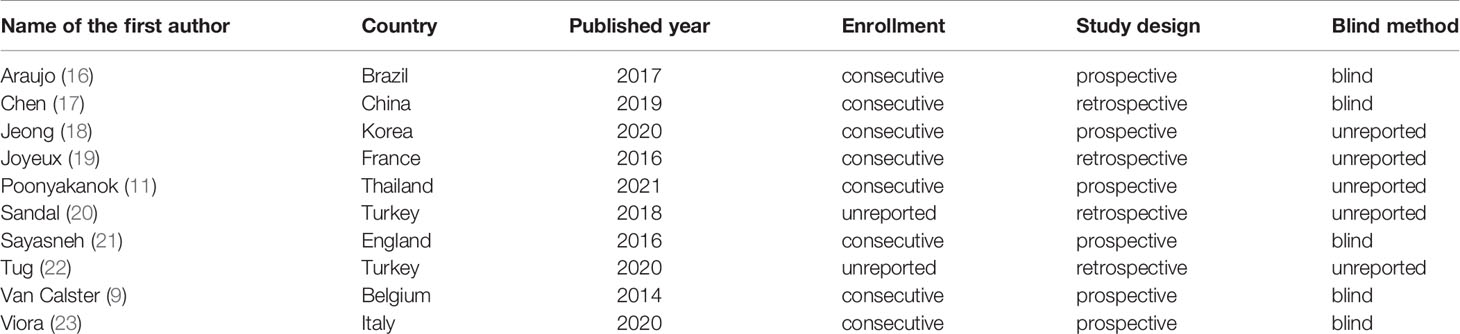
Table 1 Basic features of the eligible studies.
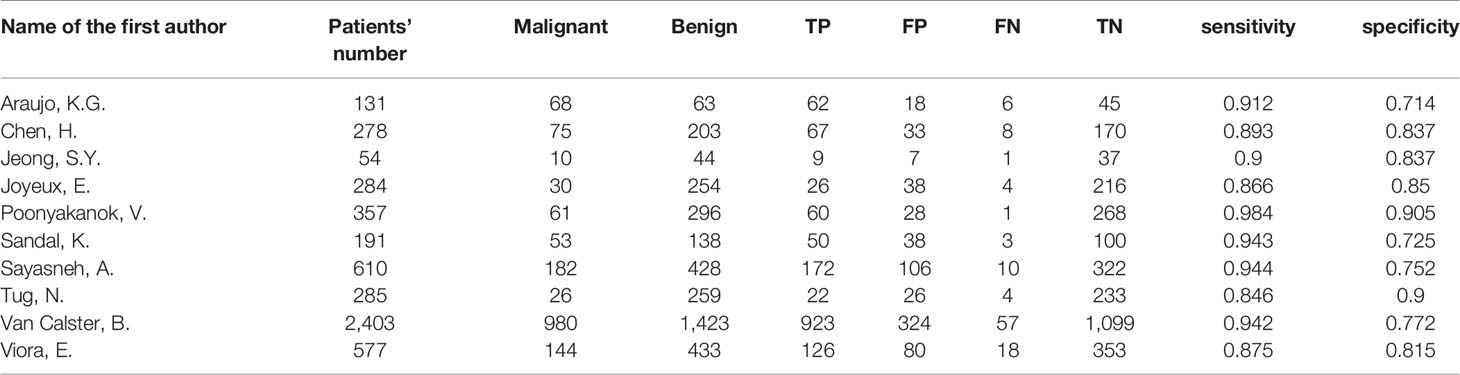
Table 2 Parameter data extracted from eligible studies.
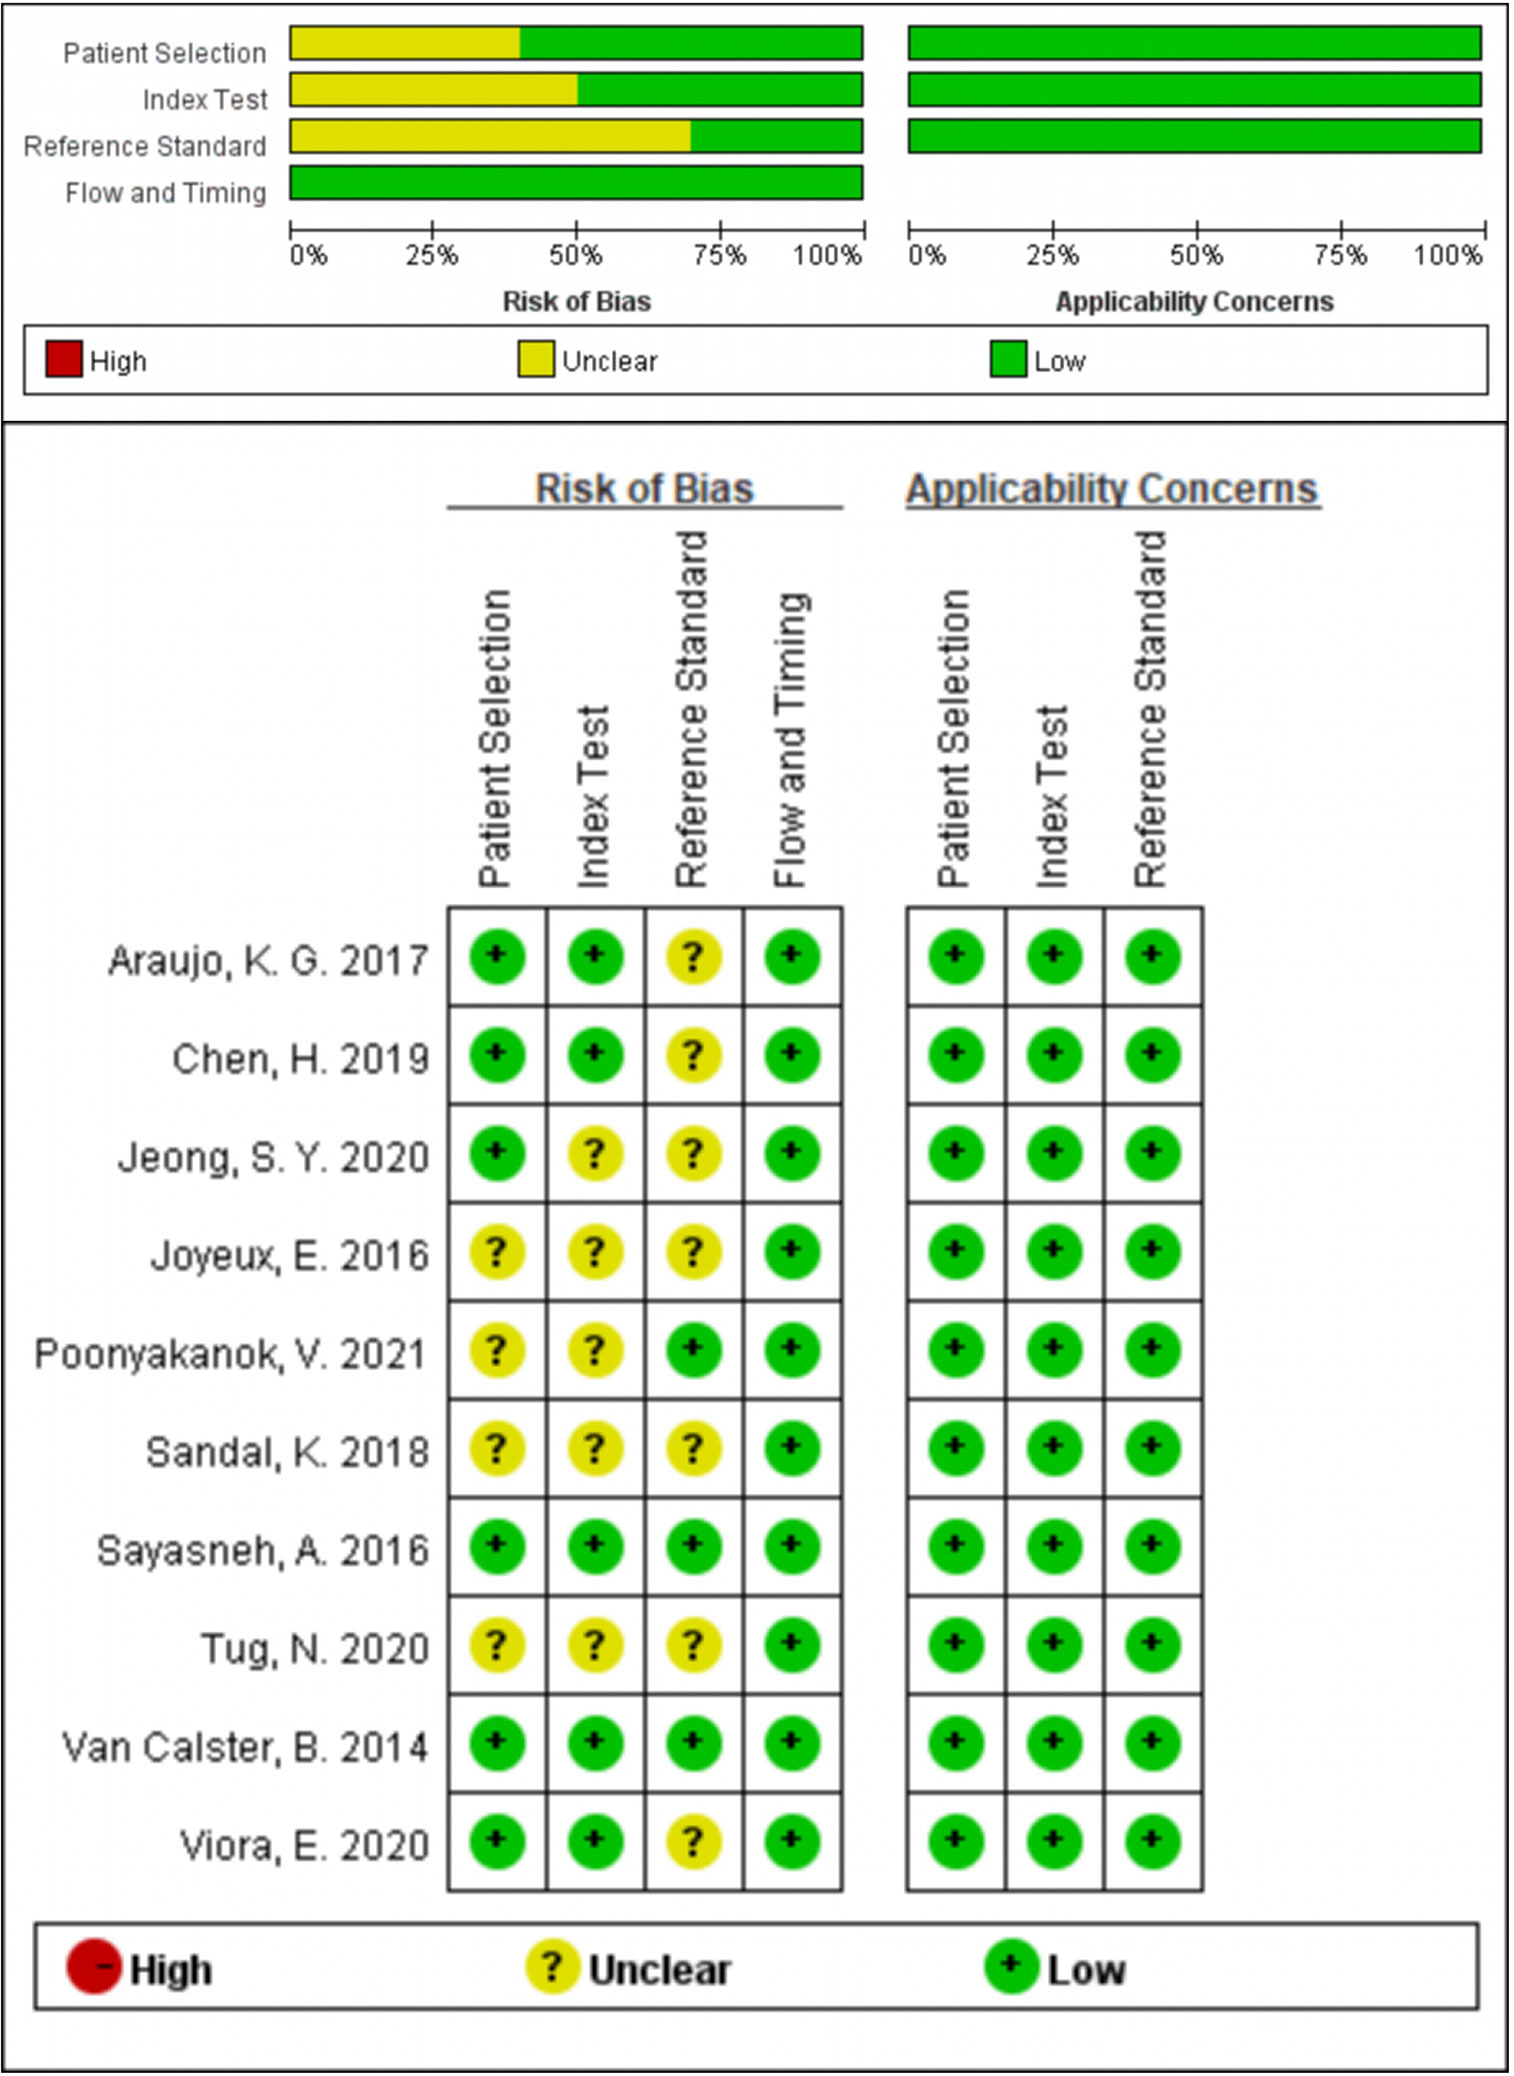
Figure 2 Quality assessment by QUADAS-2.
Meta-Analysis
Heterogeneity Analysis
The P-value of the Spearman correlation coefficient was 0.365 (>0.05), which indicated no threshold effect in this analysis. I2 = 65.12% (>50%) meant the existence of non-threshold effect heterogeneity (Figure 3).

Figure 3 Forest plots for the diagnostic accuracy.
Data Synthesis
According to the result of heterogeneity analysis, there was no threshold effect but non-threshold effect in this meta-analysis. The random-effects model was selected to pool the effect sizes. The pooled sensitivity, specificity, PLR, NLR, DOR and the area under the curve (AUC) were 0.92 (95% CI: 0.89–0.94), 0.82 (95% CI: 0.78–0.86), 5.20 (95% CI: 4.10–6.40), 0.10 (95% CI: 0.07–0.13), 54.0 (95% CI: 37.0–77.0), 0.95 (95% CI: 0.91–0.95).
Meta-Regression
According to the features of the 10 eligible studies, meta-regression was performed based on the following factors: study design, country, enrollment, blind method. As shown in Table 3, the RDOR of country and blind method was less than 1.0, which meant the diagnostic accuracy was not influenced by country or blind method. The RDOR of study design and enrollment was greater than 1.0, but the P-value was greater than 0.05. It meant the diagnostic accuracy of prospective studies was higher than retrospective studies, and the diagnostic accuracy of studies with consecutive enrollment was higher than non-consecutive enrollment. However, neither was statistically significant. Therefore, none of the evaluated factors could explain the heterogeneity in this meta-analysis.
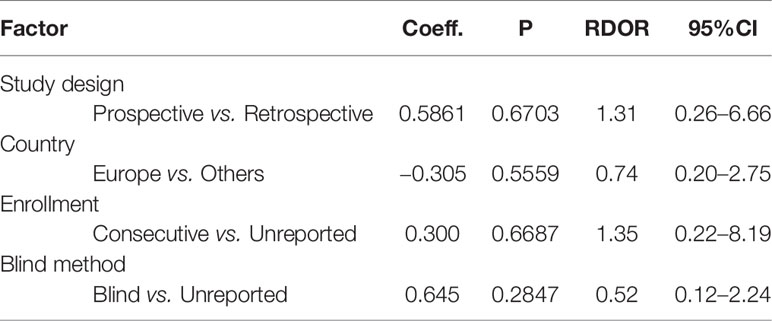
Table 3 Meta-regression analysis.
Sensitivity Analysis
As shown in Figure 4, sensitivity analysis was conducted after the study was excluded one by one, and the overall sensitivity and specificity were not significantly changed. It suggested that the combined effect sizes in this meta-analysis were relatively stable without over-dependence on any single study.
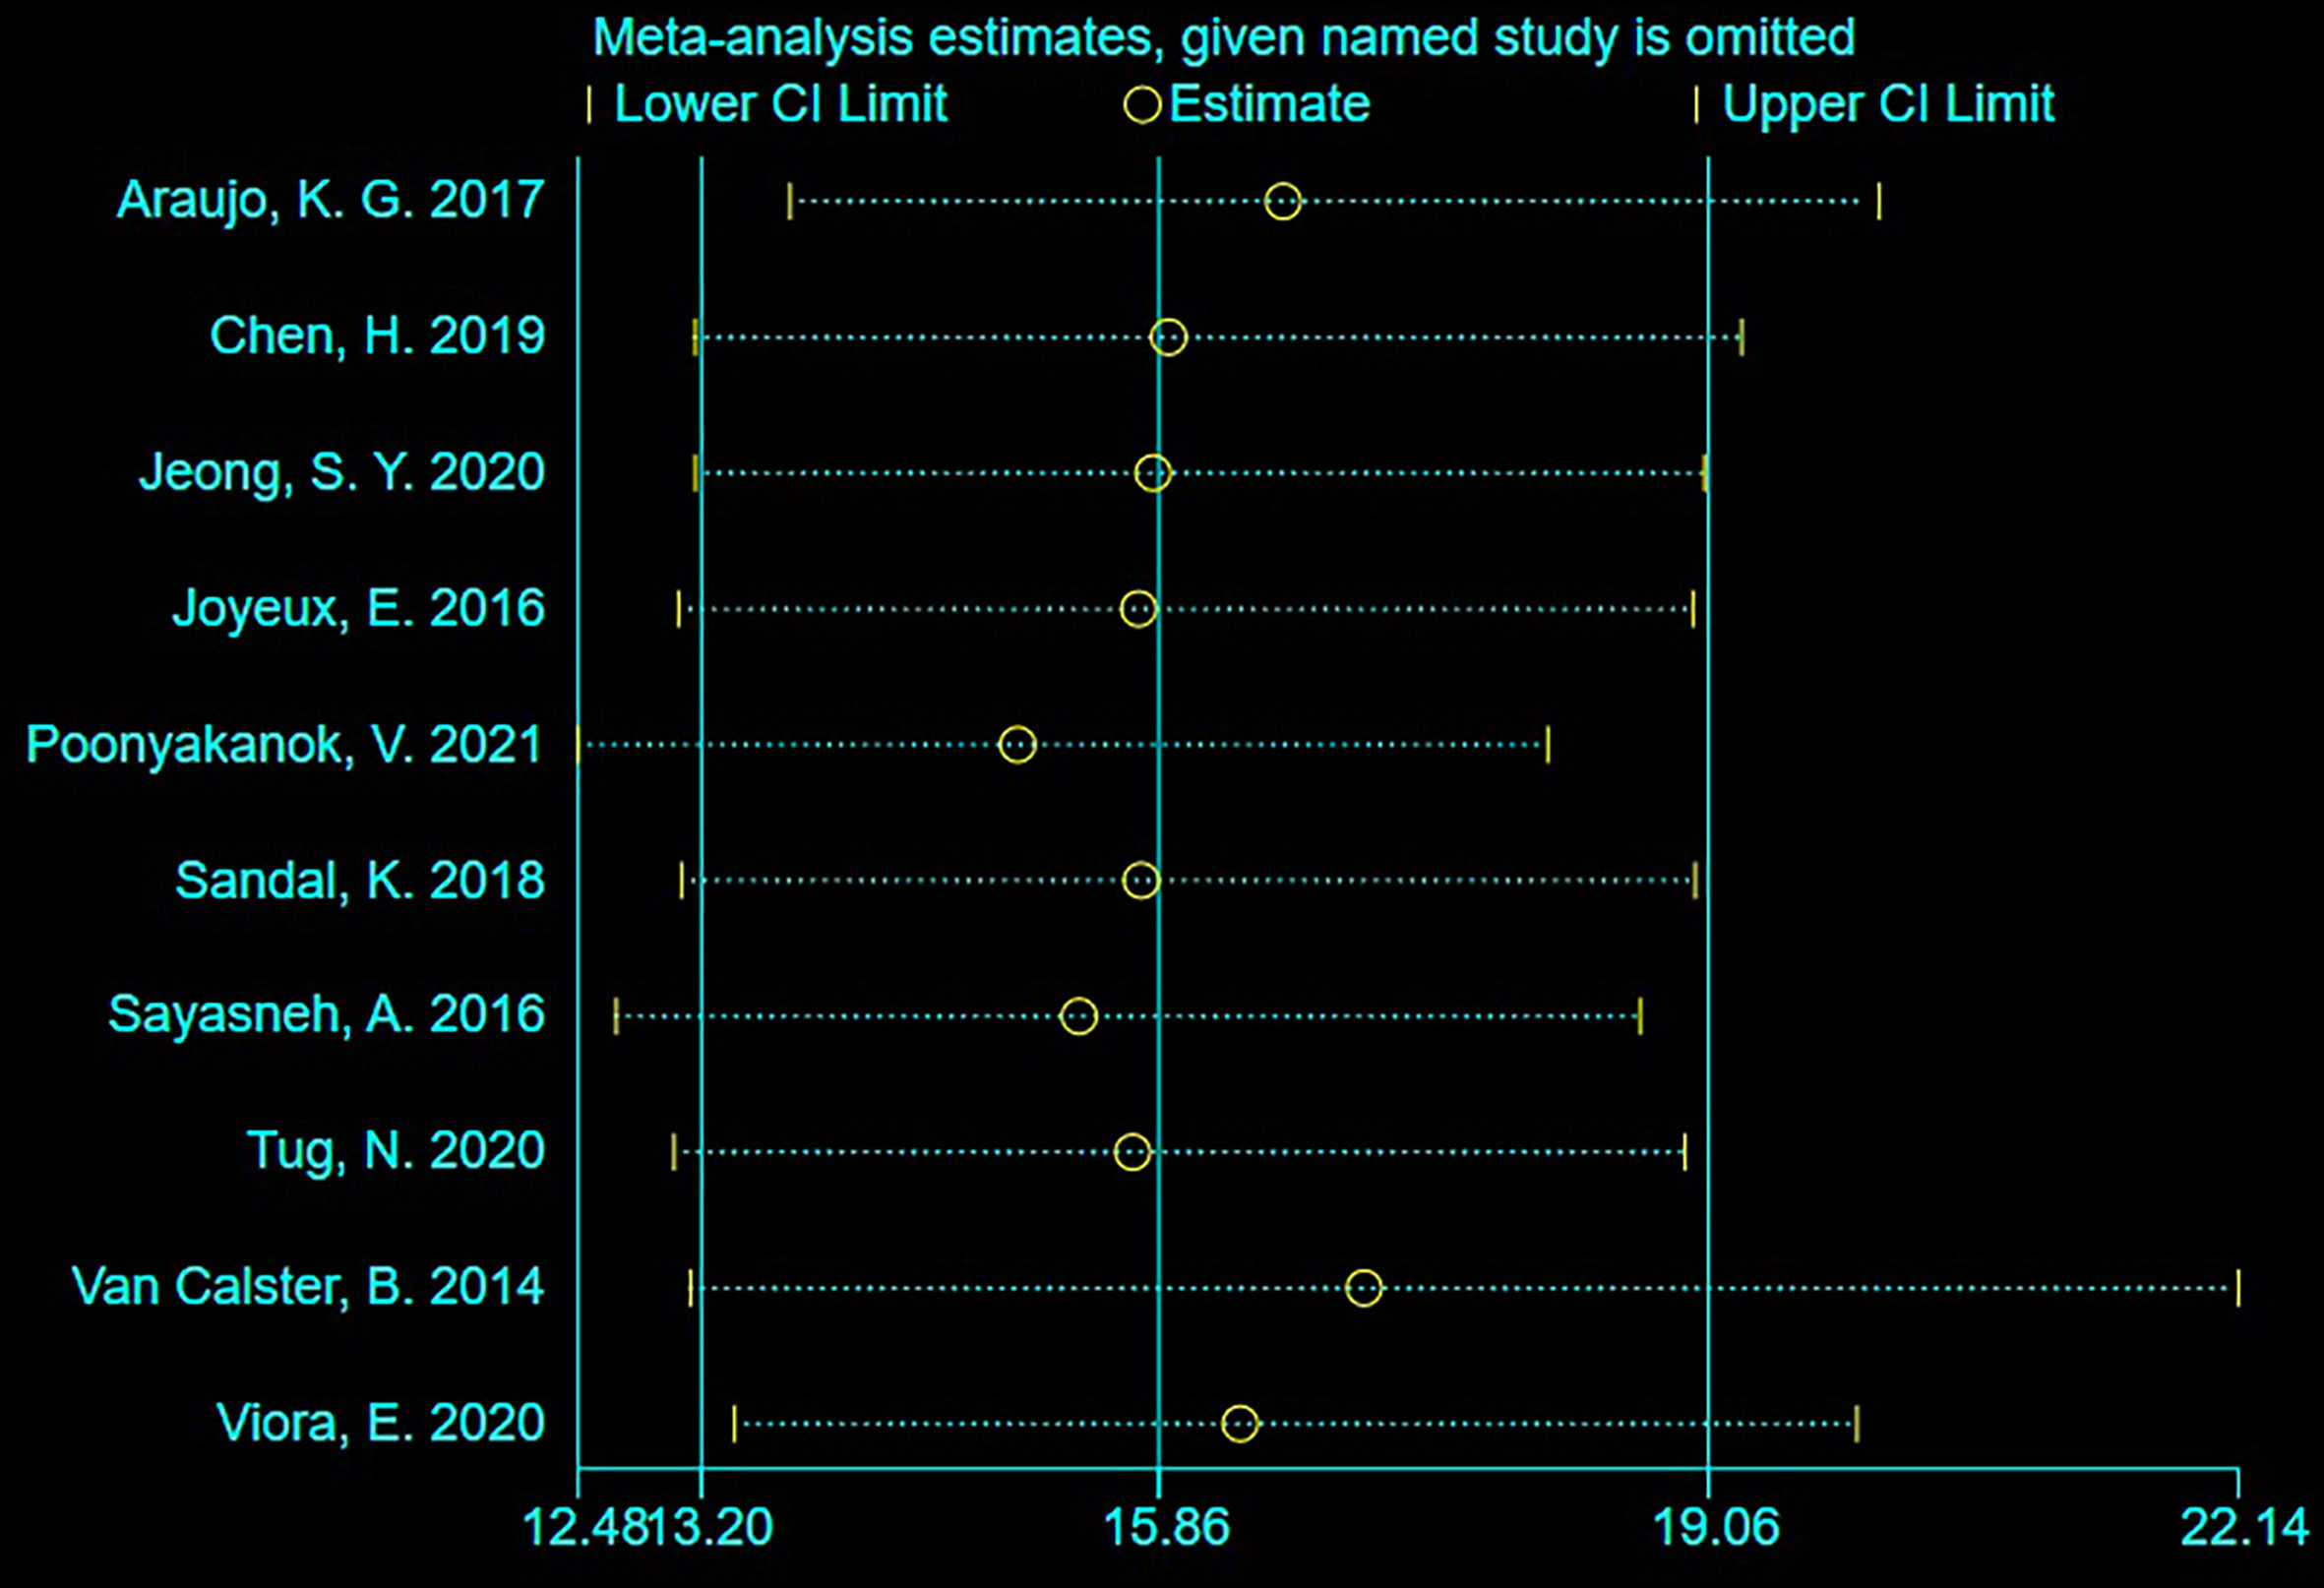
Figure 4 Sensitivity analysis.
Deek’s Funnel Plot Analysis
Deek’s funnel plot analysis showed that scattered points were evenly distributed on both sides of the regression line, and P-value was 0.96 (>0.05). There was no significant publication bias among the eligible studies (Figure 5).
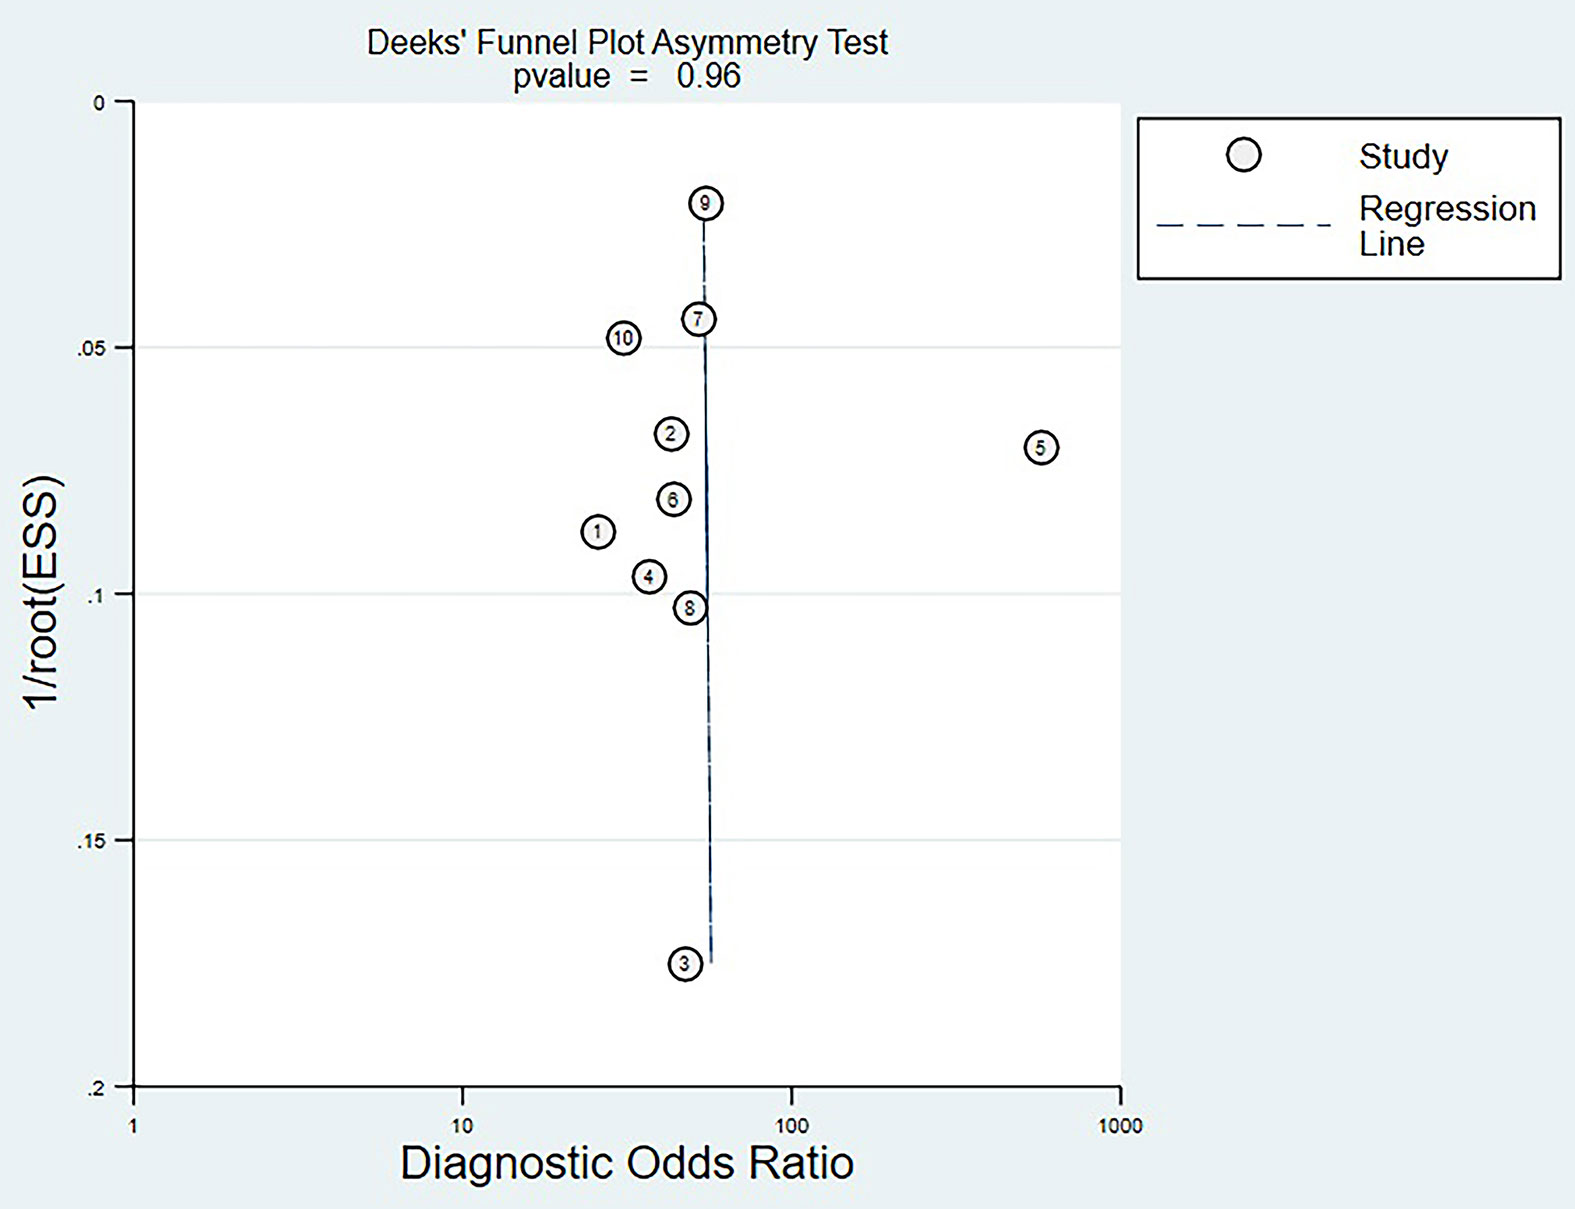
Figure 5 Deek's funnel plot analysis.
Discussion
Main Findings
In this meta-analysis, a total of 10 studies on the preoperative diagnosis of the ADNEX model at the 15% cut-off for ovarian cancer were eligible. The pooled sensitivity, specificity, PLR, NLR, DOR and AUC were 0.92 (95% CI: 0.89–0.94), 0.82 (95% CI: 0.78–0.86), 5.2 (95% CI: 4.1–6.4), 0.10 (95% CI: 0.07–0.13), 54.0 (95% CI: 37.0–77.0), 0.95 (95% CI: 0.91–0.95), respectively. It meant that the ADNEX model at the 15% cut-off had high specificity while ensuring sensitivity. Higher sensitivity meant identifying more suspicious patients and referring them for further examinations. It helped minimize the risk of delaying treatment for suspicious patients. Higher specificity meant reducing the false positive rate. It was of great significance for optimizing the allocation of medical resources and reducing the unnecessary costs of patients.
There was no threshold effect in this meta-analysis, but the non-threshold effect heterogeneity could not be ignored. Meta-regression was conducted to investigate the potential sources of heterogeneity. In general, studies with the prospective design, consecutive enrollment and blind method could substantially reduce the subjective influence from the researchers. From the previous report, the incidence of ovarian cancer varies in different regions, and it is significantly higher in European countries than in others (3). Therefore, study design, country, enrollment and blind method were selected as the potential factories causing the non-threshold effect heterogeneity in this meta-analysis. However, none of the evaluated factors were the sources of heterogeneity. And the result of sensitivity analysis and publication bias risk test showed that this meta-analysis was stable and reliable.
Comparison With Other Models
There are many prediction models for the diagnosis of ovarian cancer. At present, Risk of Malignancy Index (RMI) is the most widely used model and recommended by most oncology centers. Studies showed that RMI I has the highest diagnostic accuracy among RMI I–IV (24, 25). While in a recent meta-analysis, the DOR of RMI I was 33.0, which was not satisfactory (26). In our meta-analysis, the DOR of the ADNEX model at the 15% cut-off was 54.0. So we thought the ADNEX model at the 15% cut-off was better than RMI. Another multi-center study also verified that the Net Benefit of the ADNEX model is higher than Risk of Ovarian Malignancy Algorithm (ROMA), RMI and LR2 (27). Meys et al. (28) validated the diagnostic accuracy of subjective assessment and four frequently used models (Simple Rules, LR2, RMI and the ADNEX model), and the results showed that the ADNEX model performs better than the other three models, but the subjective assessment of expert sonographers still performs the best. However, Viora et al. (23) and Epstein et al. (29) found the opposite. They pointed out that the diagnostic accuracy of the ADNEX model was equal to, or even more accurate than the subjective assessment of expert sonographers. The ADNEX model aims at helping inexperienced sonographers and gynecologists classify patients for appropriate treatment, not as a substitute for expert evaluation (30). Meanwhile, we must be aware that expert sonographers are not always available. Furthermore, compared with the ADNEX model at the 10% cut-off, the sensitivity of this model at the 15% cut-off decreased slightly (10%: 0.96, 15%: 0.92) but specificity (10%: 0.69, 15%: 0.82) increased significantly (12).
Therefore, the ADNEX model deserved to be promoted in clinical practice.
Further Optimization
The model proposed by Stukan (31) inspired us to think about the further optimization of the ADNEX model. This concise model only includes three indexes: solid areas, color score and the level of D-dimer. However, the diagnostic accuracy is comparable to the ADNEX model. Thus, we had reasons to believe that the ADNEX model could be further optimized.
Firstly, we should consider the selection of tumor markers in the ADNEX model. Studies demonstrated that the absence of CA-125 has no significant effect on the diagnostic performance of the ADNEX model (11, 17, 21). CA-125 is not specific to ovarian cancer, and it can increase in benign lesions, such as endometriosis and uterine fibroids (32–34). Human epididymal protein-4 (HE-4) has become a novel tumor marker for ovarian cancer (35). Simona et al. (36) compared the diagnostic accuracy of HE-4 and CA-125 for ovarian cancer, and the result showed the PLR and NLR for HE-4 were 13.0 and 0.23, but 4.2 and 0.27 for CA-125. Some other studies also verified that HE-4 is more valuable than CA-125 for ovarian cancer (37–39). However, the study of McKendry et al. (40) indicated that CA-125 performs the best in premenopausal women. So the selection of tumor markers needs to be validated by more studies.
Secondly, more researchers have noticed that a high D-dimer level is an important diagnostic marker for ovarian cancer patients. The level of D-Dimer has traditionally been used to assess the risk of thrombosis in patients with ovarian cancer (41, 42). While studies demonstrated that the D-dimer level in a patient with ovarian cancer is significantly higher than that with benign tumors, and the D-dimer level in a patient with stage III–IV ovarian cancer is higher than that with stage I–II ovarian cancer (43–45). Another study showed that the D-dimer level increased in 73% stage I ovarian cancer patients, whereas CA-125 increased in only 33%, so D-dimer is more sensitive in stage I ovarian cancer patients (46). Moreover, a previous study showed that D-dimer is a useful marker in differentiating ovarian cancer and endometriosis, with a sensitivity of 93.2% and a specificity of 87.5% (47). Therefore, the inclusion of D-Dimer was expected to improve the accuracy in identifying the subtypes of ovarian cancer.
Thirdly, Color Doppler is used widely in clinical practice, but the ADNEX model only includes two-dimensional morphological ultrasonic indexes. The blood flow signals within the ovarian tumor are also important to identify the nature of ovarian tumors (38). As we know, the blood flow signals of ovarian cancer are abundant and disorderly, and the resistance index (RI) is usually less than 0.5. Researchers found that the sensitivity and specificity of Color Doppler for ovarian cancer were 71.88 and 84.29 (48). Although different ultrasonic instruments may have certain differences in the sensitivity to blood flow signals, most instruments are highly sensitive and can meet the diagnostic requirement. Besides, another research indicated the diagnosis of ovarian cancer by Color Doppler is in good consistency within and between observers (49).
Strengths and Limitations
The strengths of this meta-analysis were summarized as follows. Firstly, this was the first summary estimate of the diagnostic accuracy of the ADNEX model at the 15% cut-off value. Secondly, the included studies were of high quality. Among the 10 eligible studies, six were prospective studies, eight were consecutive enrollment studies, and five were blind from reference standard. Thirdly, this meta-analysis was stable without significant publication bias.
This analysis had some limitations. Firstly, there were only 10 eligible studies included in this meta-analysis. More studies are needed to verify the diagnostic performance of it. Secondly, the limitation of territory should be taken into account. Five studies were carried out in Europe and four in Asian countries, but only one study in South America. In fact, the ADNXE model is not implemented widely in America (30). So it was hard to evaluate the diagnostic performance globally. Thirdly, the most significant advantage of the ADNEX model is the division of four subtypes of ovarian cancer. While in this meta-analysis, complete diagnostic data in 2 × 2 tables of the four subtypes could not be extracted in eight studies. So we only discussed the diagnostic accuracy in the identification of ovarian cancer from benign tumors. The remaining two studies indicated that the ADNEX model is less effective in differentiating stage I ovarian cancer from borderline tumors and stage II–IV ovarian cancer from metastasis (17, 23, 28). Still, future studies are needed to assess the diagnostic accuracy in different subtypes.
Conclusion
In summary, the ADNEX model at the 15% cut-off was in high diagnostic accuracy for identifying the risk of ovarian cancer, which should be accepted and promoted more widely. At the same time, more studies on the diagnostic accuracy for different subtypes and the optimization of this model deserve exploring and expecting.
Data Availability Statement
The original contributions presented in the study are included in the article/supplementary material. Further inquiries can be directed to the corresponding author.
Author Contributions
XH, HL, ZW, and MZ: study design and manuscript review. XH and ZW: literature screen, data extraction, quality assessment. HL and MZ: inconsistency negotiation and quality control. XH and MZ: statistical analysis and manuscript composing. All authors contributed to the article and approved the submitted version.
Conflict of Interest
The authors declare that the research was conducted in the absence of any commercial or financial relationships that could be construed as a potential conflict of interest.
References
1. Bray F, Ferlay J, Soerjomataram I, Siegel RL, Torre LA, Jemal A. Global Cancer Statistics 2018: GLOBOCAN Estimates of Incidence and Mortality Worldwide for 36 Cancers in 185 Countries. CA Cancer J Clin (2018) 68(6):394–424. doi: 10.3322/caac.21492
2. Sung H, Ferlay J, Siegel RL, Laversanne M, Soerjomataram I, Jemal A, et al. Global Cancer Statistics 2020: GLOBOCAN Estimates of Incidence and Mortality Worldwide for 36 Cancers in 185 Countries. CA Cancer J Clin (2021) 71(3):209–49. doi: 10.3322/caac.21660
3. Torre LA, Trabert B, DeSantis CE, Miller KD, Samimi G, Runowicz CD, et al. Ovarian Cancer Statistics, 2018. CA Cancer J Clin (2018) 68(4):284–96. doi: 10.3322/caac.21456
4. Timmerman D, Schwärzler P, Collins WP, Claerhout F, Coenen M, Amant F, et al. Subjective Assessment of Adnexal Masses With the Use of Ultrasonography: An Analysis of Interobserver Variability and Experience. Ultrasound Obstet Gynecol (1999) 13(1):11–6. doi: 10.1046/j.1469-0705.1999.13010011.x
5. Timmerman D, Testa AC, Bourne T, Ameye L, Jurkovic D, Van Holsbeke C, et al. Simple Ultrasound-Based Rules for the Diagnosis of Ovarian Cancer. Ultrasound Obstet Gynecol (2008) 31(6):681–90. doi: 10.1002/uog.5365
6. Yazbek J, Raju SK, Ben-Nagi J, Holland TK, Hillaby K, Jurkovic D. Effect of Quality of Gynaecological Ultrasonography on Management of Patients With Suspected Ovarian Cancer: A Randomised Controlled Trial. Lancet Oncol (2008) 9(2):124–31. doi: 10.1016/S1470-2045(08)70005-6
7. Timmerman D, Valentin L, Bourne TH, Collins WP, Verrelst H, Vergote I. Terms, Definitions and Measurements to Describe the Sonographic Features of Adnexal Tumors: A Consensus Opinion From the International Ovarian Tumor Analysis (Iota) Group. Ultrasound Obstet Gynecol (2000) 16(5):500–5. doi: 10.1046/j.1469-0705.2000.00287.x
8. Timmerman D, Testa AC, Bourne T, Ferrazzi E, Ameye L, Konstantinovic ML, et al. Logistic Regression Model to Distinguish Between the Benign and Malignant Adnexal Mass Before Surgery: A Multicenter Study by the International Ovarian Tumor Analysis Group. J Clin Oncol (2005) 23(34):8794–801. doi: 10.1200/JCO.2005.01.7632
9. Van Calster B, Van Hoorde K, Valentin L, Testa AC, Fischerova D, Van Holsbeke C, et al. Evaluating the Risk of Ovarian Cancer Before Surgery Using the ADNEX Model to Differentiate Between Benign,Borderline, Early and Advanced Stage Invasive, and Secondary Metastatic Tumours: Prospectivemulticentre Diagnostic Study. BMJ (2014) 349:g5920. doi: 10.1136/bmj.g5920
10. Van Calster B, Van Hoorde K, Froyman W, Kaijser J, Wynants L, Landolfo C, et al. Practical Guidance for Applying the ADNEX Model From the IOTA Group to Discriminate Between Different Subtypes of Adnexa Tumors. Facts Views Vis Obgyn (2015) 7(1):32–41.
11. Poonyakanok V, Tanmahasamut P, Jaishuen A, Wongwananuruk T, Asumpinwong C, Panichyawat N, et al. PreoperativeEvaluation of the ADNEX Model for the Prediction of the Ovarian Cancer Risk of Adnexal Masses at Siriraj Hospital. Gynecol Obstet Invest (2021) 86(1–2):132–8. doi: 10.1159/000513517
12. Westwood M, Ramaekers B, Lang S, Grimm S, Deshpande S, de Kock S, et al. Risk Scores to Guide Referral Decisions Forpeople With Suspected Ovarian Cancer in Secondary Care: A Systematic Review and Cost-Effectiveness Analysis. Health Technol Assess (2018) 22(44):1–264. doi: 10.3310/hta22440
13. Whiting PF, Rutjes AW, Westwood ME, Mallett S, Deeks JJ, Reitsma JB, et al. Quadas-2: A Revised Tool for the Quality Assessment of Diagnostic Accuracy Studies. Ann Intern Med (2011) 155(8):529–36. doi: 10.7326/0003-4819-155-8-201110180-00009
14. Zamora J, Abraira V, Muriel A, Khan K, Coomarasamy A. Meta-Disc: A Software for Meta-Analysis of Test Accuracy Data. BMC Med Res Methodol (2006) 6:31. doi: 10.1186/1471-2288-6-31
15. Chaimani A, Mavridis D, Salanti G. A Hands-On Practical Tutorial on Performing Meta-Analysis With Stata. Evid Based Ment Health (2014) 17(4):111–6. doi: 10.1136/eb-2014-101967
16. Araujo KG, Jales RM, Pereira PN, Yoshida A, de Angelo Andrade L, Sarian LO, et al. Performance of the IOTA Adnexmodel in Preoperative Discrimination of Adnexal Masses in a Gynecological Oncology Center. Ultrasound Obstet Gynecol (2017) 49(6):778–83. doi: 10.1002/uog.15963
17. Chen H, Qian L, Jiang M, Du Q, Yuan F, Feng W. Performance of IOTA Adnex Model in Evaluating Adnexal Masses in a Gynecological Oncology Center in China. Ultrasound Obstet Gynecol (2019) 54(6):815–22. doi: 10.1002/uog.20363
18. Jeong SY, Park BK, Lee YY, Kim TJ. Validation of IOTA-ADNEX Model in Discriminating Characteristics of Adnexal Masses: A Comparison With Subjective Assessment. J Clin Med (2020) 9(6):2010. doi: 10.3390/jcm9062010
19. Joyeux E, Miras T, Masquin I, Duglet PE, Astruc K, Douvier S. Before Surgery Predictability of Malignant Ovarian Tumors Based on ADNEX Model and Its Use in Clinical Practice. Gynecol Obstet Fertil (2016) 44(10):557–64. doi: 10.1016/j.gyobfe.2016.07.007
20. Sandal K, Polat M, Yassa M, Günay T, Erdem GY, Güzin K. Comparision of Risk of Malignancy Indices and Assesment of Different Neoplasia in the Adnexa (Adnex) Model as Preoperative Malignancy Evaluation Methods for Adnexal Masses. Zeynep Kamil Tip Bulteni (2018) 49(4):324–9. doi: 10.16948/zktipb.445755
21. Sayasneh A, Ferrara L, De Cock B, Saso S, Al-Memar M, Johnson S, et al. Evaluating the Risk of Ovarian Cancer Before Surgery Using the ADNEX Model: A Multicentre External Validation Study. Br J Cancer (2016) 115(5):542–8. doi: 10.1038/bjc.2016.227
22. Tug N, Yassa M, Sargın MA, Taymur BD, Sandal K, Mega E. Preoperative Discriminating Performance of the IOTA-ADNEX Model and Comparison With Risk of Malignancy Index: An External Validation in a Non-Gynecologic Oncology Tertiary Center. Eur J Gynaecol Oncol (2020) 41(2):200–7. doi: 10.31083/j.ejgo.2020.02.4971
23. Viora E, Piovano E, Baima Poma C, Cotrino I, Castiglione A, Cavallero C, et al. The ADNEX Model to Triage Adnexal Masses: An External Validation Study and Comparison With the IOTA Two-Step Strategy and Subjective Assessment by an Experienced Ultrasound Operator. Eur J Obstet Gynecol Reprod Biol (2020) 247:207–11. doi: 10.1016/j.ejogrb.2020.02.022
24. Geomini P, Kruitwagen R, Bremer GL, Cnossen J, Mol BW. The Accuracy of Risk Scores in Predicting Ovarian Malignancy: A Systematic Review. Obstet Gynecol (2009) 113(2 Pt 1):384–94. doi: 10.1097/AOG.0b013e318195ad17
25. Li F, Tie R, Chang K, Wang F, Deng S, Lu W, et al. Does Risk for Ovarian Malignancy Algorithm Excel Human Epididymis Protein 4 and CA125 in Predicting Epithelial Ovarian Cancer: A Meta-Analysis. BMC Cancer (2012) 12:258. doi: 10.1186/1471-2407-12-258
26. Meys EM, Kaijser J, Kruitwagen RF, Slangen BF, Van Calster B, Aertgeerts B, et al. Subjective Assessment Versus Ultrasound Models to Diagnose Ovarian Cancer: A Systematic Review and Meta-Analysis. Eur J Cancer (2016) 58:17–29. doi: 10.1016/j.ejca.2016.01.007
27. Wynants L, Timmerman D, Verbakel JY, Testa A, Savelli L, Fischerova D, et al. Clinical Utility of Risk Models to Refer Patients With Adnexal Masses to Specialized Oncology Care: Multicenter External Validation Using Decision Curve Analysis. Clin Cancer Res (2017) 23(17):5082–90. doi: 10.1158/1078-0432.CCR-16-3248
28. Meys E, Jeelof LS, Achten N, Slangen BFM, Lambrechts S, Kruitwagen RFPM, et al. Estimating Risk of Malignancy in Adnexal Masses: External Validation of the ADNEX Model and Comparison With Other Frequently Used Ultrasound Methods. Ultrasound Obstet Gynecol (2017) 49(6):784–92. doi: 10.1002/uog.17225
29. Epstein E, Van Calster B, Timmerman D, Nikman S. Subjective Ultrasound Assessment, the ADNEX Model and Ultrasound-Guided Tru-Cut Biopsy to Differentiate Disseminated Primary Ovarian Cancer From Metastatic Non-Ovarian Cancer. Ultrasound Obstet Gynecol (2016) 47(1):110–6. doi: 10.1002/uog.14892
30. Abramowicz JS, Timmerman D. Ovarian Mass-Differentiating Benign From Malignant: The Value of the International Ovarian Tumor Analysis Ultrasound Rules. Am J Obstet Gynecol (2017) 217(6):652–60. doi: 10.1016/j.ajog.2017.07.019
31. Stukan M, Badocha M, Ratajczak K. Development and Validation of a Model That Includes Two Ultrasound Parameters and the Plasma D-Dimer Level for Predicting Malignancy in Adnexal Masses: An Observational Study. BMC Cancer (2019) 19(1):564. doi: 10.1186/s12885-019-5629-x
32. Moore RG, Miller MC, Steinhoff MM, Skates SJ, Lu KH, Lambert-Messerlian G, et al. Serum HE4 Levels are Less Frequently Elevated Than CA125 in Women With Benign Gynecologic Disorders. Am J Obstet Gynecol (2012) 206(4):351.e1–8. doi: 10.1016/j.ajog.2011.12.029
33. Badgwell D, Bast RC Jr. Early Detection of Ovarian Cancer. Dis Markers (2007) 23(5-6):397–410. doi: 10.1155/2007/309382
34. Drapkin R, von Horsten HH, Lin Y, Mok SC, Crum CP, Welch WR, et al. Human Epididymis Protein 4 (HE4) Is a Secreted Glycoprotein That is Overexpressed by Serous and Endometrioid Ovarian Carcinomas. Cancer Res (2005) 65(6):2162–9. doi: 10.1158/0008-5472.CAN-04-3924
35. Yanaranop M, Tiyayon J, Nakrangsee S, Thinkhamrop B. Diagnostic Accuracy and Optimal Cutoff Value of Serum HE4 to Predict Ovarian Cancer in Thai Women With Pelvic Masses. J Med Assoc Thai (2016) 99(12):1263–71.
36. Ferraro S, Braga F, Lanzoni M, Boracchi P, Biganzoli EM, Panteghini M. Serum Human Epididymis Protein 4 vs Carbohydrate Antigen 125 for Ovarian Cancer Diagnosis: A Systematic Review. J Clin Pathol (2013) 66(4):273–81. doi: 10.1136/jclinpath-2012-201031
37. Holcomb K, Vucetic Z, Miller MC, Knapp RC. Human Epididymis Protein 4 Offers Superior Specificity in the Differentiation of Benign and Malignant Adnexal Masses in Premenopausal Women. Am J Obstet Gynecol (2011) 205(4):358.e1–6. doi: 10.1016/j.ajog.2011.05.017
38. Paul P, Talukder S, Sangma MA, Saha PL, Begum M, Razi AZ, et al. Detection of Ovarian Tumor by Color Doppler Ultrasonography and CA-125. Mymensingh Med J (2017) 26(4):705–9.
39. Yu S, Yang HJ, Xie SQ, Bao YX. Diagnostic Value of HE4 for Ovarian Cancer: A Meta-Analysis. Clin Chem Lab Med (2012) 50(8):1439–46. doi: 10.1515/cclm-2011-0477
40. McKendry K, Duff S, Huang Y, Redha M, Scanlon Á, Abu Saadeh F, et al. The Value of Human Epididymis 4, D-dimer, and Fibrinogen Compared With Ca 125 Alone in Triaging Women Presenting With Pelvic Masses: A Retrospective Cohort Study. Acta Obstet Gynecol Scand (2021). doi: 10.1111/aogs.14126
41. Liang S, Tang W, Ye S, Xiang L, Wu X, Yang H. Incidence and Risk Factors of Preoperative Venous Thromboembolism and Pulmonary Embolism in Patients With Ovarian Cancer. Thromb Res (2020) 190:129–34. doi: 10.1016/j.thromres.2020.02.019
42. Yamada Y, Kawaguchi R, Iwai K, Niiro E, Morioka S, Tanase Y, et al. Preoperative Plasma D-Dimer Level Is a Useful Prognostic Marker in Ovarian Cancer. J Obstet Gynaecol (2020) 40(1):102–6. doi: 10.1080/01443615.2019.1606176
43. Qiao L, Chen X, Xi X, Chen X, Zhang P, Dong H, et al. Correlation Analysis and Clinical Significance of CA125, He4, DDI, and FDP in Type Ii Epithelial Ovarian Cancer. Med (Baltimore) (2020) 99(49):e23329. doi: 10.1097/MD.0000000000023329
44. Vahid Dastjerdi M, Ahmari S, Alipour S, Tehranian A. The Comparison of Plasma D-Dimer Levels in Benign and Malignant Tumors of Cervix, Ovary and Uterus. Int J Hematol Oncol Stem Cell Res (2015) 9(3):107–11.
45. Koh SC, Tham KF, Razvi K, Oei PL, Lim FK, Roy AC, et al. Hemostatic and Fibrinolytic Status in Patients With Ovarian Cancer and Benign Ovarian Cysts: Could D-dimer and Antithrombin Iii Levels be Included as Prognostic Markers for Survival Outcome. Clin Appl Thromb Hemost (2001) 7(2):141–8. doi: 10.1177/107602960100700211
46. Gadducci A, Baicchi U, Marrai R, Ferdeghini M, Bianchi R, Facchini V. Preoperative Evaluation of D-dimer and CA 125 Levels in Differentiating Benign From Malignant Ovarian Masses. Gynecol Oncol (1996) 60(2):197–202. doi: 10.1006/gyno.1996.0025
47. Chen L, Wang X, Shu J, Xu S, Wu Q, Yu Y. Diagnostic Value of Serum D-Dimer, CA125, and Neutrophil-to-Lymphocyte Ratio in Differentiating Ovarian Cancer and Endometriosis. Int J Gynaecol Obstet (2019) 147(2):212–8. doi: 10.1002/ijgo.12949
48. Zhang F, Zhang ZL. The Diagnostic Value of Transvaginal Sonograph (Tvs), Color Doppler, and Serum Tumor Marker Ca125, CEA, and AFP in Ovarian Cancer. Cell Biochem Biophys (2015) 72(2):353–7. doi: 10.1007/s12013-014-0463-x
Keywords: ovarian cancer, ADNEX model, ultrasonography, diagnostic accuracy, preoperative identification
Citation: Huang X, Wang Z, Zhang M and Luo H (2021) Diagnostic Accuracy of the ADNEX Model for Ovarian Cancer at the 15% Cut-Off Value: A Systematic Review and Meta-Analysis. Front. Oncol. 11:684257. doi: 10.3389/fonc.2021.684257
Received: 23 March 2021; Accepted: 24 May 2021;
Published: 17 June 2021.
Edited by:
Stefano Restaino, Ospedale Santa Maria della Misericordia di Udine, ItalyReviewed by:
Martina Borghese, Hospital Mauritian Turin, ItalyAlessia Sala, University of Udine, Italy
Copyright © 2021 Huang, Wang, Zhang and Luo. This is an open-access article distributed under the terms of the Creative Commons Attribution License (CC BY). The use, distribution or reproduction in other forums is permitted, provided the original author(s) and the copyright owner(s) are credited and that the original publication in this journal is cited, in accordance with accepted academic practice. No use, distribution or reproduction is permitted which does not comply with these terms.
*Correspondence: Hong Luo, Luohongcd1969@163.com