 Fangyuan Liu†Weijun Ou†Wenbo Tang†Zhenyu HuangZhehui ZhuWenjun DingJihong FuYilian ZhuChenying LiuWeimin Xu*
 Peng Du*
- Department of Colorectal Surgery, Xinhua Hospital, Shanghai Jiaotong University School of Medicine, Shanghai, China
Background: Amine oxidase copper containing 1 (AOC1) is a gene whose biological function in colorectal cancer (CRC) has not been elucidated. Therefore, the purpose of this study was to investigate the clinical significance of AOC1 expression in CRC and its biological function in CRC cell lines.
Materials and Methods: AOC1 expression levels were examined in paired CRC and peritumoral tissues, and distant liver metastatic tissues were examined using quantitative real-time PCR, western blotting, and immunohistochemistry staining. The log-rank test and Cox regression model were used to analyze the relationship between AOC1 expression and prognosis. Proliferation assays (Cell Counting Kit‐8 and colony formation assays), migration assays (Transwell and wound healing assays) and xenograft tumor formation in nude mice were performed to assess the biological role of AOC1 in CRC cells.
Results: AOC1 expression significantly increased in human CRC tissues, especially in liver metastases, and was associated with a worse prognosis. In addition, AOC1 had higher expression in tumor organoids than in normal organoids, suggesting that it was highly expressed in the tumor epithelium. Functional analysis demonstrated that AOC1 knockdown inhibited the proliferation and migration of CRC cells by inducing EMT in vitro. Xenograft tumor formation in nude mice showed that knockdown of AOC1 inhibited the tumor xenografts growth in vivo.
Conclusion: High expression of AOC1 was significantly associated with worse clinical outcomes, was an independent risk factor for poor prognosis, and promoted aggressive CRC cell phenotypes. AOC1 is expected to become a novel biomarker for predicting the prognosis of patients with CRC and an effective therapeutic target in clinical practice.
Introduction
Colorectal cancer (CRC) is the second most common malignant tumor, with the fourth highest mortality rate. Annually, approximately 1.25 million people worldwide are diagnosed with CRC and more than 600,000 patients die from it (1). In the past 20 years, the incidence rate of CRC has increased significantly, especially in larger cities, and there has been a trend of younger disease (2, 3). Therefore, CRC has become a major global health concern. Despite advancements in treatment in the past few decades, the mortality rate of CRC is still high, mainly due to recurrence and distant organ metastasis (4). Twenty percent of CRC cases have metastases, mostly in the liver (5, 6). Although some diagnostic biomarkers, such as CEA and CA199 (7), are established, it is still necessary to explore new molecules to accurately predict the prognosis of CRC patients and become effective therapeutic targets in clinical practice.
AOC1 (Amine Oxidase Copper Containing 1) is a protein coding gene and it encodes a metal-binding membrane glycoprotein that oxidatively deaminates putrescine, histamine, and related compounds. Previous studies have shown that polyamines are involved in the regulation of cell migration, proliferation, and apoptosis.
Recently, a study (8) revealed that AOC1 promoted the progression of gastric cancer, and another study (9) has shown that AOC1 was a downstream target gene of the Wilms tumor protein that affected kidney development. However, very little is known about the functions and regulatory mechanisms of AOC1 in CRC.
In the current study, we detected the expression of AOC1 in CRC tissues and found that AOC1 expression was significantly increased in human colorectal cancer tissues compared to normal tissues. In addition, the expression was higher in liver metastases than in carcinoma in situ. Furthermore, with the arrival of the era of organoid culture in vitro (9), we used organoids in the experiment to verify the related phenomenon. As we had expected, AOC1 was highly expressed in tumor organoids compared to the normal one, suggesting that it was highly expressed in the tumor epithelium. We first reported the biological functions of AOC1 in CRC cells, especially its effects on proliferation and migration. Moreover, AOC1 overexpression promoted the proliferation and migration of CRC cells. Consistent with the result of the cell proliferation assay in vitro, knockdown of AOC1 significantly inhibited the tumor xenografts growth. Interestingly, AOC1 knockdown inhibited the migration and proliferation of CRC cells by EMT pathway. Therefore, AOC1 is expected to become a novel biomarker for predicting the prognosis of patients with CRC and an effective therapeutic target in clinical practice.
Materials and Methods
Patients and Specimens
From January 2010 to January 2013, the Department of Colorectal Surgery, Xinhua Hospital, Shanghai Jiaotong University School of Medicine, admitted 192 CRC patients. Formalin-fixed, paraffin-embedded (FFPE) tumor tissues and matched normal tissues were used to make a tissue microarray (TMA) for further immunohistochemistry (IHC) analysis.
Thirty fresh paired tissues were analyzed by real-time quantitative polymerase chain reaction (qRT-PCR), and four fresh paired tissues were analyzed by western blotting. The Ethics Committee of Xinhua Hospital approved this study (No. XHEC‐D‐2021‐002). All patients enrolled in this study signed a broad consent form, and the study was strictly in accordance with the Declaration of Helsinki and International Ethical Guidelines for Health-related Research Involving Humans.
IHC and Histopathologic Evaluation of AOC1 Expression
The TMA and xenograft tumor sections was deparaffinized, followed by antigen retrieval using citrate buffer (pH 6.0). Hence, to block endogenous peroxidases and nonspecific antigens, 3% hydrogen peroxide, and 5% goat serum were used, respectively. The primary antibody against AOC1 (1:500, Abcam) and anti‐Ki67 (1:1,000, Catalog No. ab16667; Abcam, Boston, MA) was incubated overnight at 4°C. The secondary antibody was then applied to the TMA or xenograft tumor sections for 1 h at room temperature after washing with phosphate-buffered saline (PBS) three times for 5 min each. Finally, to detect the positive expression of the primary antibody, diaminobenzidine chromogen (Beyotime, Haimen, China) was performed. The TMA was then counterstained with hematoxylin and cover slipped.
Excluding patients who failed to follow-up, 151 eligible patients were enrolled in this study. Immunohistochemical analysis was conducted as previously described. AOC1 expression in TMA was evaluated and semi-quantitatively scored based on IHC results by two independent pathologists. Semi-quantitative IHC analysis was scored based on staining intensity and percentage of staining. The detailed standards were as follows: staining intensity: 0 (negative), 1 (weakly positive), 2 (moderately positive), or 3 (strongly positive); percentage of staining: 1 (<25%), 2 (25% - 50%), 3 (50% - 75%), and 4 (> 75%). Expression index = % of positive cells × staining intensity. The AOC1 protein expression in CRC specimens was divided into the low expression group (< 4) and high expression group (≥ 4) for subsequent analysis.
Cell Culture and Treatment
Human CRC cell lines, including HCT116, LoVo, sw480, HT29, and HEK293T cells were obtained from the American Type Culture Collection (Manassas, VA, USA). All cells tested negative for mycoplasma contamination before use. Cells were cultured in Dulbecco’s modified Eagle’s medium (DMEM; HyClone, Los Angeles, CA, USA) supplemented with 10% fetal bovine serum (FBS; Gibco, Grand Island, New York, USA), 100 µg/mL of penicillin, and 100 U/mL of streptomycin at 37°C with 5% CO2.
Organoid Culture
Fresh tumor and paired adjacent normal colon tissues were kept in phosphate-buffered saline solution without calcium and magnesium (PBS WO, Sigma Aldrich) at 4°C. The isolation of healthy crypts and tumor epithelium was performed as described by Sato et al. (10). The organoid culture medium was refreshed every two days. Culture medium including 50% L-WRN condition medium (containing Wnt3a, R-Spondin1, and Noggin), 1X Glutamax, 1X hepes, 1X N2 (Invitrogen), 1X B27 minus vitamin A (Life Technologies), 1X penicillin/streptomycin solution (Invitrogen), 50 ng/mL human EGF (Gibco), 1 mM N-acetylcysteine (Sigma Aldrich), 10 mM nicotinamide (Sigma Aldrich), 10 nM gastrin (Sigma Aldrich), 10 µM SB202190 (Selleck), 0.01 uM PGE2 (Sigma Aldrich), and 10 mM Y27632 (Sigma Aldrich).
RNA Extraction and RT‐qPCR
Total RNA was extracted from the cultured cells and fresh tissues using TRIzol reagent (Invitrogen, Carlsbad, CA, USA), according to the manufacturer’s instructions. To reverse the RNA, the PrimeScript ™ RT Master Mix (Takara Biotechnology Co, Ltd.) was used. The SYBR Premix ExTaq ™ (Takara, Japan) and an Applied Biosystems 7500 Fast Real-Time PCR System (Applied Biosystems, Waltham, MA) were used for qRT-PCR measurements. Relative mRNA expression levels were evaluated using the 2 −ΔΔCt method and normalized to the expression of β-actin. All experiments were performed in triplicate.
The sequences of the PCR primers applied are listed as:
AOC1-F: CCTAAGCAACCAAGAGCTGAA
AOC1-R: CGGTGACATTGGGATGCTCC
Actin-F: GCACAGAGCCTCGCCTT
Actin-R: GTTGTCGACGACGAGCG.
Western Blotting
Cultured cells, fresh tumor tissue, and paired adjacent normal colon tissues were lysed with 1% NP40 lysis buffer supplemented with NaF, Na3VO4, and protease inhibitor cocktail. Lysates containing equal amounts of protein (20 μg/well) were loaded and separated by SDS-PAGE and then transferred onto a nitrocellulose membrane. The membrane was blocked with 5% non-fat milk for at least 1 h and then incubated with a specific antibody against AOC1 (1:500, Abcam) at 4°C overnight. After washing the membranes thrice with Tris-borate saline containing 0.1% Tween-20 for 5 min each, the specific protein was visualized with horseradish peroxidase (HRP)-conjugated secondary antibody and enhanced chemiluminescence.
RNA Interference
Short hairpin RNA (shRNA) sequences targeting AOC1 were cloned into a pLKO vector with a pMD.2G and psPAX2 packaging system, and lentiviruses were generated in HEK293T cells. To transfect this vector, sw480 cells were infected with viral particles and treated with PB (polybrene) to promote transfection efficiency. Then, stably transfected cells were filtered for 72h using puromycin. RT-qPCR was used to analyzed the knock-down efficiency.
The shRNA sequences are as follows:
shAOC1-1F: GCGGACAACTTCAACTGTCTA
shAOC1-1R: TAGACAGTTGAAGTTGTCCGC
shAOC1-2F: CCTAAGCAACCAAGAGCTGAA
shAOC1-2R: TTCAGCTCTTGGTTGCTTAGG
Enforced Expression of AOC1 in CRC Cell Line HCT116
The cDNA of AOC1 was cloned into a puromycin-resistant lentiviral vector (pLVX-Puro). Lentivirus particles were prepared using HEK293T cells according to the manufacturer’s protocol (Takara, Beijing, China). HCT116 cells were then seeded into six-well culture plates and incubated overnight. They were subsequently infected with AOC1-expressing lentivirus, treated with PB to promote transfection efficiency, and then treated with puromycin to select the cells overexpressing AOC1 in a stable manner.
Cell Counting Kit‐8 and Colony Formation Assays
The CCK8 assay was employed to detect the effect of AOC1 knockdown on cell proliferation. First, a cell count of approximately 1,000 cells/well was plated on five 96‐well plates, and five replicates were cultured with complete medium (DMEM with10% FBS). After incubation for 24 h, 10 uL/well CCK‐8 solution was added to each well in the first 96‐well plate and incubated for 1.5 h at 37°C in dark conditions. A microplate reader was used to detect the absorbance at 450 nm in each plate for 5 days consecutively.
For the colony formation assay, approximately 1,000 cells were plated in 6-well plates and then cultured in DMEM containing 10% FBS. After 2 weeks, the cells were washed with PBS and fixed with 4% paraformaldehyde for 30 min at room temperature. Finally, 0.1% crystal violet was used to stain these cells for 30 min at room temperature and then washed off by clean water. The number of cells was then observed in each cell group.
Transwell and Wound—Healing Assays
To assess the effect of AOC1 overexpression and knockdown on cell migration ability, a transwell assay was performed. Subsequently, stable AOC1-overexpressing and control cells (1.0 × 10⁵) were harvested and suspended in 100 uL serum-free medium and seeded into the upper chamber, while the lower chambers were filled with 500 μL complete medium and incubated for 65 h. The upper chamber was fixed with 4% paraformaldehyde for 30 min at room temperature. Finally, 0.1% crystal violet was used to further stain these cells adhering to the upper chamber for 30 min at room temperature. Cell migration ability was assessed based on the number of cells passing through the upper chamber.
To verify the effect of AOC1 knockdown on tumor cell migration ability, we used the aforementioned method to change the cell mass to 1.5 × 10⁵ AOC1 knockdown stable cells, with an incubation time of 48 h.
In addition, a wound-healing assay was performed to confirm the effect. A total of 1 × 10⁶ cells were seeded into six-well plates and cultured in low-serum medium (DMEM containing 1% FBS). When the cell density was 100%, a scratch wound was made in the cell monolayer, and the initial image was immediately obtained. The cells were then cultured for another 48 h, 72 h, and 96 h, and the corresponding images were recorded immediately as well.
Xenograft Tumor Mice Model
All animal experimental procedures were approved by the Laboratory Animal Care and Welfare Committee of Xinhua Hospital (No. XHEC‐F‐2021‐057). To study the effect of AOC1 on CRC cells proliferation in vivo, 10 male nude mice (4-6 weeks old) were used as the experimental animals. Among the 10 nude mice, 5 were injected with AOC1-depletion CRC cells, and the another 5 nude mice were used as a control group. First, 1 × 10 6 sw480pLKO and sw480 shAOC1cells were counted and then subcutaneously injected into both axillary fat pads in a different group. Then these nude mice were fed for consecutive 2 weeks until the last day. Tumors were removed from killed mice, photographed, and paraffin preserved (11).
Statistical Analysis
GraphPad Prism 8 Software (GraphPad, San Diego, CA) and SPSS version 26.0 software (IBM, 2010, Chicago, IL) were used for overall statistical analyses. Kaplan–Meier method was performed to assess the survival time distribution, and the log‐rank test was used to test significance in DFS (Disease free survival) and OS (Overall survival) among the different prognostic groups. The Cox proportional hazard model was used perform single and multivariate analyses to evaluate the hazard ratio (HR) and 95% confidence interval (CI). In our previous studies, we described the detailed statistical methods (12, 13). Unless otherwise stated in the legend, ANOVA or two-tailed Student’s t-test was used to assess significance. The chi-square test was used to analyze the correlations of AOC1 expression with clinicopathological characteristics of CRC patients. Three biological replicates were performed for each experiment. A p-value less than 0.05 was considered statistically different (*P < 0.05; **P < 0.01; ***P < 0.001).
Results
Increased AOC1 Expression in Tumor Tissues Was Associated With Worse Prognosis in CRC Patients
We included 151 eligible CRC patients in the current study, and the median follow-up time from January 2015 to July 2020 was 57.0 (17.0 - 71.0) months. Table 1 shows the demographic, laboratory, and clinical characteristics of the patients.
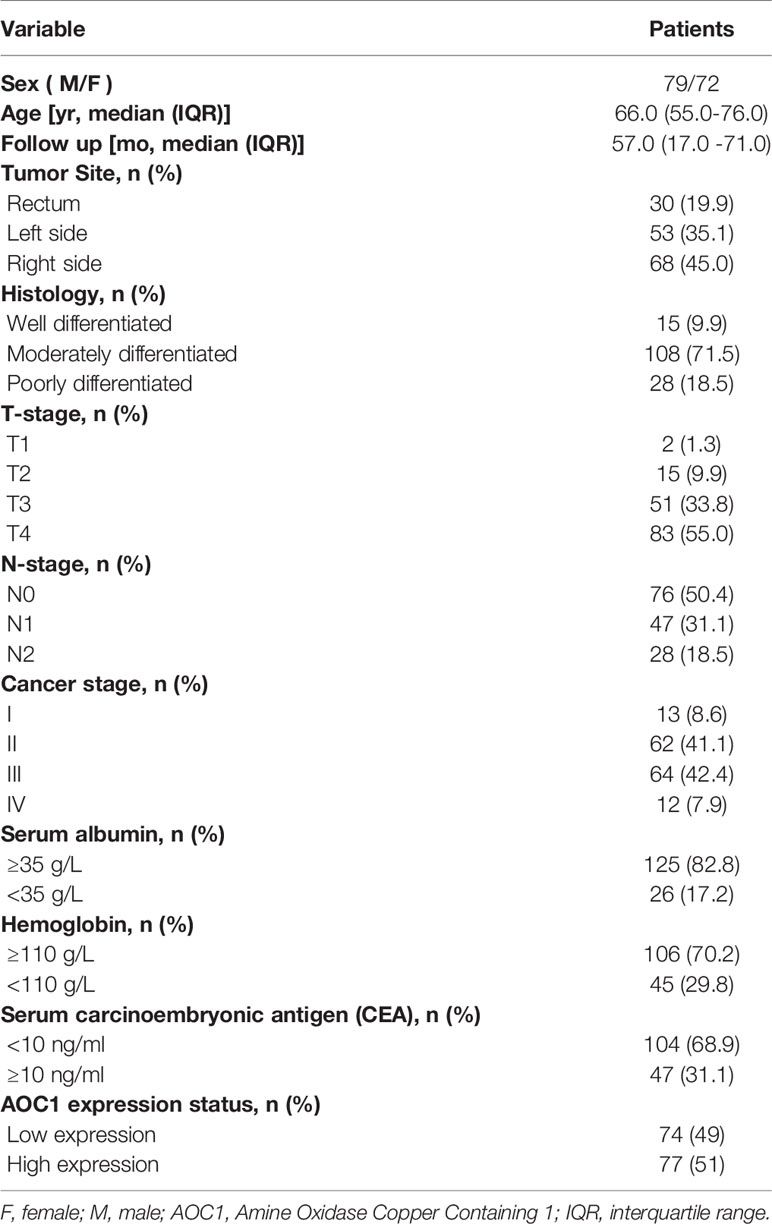
Table 1 Baseline characteristics of patients.
First, we found AOC1 was highly expression in tumor tissues both in Colon adenocarcinoma (COAD) and Rectum adenocarcinoma (READ) (Figure 1A), according to Gene Expression Profiling Interactive Analysis (GEPIA) database (14). we tested the mRNA and protein levels of AOC1 expression in paired tumor and normal tissues by qRT-PCR and western blotting, respectively (Figures 1B, C). These indicated that AOC1 was highly expressed in the tumor tissues. Furthermore, immunohistochemistry (IHC) was performed on 192 CRC tumor tissues and paired adjacent normal colon tissues from Xinhua Hospital in TMA, and 41 patients were excluded from further analysis as they were lost to follow-up. As presented in Figure 1D, representative images of different levels of expression of AOC1 have been displayed, including negative (Da), weakly positive (Db), moderately positive (Dc), and strongly positive (Dd). Figure 1D showed a detailed scoring method for assessing AOC1 expression intensity. In the entire cohort, participants were divided into AOC1 low expression and high expression groups corresponding to 74 samples (49%), and 77 samples (51%), respectively (Table 1). Moreover, we analyzed the correlations between the expression of AOC1 and the clinicopathological characteristics of the CRC patients. Correlation analysis showed expression of AOC1 was significant correlation with Gender, Tumor Site, Cancer stage and Hemoglobin (p =0.012; p = 0.001, p = 0.016, p = 0.031), especially with liver metastasis (p < 0.001), however, it is not associated with Histology, T-stage, N-stage, N-stage, and Serum carcinoembryonic antigen (CEA) (Table 2).
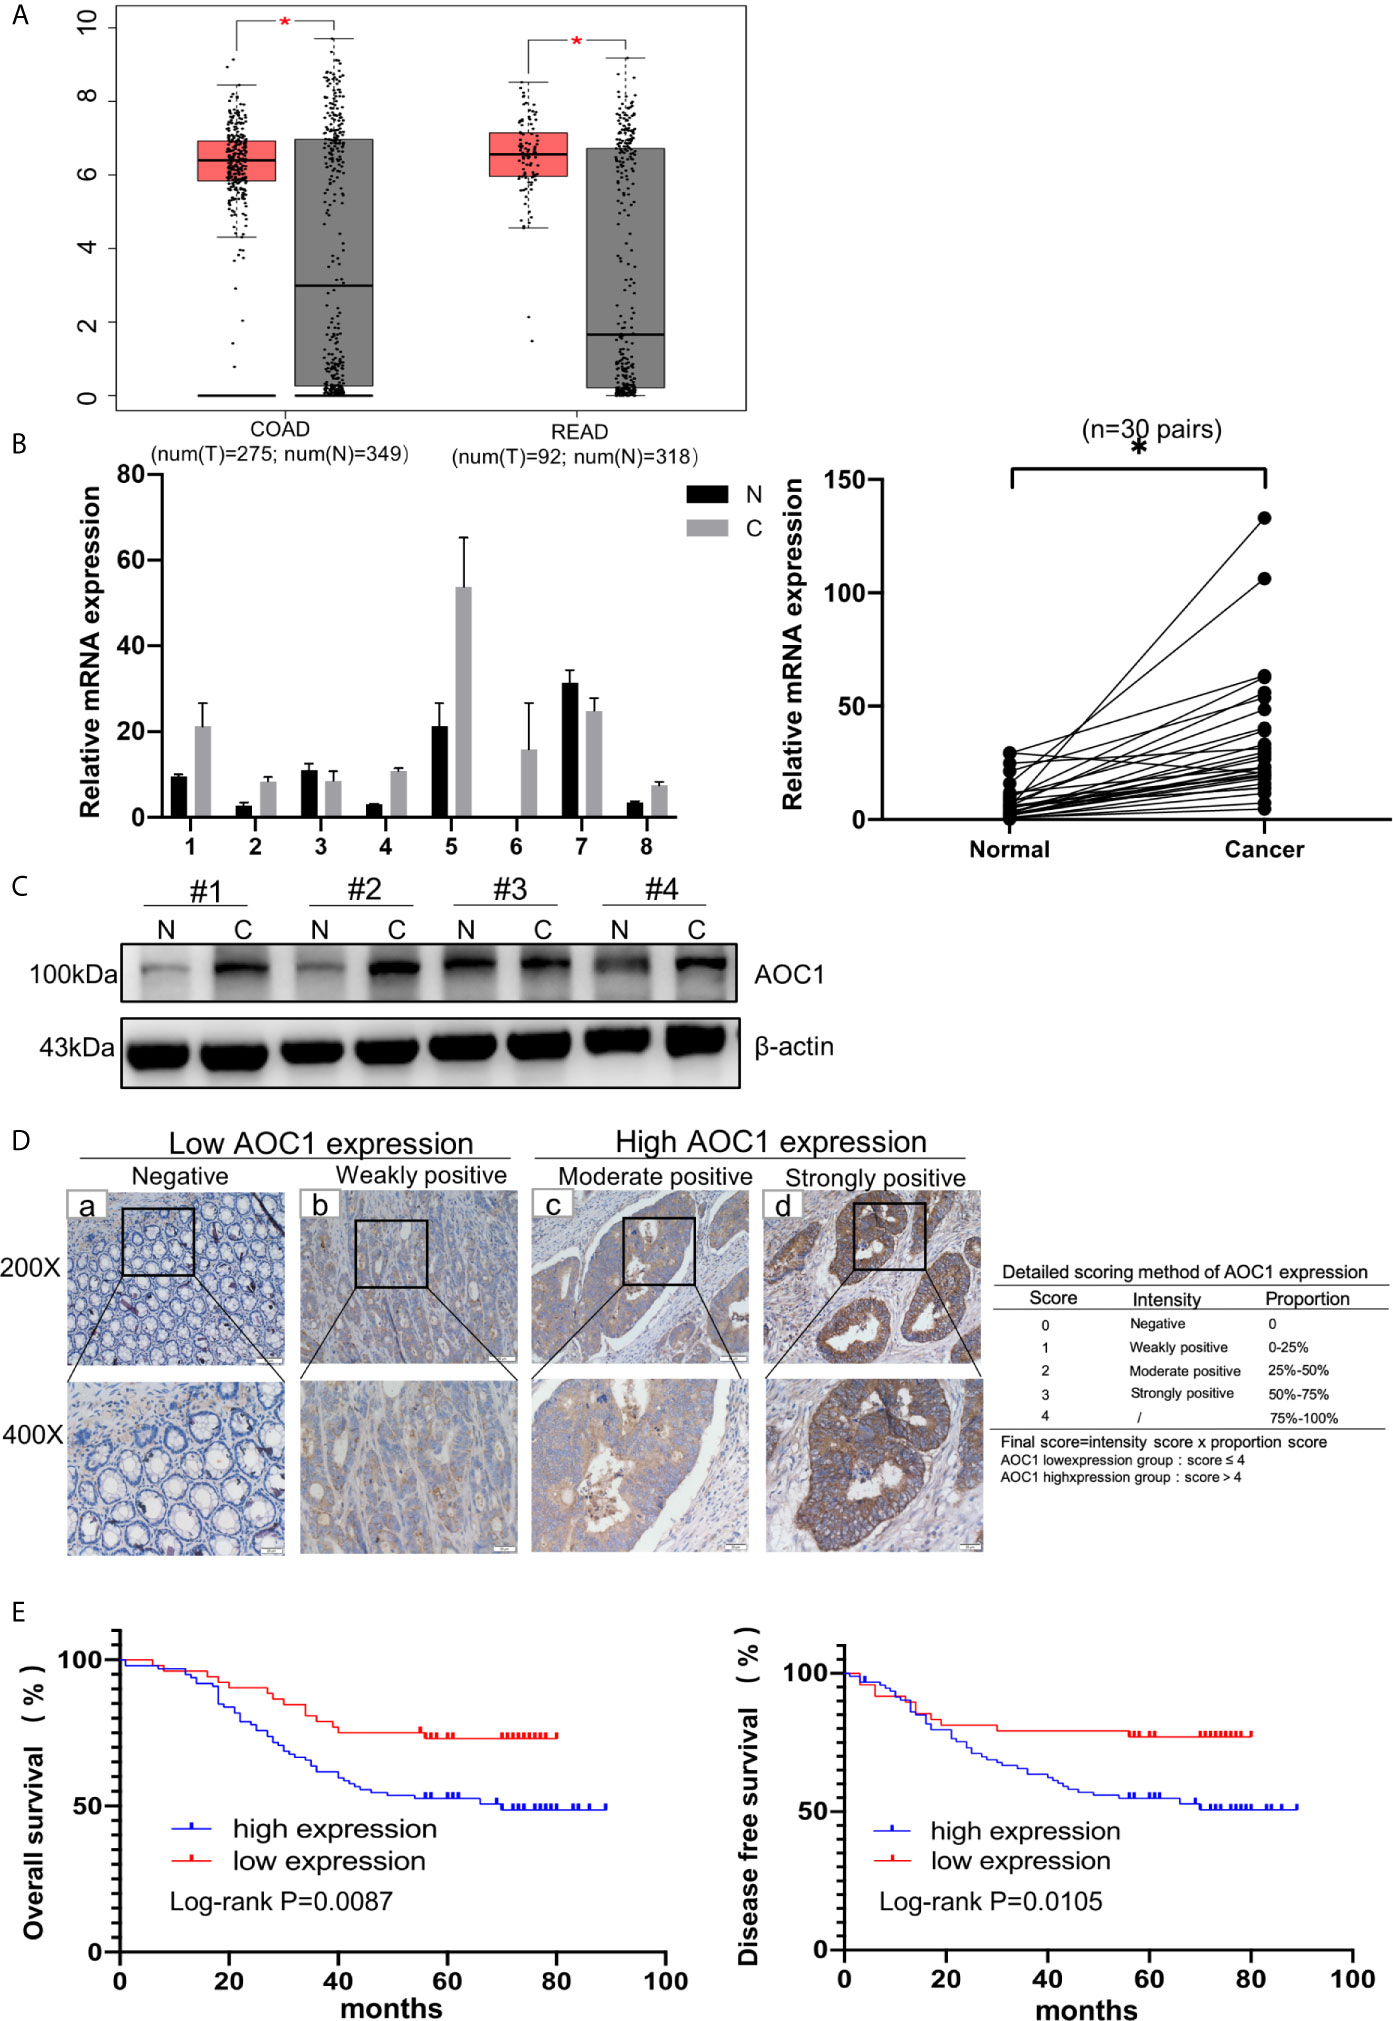
Figure 1 AOC1 expression was increased in tumor tissues and associated with worse prognosis. (A) Data were obtained from the GEPIA website, AOC1 was highly expression in tumor tissue (red box) compared with normal tissue (gray box), both in COAD and READ (14). (B) Tumor and paired normal colorectal tissues were detected the AOC1 expression by real‐time quantitative polymerase chain reaction and Western blotting (C). (D) Immunohistochemical analysis of different AOC1 expression in CRC patients (magnification: × 200, Low; × 400, High)and detailed scoring method of AOC1 expression; Da‐Dd represented negative, weakly positive, moderate positive, and strongly positive AOC1 expression, respectively. (E) The Kaplan–Meier plots were stratified by AOC1 expression for disease‐free survival and overall survival in CRC patients. Log‐rank test was performed to assess statistical significance. CRC, colorectal cancer; AOC1, Amine Oxidase Copper Containing 1; mRNA, messenger RNA; COAD, Colon adenocarcinoma; READ, Rectum adenocarcinoma. OS, overall survival; DFS, disease-free survival. *P < 0.05.
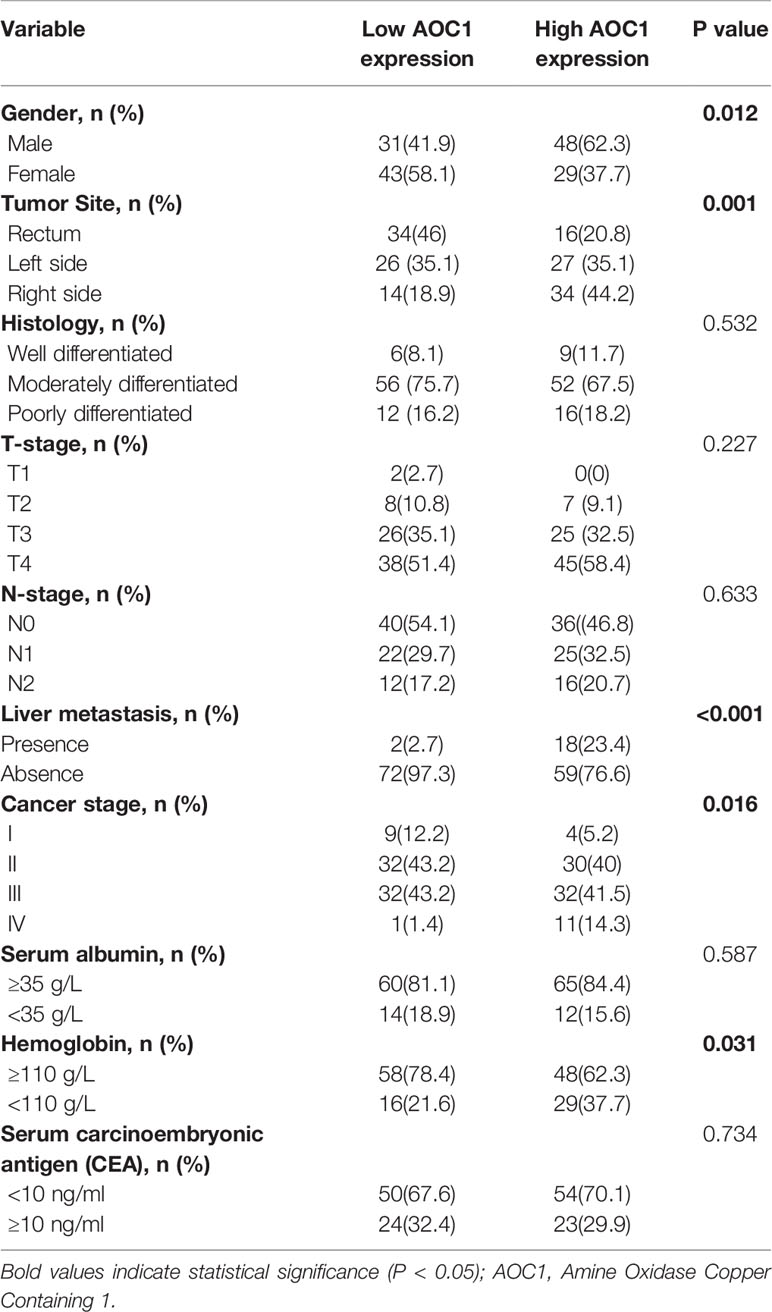
Table 2 Correlations of AOC1 expression with clinicopathological characteristics of CRC patients.
Next, the GEPIA database evaluated that AOC1 expression was statistically significant for predicting tumor clinical stage according to GEPIA database (p = 0.0459) (Figure 2A). Then, we performed IHC on paired normal, tumor, and distant liver metastasis tissues. We observed that AOC1 expression was noticeably higher in CRC liver metastatic tissues than in primary tumor tissues by IHC and qRT-PCR (Figures 2B, C), and significant associated with liver metastasis (p < 0.001) (Table 2), indicating that AOC1 is a potential biomarker for predicting liver metastasis of colorectal cancer. To study its expression in the intestinal epithelium, IHC was performed on organoids derived from fresh tumor tissue and paired adjacent normal colon tissues. The results showed that AOC1 was highly expressed in the tumor epithelium (Figures 3A, B), suggesting that the positive expression pattern of AOC1 was the location of the tumor epithelium cytoplasm.
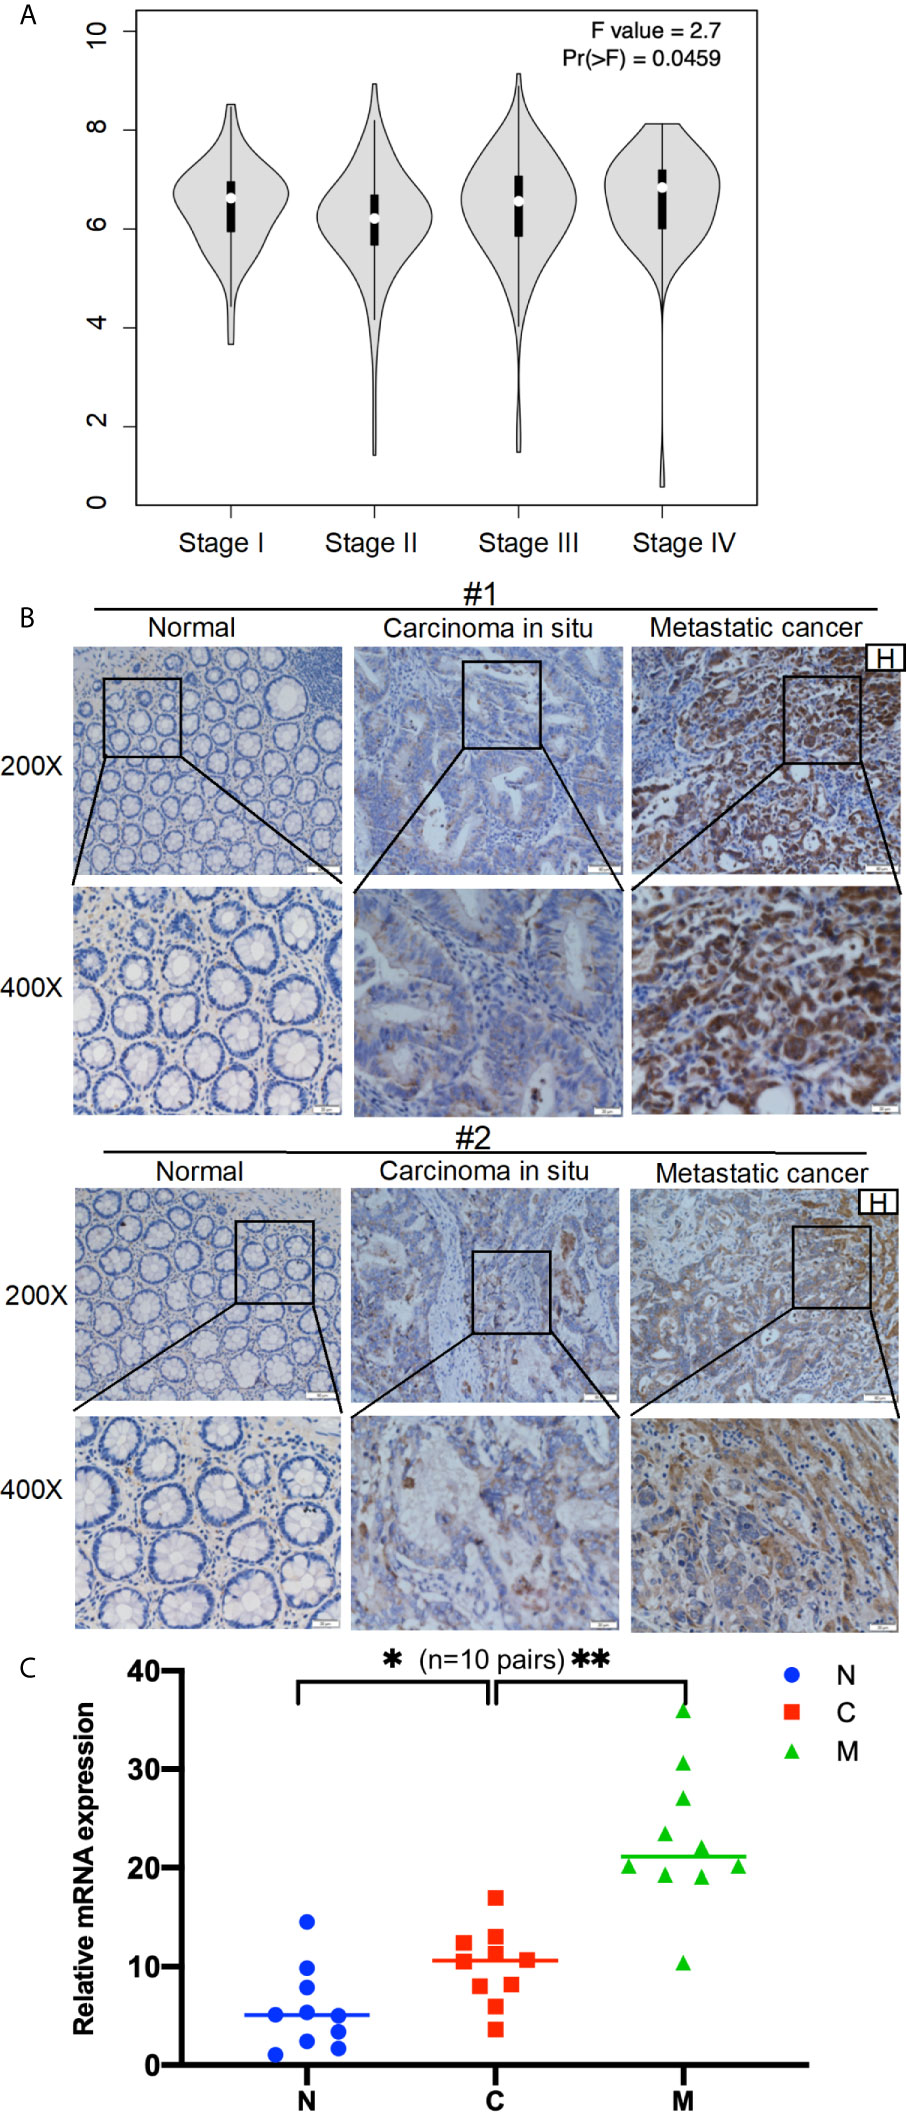
Figure 2 AOC1 expression was highly increased in advanced tumor stage. (A) Data were obtained from the GEPIA, AOC1 expression was associated with CRC cancer stage both in COAD and READ (P=0.0459) (14). (B) Immunohistochemical analysis of AOC1 expression in paired CRC tissues, peritumoral tissues and distant liver metastatic tissues (magnification: × 200, Low; × 400, High); (C) The expression of AOC1 in normal, tumor and liver metastases (n=10 pairs) by qRT‐PCR. H, Hepatic; AOC1, Amine Oxidase Copper Containing 1; COAD, Colon adenocarcinoma; READ, Rectum adenocarcinoma; qRT‐PCR, real‐time quantitative polymerase chain reaction; *p < 0.05, **p < 0.01.
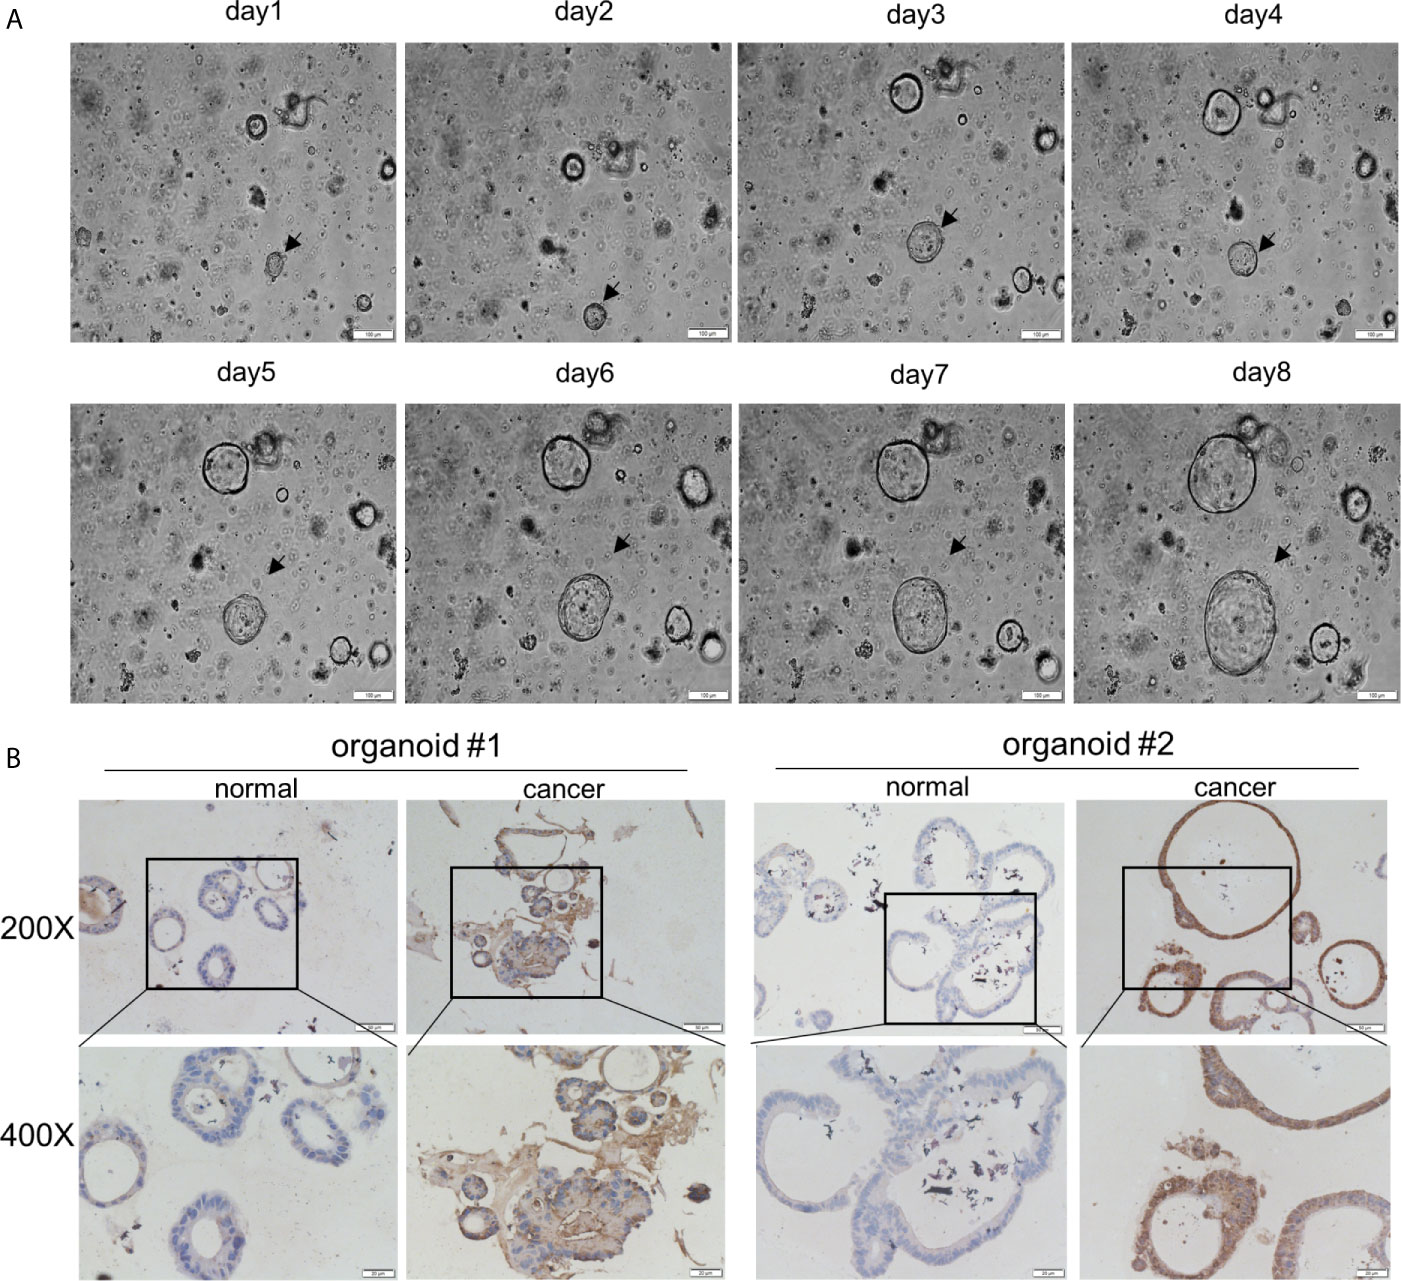
Figure 3 AOC1 was highly expression in tumor epithelium. (A) Normal colon organoids grown from day1 to day8 (Scale bar:100um). (B) Immunohistochemical analysis of AOC1 expression in normal colon organoid and tumor organoid (magnification: × 200, Low; × 400, High).
In univariate analysis, tumor depth, positive regional lymph nodes metastasis, clinical stage, and AOC1 expression level were significantly associated with prognosis (p < 0.05), whereas sex, age, or primary tumor location were not associated (Table 3). In multivariate Cox regression hazard analysis, tumor depth, Stages‐III/IV and high AOC1 expression were associated with poor prognosis in DFS (HR = 2.042, 95% CI = 1.200–3.475, p = 0.008; HR = 1.793, 95% CI = 1.068-3.010, p = 0.027; HR = 18.842, 95% CI = 7.459–47.597, p < 0.001), and tumor depth and high AOC1 expression was a significant contributing factor for poor prognosis in OS (HR = 1.946, 95% CI = 1.143-3.314, p = 0.014; HR = 19.343, 95% CI = 7.649–48.920, p < 0.001) (Table 3).
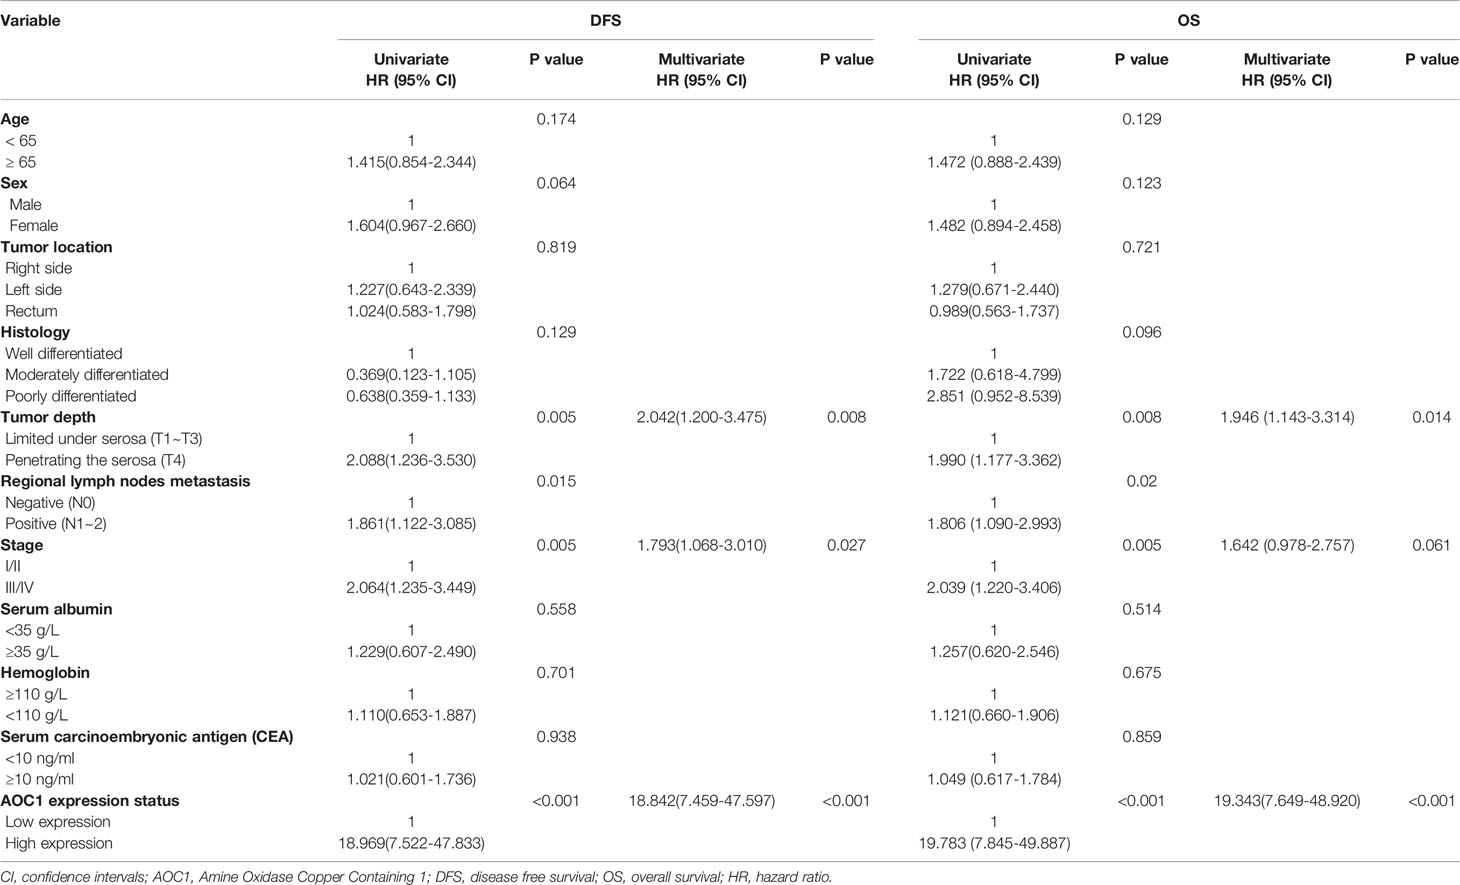
Table 3 Univariate and multivariate analysis of overall survival and disease-free survival.
In addition, in the Kaplan-Meier survival analysis using the log-rank test, patients with high AOC1 expression had worse prognosis both in DFS (p=0.0105) and OS (p =0.0087) compared to the low-expression group (Figure 1E). In summary, these indicate that the upregulation of AOC1 in tumor tissues significantly correlates with worse clinical outcomes in CRC patients and is an independent prognostic factor in CRC patients after surgery (Table 3).
AOC1 Overexpression Promoted Tumor Proliferation Ability of CRC Cell In Vitro
To detect the expression of AOC1, five different cell lines including normal and CRC cell lines, were used to analyze the AOC1 expression through qRT‐PCR and western blot analysis. As shown in Figure 4A, the sw480 cell line had a relatively high expression of AOC1 both at the mRNA and protein levels, but the HCT116 cell line had a relatively low expression. To examine the effects of AOC1 overexpression in CRC cells, HCT116 cells were selected to enhance AOC1 expression using an AOC1 overexpression plasmid.
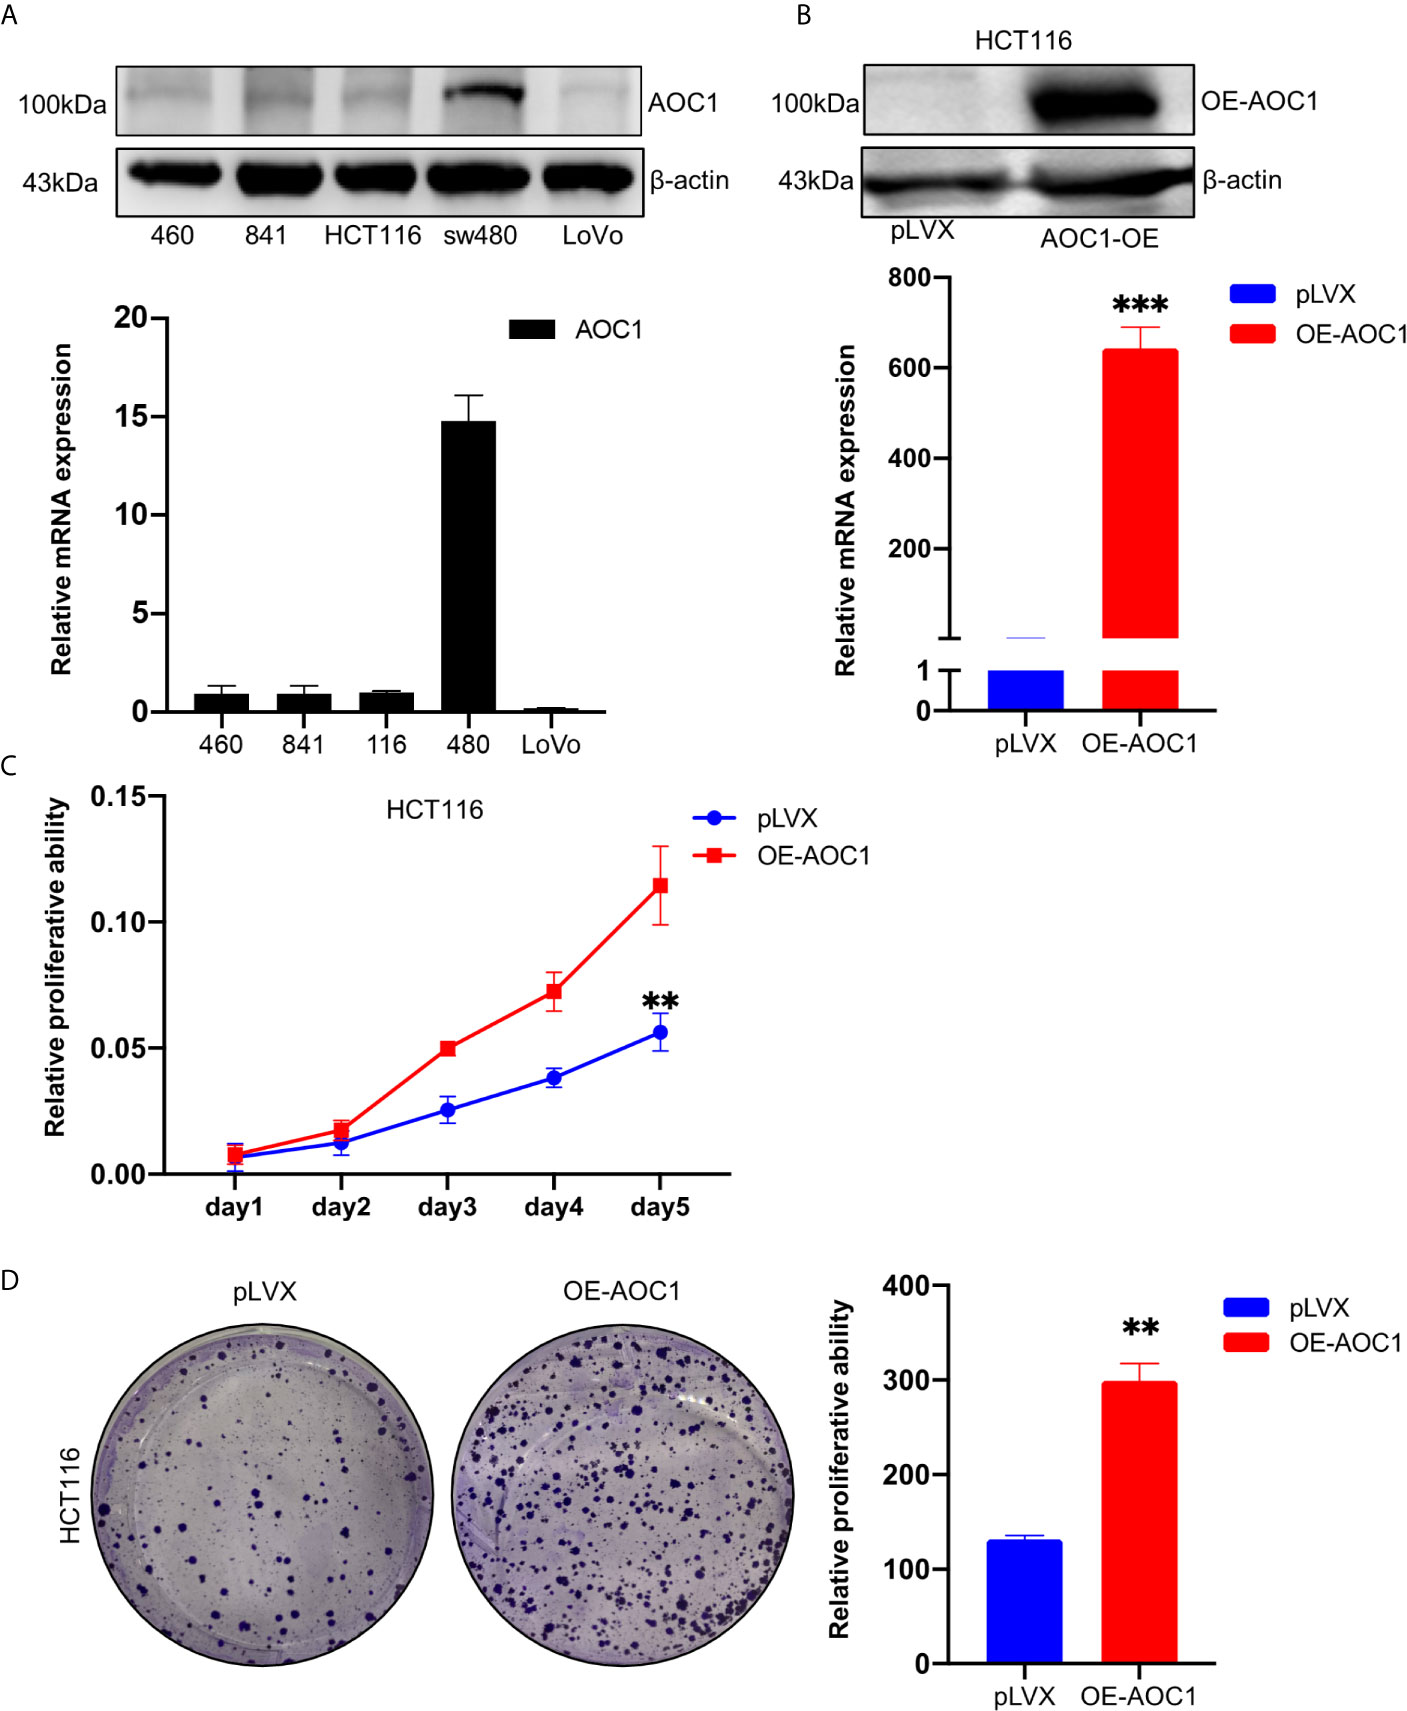
Figure 4 AOC1 expression was in CRC cell lines and AOC1 overexpression promoted the proliferation ability of colorectal cancer cells. (A) AOC1 mRNA and protein level were detected by qRT‐PCR and western blot analysis in five cell lines, respectively. (B) The efficiency of AOC1 overexpression were examined in HCT116 cells by qRT‐PCR and western blot analysis. (C) The effect of overexpression of AOC1 on cell proliferation was detected by Cell Counting Kit‐8 assay kits in HCT116 cells. (D) Colony‐forming assay in AOC1 overexpression in HCT116 cells. CRC, colorectal cancer; AOC1, Amine Oxidase Copper Containing 1; mRNA, messenger RNA; qRT‐PCR, real‐time quantitative polymerase chain reaction; **p < 0.01, ***p < 0.001.
Western blotting and qRT-PCR determined the efficiency of AOC1 overexpression (Figure 4B). As showed in Figures 4C, D, we found that AOC1 overexpression in HCT116 cells significantly promoted cell proliferation ability compared to the control cells by cck8, as well as colony formation assay. These results showed that AOC1 played an oncogene role by promoting the malignant proliferation of CRC cells.
AOC1 Overexpression Promoted Tumor Cell Migration In Vitro
To further analyze the effect of overexpression of AOC1 in CRC cell, the Transwell and wound-healing assays were used. As shown in Figure 5A, AOC1 overexpression in HCT116 cells significantly promoted cell migration ability compared to the control cells in the Transwell assay. Furthermore, consistent results were obtained from the wound-healing assay. We found that AOC1 overexpression in HCT116 cells also increased wound closure rates when compared with control cells (Figure 5B). Therefore, these results indicated that AOC1 played a biological role in regulating the migration of CRC cells.
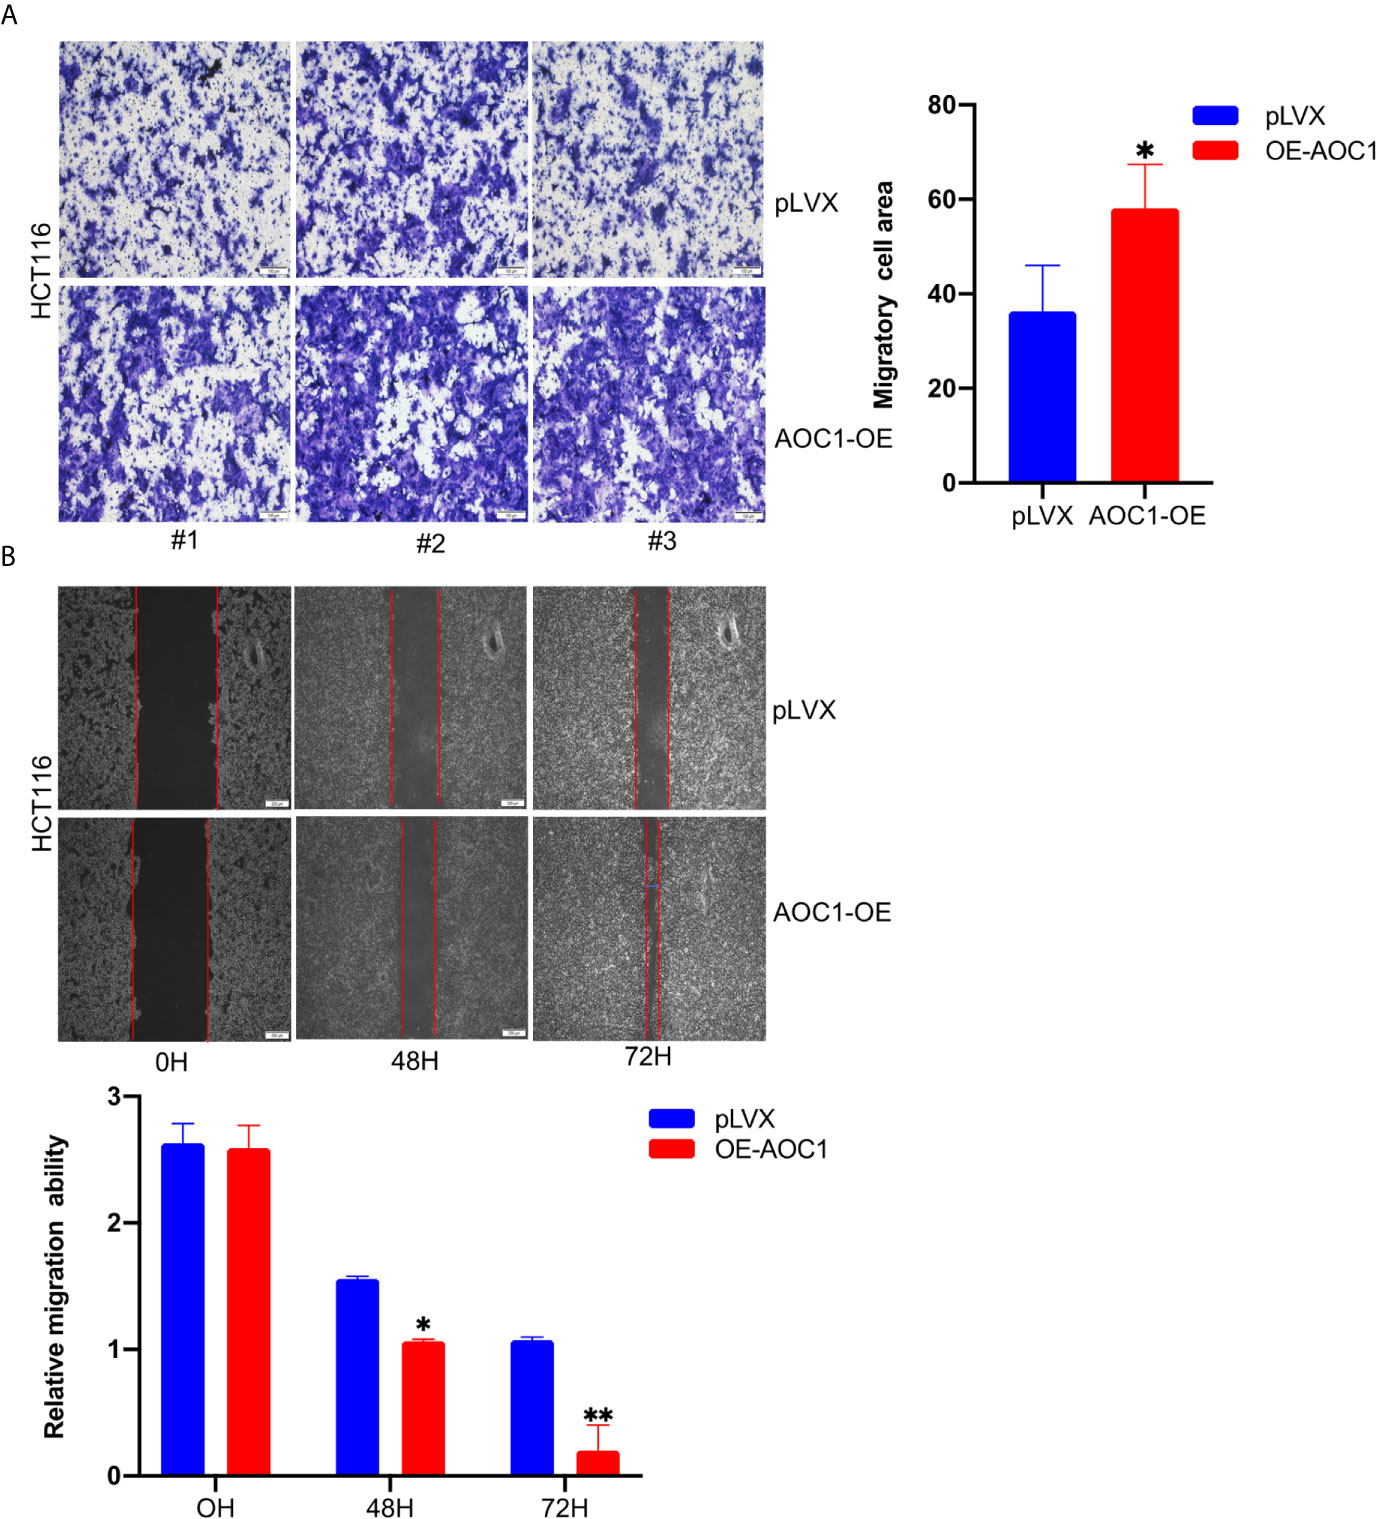
Figure 5 AOC1 overexpression promoted tumor migration ability of CRC cell in vitro. (A) The effects of AOC1 overexpression on cell migration were detected by Transwell‐migration assays in HCT116 cells (Scale bar:100um). (B) The migratory capacity of AOC1 overexpression stable cells were determined by wound‐healing assay. The degree of migration was determined at 72h after the initial scratch wound (Scale bar:200um). CRC, colorectal cancer; AOC1, Amine Oxidase Copper Containing 1 mRNA, messenger RNA; qRT‐PCR, real‐time quantitative polymerase chain reaction; *p < 0.05, **p < 0.01.
AOC1 Knockdown Inhibited the Proliferation Ability of CRC Cell In Vitro
As mentioned above, AOC1 was relatively highly expressed in the sw480 cell line. To further examine the effect of AOC1 on the proliferation ability of CRC cells, sw480 cells were selected to knockdown AOC1 expression with AOC1‐targeting shRNAs. shRNA-mediated depletion of AOC1 was confirmed by qRT-PCR and western blotting assays (Figure 6A). The CCK-8 assay indicated that AOC1 knockdown significantly inhibited CRC cell growth (Figure 6B). To further confirm this effect, a colony formation assay was also conducted (Figure 6C). These results confirmed the ability of AOC1-depletion to inhibit tumor cell proliferation.

Figure 6 AOC1 knockdown impaired the proliferation ability in CRC cells. (A) The efficiency of AOC1 knockdown were examined in sw480 cells by qRT‐PCR and western blot analysis. (B) The effect of AOC1 knockdown on cell proliferation was detected by Cell Counting Kit‐8 assay kits in sw480 cells. (C) Colony‐forming assay in AOC1‐depletion sw480 cells. CRC, colorectal cancer; AOC1, Amine Oxidase Copper Containing 1 mRNA: messenger RNA; qRT‐PCR, real‐time quantitative polymerase chain reaction; **p < 0.01, ***p < 0.001.
AOC1 Knockdown Regulated the Migration Ability of CRC Cells via Inducing EMT
We further assessed the effect of AOC1 knockdown on the migration ability of CRC cells using Transwell and wound healing assays. As shown in Figure 7A, AOC1-depletion in sw480 cells significantly inhibited migration ability compared with control cells by Transwell assay. Based on the Transwell test, an identical result was confirmed using a wound-healing assay(Figure 7B). Next, we investigated whether AOC1 affects the migration ability in CRC via inducing epithelial–mesenchymal transition (EMT) process. As shown in Figure 7C, we found that AOC1-depletion decreased the expression of N-cadherin and Vimentin by western blotting. Meanwhile, when AOC1 was silenced, the upstream transcription factors SNAIL and Slug were also significantly down-regulated.
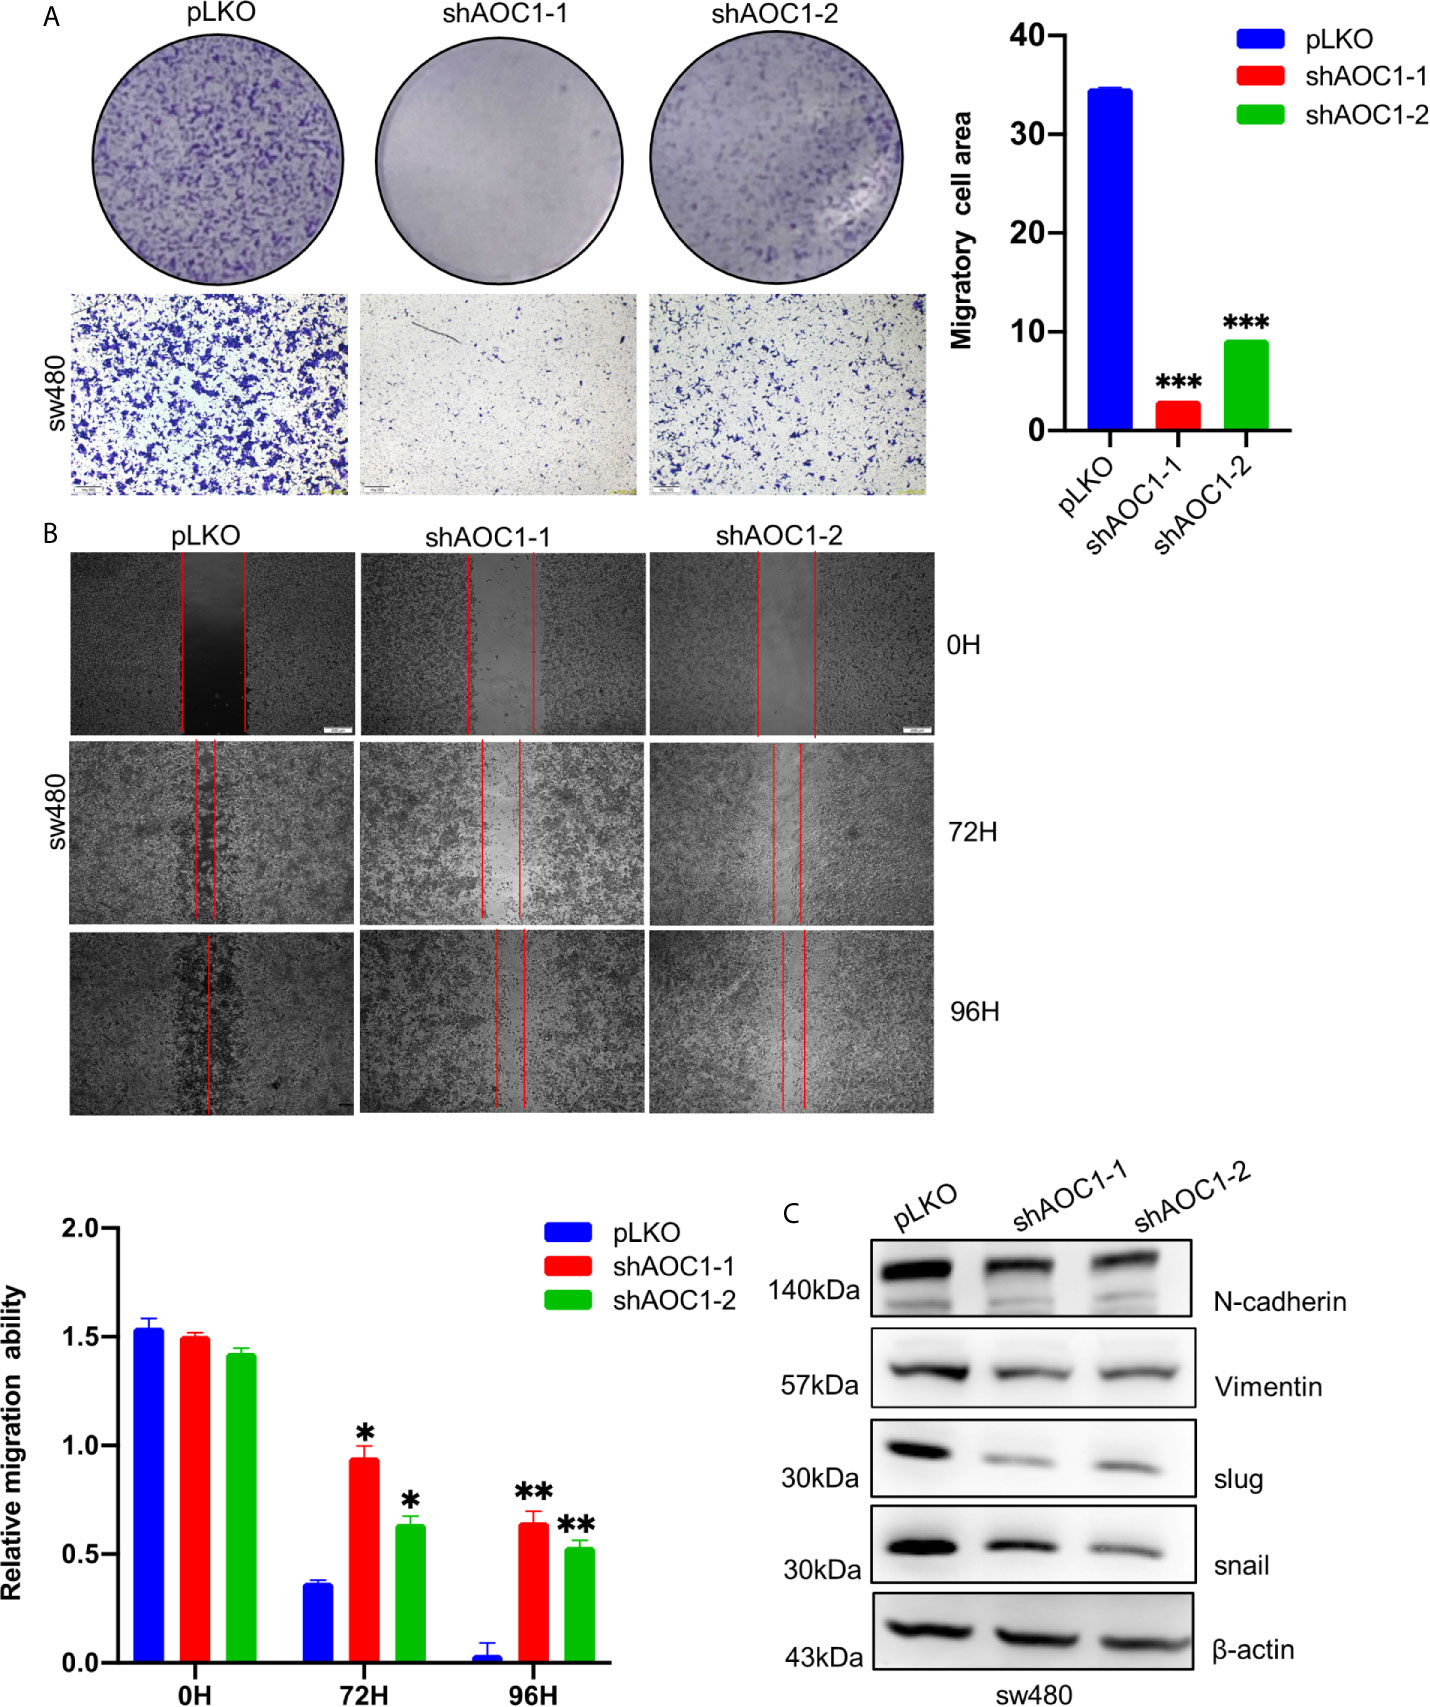
Figure 7 AOC1 knockdown regulated the migration ability of CRC cells via inducing EMT. (A) The effects of AOC1 knockdown on cell proliferation were detected by Transwell‐migration assays in sw480 cells (Scale bar:200um). (B) The migratory capacity of AOC1‐depletion or control sw480 cells were determined by wound‐healing assay. The extent of migration was determined at 72 h after the initial scratch wound (Scale bar:200um). (C) EMT related proteins: N‐cadherin, Vimentin, Slug, SNAIL were detected in AOC1 – depletion sw480 cells by western blot. AOC1, Amine Oxidase Copper Containing 1; EMT, epithelial–mesenchymal transition; *p < 0.05, **p < 0.01, ***p < 0.001.
AOC1 Knockdown Inhibited the Tumor Xenografts Growth In Vivo
To explore the biological function of AOC1-depletion in tumor growth in vivo, a xenograft assay was performed by injecting paired tumor cells into nude mice. Consistent with the result of the cell proliferation assay in vitro, AOC1-knockdown sw480 xenograft tumors were dramatically smaller than the tumors derived from control sw480 cells, suggesting that knockdown of AOC1 significantly inhibited the tumor xenografts growth (Figures 8A, B). Furthermore, Ki67 staining of the xenograft tumors showed that AOC1-knockdown decreased the number of Ki67-positive cells in the xenograft tumors (Figure 8C). In summary, these results indicated that AOC1 played an oncogenic role in promoting tumor growth.
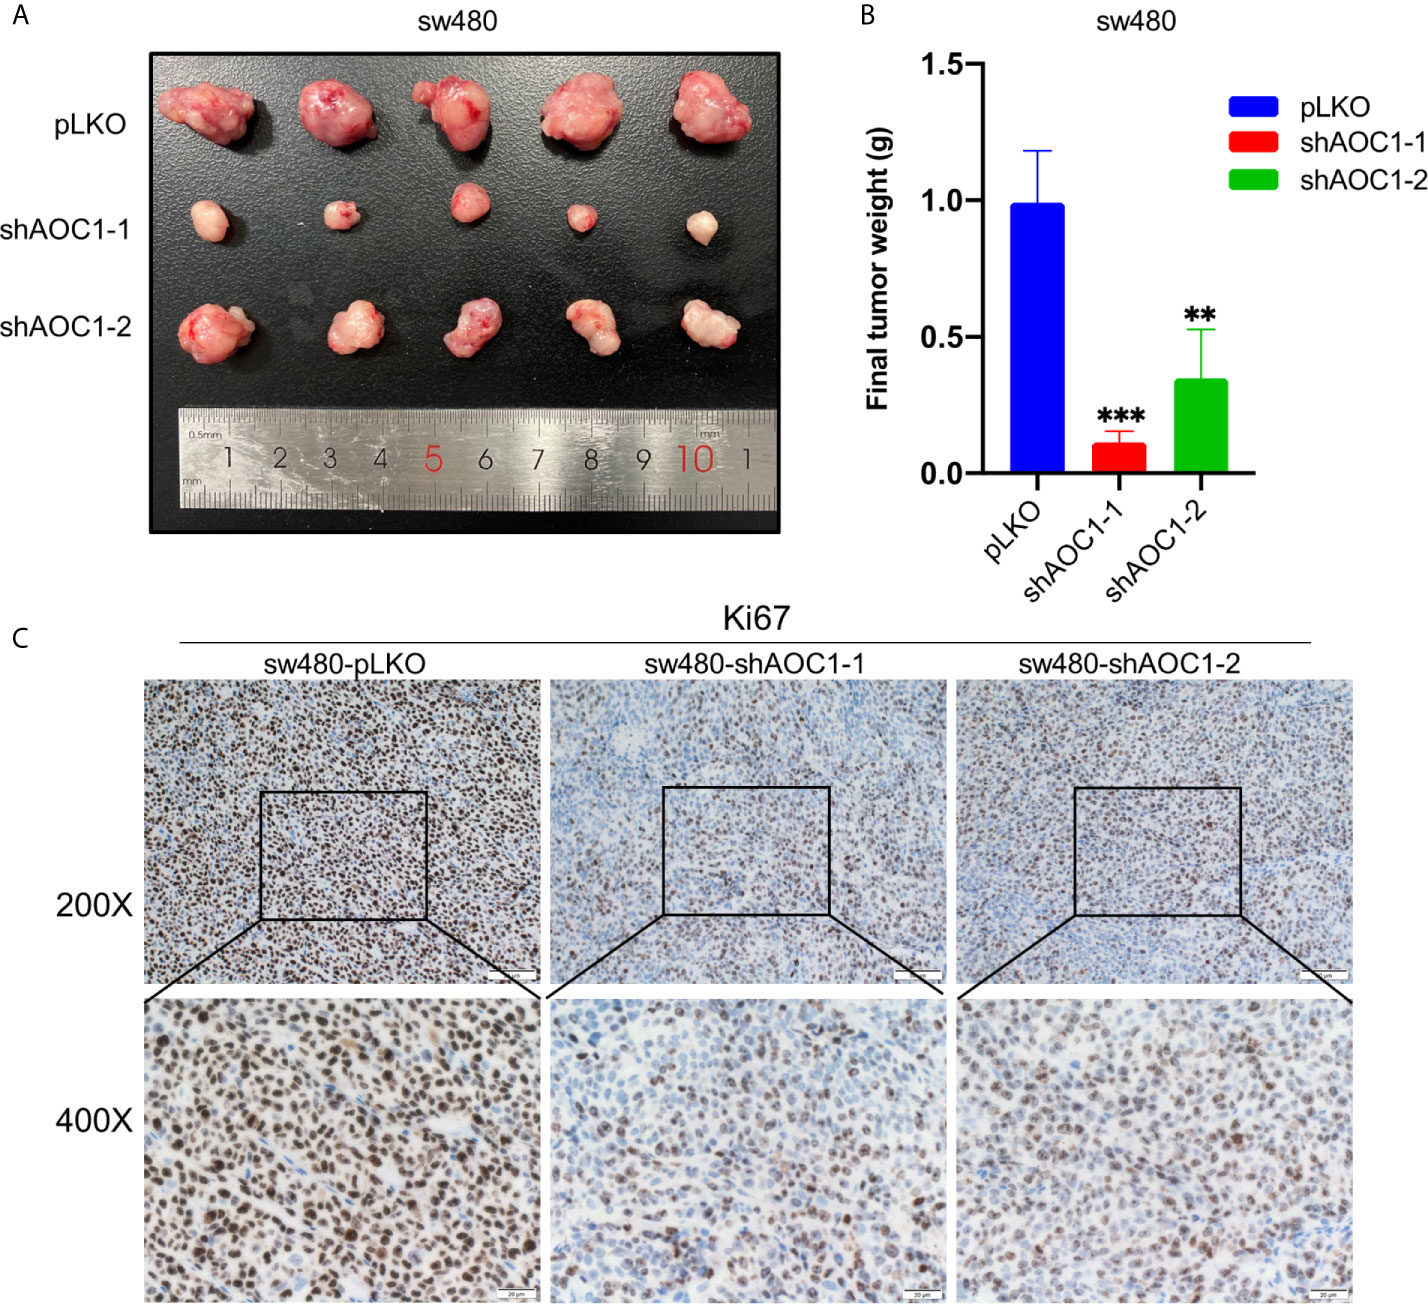
Figure 8 Knockdown of AOC1 inhibited the tumor xenografts growth in vivo. (A) Representative of AOC1-knockdown sw480 xenograft tumors (n = 5). (B) The weight of the tumors in the different groups. (C) Immunohistochemical analysis of Ki67 expression in tumors from different groups (magnification: × 200, upper panels; × 400, lower panels). AOC1, Amine Oxidase Copper Containing 1; **p < 0.01, ***p < 0.001.
Discussion
CRC has become a major global health concern with its high incidence rate and mortality rate. Interestingly, while we have witnessed a declining incidence trend over the past few decades in the elderly, the incidence rates for adolescents and young adults have been on a steady rise (15). Therefore, there is an urgent need to identify biomarkers and therapeutic targets to accurately predict the occurrence and progression of CRC.
Mammalian copper-containing amine oxidase (CAO), encoded by four genes (AOC1 1-4) and catalyzes the oxidation of primary amines to aldehydes, regulates many biological processes and is associated with many diseases including inflammation and histamine intolerance (16). AOC1 encodes a metal-binding membrane glycoprotein that oxidizes putrescine, histamine, and related compounds. Amine oxidase is mainly involved in tumor growth inhibition and progression (17). Although previous reports revealed that AOC1 affected the occurrence and development of gastric cancer (8) and Wilms tumors (8, 18), its role in colorectal cancer has not been elucidated. In this study, we first identified the biological functions of AOC1 in vitro and vivo, especially on proliferation and migration ability.
Firstly, we found that AOC1 was highly expression in tumor tissues both in COAD and READ, and AOC1 expression was statistically significant for predicting tumor clinical stage according to GEPIA database (p=0.0459). Then, we detected the expression of AOC1 in CRC tissues and found that AOC1 expression was significantly increased in human colorectal cancer tissues compared to normal tissues. In addition, the expression of AOC1 was higher in liver metastatic tissues than in primary tumor sites and significant associated with liver metastasis (p < 0.001). Furthermore, with the advent of the era of organoid culture in vitro, we found that AOC1 had higher expression in tumor organoids than in normal organoids by using this advanced technology, suggesting that it was highly located in the tumor epithelium. These results suggested that AOC1 was involved in the tumorigenesis, development, and prognosis of human colorectal cancer. We then verified whether AOC1 has the same aforementioned biological function in CRC tumor cells.
Secondly, we constructed an overexpression stable system and found that AOC1 overexpression promoted the proliferation of CRC cells by cck8 and colony formation assays, as well as migration ability by transwell and wound healing assays. Interestingly, AOC1 knockdown inhibited both the migration and proliferation ability of CRC cells. To further study the mechanism through which AOC1 affects the occurrence and development of CRC, as well as promoting tumor proliferation and metastasis, we found that AOC1 regulated the migratory ability of CRC cells by EMT pathway. EMT encompasses dynamic changes in cellular organization from epithelial to mesenchymal phenotypes, such as increased motility, which was associated with an invasive or migratory ability in CRC (19, 20). In this study, we found that the mesenchymal hallmarks N-cadherin and vimentin expression decreased in AOC1-depletion sw480 cells, moreover, the upstream transcription factors SNAIL and Slug were also decreased. Therefore, AOC1 promoted the development of CRC through epithelial-mesenchymal transition, as reported in a previous article (8). Therefore, targeting AOC1 therapy by reverse the EMT process may be an effective and potential strategy for better prognosis in patients with CRC.
These results comprehensively demonstrated that high expression of AOC1 was significantly associated with worse clinical outcomes, was an independent risk factor for poor prognosis, and promoted the aggressive phenotypes of CRC cells by inducing EMT. Moreover, AOC1 is presumed to be a novel biomarker for predicting the prognosis of patients with CRC and an effective therapeutic target in clinical practice.
However, there were some limitations encountered in the present study. The sample size was relatively small, and the design was retrospective. Loss to follow-up was inevitable, and clinical significance needs to be verified in a larger sample. In summary, we demonstrated that AOC1 promoted CRC progression and is significantly associated with poor clinical outcomes. It could be used as a new independent prognostic biomarker and a potential therapeutic target for the treatment of CRC. In the next study, We will compare the specificity and sensitivity of AOC1 and CEA to analyze whether AOC1 can replace or be used in combination with CEA to predict colorectal cancer and its prognosis clinically.
Data Availability Statement
The original contributions presented in the study are included in the article/supplementary material. Further inquiries can be directed to the corresponding authors.
Ethics Statement
The studies involving human participants were reviewed and approved by The Ethics Committee of Xinhua Hospital approved this study (No. XHEC‐D‐2021‐002). The patients/participants provided their written informed consent to participate in this study. The animal study was reviewed and approved by the Laboratory Animal Care and Welfare Committee of Xinhua Hospital (No. XHEC‐F‐2021‐057). Written informed consent was obtained from the individual(s) for the publication of any potentially identifiable images or data included in this article.
Author Contributions
PD and WX conceived and designed the study. FL performed experiments and wrote the manuscript. WO and WT analyzed the data. assisted with the statistical analysis. ZH and ZZ assisted with some experiments. WD, JF, and YZ collected the clinical data. CL supervised the work and data analyses. All authors contributed to the article and approved the submitted version.
Funding
This work was supported by the Natural Science Foundation of Shanghai (20ZR1435000), National Natural Science Foundation of China (No.82000481), and the Shanghai Sailing Program (No. 20YF1429400).
Conflict of Interest
The authors declare that the research was conducted in the absence of any commercial or financial relationships that could be construed as a potential conflict of interest.
References
1. Favoriti P, Carbone G, Greco M, Pirozzi F, Pirozzi RE, Corcione F. Worldwide Burden of Colorectal Cancer: A Review. Updates Surg (2016) 68(1):7–11. doi: 10.1007/s13304-016-0359-y
2. The Lancet O. Colorectal Cancer: A Disease of the Young? Lancet Oncol (2017) 18(4):413. doi: 10.1016/S1470-2045(17)30202-4
3. Bray F, Ferlay J, Soerjomataram I, Siegel RL, Torre LA, Jemal A. Global Cancer Statistics 2018: GLOBOCAN Estimates of Incidence and Mortality Worldwide for 36 Cancers in 185 Countries. CA Cancer J Clin (2018) 68(6):394–424. doi: 10.3322/caac.21492
4. Xu RH, Muro K, Morita S, Iwasa S, Han SW, Wang W, et al. Modified XELIRI (Capecitabine Plus Irinotecan) Versus FOLFIRI (Leucovorin, Fluorouracil, and Irinotecan), Both Either With or Without Bevacizumab, as Second-Line Therapy for Metastatic Colorectal Cancer (AXEPT): A Multicentre, Open-Label, Randomised, non-Inferiority, Phase 3 Trial. Lancet Oncol (2018) 19(5):660–71. doi: 10.1016/S1470-2045(18)30140-2
5. Lupinacci RM, Paye F, Coelho FF. Lymphatic Drainage of the Liver and its Implications in the Management of Colorectal Cancer Liver Metastases. Updates Surg (2014) 66(4):239–45. doi: 10.1007/s13304-014-0265-0
6. Mittal V. Epithelial Mesenchymal Transition in Tumor Metastasis. Annu Rev Pathol (2018) 13:395–412. doi: 10.1146/annurev-pathol-020117-043854
7. Nicholson BD, Shinkins B, Mant D. Blood Measurement of Carcinoembryonic Antigen Level for Detecting Recurrence of Colorectal Cancer. Jama (2016) 316(12):1310–1. doi: 10.1001/jama.2016.11212
8. Xu F, Xu Y, Xiong JH, Zhang JH, Wu J, Luo J, et al. Aoc1 Contributes to Tumor Progression by Promoting the AKT and EMT Pathways in Gastric Cancer. Cancer Manag Res (2020) 12:1789–98. doi: 10.2147/CMAR.S225229
9. Wheeler DA, Takebe N, Hinoue T, Hoadley KA, Cardenas MF, Hamilton AM, et al. Molecular Features of Cancers Exhibiting Exceptional Responses to Treatment. Cancer Cell (2021) 39(1):38–53.e7. doi: 10.1016/j.ccell.2020.10.015
10. Sato T, Stange DE, Ferrante M, Vries RG, Van Es JH, Van den Brink S, et al. Long-Term Expansion of Epithelial Organoids From Human Colon, Adenoma, Adenocarcinoma, and Barrett’s Epithelium. Gastroenterology (2011) 141(5):1762–72. doi: 10.1053/j.gastro.2011.07.050
11. Wu T, Wang G, Chen W, Zhu Z, Liu Y, Huang Z, et al. Co-Inhibition of BET Proteins and NF-κb as a Potential Therapy for Colorectal Cancer Through Synergistic Inhibiting MYC and FOXM1 Expressions. Cell Death Dis (2018) 9(3):315. doi: 10.1038/s41419-018-0354-y
12. Xu W, Sheng Y, Guo Y, Huang Z, Huang Y, Wen D, et al. Increased IGF2BP3 Expression Promotes the Aggressive Phenotypes of Colorectal Cancer Cells In Vitro and Vivo. J Cell Physiol (2019) 234(10):18466–79. doi: 10.1002/jcp.28483
13. Bao X, Huang Y, Xu W, Xiong G. Functions and Clinical Significance of UPF3a Expression in Human Colorectal Cancer. Cancer Manag Res (2020) 12:4271–81. doi: 10.2147/CMAR.S244486
14. Tang Z, Li C, Kang B, Gao G, Li C, Zhang Z. GEPIA: A Web Server for Cancer and Normal Gene Expression Profiling and Interactive Analyses. Nucleic Acids Res (2017) 45(W1):W98–102. doi: 10.1093/nar/gkx247
15. Connell LC, Mota JM, Braghiroli MI, Hoff PM. The Rising Incidence of Younger Patients With Colorectal Cancer: Questions About Screening, Biology, and Treatment. Curr Treat Options Oncol (2017) 18(4):23. doi: 10.1007/s11864-017-0463-3
16. Lopes De Carvalho L, Bligt-Lindén E, Ramaiah A, Johnson MS, Salminen TA. Evolution and Functional Classification of Mammalian Copper Amine Oxidases. Mol Phylogenet Evol (2019) 139:106571. doi: 10.1016/j.ympev.2019.106571
17. Toninello A, Pietrangeli P, De Marchi U, Salvi M, Mondovì B. Amine Oxidases in Apoptosis and Cancer. Biochim Biophys Acta (2006) 1765(1):1–13. doi: 10.1016/j.bbcan.2005.09.001
18. Kirschner KM, Braun JF, Jacobi CL, Rudigier LJ, Persson AB, Scholz H. Amine Oxidase Copper-Containing 1 (AOC1) is a Downstream Target Gene of the Wilms Tumor Protein, WT1, During Kidney Development. J Biol Chem (2014) 289(35):24452–62. doi: 10.1074/jbc.M114.564336
19. Brabletz T, Kalluri R, Nieto MA, Weinberg RA. EMT in Cancer. Nat Rev Cancer (2018) 18(2):128–34. doi: 10.1038/nrc.2017.118
Keywords: AOC1, colorectal cancer, proliferation, migration, organoid, EMT
Citation: Liu F, Ou W, Tang W, Huang Z, Zhu Z, Ding W, Fu J, Zhu Y, Liu C, Xu W and Du P (2021) Increased AOC1 Expression Promotes Cancer Progression in Colorectal Cancer. Front. Oncol. 11:657210. doi: 10.3389/fonc.2021.657210
Received: 22 January 2021; Accepted: 12 April 2021;
Published: 05 May 2021.
Edited by:
Zsolt Kovács, George Emil Palade University of Medicine, Pharmacy, Sciences and Technology of Târgu Mureş, RomaniaReviewed by:
Hao Zhuang, Henan Provincial Cancer Hospital, ChinaZubing Mei, Shanghai University of Traditional Chinese Medicine, China
Copyright © 2021 Liu, Ou, Tang, Huang, Zhu, Ding, Fu, Zhu, Liu, Xu and Du. This is an open-access article distributed under the terms of the Creative Commons Attribution License (CC BY). The use, distribution or reproduction in other forums is permitted, provided the original author(s) and the copyright owner(s) are credited and that the original publication in this journal is cited, in accordance with accepted academic practice. No use, distribution or reproduction is permitted which does not comply with these terms.
*Correspondence: Peng Du, dupeng@xinhuamed.com.cn; Weimin Xu, xwmgodmin@163.com
†These authors have contributed equally to this work