Corrigendum: Loss of TARBP2 Drives the Progression of Hepatocellular Carcinoma via miR-145-SERPINE1 Axis
 Li-Man Li1†
 Chang Chen2†Ruo-Xi Ran1†
 Jing-Tao Huang1,3
 Hui-Lung Sun4Chang Zeng2
 Zhou Zhang2
 Wei Zhang2,5*‡
 Song-Mei Liu1,6*‡
- 1Department of Clinical Laboratory, Center for Gene Diagnosis, and Program of Clinical Laboratory Medicine, Zhongnan Hospital of Wuhan University, Wuhan, China
- 2Department of Preventive Medicine, Northwestern University Feinberg School of Medicine, Chicago, IL, United States
- 3Department of Clinical Laboratory, Renmin Hospital, Wuhan University, Wuhan, China
- 4Department of Chemistry and Institute for Biophysical Dynamics, Howard Hughes Medical Institute, The University of Chicago, Chicago, IL, United States
- 5Institute of Precision Medicine, Jining Medical University, Jining, China
- 6Hubei Province Key Laboratory of Allergy and Immunology, Wuhan, China
The clinical outcomes of hepatocellular carcinoma (HCC) remain dismal. Elucidating the molecular mechanisms for the progression of aggressive HCC holds the promise for developing novel intervention strategies. The transactivation response element RNA-binding protein (TRBP/TARBP2), a key component of microRNA (miRNA) processing and maturation machinery has been shown to play conflicting roles in tumor development and progression. We sought to investigate the expression of TARBP2 in HCC using well-characterized HCC cell lines, patient-derived tissues and blood samples. Additionally, the potential prognostic and diagnostic value of TARBP2 in HCC were analyzed using Kaplan-Meier plots and ROC curve. Cell counting kit‐8 (CCK‐8), wound healing and transwell assays examined the ability of TARBP2 to induce cell proliferation, migration, and invasion in HCC cell lines. RNA sequencing was applied to identify the downstream elements of TARBP2. The interaction of potential targets of TARBP2, miR‐145 and serpin family E member 1 (SERPINE1), was assessed using luciferase reporter assay. TARBP2 expression was down-regulated in HCC cell lines relative to normal hepatocyte cells, with a similar pattern further confirmed in tissue and blood samples. Notably, the loss of TARBP2 was demonstrated to promote proliferation, migration, and invasion in HCC cell lines. Interestingly, the reduction of TARBP2 was shown to result in the upregulation of SERPINE1, also known as plasminogen activator inhibitor (PAI-1), which is a vital gene of the HIF-1 signaling pathway. Knockdown of SERPINE1 rescued the TARBP2-lost phenotype. Moreover, TARBP2 depletion induced the upregulation of SERPINE1 through reducing the processing of miR-145, which directly targets SERPINE1. Finally, overexpression of miR-145 repressed SERPINE1 and rescued the functions in sh-TARBP2 HCC cells. Our findings underscore a linear TARBP2-miR-145-SERPINE1 pathway that drives HCC progression, with the potential as a novel intervention target for aggressive HCC.
Introduction
Liver cancer is predicted to be the sixth most common cancer and the fourth leading cause of cancer deaths worldwide, with about 841,000 new cases and 782,000 deaths annually, according to the 2018 Global Cancer Statistics (1). Hepatocellular carcinoma (HCC) comprises 75%-85% of all liver cancer cases (1). HCC is often diagnosed at advanced stages and is highly resistant to conventional chemotherapy (2). Although advances in cancer care and treatment have improved patient survival, the clinical outcomes of HCC remain dismal, with a less than 50% five-year survival rate after diagnosis (3). The development of HCC is driven by various risk factors, including alcohol abuse, metabolic syndromes, hepatitis B virus (HBV) (4, 5), and hepatitis C virus infection. Epigenetic regulators, including microRNAs (miRNAs) (2), DNA methylation, hydroxymethylation and N6-methyladenosine (m6A), have also implicated in the development of HCC (5–9). Recent technological breakthroughs have also enabled exploiting epigenetic modifications as noninvasive biomarkers for early detection of HCC, showing potential to outperform or supplement α-fetoprotein (AFP) (7, 8, 10). Besides detection of HCC patients at early stage, enhancing our understanding of the molecular mechanism underlying the progression of aggressive HCC could lead to novel intervention strategies for improving the clinical outcomes of HCC.
The multidomain human TAR element binding protein (TRBP/TARBP2), containing three double-stranded RNA-binding domains, is a component of the Dicer-containing complex. Dicer-TRBP processes precursor miRNAs to generate mature miRNAs (11). TRBP also mediates miRNA isoform processing to generate related miRNAs of altered targeting specificity and differing lengths (12). As a Dicer partner protein, TRBP maintains miRNA production and subsequent gene silencing (13). Though TARBP2 has been involved in critical biological processes and pathogenesis, its expression patterns and functions as a tumor suppressor or promoter have been conflicting in different cancers, such as prostate cancer, gastrointestinal cancer, breast cancer, diffuse large B-cell lymphoma, and cutaneous malignant melanoma (14). In particular, the roles of TARBP2 in HCC progression and its regulating pathway have not been established.
Aberrant miRNA expression could drive HCC development and global miRNA downregulation at a later stage could promote metastasis (2). Previous report has suggested that depletion of TARBP2 resulted in reduction of a number of miRNAs including miR-145 (15). Overexpression of miR-145 was also found to inhibit the proliferation of HepG2 cells (16). As a target gene of miR-145, serpin family E member 1 (SERPINE1) (17) has shown increasing prominence in the development from chronic hepatitis to HCC. Besides, up-regulation of SERPINE1 promoted HCC progression (18, 19). Thus, our hypothesis is that TARBP2 modulates HCC development via regulation of miRNA biogenesis. We collected patient-derived blood and tissue samples to investigate whether TARBP2 was dysregulated in HCC patients and correlated with prognosis. TARBP2 loss/gain-of-function experiments in well-characterized HCC cell lines were then performed to confirm the observations found in clinical samples. We further utilized RNA-sequencing (RNA-Seq) to identify the potential downstream gene players and their functional relevance. Our findings provided novel insights into the link between TARBP2 loss-of-function and HCC cells proliferation, migration, invasion and revealed a linear TARBP2-miR-145-SERPINE1 axis important to HCC progression.
Materials and Methods
Study Population and Clinical Parameters
We collected 52 pairs of HCC tumor and adjacent normal tissue samples, and 156 peripheral blood samples, including newly diagnosed HCC patients (N = 86) and healthy controls (N = 70) from Zhongnan Hospital, Wuhan University between May 2016 and February 2019. All blood samples were collected at the time of diagnosis, before surgery or other radio-/chemotherapy. HCC diagnosis was confirmed by pathologists according to the Guidelines for Diagnosis and Treatment of Primary Liver Cancer in China (2017 Edition). Tumor stages were defined according to the Barcelona Clinic Liver Cancer (BCLC) staging system (20). Healthy controls were recruited from those individuals who underwent regular physical examinations at Zhongnan Hospital, and individuals with severe chronic diseases (e.g. diabetes and hypertension) and/or a family history of cancer through questionnaires were excluded. Overall survival (OS) was defined as the interval between surgery and either death or the last observation taken. Serum biochemical parameters including alanine aminotransferase (ALT), aspartate aminotransferase (AST), glucose, blood urea nitrogen (BUN), creatinine (CREA), uric acid, total cholesterol (TC), triglyceride (TG), high-density lipoprotein cholesterol (HDL-C), low-density lipoprotein cholesterol (LDL-C) were measured using an automatic chemistry analyzer (AU5831, Beckman Coulter, Brea, CA, USA) with commercial kits. Serum tumor biomarkers including AFP and carcinoembryonic antigen (CEA) were measured using a chemiluminescence immunoanalyzer (i2000, Abbott Laboratories, Chicago, IL, USA) according to conventional protocols. Informed consent was obtained from each participant. This study was approved by the Ethics Committee of Zhongnan Hospital, Wuhan University (Approval Number: 2017058).
Cell Culture
Human liver cell line HL7702 (L02), HCC cell lines (Hep3B, SNU387, MHCC97H and HepG2), and HEK-293T cells (Table S1) were purchased from Shanghai Institutes of Biological Sciences, Chinese Academy of Sciences (Shanghai, China). All cells were cultured in DMEM or MEM (HyClone, Fisher Scientific, Pittsburgh, PA, USA) with 10% fetal bovine serum (FBS) (Biological Industries, Beit Haemek, Israel) in 5% CO2 at 37°C according to instructions. The MHCC97H cells with high metastatic potential and the well-known HepG2 cells were used to illucidate tumor biological functions. Specifically, each experimental group and the corresponding control group were performed in the same batch.
RNA Extraction and qRT-PCR
Total RNA was extracted from tissues, white blood cells or cultured cells using the TRIzol reagent (Invitrogen, Life Technologies, Carlsbad, CA, USA). The cDNA was synthesized using the Reverse-Transcription Ace qPCR RT Master Mix with gDNA Remover Kit (Takara, Kyoto, Japan). The mRNA expression was evaluated in triplicates using qRT-PCR. The primers are listed in Table S2.
Selection of Potential miRNAs
The miRTarBase (21) and TargetScanHuman (22) were used to predict potential miRNA targets. We selected final targets according to the prediction results from these public databases and previous reports (23–27).
Measurement of miRNA Transcription
Reverse transcriptions were performed using the All-in-One™ miRNA First-Strand cDNA Synthesis Kit (GeneCopoeia, Rockville, MD, USA). The All-in-One™ miRNA qRT-PCR Detection Kit (GeneCopoeia, Rockville, MD, USA) was used to quantify miR-30b-5p (HmiRQP0393), miR-30c-5p (HmiRQP0396), miR-192-5p (HmiRQP0274) and miR-145-5p (HmiRQP0192) in tissues and cell lines. The hsnoRNA-U48 (HmiRQP9021) was served as the control.
Transfection Assay
Lentiviruses containing TARBP2 overexpression (oe)/short hairpin (sh) RNAs/controls (Ctrl) were produced in HEK-293T cells with packaging vectors pCMV delta R8.2 and pCMV-VSV-G (from Dr. Chuan He’s Laboratory, Department of Chemistry, The University of Chicago, IL, USA). The medium supernatants were collected and concentrated by PEG-it Virus Precipitation Solution (SBI, System Biosciences, Palo Alto, CA, USA). The obtained viruses were then used to infect MHCC97H and HepG2 cells after 48 hr, oe/sh-TARBP2 or oe/sh-Ctrl stable cell lines were selected by 2 µg/mL puromycin. Transient transfections of plasmids (SERPINE1 shRNA and scramble control) (Genechem, Shanghai, China) were performed with Lipofectamine 3000 (Invitrogen, Life Technologies, Carlsbad, CA, USA). Approximately 2.5×10⁶ cells were transfected with 2.5 μg of plasmid using 3.75 μL of Lipofectamine 3000. The miR-145 mimic and its negative control (NC) used for transfection were purchased from Ribobio (Guangzhou, China). Transfections were performed using the riboFECT™ CP Kit (Ribobio, Guangzhou, China).
Western Blot Analysis
Cultured cells were lysed by RIPA buffer (Beyotime, Shanghai, China) containing protease inhibitor (Roche, Eugene, OR, USA). Protein concentrations were determined by BCA Protein Assay Kit (Beyotime, Shanghai, China). Extracted proteins were separated by 10% SDS-PAGE and transferred to polyvinylidene fluoride (PVDF) membranes (Millipore, Billerica, MA, USA). The membranes were blocked in 5% non-fat milk followed by overnight incubation with primary antibodies including rabbit anti-TRBP (15753-1-AP; ProteinTech, Wuhan, China), rabbit anti-PAI-1 (SERPINE1) (13801-1-AP; ProteinTech, Wuhan, China) and rabbit anti-alpha TUBULIN (11224-1-AP; ProteinTech, Wuhan, China). After washing for three times, the membranes were incubated with the secondary antibody. The signals were detected by the Odyssey® CLx IRImaging System (LI-COR Biosciences, Lincoln, NE, USA).
Cell Proliferation Assay
Transfected cells were seeded in 96-well plates (MHCC97H: 4,000 cells/well; HepG2: 3,000 cells/well). After incubation for 0, 1, 2, 3, 4 and 5 days, respectively, 10 μL of Cell Counting Kit-8 (Dojindo, Kumamoto, Japan) reagent was added to each well and incubated for 1.5 hr at 37°C. The absorbance was measured at 450 nm with a microplate reader (PerkinElmer, Fremont, CA, USA).
Migration and Invasion Assays
Invasion assay was carried out using 24-well plates with the Matrigel coating (BD, Bioscience, Franklin Lakes, NJ, USA). The migration assay was carried out without the Matrigel coating. Transfected cells (MHCC97H: 2×10⁴ cells/chamber; HepG2: 8×10⁴ cells/chamber) were seeded in the upper chamber of a transwell (BD, Bioscience, Franklin Lakes, NJ, USA) containing serum-free medium. DMEM or MEM medium containing 10% FBS was placed in the lower chamber. After incubation for 24 hr (MHCC97H) or 48 hr (HepG2), migrated or invaded cells were fixed with 4% paraformaldehyde for 15 min and stained with 0.1% crystal violet for 20 min. Cells were imaged with a fluorescence microscope (Olympus, CKX41, Tokyo, Japan).
Colony Formation Assay
Transfected cells (1,000 cells/well) were seeded into 6-well plates (Corning Costar, Corning, NY, USA) and cultured in DMEM or MEM medium containing 10% FBS for approximately 2 weeks. The colonies were fixed with 4% paraformaldehyde for 15 min and stained with 0.1% crystal violet for 20 min.
Wound Healing Assay
Transfected cells were seeded in 6-well plates and serum-starved for 48 hr. The wound was scratched by a 200 μL-yellow-tip and the pictures were taken at 0 hr and 48 hr. The closed areas were measured by the Image J software (National Institutes of Health, Bethesda, MD, USA) and the wound healing rate (WHR) was calculated as follow: WHR (%) = (Closed area)/(Initial area) ×100%.
Cell Cycle Assay
Transfected cells were harvested and washed with pre-cold PBS. Then 10 μL permeabilization solution and 1 mL 1× DNA staining solution containing propidium iodide (Multi Sciences, Hangzhou, China) were used to resuspend cell pellets. Cell resuspensions were incubated in the dark at room temperature for 30 min. The cell cycle distributions of stained cells were assessed by flow cytometry (Beckman Coulter, Brea, CA, USA).
RNA Sequencing and Data Processing
The concentration and purity of RNA for oe/sh-TARBP2 HepG2 cells were detected before the RNA-Seq. The paired-end (150 bp) RNA-Seq was performed by GENEWIZ (Suzhou, China) using the Illumina HiSeq 4000 Sequencer (Illumina, Inc., USA) according to Illumina’s instructions. Raw sequencing reads were trimmed by FASTX-Toolkit (v0.0.14) to remove the adaptor sequences. The reads were aligned to Ensembl human genome reference hg19 using STAR (v2.7.3) (28) with end-to-end alignment mode. Alignments and counting of gene bodies were conducted by featureCounts from R package Rsubread (v1.30.9) without strand information. The quantile normalization among all genes, and the fold change calculation were performed by Bioconductor tools within the R Statistical Package (v3.6.1) (29). Differential genes between cell lines were evaluated based on fold change at 70% cut-off. The NIH/DAVID tool was used to explore functional relevance of differential genes for Gene Ontology biological processes and canonical pathways (30, 31). The raw and processed RNA-Seq data have been uploaded to the NCBI Gene Expression Omnibus database (Accession Number: GSE143551).
Luciferase Reporter Assay
The 3’-UTR (untranslated region) fragment of the wild-type SERPINE1 containing the putative miR-145 binding site and the mutant SERPINE1 sequence were cloned into pmirGLO luciferase plasmid respectively (Promega, Madison, WI, USA). HepG2 cells were transfected with different reporter vectors (pmirGLO-SERPINE1-wild-type and pmirGLO-SERPINE1-mutant) and co-transfected with the negative control (NC) or miR-145 mimic. Luciferase reporter assay was performed 48 hr after transfection using the Dual-Luciferase Kit (Promega, Madison, WI, USA).
Statistical Analysis
All data was computed using the SPSS package (v20.0, SPSS, Chicago, IL, USA). The Student’s t-test or Mann-Whitney test, paired t-test, or Fisher’s exact test were applied to compare the difference between groups. The Receiver Operating Characteristic (ROC) curve was used for the evaluation of diagnostic performance. Pearson correlation or Spearman correlation was used for the correlation analysis. The Kaplan-Meier (KM) test was performed to estimate the OS of HCC patients. The p-value < 0.05 was considered as statistically significant.
Results
Downregulation of TARBP2 in HCC Is Associated With Poor Prognosis
Comparison of the expression of TARBP2 in a panel of liver cell lines showed that TARBP2 was consistently downregulated across HCC cell lines compared with the normal liver L02 cells (Figure 1A). Downregulation of TARBP2 was confirmed in 52 pairs of patient-derived HCC tumors and adjacent tissues (Figure 1B; paired t-test p-value = 0.0045). For the tissue samples from patients with clinical outcomes, the KM analysis indicated that HCC patients with a relatively lower expression of TARBP2 had a worse three-year OS (Figure 1C; log rank p-value = 0.005). The immunohistochemistry (IHC) assay showed that TARBP2 protein was higher in adjacent tissues relative to tumors (Figure 1D; paired t-test p-value = 0.004). Besides, the protein level of TARBP2 was also analyzed based on Human Protein Atlas database (Figure S1). In addition, the expression of TARBP2 in patient-derived white blood cells (N = 86) was significantly lower relative to healthy controls (N = 70) (Figure 1E); Mann-Whitney test p-value = 1.46×10⁻¹¹. Collectively, these data demonstrated that TARBP2 and its protein was decreased in tumor tissues and blood from HCC patients or in HCC cell lines, consistent with previous observations (32).
FIGURE 1
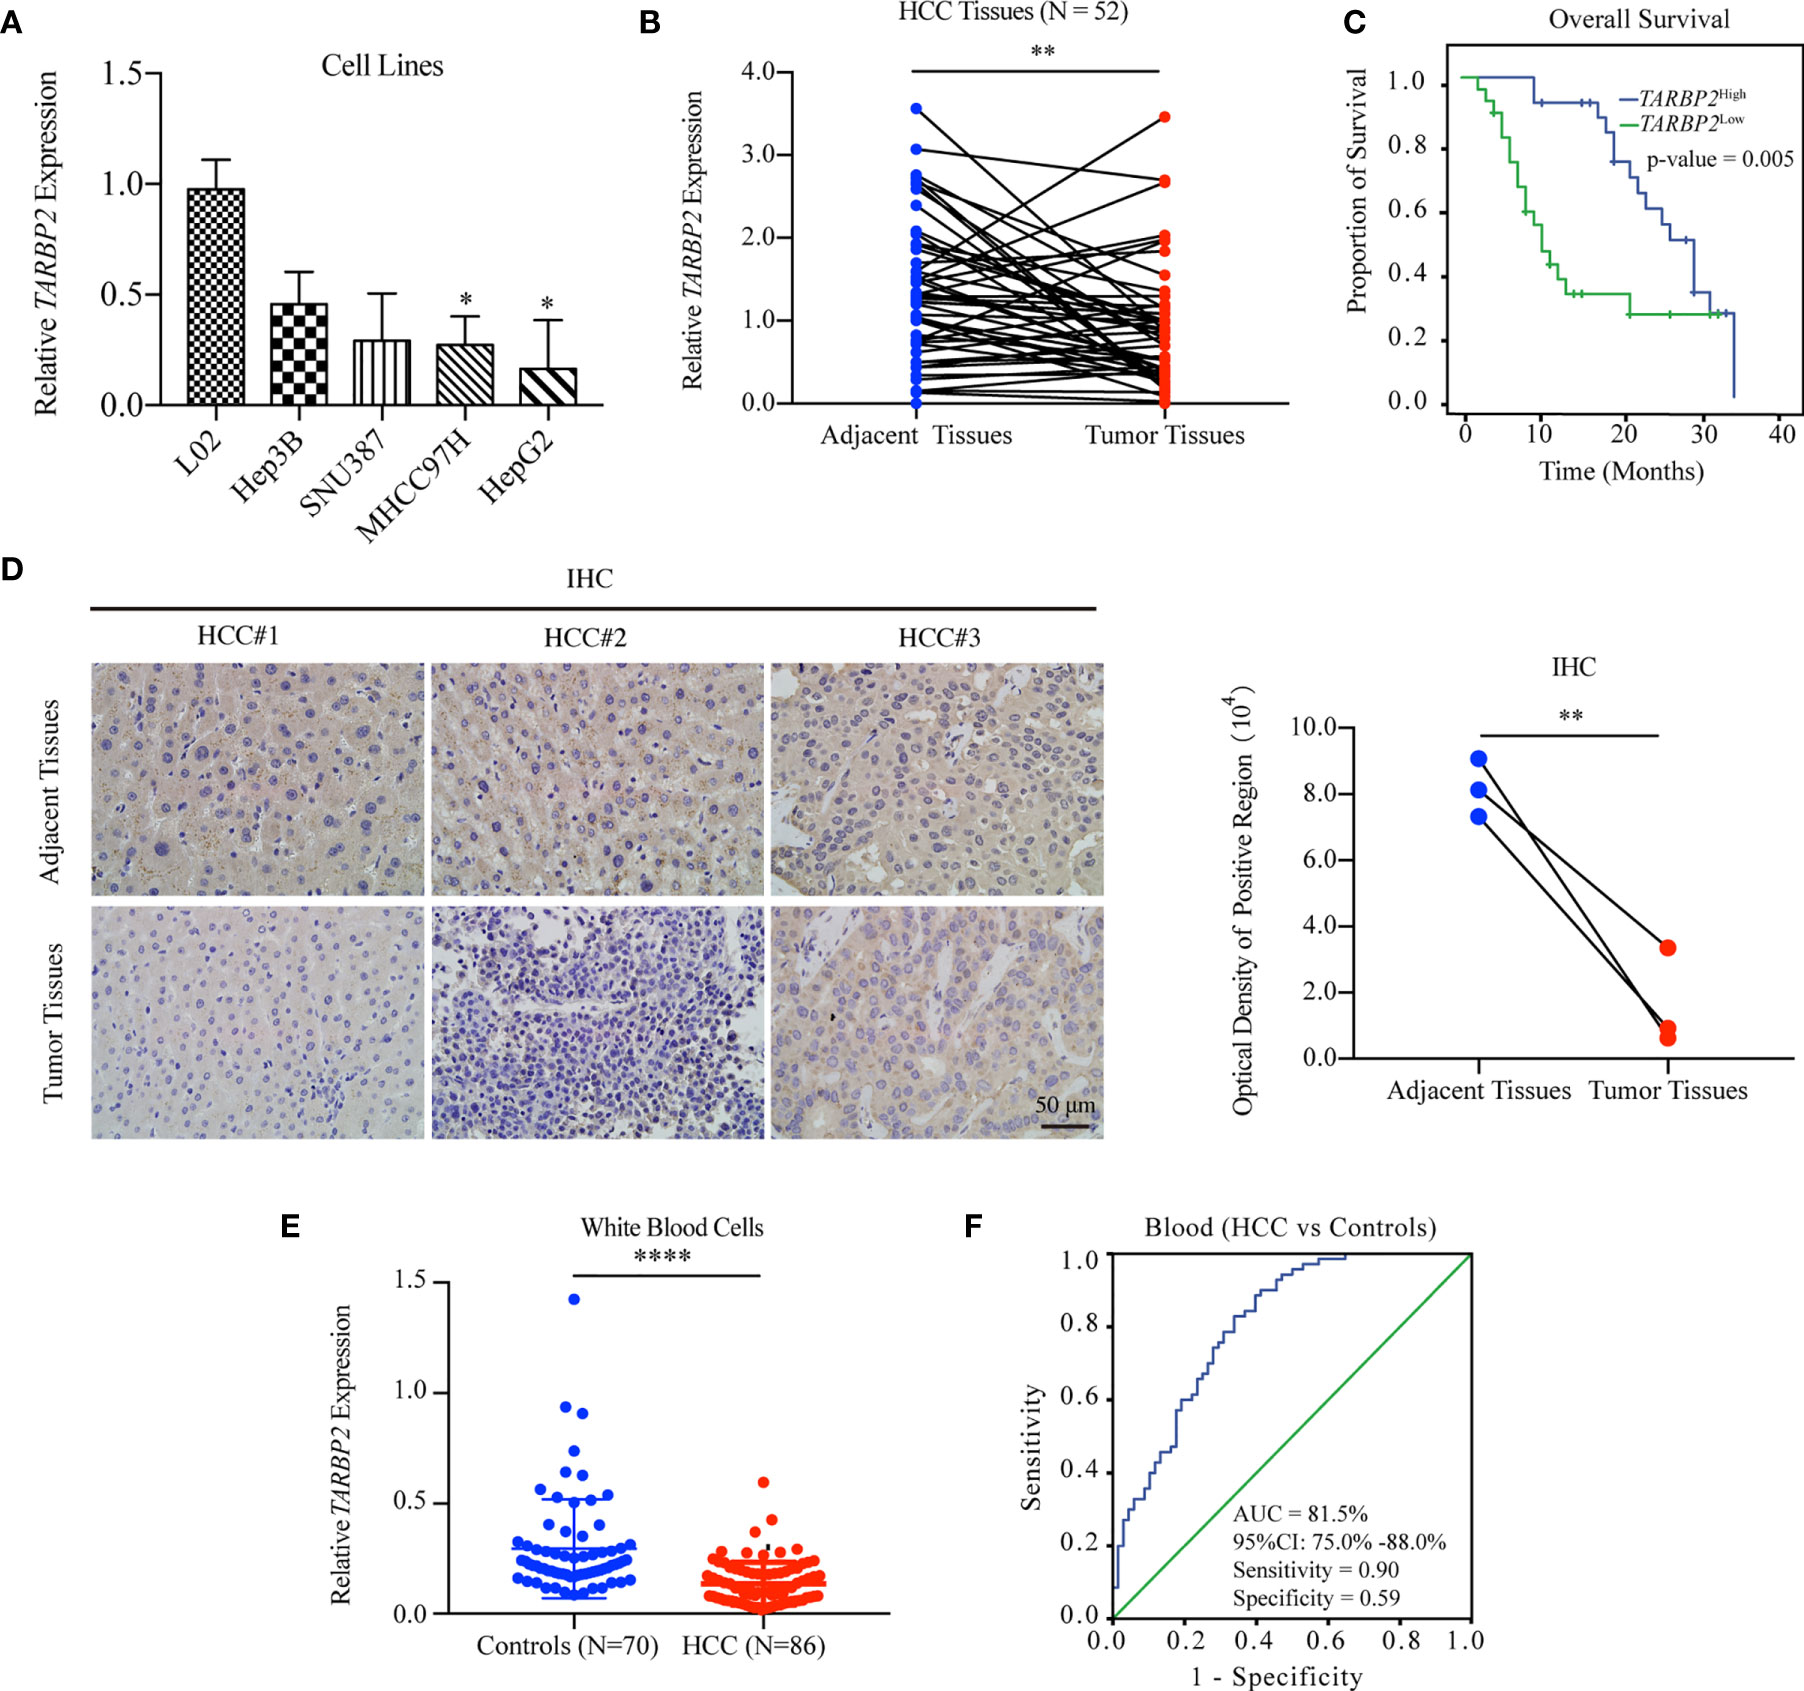
Figure 1 Downregulation of TARBP2 in HCC is associated with poor prognosis. (A) The mRNA expression of TARBP2 was consistently downregulated across HCC cell lines compared with the normal liver L02 cells. (B) Downregulation of TARBP2 mRNA was confirmed in 52 pairs of patient-derived HCC tumors and adjacent tissues. (C) HCC patients with a relatively lower mRNA expression of TARBP2 had a worse three-year OS. (D) The protein expression of TARBP2 was higher in adjacent tissues relative to tumors. (E) The mRNA expression of TARBP2 in patient-derived blood samples was lower relative to healthy controls. (F) TARBP2 mRNA expression in the blood distinguished HCC patients from healthy controls. OS, overall survival; IHC, immunohistochemistry; AUC, area under curve; CI, confidence interval; *p-value < 0.05; **p-value < 0.01; ****p-value < 0.0001.
Specifically, TARBP2 in white blood cells showed a good capacity for distinguishing HCC patients from healthy controls (area under curve [AUC] = 81.5%; 95% confidence interval [CI], 75.0%-88.0%) with a sensitivity of 0.90 and a specificity of 0.59 at the cut-off of 0.14 (Figure 1F). Additionally, TARBP2 expression in tumor tissues showed a trend of association with the BCLC stage (Chi-square test p-value = 0.029) and portal vein tumor thrombus (PVTT) (Chi-square test p-value = 0.036) (Table S3). Next, we found that TARBP2 expression was lower in patients with BCLC stages B/C relative to patients with BCLC stage A (Figure S2A). In contrast, there was no difference between patients with and without PVTT (Figure S2B).
Expression of TARBP2 Reflects Clinical Parameters in Patient-Derived Serum
We collected the peripheral blood samples from 86 HCC patients and 70 healthy controls and compared their differences of clinical characteristics in serum. In HCC patients, ALT, AST, glucose, TC, AFP and CEA levels in serum were significantly higher than healthy controls (p-values < 0.05). In contrast, HDL-C was lower compared with healthy controls (p-value = 3.00×10⁻⁷) (Table S4). In addition, the expression of TARBP2 was negatively associated with glucose (Pearson r = -0.30, p-value = 0.010) and positively associated with HDL-C (Pearson r = 0.27, p-value = 0.040) (Figures S3A–D).
TARBP2 Affects Proliferation, Migration, Invasion, and Cell Cycle in HCC Cell Lines
To explore TARBP2 loss/gain-of-function in HCC, we established stable oe/sh-TARBP2 MHCC97H and HepG2 cell lines. The qRT-PCR and western blot verified the significant changes of mRNA and protein expression of TARBP2 compared with oe/sh-Ctrl after transfection (Figures 2A, B). Based on colony formation assay and CCK-8 assay, the results indicated that overexpression of TARBP2 could inhibit HCC cell proliferation, whereas TARBP2 knockdown could promote proliferation (Figures 2C, D). TARBP2 overexpression was also found to suppress the migration and invasion of the HCC cells compared with oe-Ctrl group. In contrast, TARBP2 knockdown showed an opposite effect according to the results of wound healing and transwell assays (Figures 3A, B). The results of flow cytometry demonstrated that TARBP2 overexpression increased the proportion of G1 phase, while TARBP2 knockdown had a reverse effect on cell cycle (Figure S4).
FIGURE 2
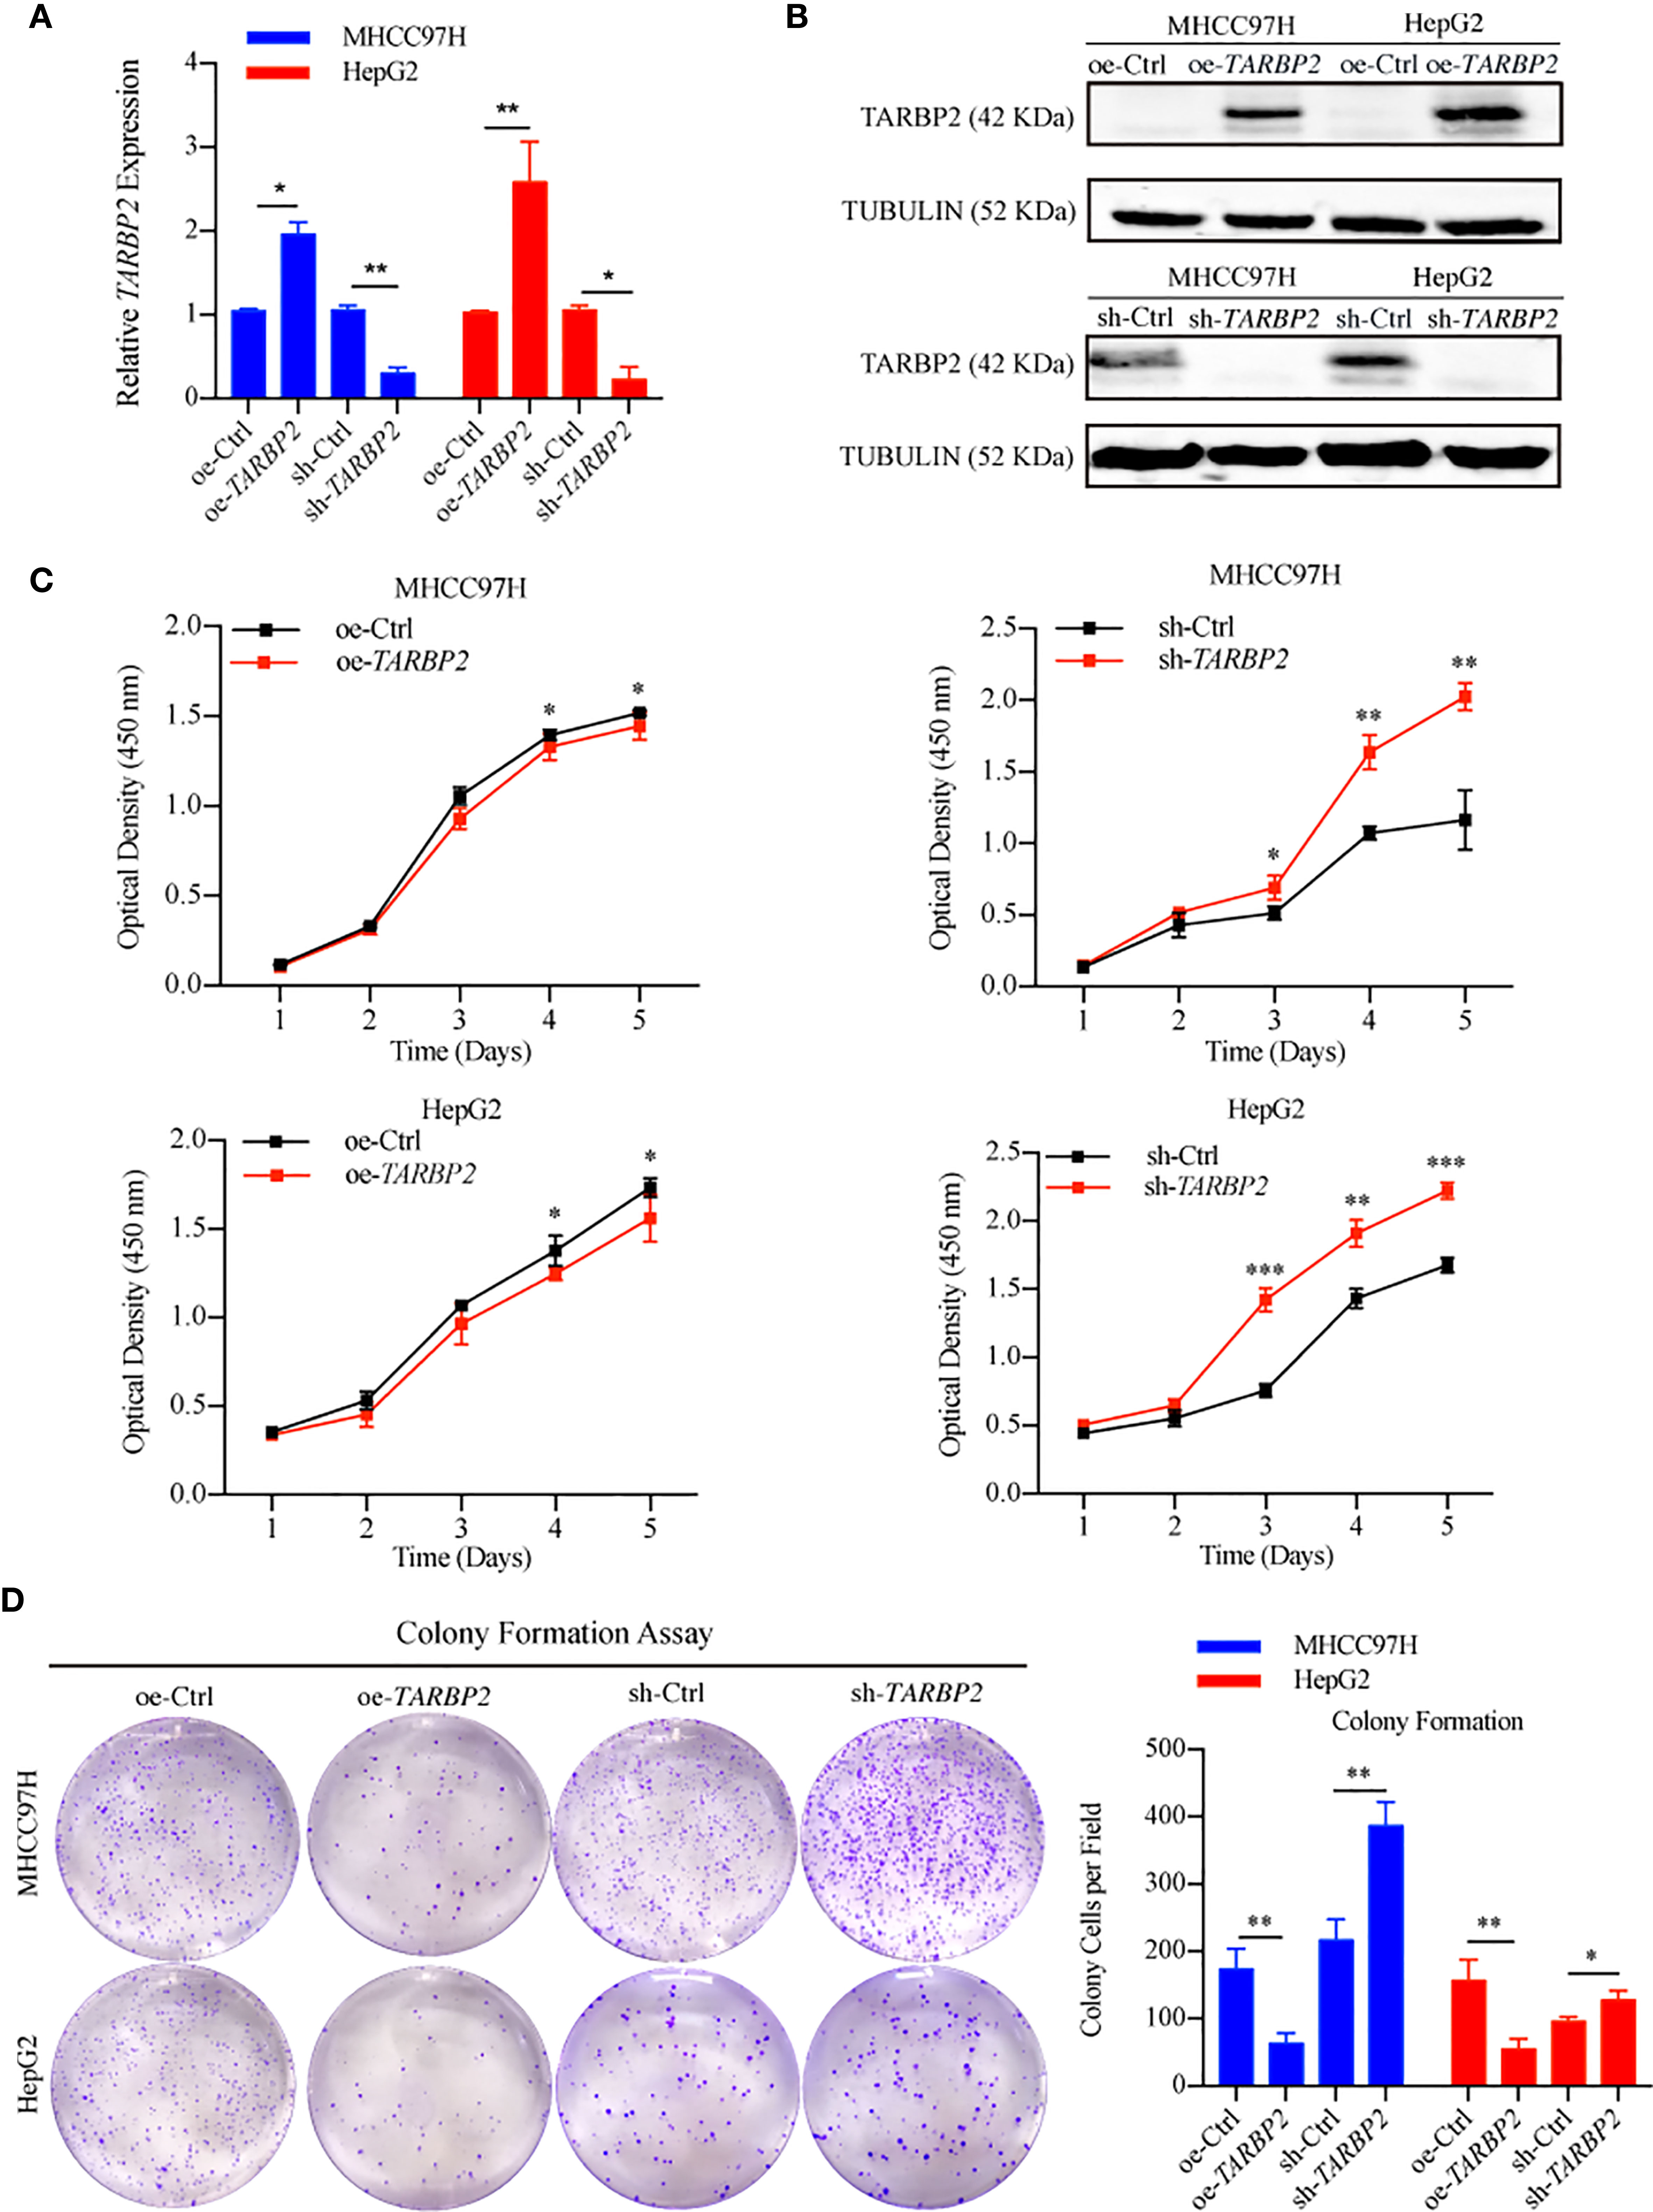
Figure 2 TARBP2 affects proliferation of HCC cells. (A, B) The changes of mRNA and protein expression of TARBP2 compared with controls in HCC cell lines after transfection. (C, D) oe-TARBP2 HCC cells could inhibit proliferation, whereas sh-TARBP2 HCC cells could promote proliferation. *p-value < 0.05; **p-value < 0.01; ***p-value <0.001.
FIGURE 3
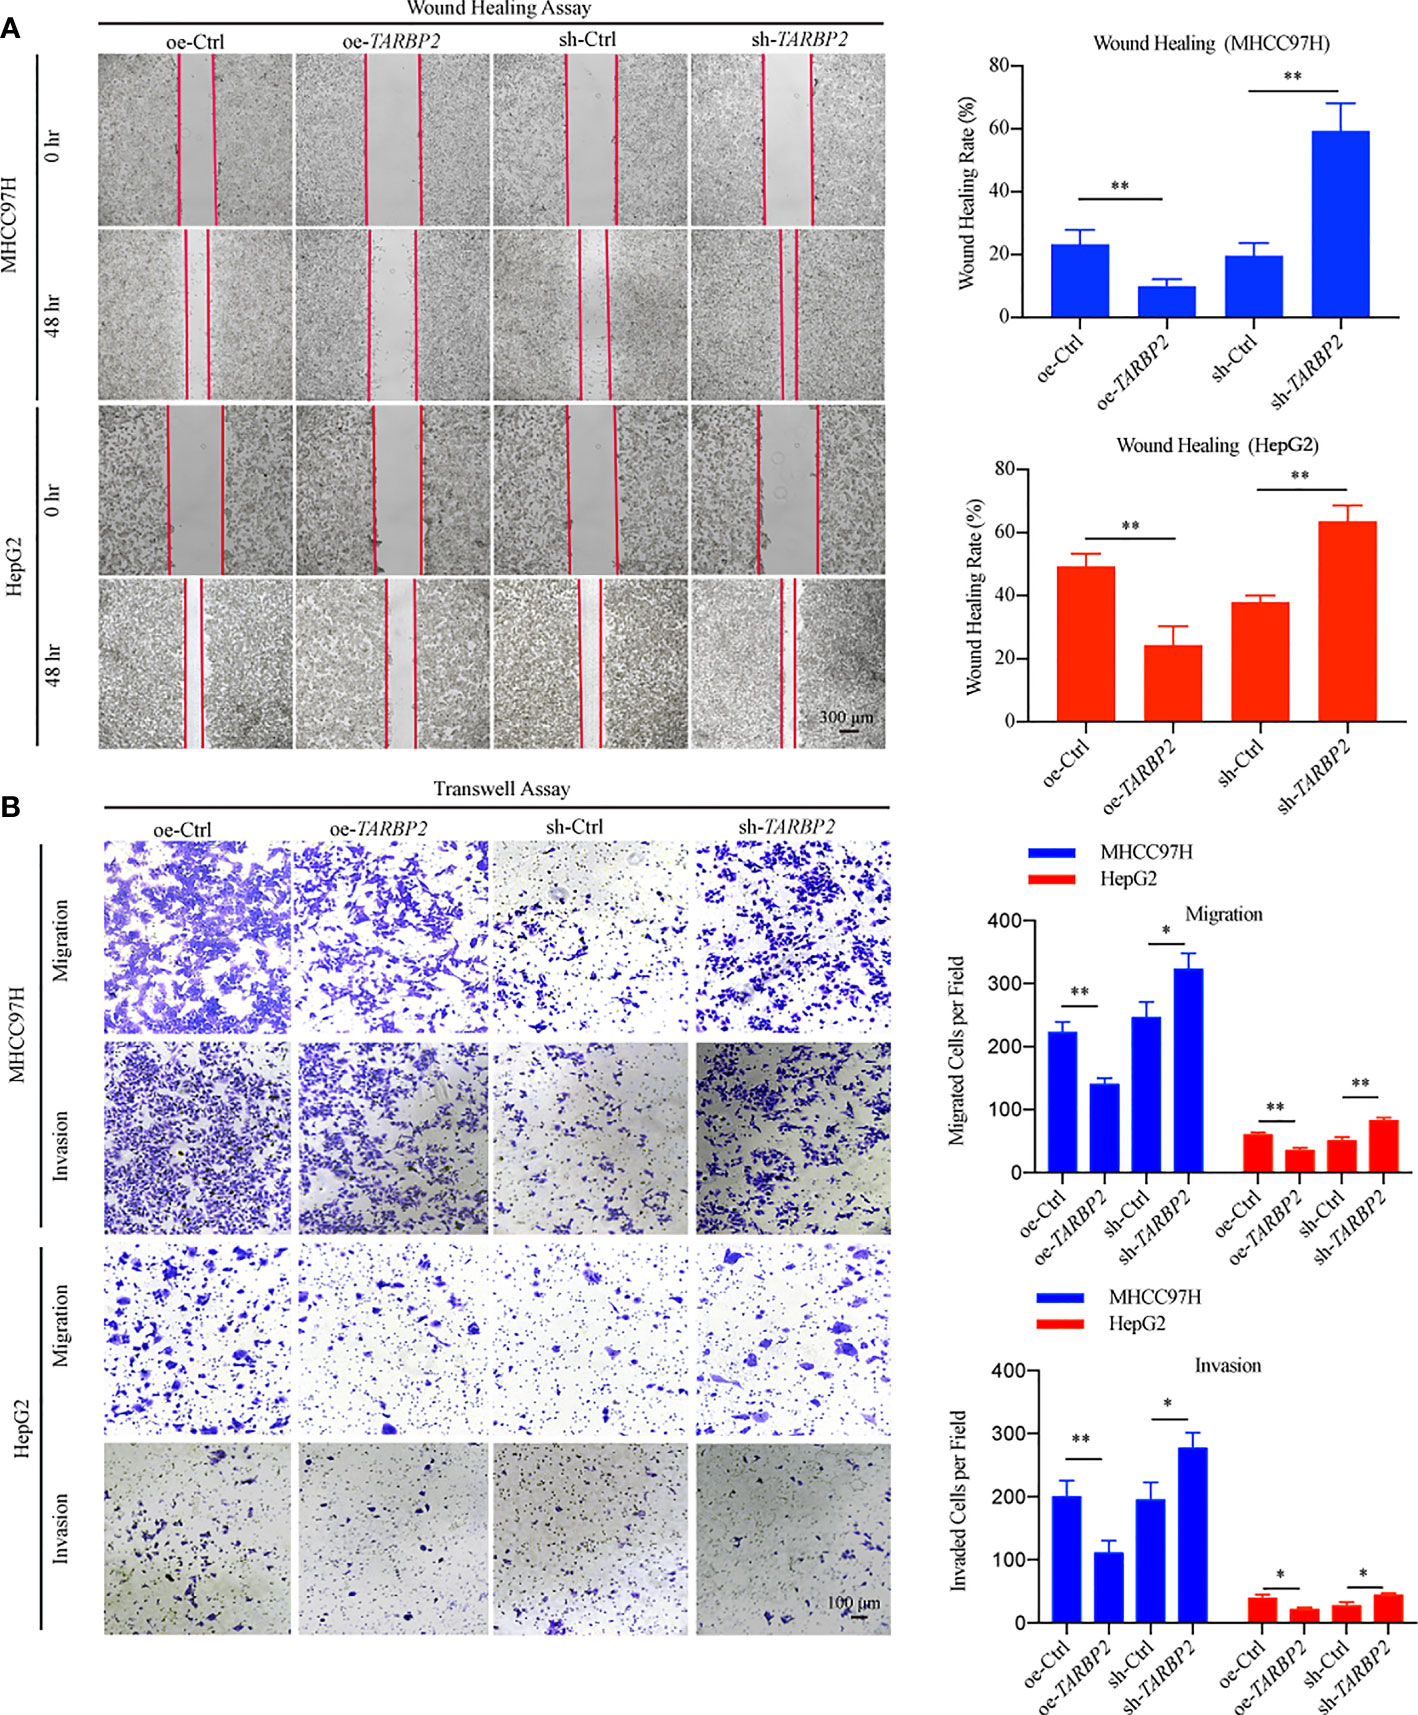
Figure 3 TARBP2 affects migration and invasion of HCC cells. (A, B) TARBP2 overexpression suppressed the migration and invasion of the HCC cells compared with controls. TARBP2 knockdown shown an opposite effect according to the results of wound healing and transwell assays. *p-value < 0.05; **p-value < 0.01.
SERPINE1 Is a Downstream Player of TARBP2
RNA-Seq in the oe-TARBP2 HepG2 cells identified 136 genes down-regulated and 838 genes up-regulated after overexpression of TARBP2 (fold change > 70%). In contrast, 308 genes were down-regulated and 1533 genes were up-regulated after knockdown of TARBP2 in HepG2 cells (fold change > 70%). Transcriptomic expression levels of the whole genome and the differentially expressed genes at the cut-off of 70% fold change were displayed (Figure 4A). At the fold change of 70%, the Venn diagram showed 373 shared genes between the differentially expressed genes in oe- and sh-TRABP2 HepG2 cells (Figure 4B). The KEGG and GO analysis revealed enriched pathways and biological processes relevant to cancer pathobiology, including such pathways as “Wnt signaling pathway”, “HIF-1 signaling pathway”, and “Adrenergic signaling in cardiomyocytes”; as well as such biological processes as “Negative regulation of tumor necrosis factor production”, “Axon guidance”, and “Cellular response to interferon-gamma” (Figure 4C). Notably, the HIF-1 signaling pathway was consistently enriched under different cut-offs of differential expressed genes, from 50% to 80% fold changes (Table S5 and Table S6). Among the differential genes, phosphoinositide-dependent protein kinase-1 (PDK1), endothelin 1 (EDN1) and SERPINIE1 are vital regulators of the HIF-1 signaling pathway (Table S5). The viability and migration of hepatic cells could be suppressed by the inhibition of PDK1 activity (33). Lu and colleagues have conducted liver up-regulated EDN1 expression in zebrafish, which leads to steatosis, fibrosis, and HCC (34). SERPINE1 contributed to the development of HCC (35) acting as a mediator both in two typical pathways, HIF-1 pathway and P53 pathway in HCC (Figures S5-S6). Mechanically, the heterodimeric transcription factor HIF-1 was activated under hypoxic conditions, leading to the upregulation of its target gene PAI-1 (SERPINE1) (36).
FIGURE 4
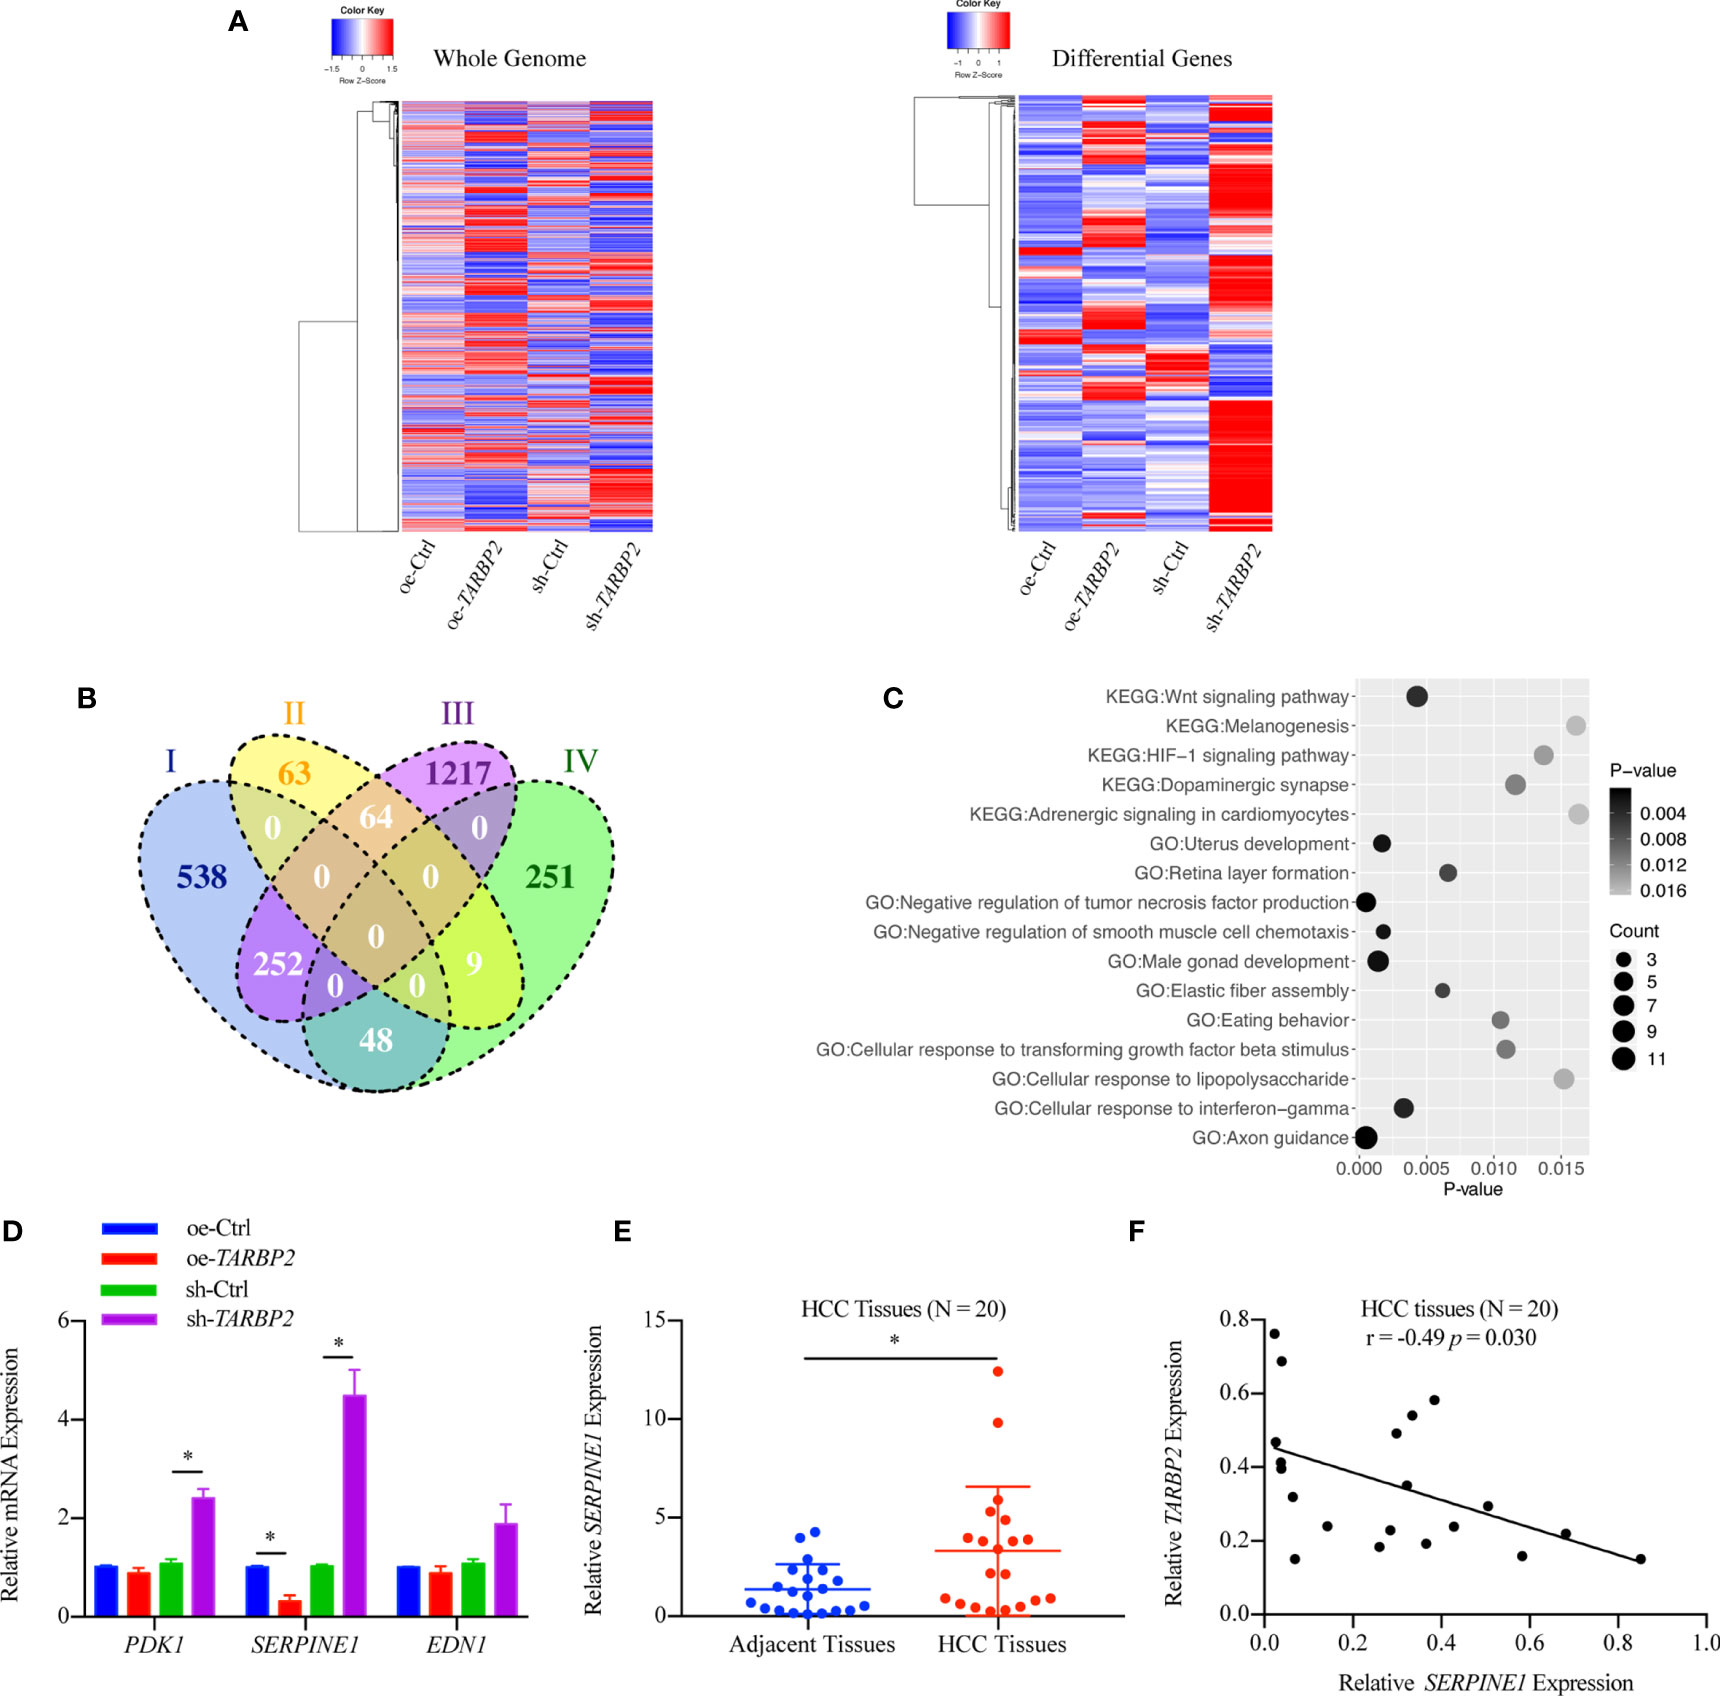
Figure 4 Differential genes after overexpression and knockdown of TARBP2 in HepG2 cells. (A) Heatmaps represent the expression level of the whole genome (left) and showing the intersect of differentially expressed genes at 70% fold-change from two groups (right) respectively. (oe-Ctrl vs oe-TARBP2, and sh-Ctrl vs sh-TARBP2). (B) A Venn Diagram of differentially expressed genes at the cut-off of 70% fold-change. Group-I, up-regulated genes from oe-Ctrl to oe-TARBP2; Group-II, down-regulated genes from oe-Ctrl to oe-TARBP2; Group-III, up-regulated genes from sh-Ctrl to sh-TARBP2; Group-IV, down-regulated genes from sh-Ctrl to sh-TARBP2. (C) The KEGG pathways and GO biological processes enriched in the differentially expressed genes at 70% fold-change. (D) The mRNA expression levels of candidate genes from enriched pathway. (E) Relative expression levels of SERPINE1 in HCC tissues. (F) Correlation between the relative expression level of TARBP2 and SERPINE1 in HCC tissues. *p-value < 0.05.
Therefore, we verified the mRNA expression of PDK1, EDN1 and SERPINE1 using qRT-PCR. As a result, SERPINE1 was down-regulated in the oe-TARBP2 HepG2 cells and was up-regulated in the sh-TARBP2 HepG2 cells (Figure 4D). Importantly, SERPINE1 was found to be increased in HCC tumors relative to their adjacent tissues (N = 20) (paired t-test p-value = 0.038) (Figure 4E), consistent with a previous study (18). The expression of SERPINE1 was also shown to be inversely correlated with TARBP2 expression in HCC tissues (Pearson r = -0.49, p-value = 0.030) (N = 20) (Figure 4F).
Then, we used specific shRNA to knockdown SERPINE1 in the stable sh-TARBP2 HepG2 cells (Figures 5A, B), predicting that it would suppress the promotion phenotype of sh-TARBP2. We noticed that the sh-TARBP2 HepG2 cells treated with SERPINE1 shRNA could rescue HepG2 cell migration (Figure 5C), invasion (Figure 5D), and proliferation (Figure 5E), whereas no significant changes were found in the scramble controls. The results from knockdown experiments were consistent with in silico prediction, illustrated that SERPINE1 might be a downstream player of TARBP2.
FIGURE 5
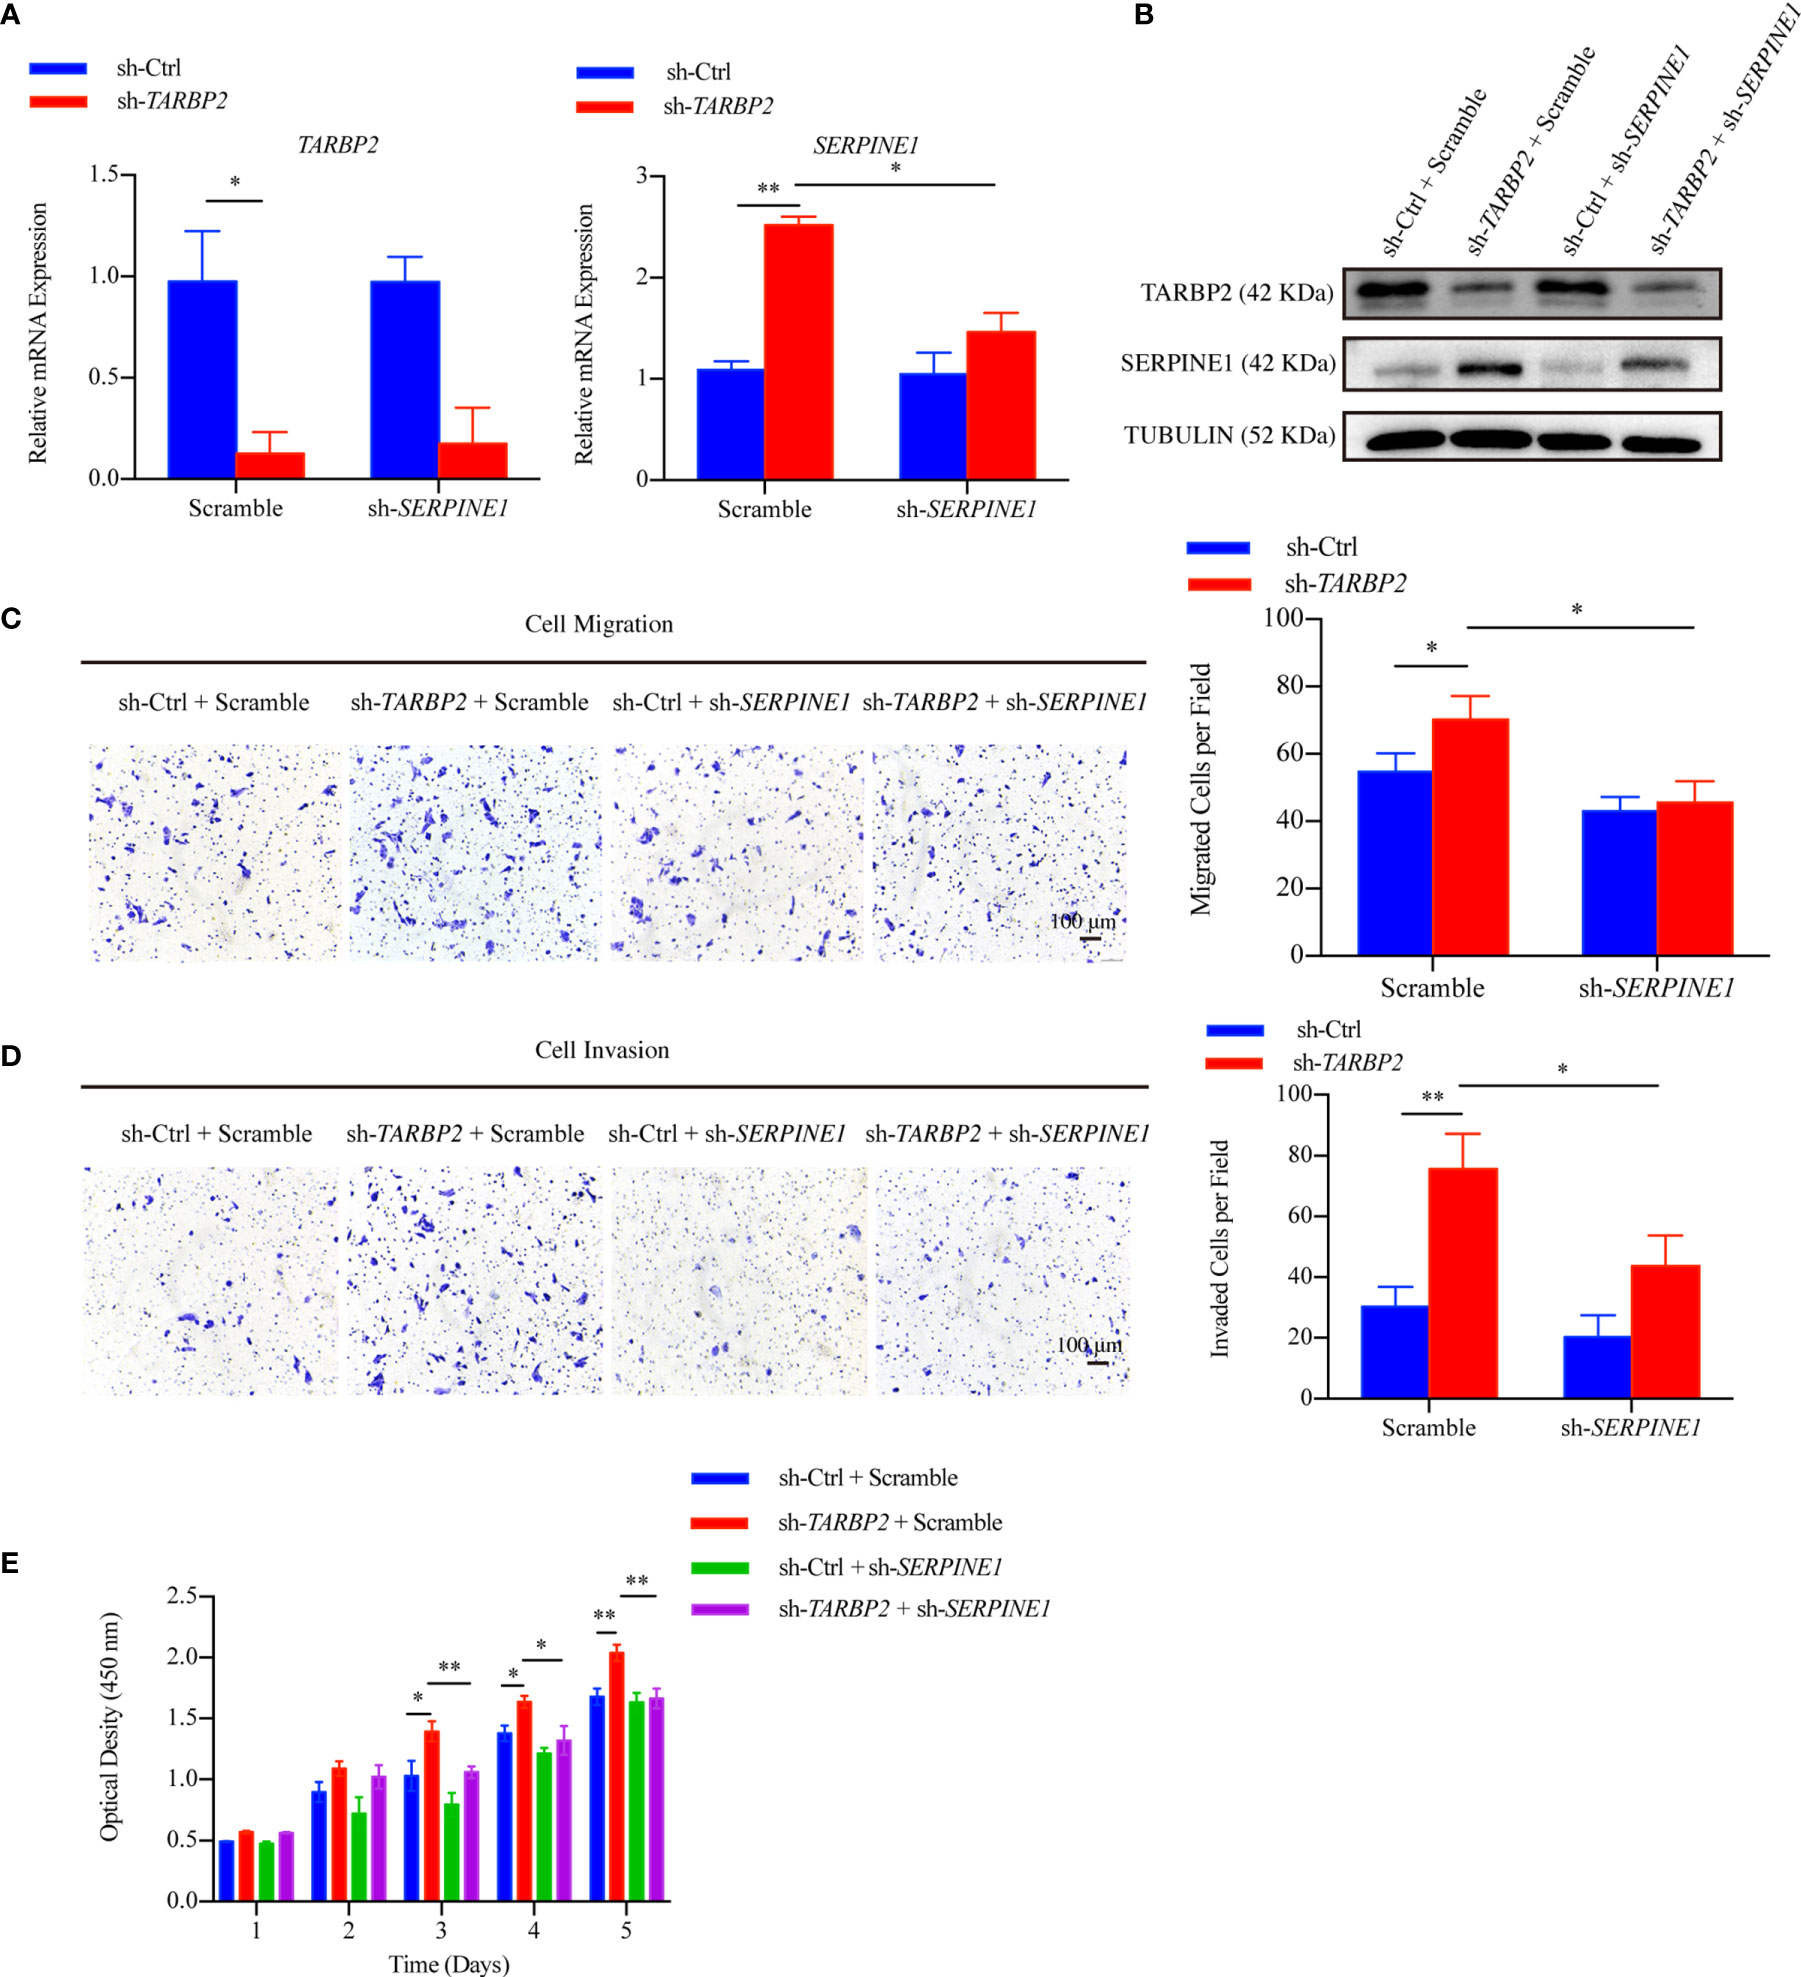
Figure 5 SERPINE1 is a downstream player of TARBP2. (A, B) The mRNA and protein expression of TARBP2 and SERPINE1 in the stable sh-TARBP2 HepG2 cells after treatment with scramble control and sh-SERPINE1. (C) Cell migration; (D) Invasion; and (E) Proliferation assays of sh-TARBP2 HepG2 cells treated with scramble control and sh-SERPINE1. *p-value < 0.05; **p-value < 0.01.
miR-145 Mediates SERPINE1 to Affect the Role of TARBP2 in HCC Progression
Considering that the decrease of TARBP2 expression could lead to a broad defect in miRNA maturation (37), the levels of potential miRNAs which might target SERPINE1 based on previous reports and miRNA prediction database were also evaluated in the oe/sh-TARBP2 HepG2 cells, including miR-30b, miR-30c, miR-192 and miR-145 (Figure 6A). These 4 miRNAs have been confirmed to target SERPINE1 or to be affected by the dysregulation of TARBP2 in previous studies (15, 38). A panel of these mature miRNAs, miR-30b, miR-30c, miR-192 and miR-145, were assessed by qRT-PCR (Figure 6B). Notably, the levels of miR-30c and miR-145 were regulated by TARBP2 (Figure 6B). Importantly, miR-145 has shown a negative regulation of SERPINE1 in human endometriotic cell line (17), and the expression of mature miR-145 was decreased in TARBP2-depleted Ewing sarcoma family tumor cell lines (15). These evidences suggested miR-145 might also be a TARBP2-dependent miRNA and target SERPINE1 in HCC. In the following experiments, we examined the expression of miR-145 in clinical samples, showing consistent results as what was observed in HCC cells. The expression of miR-145 was down-regulated in HCC tumors relative to adjacent tissues (N = 20) (paired t-test p-value = 0.005) (Figure 6C). The miR-145 levels were positively correlated with TARBP2 (Pearson r = 0.47, p-value = 0.037) and negatively correlated with SERPINE1 (Pearson r = -0.45, p-value = 0.049) (N = 20) (Figures 6D, E). Significant changes were observed in the luciferase assay with pmirGLO-SERPINE1-wild-type HepG2 cells but not in the mutant cells, indicating a direct role of miR-145 in regulating SERPINE1 expression (Figures 6F, G).
FIGURE 6
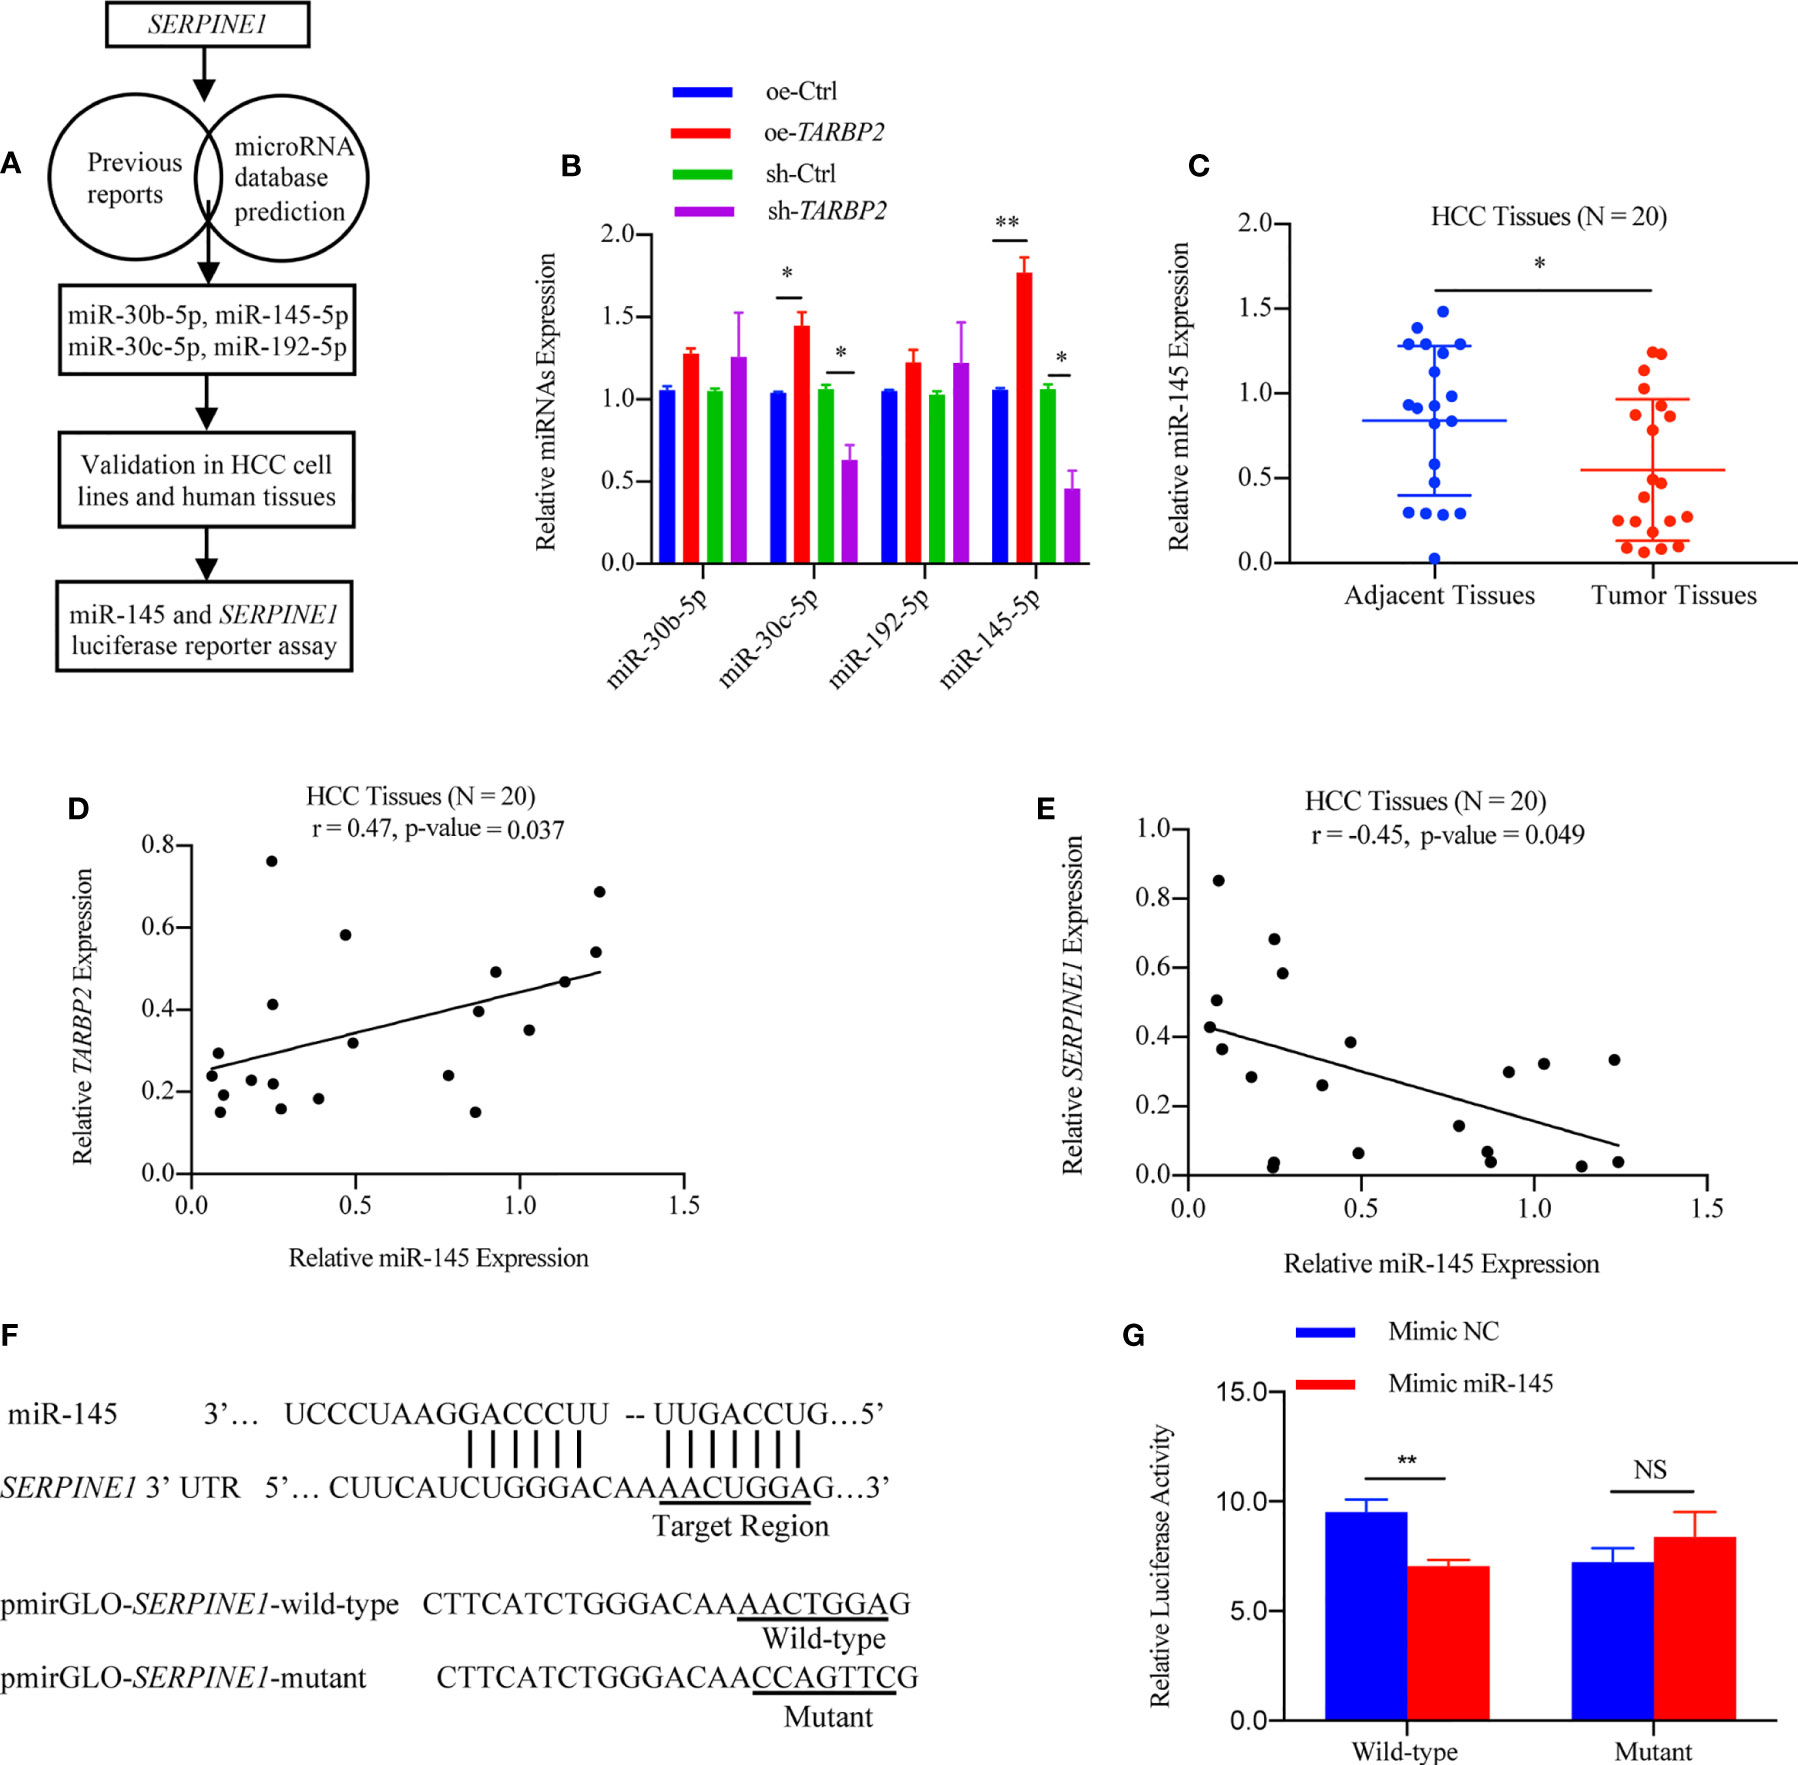
Figure 6 SERPINE1 mRNA is a target of miRNA-145 linked to TARBP2. (A) Flow chart of selection and analysis of potential miRNAs. (B) Levels of 4 potential miRNAs in the oe/sh-TARBP2 HepG2 cells. (C) Comparison of miR-145 expression between HCC tumors and tumor adjacent tissues (N = 20) (paired t-test p-value = 0.038). (D, E) miR-145 levels in HCC tumors are positively associated with TARBP2 (Pearson r = 0.47, p-value = 0.037) and negatively associated with SERPINE1 (Pearson r = -0.45, p-value = 0.049) (N=20). (F) The binding sites of miR-145 in the 3’-UTR of SERPINE1 mRNA. (G) The effects of miR-145 on reporters, pmirGLO-SERPINE1-wild-type and pmirGLO-SERPINE1-mutant, were measured by luciferase reporter assays in HepG2 cells. *p-value < 0.05; **p-value < 0.01; NS, no significance; NC, negative control.
To further verify our hypothesis that up-regulation of SERPINE1 was due to miR-145 downregulation, we restored miR-145 expression by mimic miR-145 in the stable sh-TARBP2 HepG2 cells (Figure 7A). Consistent with our results of luciferase assay, SERPINE1 protein was decreased compared with the NC groups (Figure 7B). Moreover, restoring miR-145 expression successfully rescued the migration (Figure 7C), invasion (Figure 7D), and proliferation (Figure 7E) in the stable sh-TARBP2 HepG2 cells, while the NC control groups had no changes.
FIGURE 7
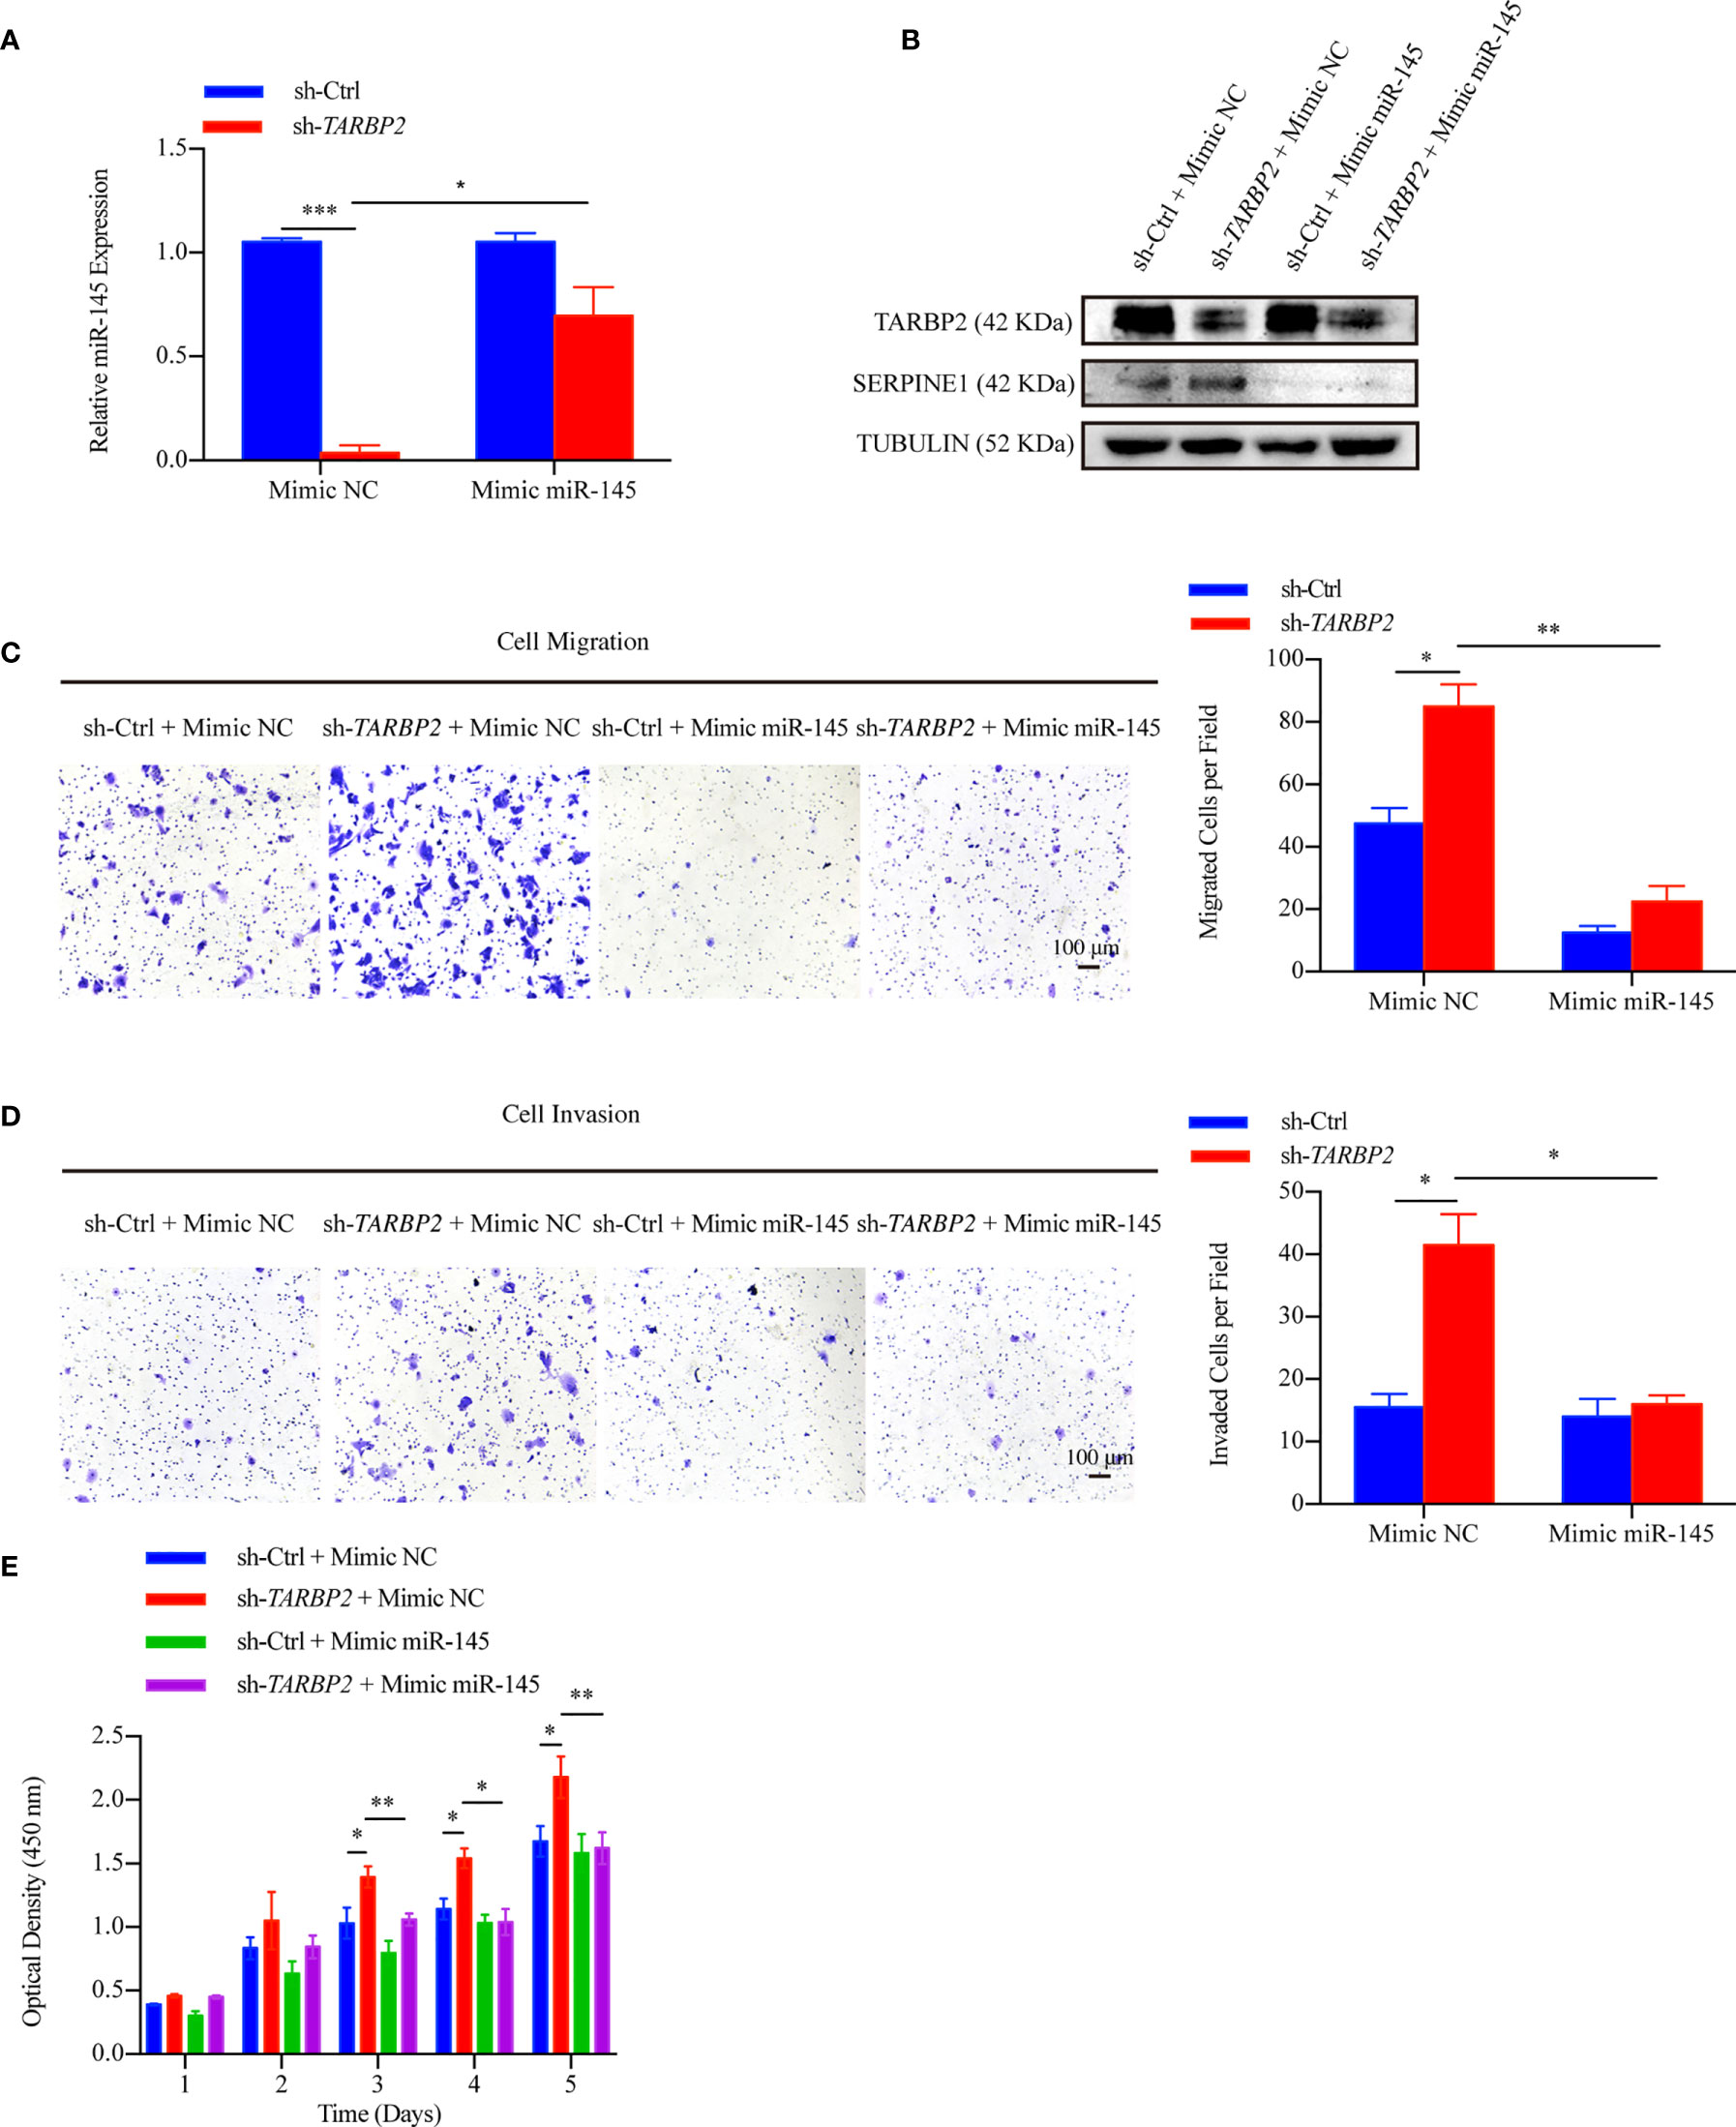
Figure 7 miR-145 mediates SERPINE1 to affect the role of TARBP2 in HCC progression. (A) Levels of miR-145 in sh-TARBP2 HepG2 cells after treatment with Mimic NC and Mimic miR-145. (B) Protein levels of SERPINE1 and TARBP2 in the stable sh-TARBP2 HepG2 cells after treatment with Mimic NC and Mimic miR-145. (C) Cell migration; (D) Invasion; and (E) Proliferation of sh-TARBP2 HepG2 cells treated with Mimic NC and Mimic miR-145. *p-value < 0.05; **p-value < 0.01; NC, negative control.
Discussion
Although previous studies have implicated TARBP2 in various cellular processes such as miRNA maturation, or as a mediator for different pathways, its role in cancer development has been controversial and not been established in HCC yet. The lack of efficient intervention approaches has led to the unsatisfactory clinical outcomes of HCC, which represents a leading cause of cancer mortality worldwide. In the current report, we aimed to examine TARBP2 for its role in HCC progression and to explore related regulatory pathways, taking advantage of clinical specimens and well-characterized liver cancer/normal liver cell lines.
First, we sought to establish whether TARBP2 was associated with HCC pathogenesis and patient survival. TARBP2 and its protein were consistently found to be dysregulated in clinical specimens, including tumor/adjacent tissue samples and the peripheral blood derived from HCC patients and healthy controls. The molecular levels of TARBP2 were explored to demonstrate its impact on the clinical outcomes in HCC patients, showing association with tumor stages and the OS of HCC patients within three-year after initial diagnosis, after controlling gender and age. Approximately 73.7% (14/19) of HCC patients with BCLC stage B and C as well as 76.5% (13/17) HCC patients with PVTT had a lower TARBP2 expression (Table S2), demonstrating that TARBP2 deficiency might drive HCC progression.
Aerobic glycolysis and mitochondrial dysfunction are key metabolic features of cancer cells (39). Liver is the main site of glucose and lipid metabolisms. Disturbed cholesterol and glucose promoted not only HCC but also cardiovascular diseases and other cancers (40). Hyperglycemia has been proven to accelerate tumorigenesis in HCC cells (41). Low levels of HDL-C have shown an association with the development of HCC (42). Consistent with previous reports (39–42), our data revealed that serum glucose was higher in HCC patients, while HDL-C was lower in HCC patients, compared to health controls. Moreover, the expression of TARBP2 was positively associated with serum HDL-C and negatively associated with serum glucose (Figures S3A–D), indicating TARBP2 might be involved in the disorders of glucose and lipids caused by liver dysfunction in HCC patients.
We further utilized a set of well-characterized HCC cell lines to demonstrate that TARBP2 affected cell proliferation, migration, invasion, and cell cycle. Our findings in clinical specimens and HCC cell lines established a critical role of TARBP2 in the progression of HCC, suggested a potential linkage between the molecular levels of TARBP2 and the clinical outcomes in HCC.
Second, in HCC cell lines, we aimed to illustrate the mechanism underlying the TARBP2-associated HCC progression. Examining RNA-Seq profiles in the oe/sh-TARBP2 cell lines, several cancer-related pathways, such as the HIF-1 signaling pathway which played a pivotal role in HCC progression (43), were found to be significantly enriched among the differential genes in the cell lines, suggesting a systematic change in transcriptional profiles of various cancer-related genes after either overexpression or knockdown of TARBP2. Several functional genes involving the HIF-1 pathway were further evaluated in HCC cell lines and clinical specimens. As a result, the expression of SERPINE1, a vital element in both HIF-1 pathway and P53 pathway, was found to be increased in HCC tumors relative to their adjacent tissues, consistent with previous genomic and clinical studies in HCC (44, 45). Expression of SERPINE1 was also shown to be inversely correlated with TARBP2 expression in HCC tissues. All the above evidences suggested that SERPINE1 might be a key downstream player of TARBP2 and could mediate HCC progression. In addition, tumor biological functional experiments in sh-TARBP2 HepG2 cells after restoring the expression of SERPINE1 further linked the observed up-regulation of SERPINE1 in HCC with TARBP2 as the potential downstream regulator.
Third, considering that TARBP2 involves in multiple cellular processes, particularly its function in regulating the accuracy of miRNA processing (46), we aimed to elucidate an epigenetic pathway via miRNAs for the TARBP2-SERPINE1 axis in HCC progression. Our findings suggested that sh-TARBP2 reduced the synthesis of mature miR-145, which have been identified to directly target SERPINE1 in previous reports (17, 47, 48). Next, we validated the relationship between SERPINE1 and miR-145 in HCC using dual luciferase assays and clinical samples. Collectively, a working model was proposed to link TARBP2 and SERPINE1 through miR-145 in which miR-145 might serve as a potential downstream player of TARBP2 loss-of-function and directly modulate the expression and function of SERPINE1 in HCC progression.
We acknowledge that several limitations are noted for the current report. Since all HCC patients were from a Chinese cohort, the majority of which had a history of HBV infection. The relationship between TARBP2 and HCC progression in HCC of other risk background and populations will worth further investigation. Though the HCC cell lines used in this study have been well-characterized and widely used in previous studies, it is possible that these cell lines might contain unknown artifacts in cell culture that affected their transcriptional and/or epigenetic profiles. We showed that TARBP2 has an effect on progression of HCC, but whether the other classical proliferation, migration, and invasion markers, such as Ki-67, E-cadherin, vimentin, MMP7, MMP9, and Zeb1/2 could be affected in sh-TARBP2 and oe-TARBP2 cells was not assessed. Although we identified the TARBP2-dependent miR-145 based on sequencing data, online database and qRT-PCR, more comprehensive experiments such as Northern blots are warranted to validate our intriguing results in future. Our observations suggested the inhibition of TARBP2 function might constitute a critical component of the mechanism that underlies the defective mature miR-145 in HCC. However, the potential effect of TARBP2 on pre-miR-145 and the association between pre-miR-145 and miR-145 still remain to be clarified. Future studies using primary cell lines, and/or animal models as well as SERPINE1 rescue experiment will be helpful to confirm our findings in this report. Other key proteins such as DICER that are also involved in the miRNA machinery are potential areas in HCC that requires further research and validation.
Conclusions
In conclusion, the role of TARBP2 through mediation of miR-145 and a downstream player SERPINE1 was established in HCC progression, thus providing a new intervention pathway (e.g. HIF-1 pathway) that could be exploited to improve the clinical outcomes of HCC in the future (Figure 8). Further investigations to confirm the TRABP2-miR-145-SERPINE1 axis in independent HCC patients and clinical specimens, as well as animal models are warranted.
FIGURE 8
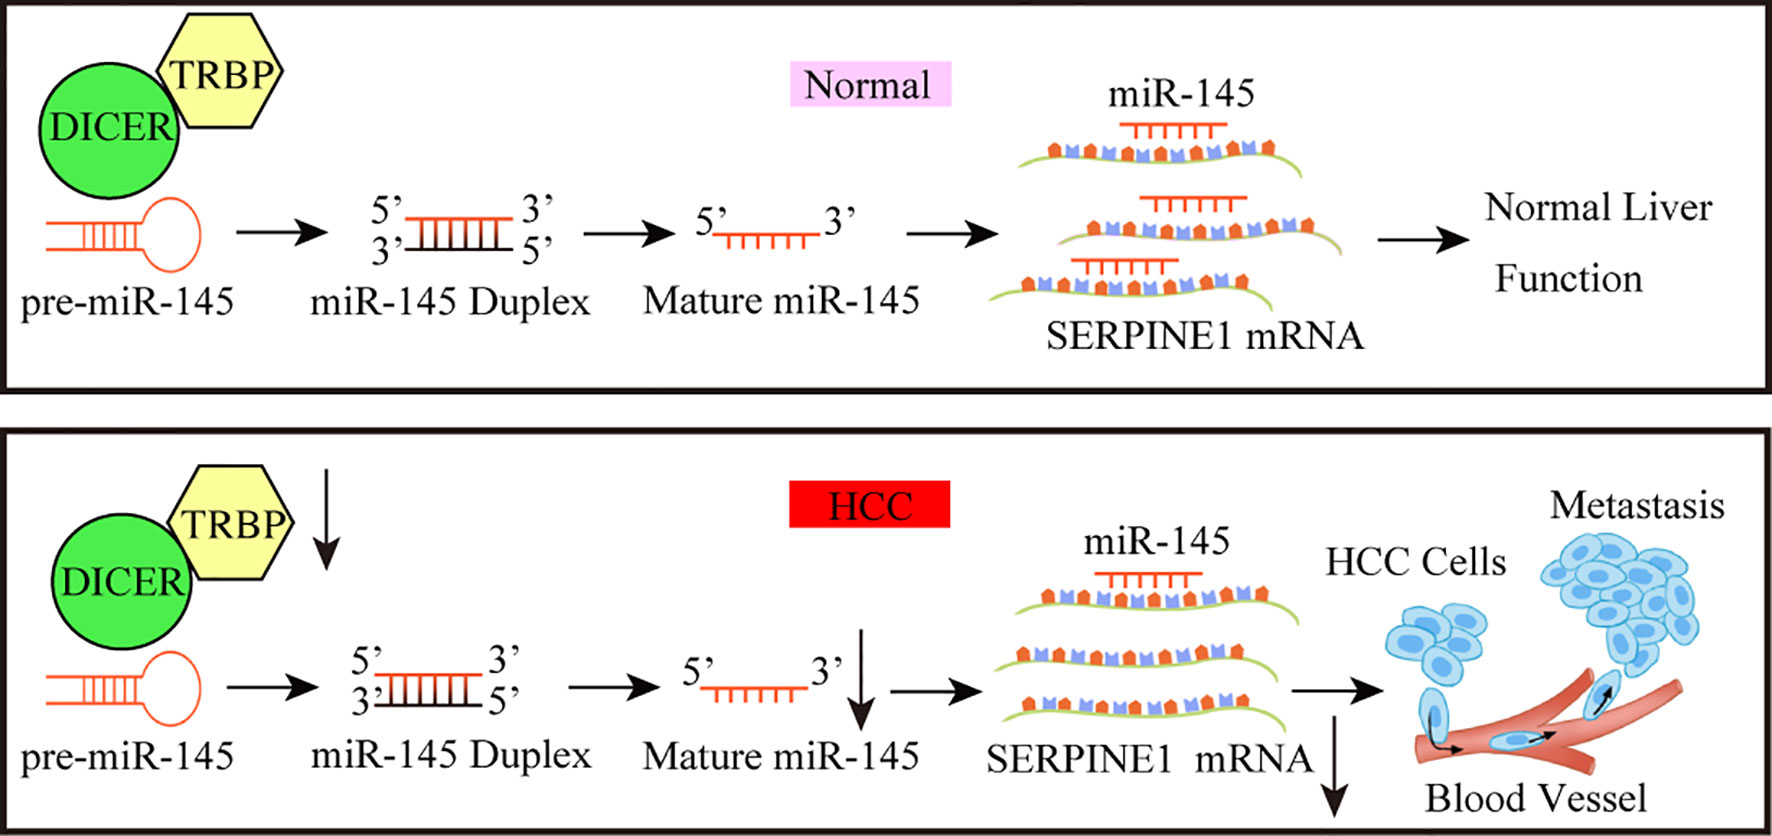
Figure 8 A working model for the TARBP2-miR-145-SERPINE1 axis in HCC progression. The loss of TARBP2 induces the upregulation of SERPINE1 through reducing the processing of miR-145. This linear TARBP2-miR-145-SERPINE1 axis is involved in proliferation, migration, and invasion in HCC cells.
Data Availability Statement
The datasets presented in this study can be found in online repositories. The names of the repository/repositories and accession number(s) can be found in the article/Supplementary Material.
Ethics Statement
The studies involving human participants were reviewed and approved by Ethics Committee of Zhongnan Hospital, Wuhan University (Approval Number: 2017058). The patients/participants provided their written informed consent to participate in this study.
Author Contributions
L-ML performed the experiments, collected data, and drafted the initial manuscript. CC, CZ, and ZZ were responsible for bioinformatic processing, and analysis of the RNA-Seq data. R-XR and J-TH provided materials and reagents and created cell models. H-LS prepared the published work by those from the original research group, specifically critical review, commentary or revision—including pre- or post-publication stages. WZ supervised bioinformatics and formal statistical analysis and helped data interpretation. S-ML was liable for oversight and leadership responsibility for the research activity planning and execution, including mentorship external to the core team. All authors contributed to the article and approved the submitted version.
Funding
This research was supported by the National Research Foundation (81772276, 81902141) and provincial Natural Science Fund for Creative Research Groups (2019CFA018).
Conflict of Interest
The authors declare that the research was conducted in the absence of any commercial or financial relationships that could be construed as a potential conflict of interest.
Acknowledgments
We thank Dr. Chuan He for the generous sharing of the vectors (pCMV delta R8.2, pCMV-VSV-G plasmids) as well as Dr. Xiao-Hua Leng for evaluating IHC results. We also thank technicians in Medical Research Center of Zhongnan Hospital, Wuhan University for sharing human liver cell line HL7702 (L02) and MHCC97H cell lines.
Supplementary Material
The Supplementary Material for this article can be found online at: https://www.frontiersin.org/articles/10.3389/fonc.2021.620912/full#supplementary-material
Abbreviations
HCC, hepatocellular carcinoma; TRBP, transactivation response element RNA-binding protein; miRNA, microRNA; SERPINE1, serpin family E member 1; RNA-Seq, RNA-sequencing; BCLC, Barcelona clinic liver cancer; OS, overall survival; ROC, receiver operating characteristic; AUC, area under curve; KM, Kaplan-Meier; IHC, immunohistochemistry; PDK1, phosphoinositide-dependent protein kinase-1; EDN1, endothelin 1; ALT, alanine aminotransferase AST, aspartate aminotransferase; BUN, blood urea nitrogen; CREA, creatinine; TC, total cholesterol; TG, triglyceride; HDL-C, high-density lipoprotein cholesterol; LDL-C, low-density lipoprotein cholesterol; AFP, α-fetoprotein; CEA, carcinoembryonic antigen.
References
1. Bray F, Ferlay J, Soerjomataram I, Siegel RL, Torre LA, Jemal A. Global cancer statistics 2018: GLOBOCAN estimates of incidence and mortality worldwide for 36 cancers in 185 countries. CA Cancer J Clin (2018) 68(6):394–424. doi: 10.3322/caac.21492
2. Sun HL, Cui R, Zhou J, Teng KY, Hsiao YH, Nakanishi K, et al. ERK Activation Globally Downregulates miRNAs through Phosphorylating Exportin-5. Cancer Cell (2016) 30(5):723–36. doi: 10.1016/j.ccell.2016.10.001
3. Altekruse SF, McGlynn KA, Reichman ME. Hepatocellular carcinoma incidence, mortality, and survival trends in the United States from 1975 to 2005. J Clin Oncol (2009) 27(9):1485–91. doi: 10.1200/JCO.2008.20.7753
4. Huang JT, Yang Y, Hu YM, Liu XH, Liao MY, Morgan R, et al. A Highly Sensitive and Robust Method for Hepatitis B Virus Covalently Closed Circular DNA Detection in Single Cells and Serum. J Mol Diagn (2018) 20(3):334–43. doi: 10.1016/j.jmoldx.2018.01.010
5. Huang JT, Liu YJ, Wang J, Xu ZG, Yang Y, Shen F, et al. Next generation digital PCR measurement of hepatitis B virus copy number in formalin-fixed paraffin-embedded hepatocellular carcinoma tissue. Clin Chem (2015) 61(1):290–6. doi: 10.1373/clinchem.2014.230227
6. Mariani CJ, Madzo J, Moen EL, Yesilkanal A, Godley LA. Alterations of 5-hydroxymethylcytosine in human cancers. Cancers (Basel) (2013) 5(3):786–814. doi: 10.3390/cancers5030786
7. Cai J, Chen L, Zhang Z, Zhang X, Lu X, Liu W, et al. Genome-wide mapping of 5-hydroxymethylcytosines in circulating cell-free DNA as a non-invasive approach for early detection of hepatocellular carcinoma. Gut (2019). 68(12):2195–205. doi: 10.1136/gutjnl-2019-318882
8. Xu RH, Wei W, Krawczyk M, Wang W, Luo H, Flagg K, et al. Circulating tumour DNA methylation markers for diagnosis and prognosis of hepatocellular carcinoma. Nat Mater (2017) 16(11):1155–61. doi: 10.1038/nmat4997
9. Chen M, Wei L, Law CT, Tsang FH, Shen J, Cheng CL, et al. RNA N6-methyladenosine methyltransferase-like 3 promotes liver cancer progression through YTHDF2-dependent posttranscriptional silencing of SOCS2. Hepatology (2018) 67(6):2254–70. doi: 10.1002/hep.29683
10. Cai J, Zhang Z, He C, Zhang W, Fan J. Reply to ‘Are the 5-hydroxymethylcytosine-based wd-scores really superior over alpha-fetoprotein for the early diagnosis of hepatocellular carcinoma?’. Gut (2019) 69(10):1903–4. doi: 10.1136/gutjnl-2019-320298
11. Chendrimada TP, Gregory RI, Kumaraswamy E, Norman J, Cooch N, Nishikura K, et al. TRBP recruits the Dicer complex to Ago2 for microRNA processing and gene silencing. Nature (2005) 436(7051):740–4. doi: 10.1038/nature03868
12. Lee HY, Zhou K, Smith AM, Noland CL, Doudna JA. Differential roles of human Dicer-binding proteins TRBP and PACT in small RNA processing. Nucleic Acids Res (2013) 41(13):6568–76. doi: 10.1093/nar/gkt361
13. Wilson RC, Tambe A, Kidwell MA, Noland CL, Schneider CP, Doudna JA. Dicer-TRBP Complex Formation Ensures Accurate Mammalian MicroRNA Biogenesis. Mol Cell (2015) 57(3):397–407. doi: 10.1016/j.molcel.2014.11.030
14. Yu X, Li Z. The role of TARBP2 in the development and progression of cancers. Tumour Biol (2016) 37(1):57–60. doi: 10.1007/s13277-015-4273-6
15. De Vito C, Riggi N, Cornaz S, Suva ML, Baumer K, Provero P, et al. A TARBP2-dependent miRNA expression profile underlies cancer stem cell properties and provides candidate therapeutic reagents in Ewing sarcoma. Cancer Cell (2012) 21(6):807–21. doi: 10.1016/j.ccr.2012.04.023
16. Noh JH, Chang YG, Kim MG, Jung KH, Kim JK, Bae HJ, et al. MiR-145 functions as a tumor suppressor by directly targeting histone deacetylase 2 in liver cancer. Cancer Lett (2013) 335(2):455–62. doi: 10.1016/j.canlet.2013.03.003
17. Adammek M, Greve B, Kassens N, Schneider C, Bruggemann K, Schuring AN, et al. MicroRNA miR-145 inhibits proliferation, invasiveness, and stem cell phenotype of an in vitro endometriosis model by targeting multiple cytoskeletal elements and pluripotency factors. Fertil Steril (2013) 99(5):1346–55.e5. doi: 10.1016/j.fertnstert.2012.11.055
18. Matsuzaki K, Murata M, Yoshida K, Sekimoto G, Uemura Y, Sakaida N, et al. Chronic inflammation associated with hepatitis C virus infection perturbs hepatic transforming growth factor beta signaling, promoting cirrhosis and hepatocellular carcinoma. Hepatology (2007) 46(1):48–57. doi: 10.1002/hep.21672
19. Boye A, Kan H, Wu C, Jiang Y, Yang X, He S, et al. MAPK inhibitors differently modulate TGF-β/Smad signaling in HepG2 cells. Tumor Biol (2015) 36(5):3643–51. doi: 10.1007/s13277-014-3002-x
21. Chou CH, Shrestha S, Yang CD, Chang NW, Lin YL, Liao KW, et al. miRTarBase update 2018: a resource for experimentally validated microRNA-target interactions. Nucleic Acids Res (2018) 46(D1):D296–302. doi: 10.1093/nar/gkx1067
22. Agarwal V, Bell GW, Nam JW, Bartel DP. Predicting effective microRNA target sites in mammalian mRNAs. Elife (2015) 4:e05005. doi: 10.7554/eLife.05005
23. McCann JV, Xiao L, Kim DJ, Khan OF, Kowalski PS, Anderson DG, et al. Endothelial miR-30c suppresses tumor growth via inhibition of TGF-beta-induced Serpine1. J Clin Invest (2019) 130:1654–70. doi: 10.1172/JCI123106
24. Ghini F, Rubolino C, Climent M, Simeone I, Marzi MJ, Nicassio F. Endogenous transcripts control miRNA levels and activity in mammalian cells by target-directed miRNA degradation. Nat Commun (2018) 9(1):3119. doi: 10.1038/s41467-018-05182-9
25. Botla SK, Savant S, Jandaghi P, Bauer AS, Mucke O, Moskalev EA, et al. Early Epigenetic Downregulation of microRNA-192 Expression Promotes Pancreatic Cancer Progression. Cancer Res (2016) 76(14):4149–59. doi: 10.1158/0008-5472.CAN-15-0390
26. Savarimuthu Francis SM, Davidson MR, Tan ME, Wright CM, Clarke BE, Duhig EE, et al. MicroRNA-34c is associated with emphysema severity and modulates SERPINE1 expression. BMC Genomics (2014) 15:88. doi: 10.1186/1471-2164-15-88
27. Muth M, Hussein K, Jacobi C, Kreipe H, Bock O. Hypoxia-induced down-regulation of microRNA-449a/b impairs control over targeted SERPINE1 (PAI-1) mRNA - a mechanism involved in SERPINE1 (PAI-1) overexpression. J Transl Med (2011) 9:24. doi: 10.1186/1479-5876-9-24
28. Dobin A, Davis CA, Schlesinger F, Drenkow J, Zaleski C, Jha S, et al. STAR: ultrafast universal RNA-seq aligner. Bioinformatics (2013) 29(1):15–21. doi: 10.1093/bioinformatics/bts635
29. R_Consortium. R: A Language and Environment for Statistical Computing. Vienna, Austria: R Foundation for Statistical Computing (2013).
30. Kanehisa M, Sato Y, Kawashima M, Furumichi M, Tanabe M. KEGG as a reference resource for gene and protein annotation. Nucleic Acids Res (2016) 44(D1):D457–62. doi: 10.1093/nar/gkv1070
31. Huang da W, Sherman BT, Lempicki RA. Bioinformatics enrichment tools: paths toward the comprehensive functional analysis of large gene lists. Nucleic Acids Res (2009) 37(1):1–13. doi: 10.1093/nar/gkn923
32. Lai HH, Li CW, Hong CC, Sun HY, Chiu CF, Ou DL, et al. TARBP2-mediated destabilization of Nanog overcomes sorafenib resistance in hepatocellular carcinoma. Mol Oncol (2019) 13(4):928–45. doi: 10.1002/1878-0261.12449
33. Li C, Lin C, Cong X, Jiang Y. PDK1-WNK1 signaling is affected by HBx and involved in the viability and metastasis of hepatic cells. Oncol Lett (2018) 15(4):5940–6. doi: 10.3892/ol.2018.8001
34. Lu JW, Liao CY, Yang WY, Lin YM, Jin SL, Wang HD, et al. Overexpression of endothelin 1 triggers hepatocarcinogenesis in zebrafish and promotes cell proliferation and migration through the AKT pathway. PLoS One (2014) 9(1):e85318. doi: 10.1371/journal.pone.0085318
35. Oldani G, Crowe LA, Orci LA, Slits F, Rubbia-Brandt L, de Vito C, et al. Pre-retrieval reperfusion decreases cancer recurrence after rat ischemic liver graft transplantation. J Hepatol (2014) 61(2):278–85. doi: 10.1016/j.jhep.2014.03.036
36. Gorlach A, Diebold I, Schini-Kerth VB, Berchner-Pfannschmidt U, Roth U, Brandes RP, et al. Thrombin activates the hypoxia-inducible factor-1 signaling pathway in vascular smooth muscle cells: Role of the p22(phox)-containing NADPH oxidase. Circ Res (2001) 89(1):47–54. doi: 10.1161/hh1301.092678
37. Melo S, Villanueva A, Moutinho C, Davalos V, Spizzo R, Ivan C, et al. Small molecule enoxacin is a cancer-specific growth inhibitor that acts by enhancing TAR RNA-binding protein 2-mediated microRNA processing. Proc Natl Acad Sci U S A (2011) 108(11):4394–9. doi: 10.1073/pnas.1014720108
38. Bogerd HP, Whisnant AW, Kennedy EM, Flores O, Cullen BR. Derivation and characterization of Dicer- and microRNA-deficient human cells. RNA (2014) 20(6):923–37. doi: 10.1261/rna.044545.114
39. Hong SM, Lee YK, Park I, Kwon SM, Min S, Yoon G. Lactic acidosis caused by repressed lactate dehydrogenase subunit B expression down-regulates mitochondrial oxidative phosphorylation via the pyruvate dehydrogenase (PDH)-PDH kinase axis. J Biol Chem (2019) 294(19):7810–20. doi: 10.1074/jbc.RA118.006095
40. Luo J, Yang H, Song BL. Mechanisms and regulation of cholesterol homeostasis. Nat Rev Mol Cell Biol (2019) 21(4):225–45. doi: 10.1038/s41580-019-0190-7
41. Qiao Y, Zhang X, Zhang Y, Wang Y, Xu Y, Liu X, et al. High Glucose Stimulates Tumorigenesis in Hepatocellular Carcinoma Cells Through AGER-Dependent O-GlcNAcylation of c-Jun. Diabetes (2016) 65(3):619–32. doi: 10.2337/db15-1057
42. Khattab MA, Eslam M, Mousa YI, Ela-adawy N, Fathy S, Shatat M, et al. Association between metabolic abnormalities and hepatitis C-related hepatocellular carcinoma. Ann Hepatol (2012) 11(4):487–94. doi: 10.1016/S1665-2681(19)31462-0
43. Hu W, Zheng S, Guo H, Dai B, Ni J, Shi Y, et al. PLAGL2-EGFR-HIF-1/2alpha Signaling Loop Promotes HCC Progression and Erlotinib Insensitivity. Hepatology (2021) 73(2):674–91. doi: 10.1002/hep.31293
44. Jin Y, Liang ZY, Zhou WX, Zhou L. Expression, clinicopathologic and prognostic significance of plasminogen activator inhibitor 1 in hepatocellular carcinoma. Cancer Biomark (2019) 27(3):285–93. doi: 10.3233/CBM-190560
45. Marquard S, Thomann S, Weiler SME, Bissinger M, Lutz T, Sticht C, et al. Yes-associated protein (YAP) induces a secretome phenotype and transcriptionally regulates plasminogen activator Inhibitor-1 (PAI-1) expression in hepatocarcinogenesis. Cell Commun Signal (2020) 18(1):166. doi: 10.1186/s12964-020-00634-6
46. Kim Y, Yeo J, Lee JH, Cho J, Seo D, Kim JS, et al. Deletion of human tarbp2 reveals cellular microRNA targets and cell-cycle function of TRBP. Cell Rep (2014) 9(3):1061–74. doi: 10.1016/j.celrep.2014.09.039
47. Teng F, Zhang JX, Chen Y, Shen XD, Su C, Guo YJ, et al. LncRNA NKX2-1-AS1 promotes tumor progression and angiogenesis via upregulation of SERPINE1 expression and activation of the VEGFR-2 signaling pathway in gastric cancer. Mol Oncol (2021) 15(4):1234–55. doi: 10.1002/1878-0261.12911
Keywords: HCC, TARBP2, miR-145, SERPINE1, progression
Citation: Li L-M, Chen C, Ran R-X, Huang J-T, Sun H-L, Zeng C, Zhang Z, Zhang W and Liu S-M (2021) Loss of TARBP2 Drives the Progression of Hepatocellular Carcinoma via miR-145-SERPINE1 Axis. Front. Oncol. 11:620912. doi: 10.3389/fonc.2021.620912
Received: 24 October 2020; Accepted: 09 March 2021;
Published: 24 June 2021.
Edited by:
Guohui Wan, Sun Yat-Sen University, ChinaReviewed by:
Omar Torres-Quesada, University of Innsbruck, AustriaDongshi Chen, University of Pittsburgh, United States
Copyright © 2021 Li, Chen, Ran, Huang, Sun, Zeng, Zhang, Zhang and Liu. This is an open-access article distributed under the terms of the Creative Commons Attribution License (CC BY). The use, distribution or reproduction in other forums is permitted, provided the original author(s) and the copyright owner(s) are credited and that the original publication in this journal is cited, in accordance with accepted academic practice. No use, distribution or reproduction is permitted which does not comply with these terms.
*Correspondence: Song-Mei Liu, smliu@whu.edu.cn; Wei Zhang, wei.zhang1@northwestern.edu
†These authors have contributed equally to this work
‡These authors share senior authorship