 Jin Zhang1,2
 Wengang Li
 Donghai Lin
- 1Department of Hepatobiliary Surgery, Xiang’an Hospital of Xiamen University, School of Medicine, Xiamen University, Xiamen, China
- 2College of Chemistry and Chemical Engineering, Key Laboratory for Chemical Biology of Fujian Province, MOE Key Laboratory of Spectrochemical Analysis & Instrumentation, Xiamen University, Xiamen, China
- 3Department of Physical Education, Xiamen University of Technology, Xiamen, China
- 4Affiliated Cardiovascular Hospital of Xiamen University, Medical College of Xiamen University, Xiamen, China
Metformin is a widely prescribed anti-diabetes drug with potential utilities for cancer therapies. Several studies have related metformin to the reduced risk of cholangiocarcinoma (CCA), highlighting its potentialities for the treatments of CCA. However, the underlying molecular mechanisms remain elusive. Here, we demonstrated that metformin treatment could inhibit proliferations of the human CCA cell lines Mz-ChA-1 and QBC939 in dose-dependent manners. The NMR-based metabonomic analyses showed distinct discriminations between the metformin-treated (Met) and control (Ctrl) groups of both CCA cells. Characteristic metabolites were identified by a combination of multivariate statistical analysis of 1D 1H-NMR spectral data and the pair-wise t-test of metabolite levels. We then identified four significantly altered metabolic pathways based on the characteristic metabolites, including glucose metabolism, oxidative stress-related metabolism, energy metabolism, and amino acids metabolism. Comparing CCA cells with normal human umbilical vein endothelial cells (HUVECs), we found that metformin treatment profoundly promoted glycolysis and specifically increased the levels of BCAAs and UDP-GlcNAc, implying the occurrence of autophagy and cell cycle arrest in metformin-treated CAA cells. This work provides a mechanistic understanding of the anticancer effect of metformin treatment on CAA cells, and is beneficial to further developments of metformin as an anticancer drug.
Introduction
Background
Cholangiocarcinoma (CCA) is the second most common hepatic and biliary malignancy (1). Based on its anatomical location, CCA can be classified into intrahepatic, extrahepatic and distal CCA (1, 2). Although CCA is considered as an uncommon tumor and only accounts for 3% of all gastrointestinal tumors, the overall incidence rate of CCA has remarkably climbed in last several decades (3, 4). Surgical intervention offers the highest chance to cure for all types of CCA. Unfortunately, individuals with CCA are usually asymptomatic, and most of patients diagnosed with CCA can no longer benefit from surgical resection (4), leading to poor outcomes. Even when surgery is an option for selected patients, the 5-year survival rates are still very low. Both systemic chemotherapy and targeted radiation therapy have been also applied for the treatments of CCA. Nevertheless, these approaches usually fail to efficiently improve the prognosis of CCA (3). Thus, new therapy strategies are urgently needed for CCA.
As the most widely used first-line drug for the treatment of type 2 diabetes, metformin (N, N-dimethyl biguanide) has recently gained interests of investigators for its anticancer potentials. According to recent epidemiological data, cancer risk in diabetic patients taking metformin is significantly reduced relative to patients with other antidiabetic treatments (5–8). Moreover, numerous studies have reported that metformin has anticancer effects both in vivo and in vitro on various human cancers including CCA (9–13). These evidences indicate that metformin might have great potentials for CCA prevention and therapy.
As reported recently, metformin treatment can reduce the levels of mitochondrial metabolites, activate multiple mitochondrial metabolic pathways, and increase 18-FDG flux in breast tumors (14). Moreover, metformin can inhibit mitochondrial complex I and disrupt oxidative phosphorylation, thus resulting in alterations in the electron transport chain (ETC) (15, 16). The inhibition of complex I also causes energetic stress, then enhancing the activity of AMP-activated protein kinase (AMPK) (17, 18). Furthermore, metformin can activate AMPK through the lysosomal pathway, and the anticancer effect of metformin treatment might be not mere a consequence of disrupting metabolic processes such as ATP synthesis through oxidation phosphorylation (19). In addition, previous works also indicate that metformin exerts anticancer capacities by inhibiting the mammalian target of rapamycin (mTOR) through AMPK-dependent and AMPK-independent mechanisms (20, 21). However, molecular mechanisms underlying the anticancer effect of metformin treatment on CCA remain to be detailedly clarified.
Metabolomic analysis has been extensively applied to clarify molecular mechanisms of anticancer drugs (22–24). As metabolites are the final downstream products of gene transcription and translation, variations in metabolite levels reflect systemic changes of biological states. Several complicated signaling pathways could simultaneously bring out alterations in a metabolic pathway. Therefore, a comprehensive metabolomic analysis is of great significance for elucidating the molecular mechanisms of metformin for the treatments of CCA.
As two most efficient detection techniques, mass spectrometry (MS) and nuclear magnetic resonance (NMR) spectroscopy are frequently used in metabolomic analyses. Despite NMR spectroscopy shows lower sensitivities than MS, it offers many unique advantages (25). NMR possesses the capacity of readily identifying and conveniently quantifying absolute levels of compounds present in biological samples, including the compounds which are difficult either to be ionized or are required for derivatization to conduct MS detections. In addition, NMR is a method of choice for the identification of compounds with identical masses, including those with different isotopomer distributions (25, 26). Thus, we took advantage of NMR to perform metabolomic analyses.
In the present work, we demonstrated that metformin treatment profoundly suppressed proliferations of two human CCA cell lines (MZ-CHA-1 and QBC939) in dose-dependent manners. By performing NMR-based metabonomic analyses on cellular extracts, we indicated that metformin treatment induced marked variations in metabolic profiles and remarkable changes in metabolite levels as well as significant alterations in metabolic pathways for both CCA cells. Moreover, certain metabolite levels exhibited different changing trends between the CCA cells and normal human umbilical vein endothelial cells (HUVECs) after metformin treatment. These results shed new light on the molecular mechanisms of the anticancer effect of metformin treatment on CCA cells.
Materials and Methods
Cell Lines and Culture
Two typical human CCA cell lines MZ-CHA-1 and QBC939 were used in this work. MZ-CHA-1 was properly conserved in our laboratory, and QBC939 was obtained from Third Military Medical University. Both CCA cells were cultured in RPMI 1640 supplemented with 10% fetal bovine serum (FBS, Gemini, USA), 100 U/ml penicillin, and 100 U/ml streptomycin. Known as normal epithelial cells, primary HUVEC cells were isolated from the umbilical cord of a neonate as described previously (27), cultured in endothelial cell medium (ECM; ScienCell, USA), supplemented with 5% FBS, 1% endothelial cell growth supplement (ECGS; ScienCell, USA), 100 U/ml penicillin, and 100 U/ml streptomycin. All the cells were cultured in a 5% CO2 humidified environment at 37°C.
Cell Viability Assay
The cell viability assay was performed on both CCA cells using a CellTiter 96® AQueous One Solution Cell Proliferation Assay Kit (Promega, USA) according to the recommendations of the manufacturer. The cells were seeded in 96-well plates (5 × 10³ per well). After 12 h, the medium was replaced with test medium containing various concentrations of metformin (0.05, 0.5, 2, 5 mM), and the cells were incubated for a further 48 h. Then, 20 μl of MTS solution was added to each well. After 4 h incubation in dark, the absorbance of formazan was measured at a wavelength of 490 nm on a microplate reader (BioTek, USA). Statistical results were presented as the mean ± SEM. To compare cell viabilities between the four metformin-treated (Met) groups and the control (Ctrl) group of the CCA cells, we analyzed the data with ONE-WAY ANOVA followed by multiple post-hoc comparisons (Bonferonni/Tukeys) using the GraphPad Prism program (Version 6, GraphPad Software, USA).
Colony Formation Assay
Both CCA Cells were planted into 6-well plates at a density of 1,000 cells per well and treated with test medium containing various concentrations of metformin for 7–14 days. Colonies were fixed with 4% paraformaldehyde for 20 min, and stained with 0.5% crystal violet in 20% ethanol for 30 min. The plates were washed with water for 3 times and photographed with camera. The Image J software (Version 1.52a, National Institutes of Health, USA) was used to calculate grey value in each well. The colony formation rates were calculated and analyzed by ONE-WAY ANOVA using GraphPad Prism.
Sample Preparation
Both CCA cells were seeded in 10 cm diameter culture dishes at a density of 1×10⁶ per dish and treated with or without 0.5 mM metformin. After 48 h of incubation, the cells reached 80–90% of confluence, and the difference in the number of cells between the Met group and Ctrl group was less than 10%. Before harvest, medium was removed and cells were quickly washed by ice-cold PBS for 3 times. Vacuum suction was used to remove any residual liquid. Then, 3.0 ml of cold methanol was immediately added into the culture dish, and the cells were scraped, collected and transferred into a centrifuge tube. Thereafter, 3.0 ml of cold chloroform and 2.5 ml of water were subsequently added to the tube, and the mixture was fully vortexed. After 30 min of laying aside, samples were centrifuged at 12,000 g for 15 min at 4°C to separate two phase extracts. The aqueous phase was condensed with nitrogen stream and lyophilized by a vacuum freezing dryer.
The lyophilized aqueous metabolite extracts were dissolved in 550 μl of NMR buffer containing 50 mM K2HPO4/NaH2PO4 (pH 7.4), 0.05 mM sodium 3-(trimethylsilyl)-propionate-2,2,3,3-d4 (TSP), 10% D2O, and 0.02% NaN3. D2O was used for a field-frequency lock, and TSP provided the chemical shift reference. All the samples were vortexed, centrifuged at 12,000 g for 15 min at 4°C to remove any insoluble components. Supernatants were transferred to 5 mm NMR tubes for further analysis. Four groups of the CCA cells were used in the following NMR measurements including metformin-treated MZ-CHA-1 cells (Met-Mz) and QBC939 cells (Met-939) and untreated controls (Ctrl-Mz, Ctrl-939), together with metformin-treated HUVEC cells and untreated controls (Met-Hv, Ctrl-Hv).
Nuclear Magnetic Resonance Measurements and Data Processing
NMR experiments were conducted on a Bruker Avance III 850MHz spectrometer equipped with a TCI cryoprobe (Bruker BioSpin, Rheinstetten, Germany) at 298 K. One dimensional (1D) 1H NOESY spectra were acquired using the pulse sequence (RD-90°-t1-90°-τm-90°-ACQ) with water suppression during the relaxation delay and mixing time (19). RD was the relaxation delay (4 s), t1 was a short delay (4μs), and τm was the mixing time (10 ms). The spectral width was 20 ppm with an acquisition time per scan of 1.88 s (ACQ), and a total of 128 transients were collected into 64 K data points for each spectrum. The free induction delay (FID) signal was processed by a window function with a line broadening of 0.3 Hz, followed by Fourier transformation to obtain 1D 1H spectra. To assist in resonance assignments of metabolites, two-dimensional (2D) NMR spectra were recorded including 1H-13C heteronuclear single quantum coherence (HSQC) and 1H-1H total correlation spectroscopy (TOCSY) spectra.
The TopSpin 3.5 software (Bruker Biospin, Germany) was used to perform phase and baseline corrections of the NMR spectra. Chemical shifts were referenced to the CH3 resonance of TSP at 0 ppm. Peak alignments were further manually carried out with MestReNova Version 9.0 (Mestrelab Research S.L., Espain). Spectral regions of δ 9.40-(-0.5) were binned by 0.001 ppm and integrals of the segments were calculated. Regions of residual water resonances at δ 5.2–4.6 were removed to eliminate the distorted baselines from imperfect water saturation.
Integrals were normalized by the integral area of TSP to make the data directly comparable between the NMR spectra. Then, probabilistic quotient normalization (PQN) was performed to compensate for dilution-independent effects in MATLAB (Version 2011b, Math Works, USA).
Resonance Assignments of Cellular Metabolites
Resonance assignments of aqueous metabolites were conducted using a combination of Chenomx NMR Suite (Version 8.1, Chenomx Inc., Edmonton, Canada) and Human Metabolome Data Base (HMDB) (http://www.hmdb.ca/) as well as relevant published references. For each cluster of a given metabolite, we compared the shape of the Chenomx preview spectral line (preview line) and the experimental 1D 1H spectral line (Exp line). Under the condition that the preview line was substantially contributing to the Exp line in the displayed region, and also the Exp line was similar to the standard 1D 1H spectral lines provided by Chenomx NMR Suite, the metabolite was assigned to be the compound in the Chenomx Compound Table.
The resonance assignments were further confirmed based on 2D 1H-1H TOCSY and 1H-13C HSQC spectra together with the standard 1H-1H TOCSY and 1H-13C HSQC spectra provided by Human Metabolome Data Base. For metabolites with highly overlapping peaks, non-overlapping peaks were selected to accurately calculate their spectral integrals. GraphPad Prism was used to calculate the averages and standard errors of metabolite levels.
Multivariate Statistical Analysis and Identification of Significant Metabolites
The normalized spectral data were scaled by Pareto scaling and objected to the SIMCA-P 14.0 software (Umetrics, Sweden) for multivariate statistical analysis. An unsupervised approach, principal component analysis (PCA) was performed to reveal the trends, highlight outliers, and show clusters among the samples. A supervised approach, partial least-squares discriminant analysis (PLS-DA) was subsequently conducted to improve the classification between the groups of samples. Cross-validation was performed with a random permutation test (999 cycles) to evaluate the robustness of the PLS-DA model. The model is considered credible if all the Q2-values on the left are lower than the original point at the right, and the regression line of the Q2-points intersects the vertical axis below zero.
Two criteria derived from the PLS-DA loading plot were used to identify significant metabolites primarily responsible for the metabolic discrimination: variable importance in the projection (VIP), and the correlation coefficient (r) of the variable relative to the first predictive component (tp1). The loading plot was reconstituted in MATLAB. The critical value of the correlation coefficient (r) was defined based on the degree of freedom (df), which were determined as n1+n2-2 with n1 and n2 as the respective number of samples of the two groups in the PLS-DA model. Variables with VIP >1 and |r|> the critical value of p = 0.01 were marked by red color; variables with VIP >1 and |r| between the critical values of p = 0.05 and p = 0.01 were marked by orange; variables with VIP ≤1 or |r|< the critical value of p = 0.05 were marked by blue. Variables colored in red and orange were related to significant metabolites.
Furthermore, hierarchical cluster analysis (HCA) with Pearson distance measure and Ward clustering algorithm was performed on the normalized NMR data to further confirm the metabolic clusters, using the module of Statistical Analysis provided by the MetaboAnalyst webserver 4.0 (http://www.metaboanalyst.ca/). In the HCA approach, each sample acted as a separate cluster initially and the algorithm proceeded to combine them until all samples belong to one cluster.
Univariate Statistical Analysis and Identification of Differential Metabolites
Pair-wise student’s t-test was applied to quantitatively compare relative levels of metabolites between the Met and Ctrl groups. Metabolites with p <0.05 were identified to be differential metabolites. Characteristic metabolites were determined by a combination of the identified differential metabolites and the significant metabolites described above.
Metabolic Pathway Analysis and Identification of Significant Pathways
Metabolic pathways were analyzed based on the characteristic metabolites using the module of Metabolites Set Enrichment Analysis (MSEA) provided by MetaboAnalyst 4.0. MSEA is extensively used to identify and interpret patterns of metabolite level changes in a meaningful context (28), which contains 88 metabolite sets functionally related to metabolic pathways. The statistical p value was calculated to evaluate the significance of the metabolic pathway. The metabolic pathway containing at least three enriched metabolites with p <0.05 was identified to be the significantly altered pathway (abbreviated as significant pathways).
Results
Metformin Inhibited Proliferations of Both CCA Cells in Dose-Dependent Manners
To address the anticancer effect of metformin treatment on CCA, we conducted MTS assays and colony formation assays on both human CCA cells (MZ-CHA-1 and QBC939). The CCA cells were treated with various concentrations of metformin for both assays. MTS assays showed that metformin reduced cell viabilities in dose-dependent manners (Figures 1A, B). Moreover, relative cell viabilities were significantly decreased to 80–90% when the two CCA cells were treated with 0.5 mM metformin for 48 h. Such a treatment allowed the difference in the cell number between the Met and Ctrl groups was less than 10%. Our preliminary experiments showed that harvesting the two CCA cells at 48h provided maximum metabolite concentrations with smaller experimental errors. In colony formation assays, additionally, metformin at either 0.5 or 5 mM profoundly decreased the dimensions of colonies (Figures 1C–F). Thus, we treated the two CCA cells with metformin for 48 h in the following NMR-based metabonomic analyses.
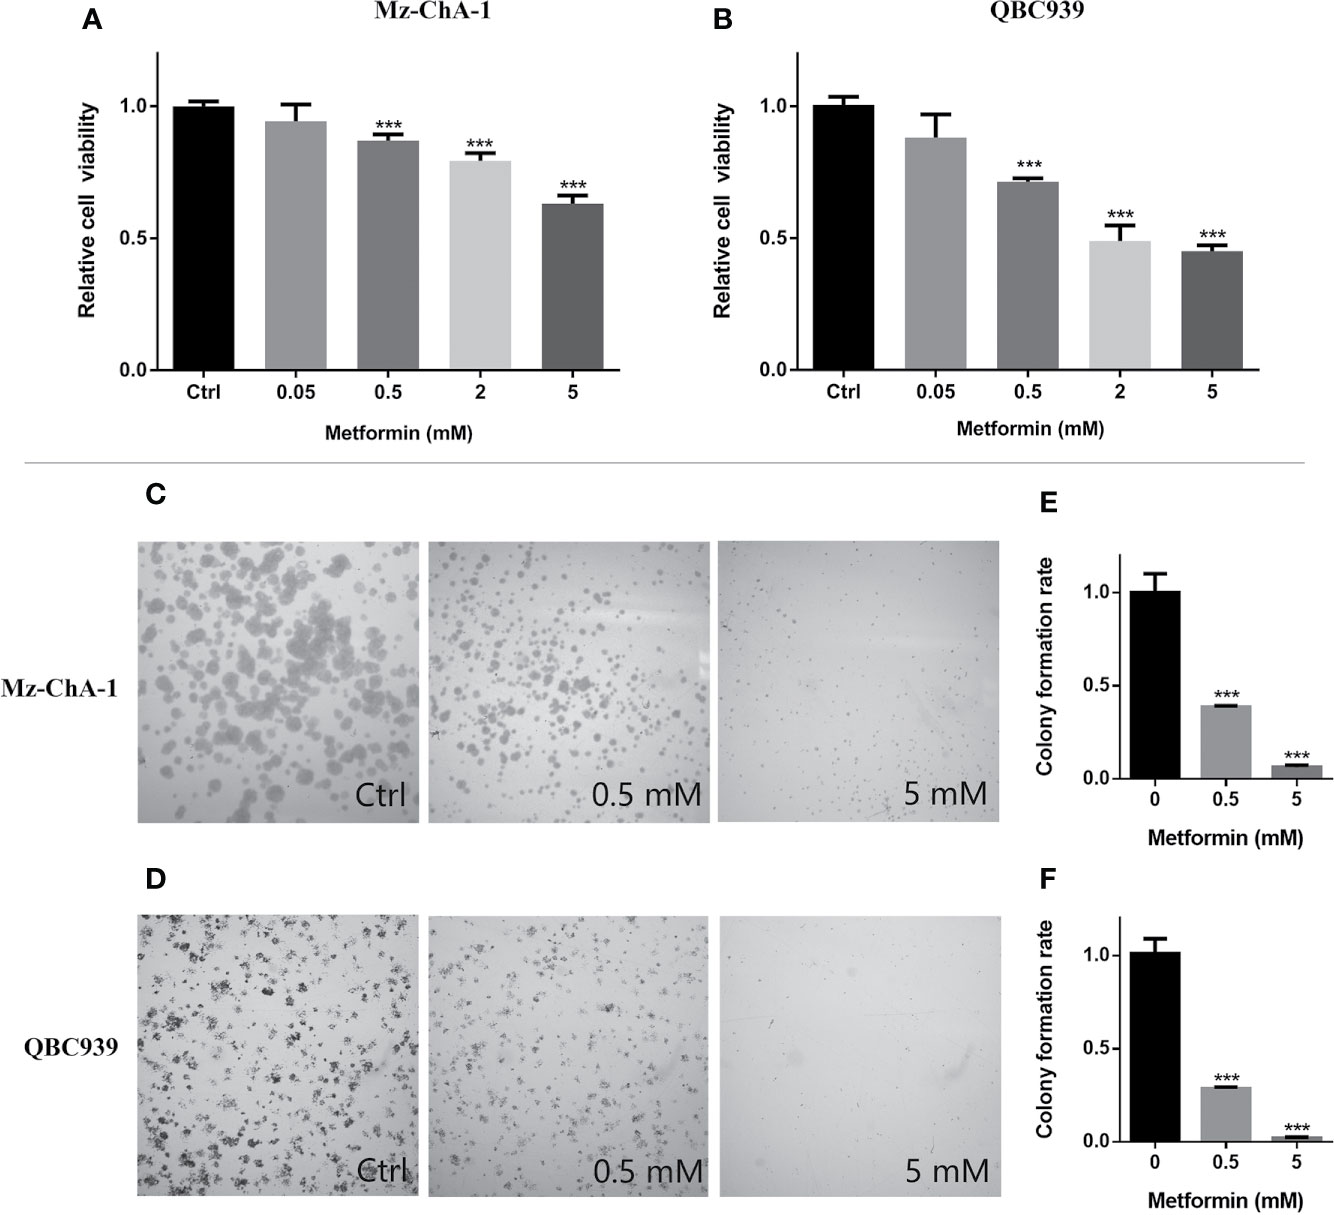
Figure 1 Metformin inhibited proliferations of both human cholangiocarcinoma (CCA) cells in dose-dependent manners. (A, B) Relative viabilities of the MZ-ChA-1 cells (A) and QBC939 cells (B) after 48 h incubation with various concentrations of metformin. n = 10, ***p < 0.001 relative to control cells. (C, D) Colony formations of MZ-ChA-1 cells (C) and QBC939 cells (D) before and after metformin treatment. (E, F) Quantification of colony formation rates of MZ-ChA-1 cells (E) and QBC939 cells (F). n = 3, ***p < 0.001 relative to control cells.
Metformin Markedly Changed Metabolic Profiles of Both CCA Cells
To reveal metabolic distinctions between the Met and Ctrl groups, we performed NMR-based metabonomic analyses on aqueous extracts derived from both CCA cells. The typical 1D 1H NOEYS spectra are shown in Figure 2. Resonance assignments of cellular metabolites were conducted (Table 1), and further confirmed by 2D 1H-13C HSQC and 2D 1H-1H TOCSY spectra (Figure S1). Totally, 41 metabolites were identified based on the NMR spectra.
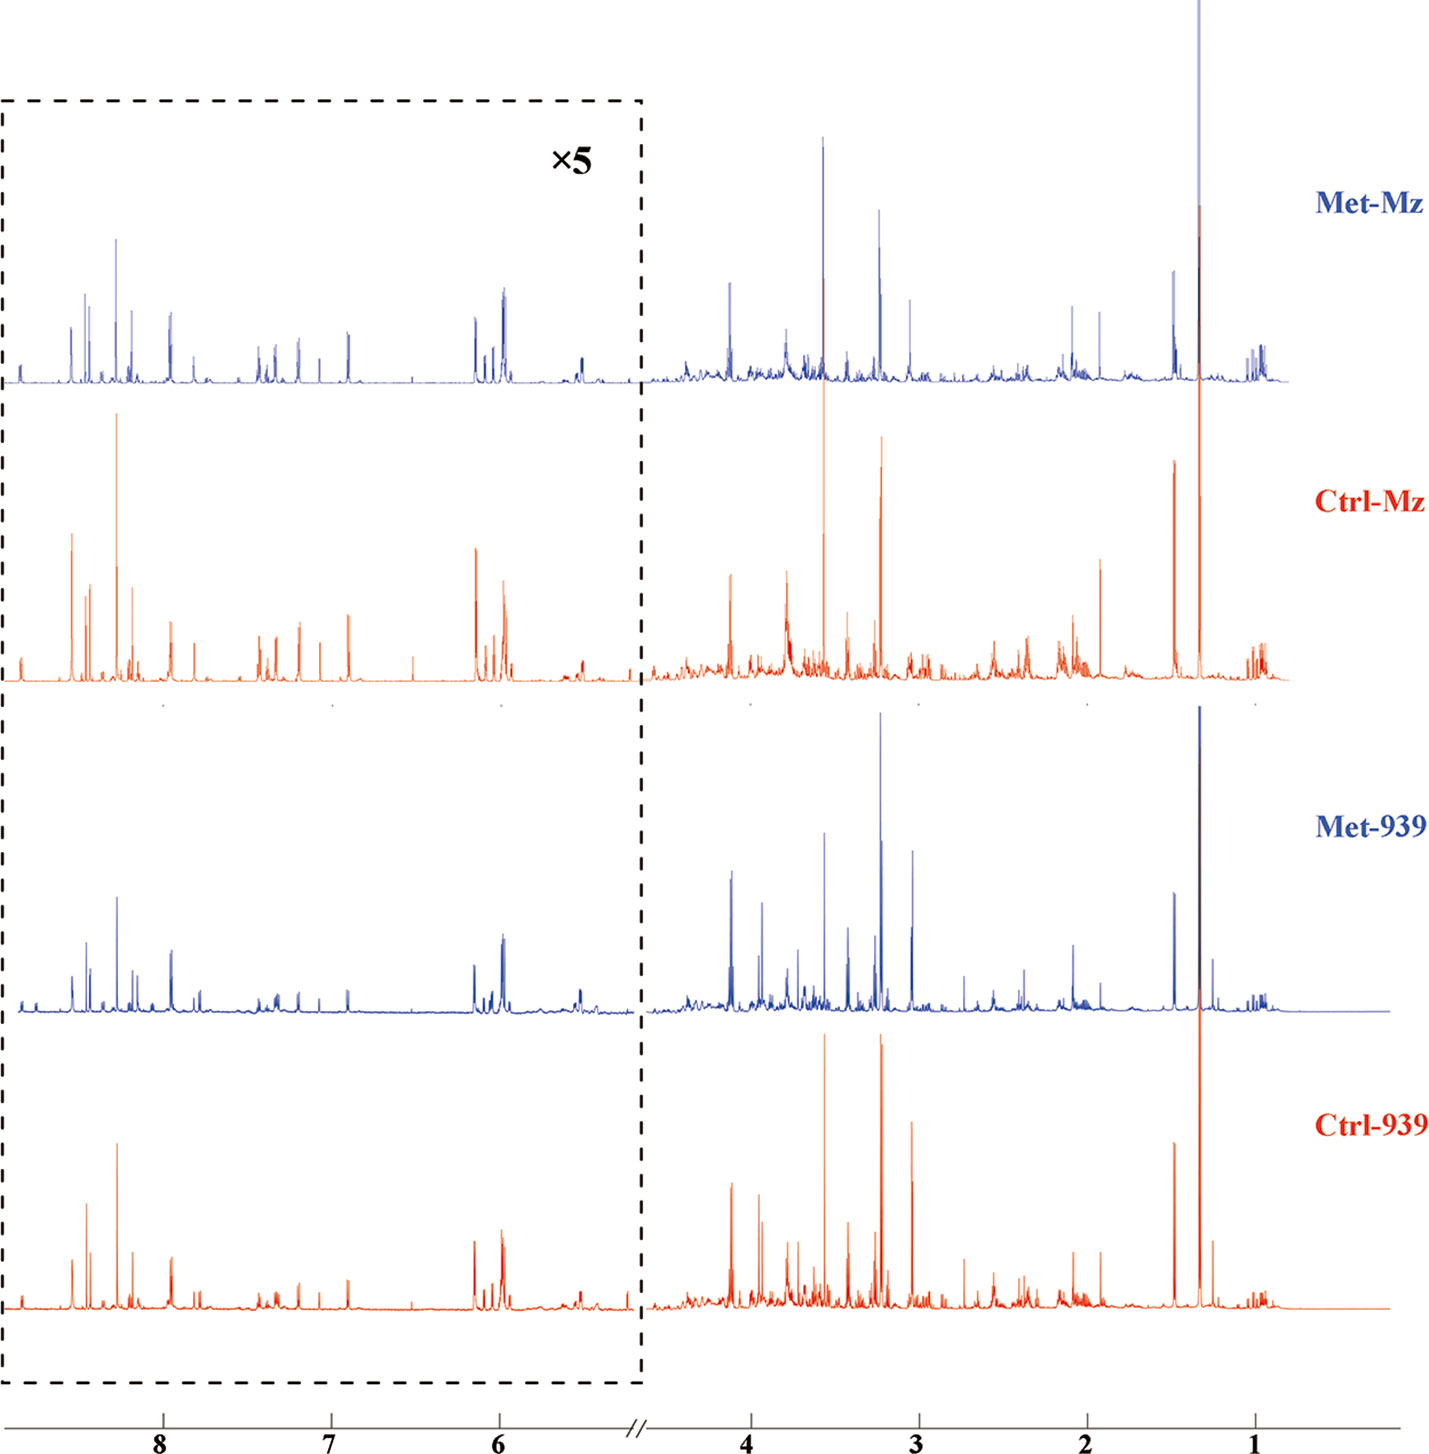
Figure 2 Averaged 1D 1H NOESY spectra of aqueous metabolites derived from the metformin-treated and control groups of both CCA cells. Spectral regions of 1.0–4.6 and 5.2–9.0 ppm were reserved, and the water region (4.6–5.2 ppm) was removed. Spectral regions of 5.2–9.0 ppm were scaled for 5 times. Met-Mz and Met-939 represent the groups of metformin-treated Mz-ChA-1 cells and QBC939 cells with metformin treatment, respectively. Ctrl-Mz and Ctrl-939 stand for the groups of Mz-ChA-1 cells and QBC939 cells without metformin treatment, respectively.
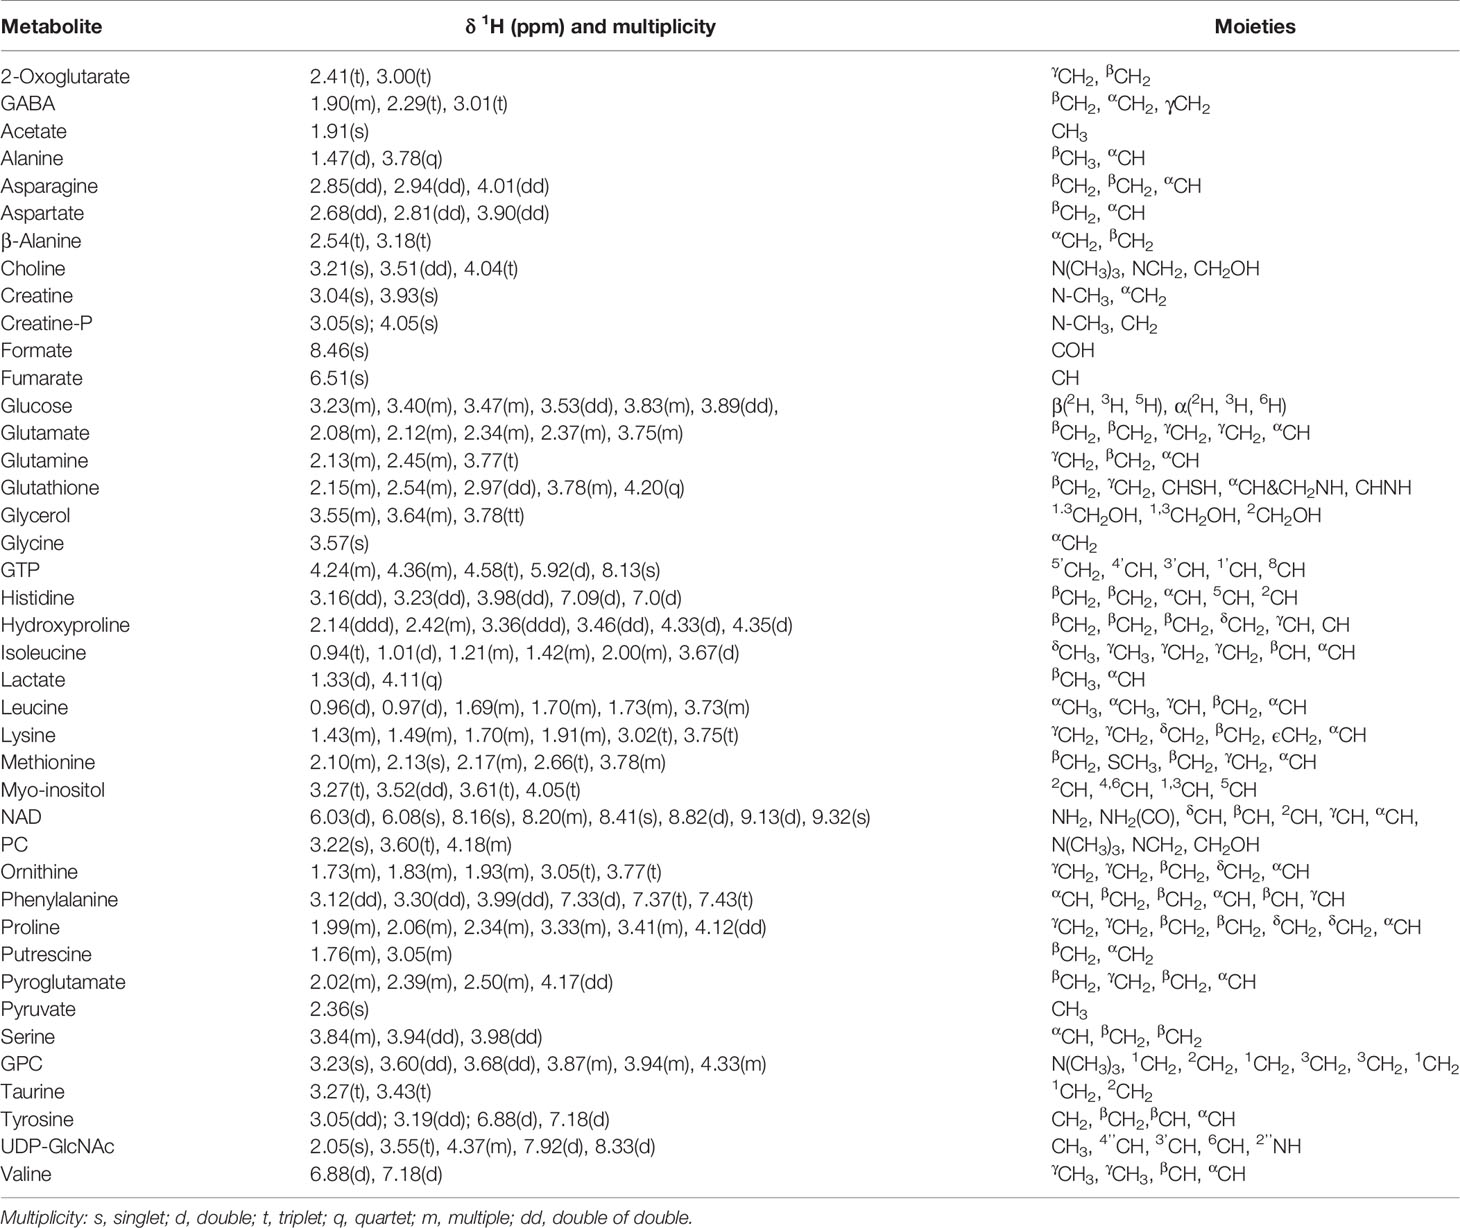
Table 1 Resonance assignments of metabolites identified from 1D 1H-NMR spectra of aqueous extracts derived from the Met and Ctrl groups of both CCA cells.
Both PCA and PLS-DA of the normalized NMR data were performed to evaluate the effects of metformin treatment on metabolic profiles of the CCA cells. All the samples are situated in the Hotelling’s T2 oval of the 95% confidence intervals. In the scores plot of either the PCA model or the PLS-DA model, each point represents a sample, and the distance between points reflects the degree of metabolic distinction. The PCA scores plots show distinct separations of the Met-Mz and Met-939 groups from Ctrl-Mz and Ctrl-939 groups, respectively, suggesting that metformin treatment markedly changed the metabolic profiles of both CCA cells (Figures 3A, B). The PLS-DA scores plots display improved metabolic separations of the Met-Mz and Met-939 groups from the Ctrl-Mz and Ctrl-939 groups (Figures S2A, B). The cross-validation plots indicate the high reliabilities of the PLS-DA models for both CCA cells (Figures S2C, D). Additionally, we conducted the HCA analyses to confirm the validities of the PCA and PLS-DA models (Figures S2E, F). The dendrogram plot of HCA illustrates that the Met-Mz group forms a separate cluster, while the Ctrl-Mz group belongs to another cluster (Figure S2E). The QBC939 cells displayed the similar HCA plot (Figure S2F). This result well supported those from PCA and PLS-DA.
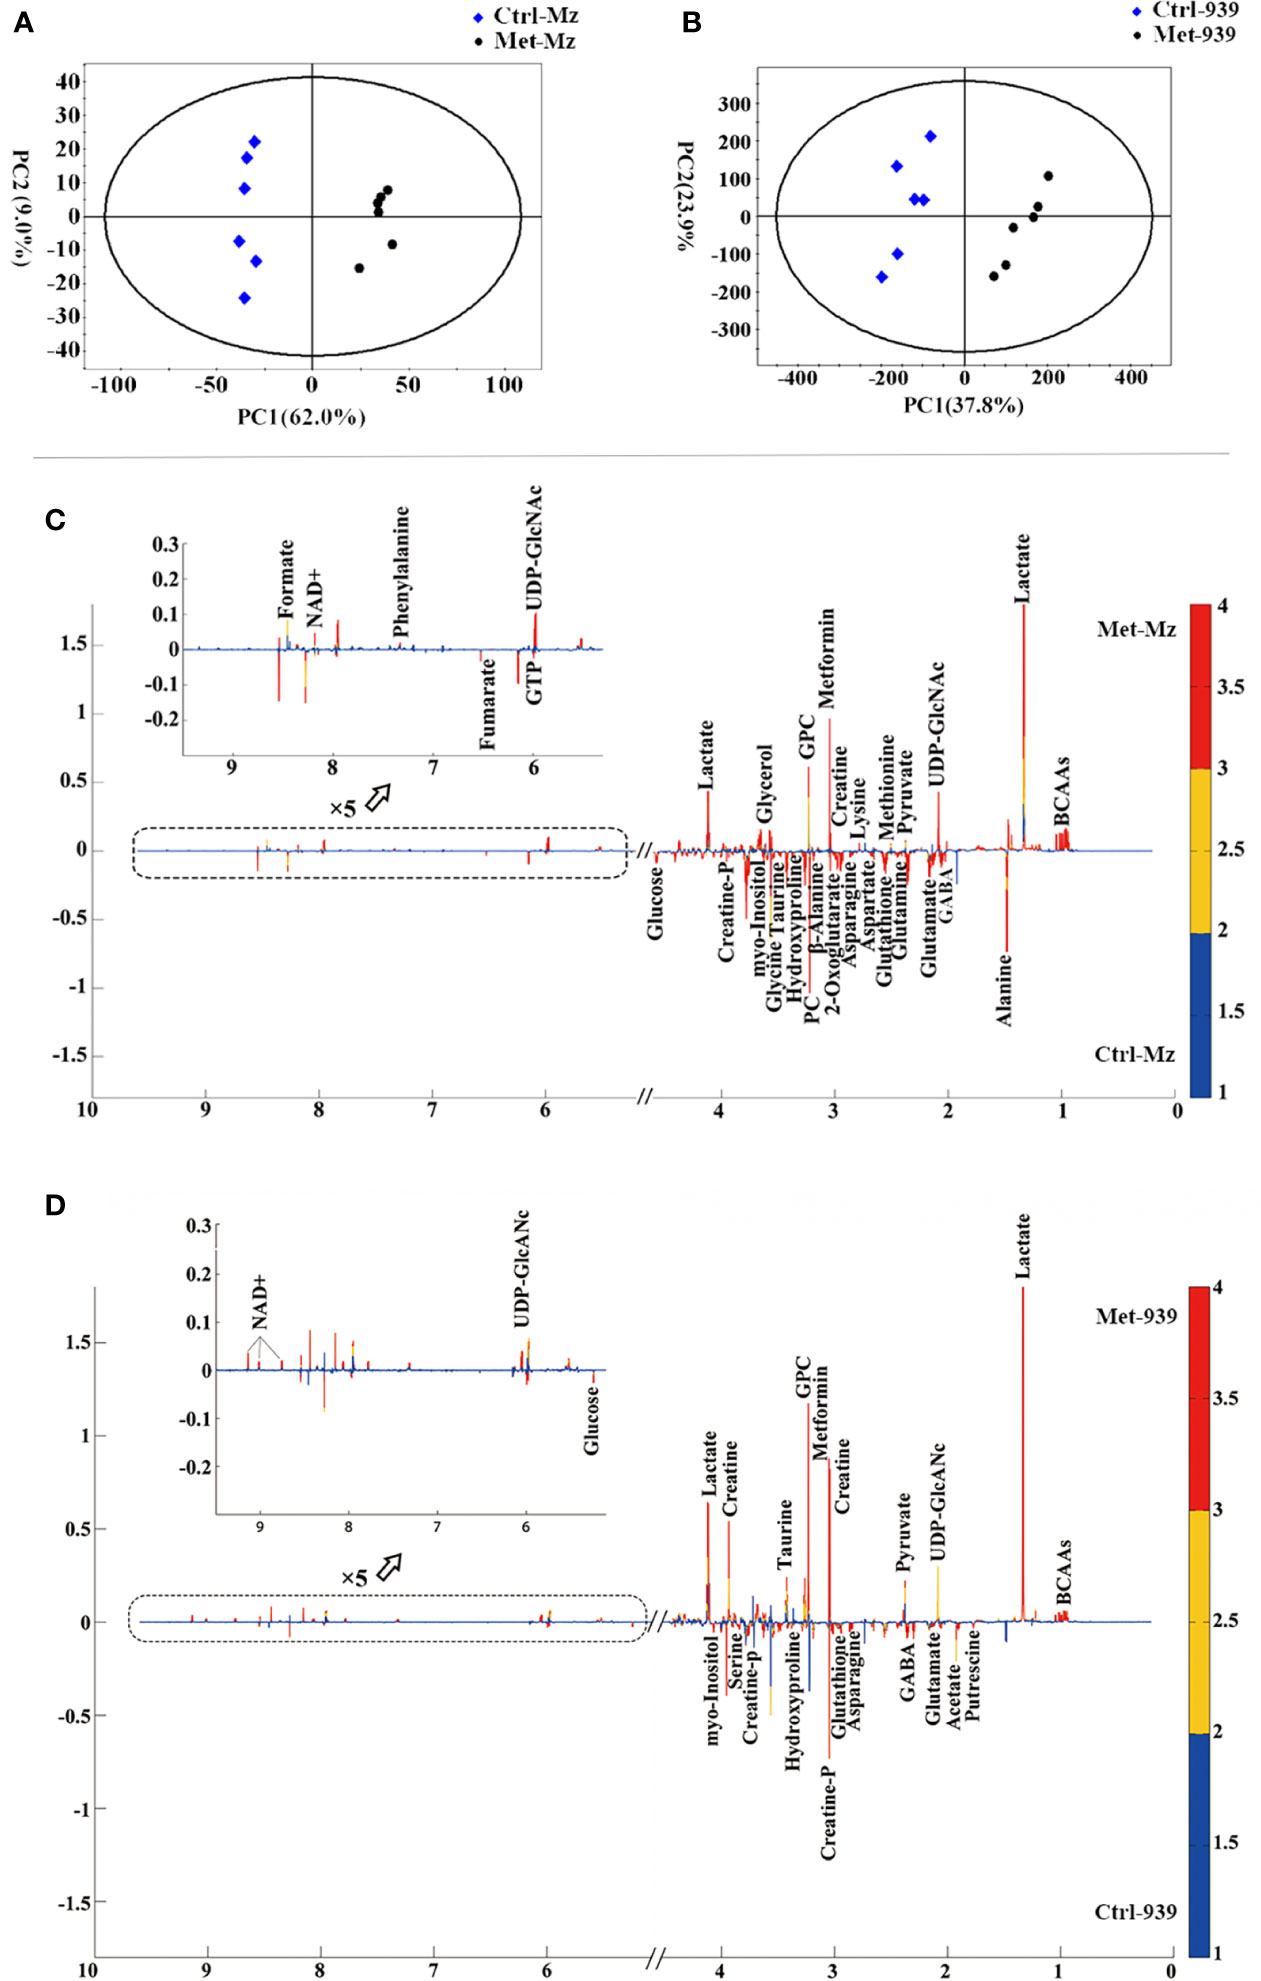
Figure 3 Multivariate statistical analysis of nuclear magnetic resonance (NMR) spectral data derived from aqueous extracts of the Met and Ctrl groups of both CCA cells. (A, B) PCA scores plots of the Met-Mz vs. Ctrl-Mz groups (A), and the Met-939 vs. Ctrl-939 groups (B); (C, D) Partial least-squares discriminant analysis (PLS-DA) loading plots for identifying significant metabolites primarily contributing to metabolic discriminations of the Met-Mz group from Ctrl-Mz groups (C), and the Met-939 group from. the Ctrl-939 group (D).
Metformin Profoundly Changed Metabolite Levels in Both CCA Cells
In the loading plots of the PLS-DA models (Figures 3C, D), variables colored in red, yellow, and blue are very significant, significant, and insignificant respectively, the upward or downward direction indicates the variable was upregulated or downregulated in the Met group compared with that in the Ctrl group. Expectedly, the levels of metformin were significantly increased in the Met-Mz and Met-939 groups relative to Ctrl-Mz and Ctrl-939, respectively, indicating that extracellular metformin was transported into both CCA cells. Significant metabolites were identified which were primarily responsible for metabolic separations of the Met-Mz and Met-939 groups from Ctrl-Mz and Ctrl-939 groups, respectively. After metformin treatment, 14 metabolites were increased and 18 metabolites were decreased in Mz-ChA-1 cells, while 10 metabolites were increased and 11 metabolites were decreased in QBC939 cells.
Relative levels of metabolites were represented by relative integrals measured from 1D 1H NOESY spectra. Quantitative comparisons of relative levels of metabolites between the Met-Mz and Ctrl-Mz groups, and between the Met-939 and Ctrl-939 groups were performed by using univariate statistical analysis (pair-wise student’s t-test), as shown in Table 2. Metabolites with statistical significances (p < 0.05) were identified to be differential metabolites. Totally, we identified 33 and 30 differential metabolites in Mz-ChA-1 and QBC939 cells, respectively.
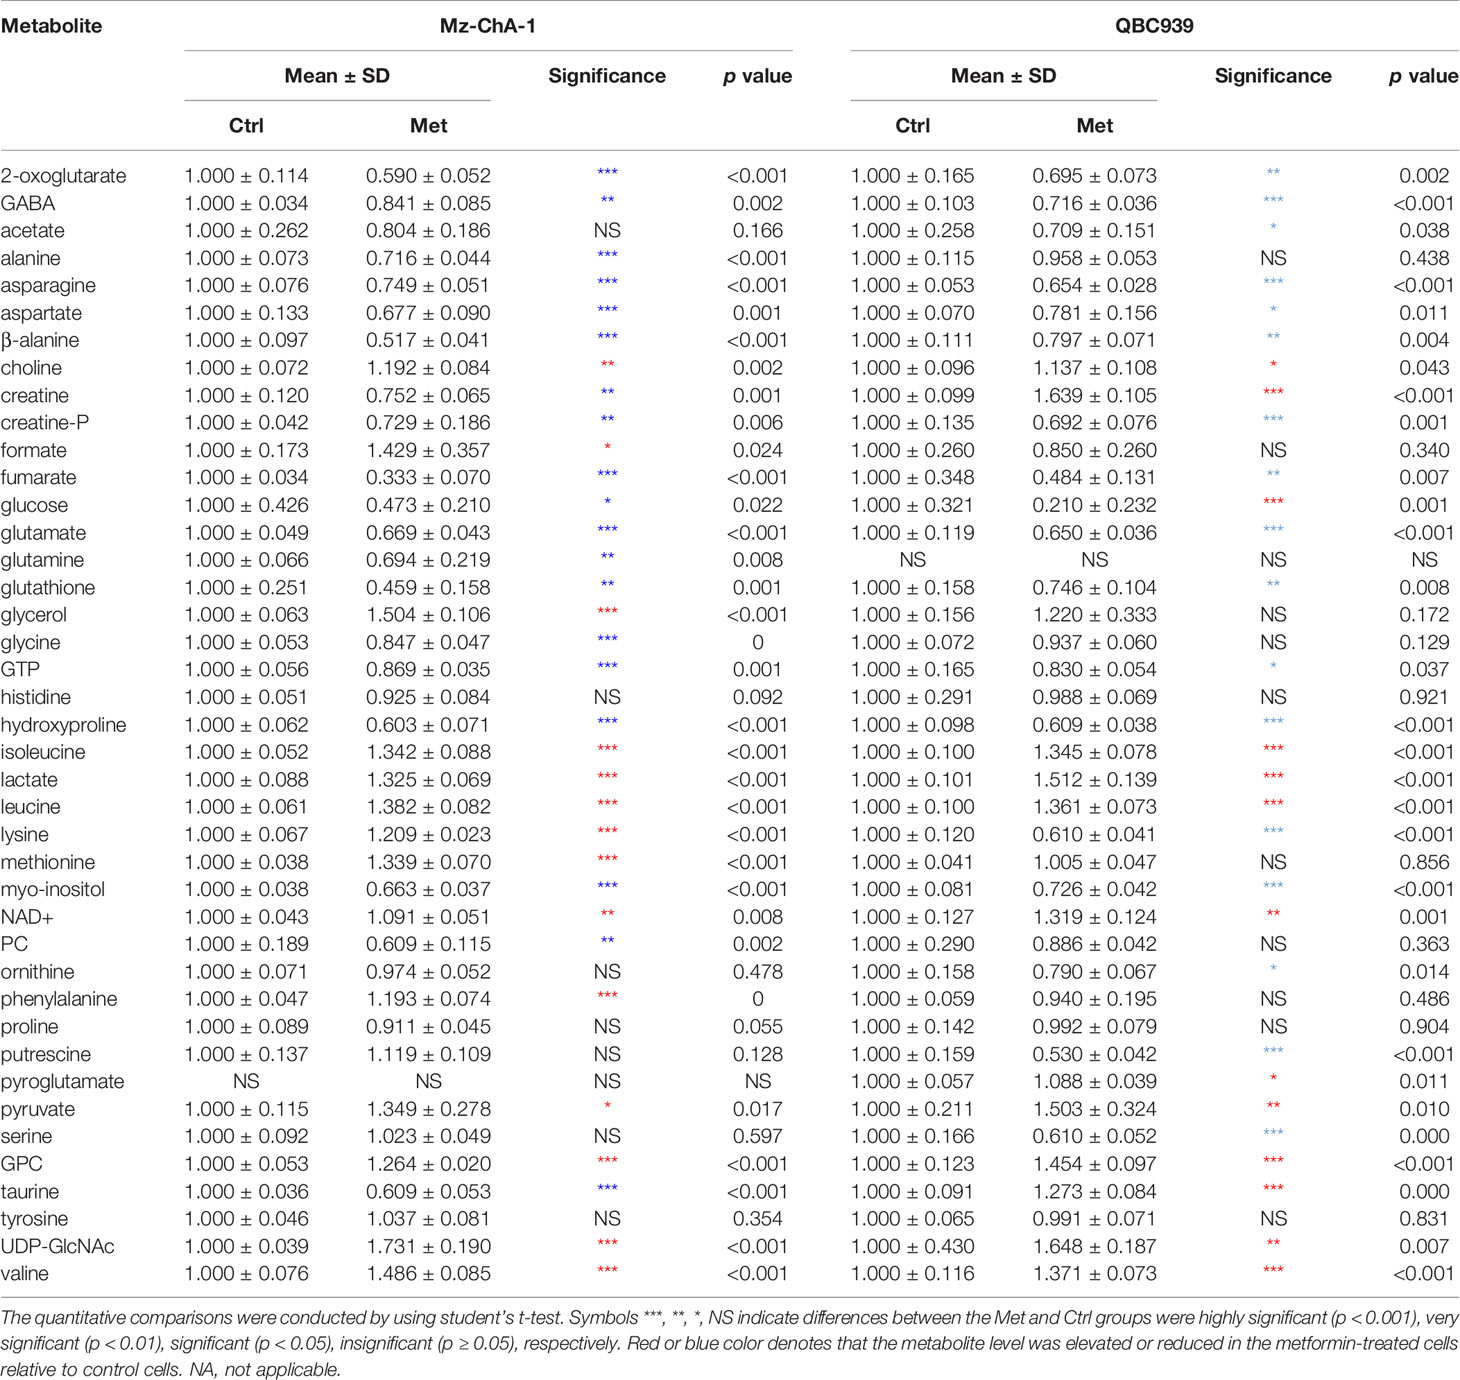
Table 2 Quantitative comparisons of metabolite levels between the Met and Ctrl groups of both CCA cells based on relative integrals calculated from the 1D 1H-nuclear magnetic resonance (NMR) spectra.
Metformin Affected Similar Metabolic Pathways in Both Cholangiocarcinoma Cells
Combining the identified differential metabolites with the significant metabolites described above, we obtained 32 and 29 characteristic metabolites in the Met-Mz and Met-939 cells compared with their controls, respectively. The characteristic metabolites were then subjected to metabolic pathway enrichment analysis. Top 50 enriched pathways are shown in Figure 4. The ranking of enriched metabolic pathways in the Met-Mz cells was highly similar with the Met-939 cells, and the pathways with higher significances were closely related to four major metabolic pathway clusters, including glucose metabolism, oxidative stress-related metabolism, energy metabolism, and amino acids metabolism. Metformin-induced level changes of characteristic metabolites involved in the four major metabolic pathway clusters were quantified for Met-Mz vs. Ctrl-Mz, and Met-939 vs. Ctrl-939 (Figure 5). Most metabolite levels exhibited consistent changing trends in the two CCA cells. The metformin-treated CCA cells showed upregulated levels of pyruvate, lactate and NAD+, and downregulated levels of glucose, GTP and TCA cycle intermediates (2-oxoglutarte; fumarate). Furthermore, most of the detected non-essential amino acids were decreased, and some of the detected essential amino acids (methionine, phenylalanine, valine, leucine, and isoleucine) tended to be increased in the metformin-treated CCA cells. These results suggest that metformin treatment has similar effects on the two CCA cell lines.
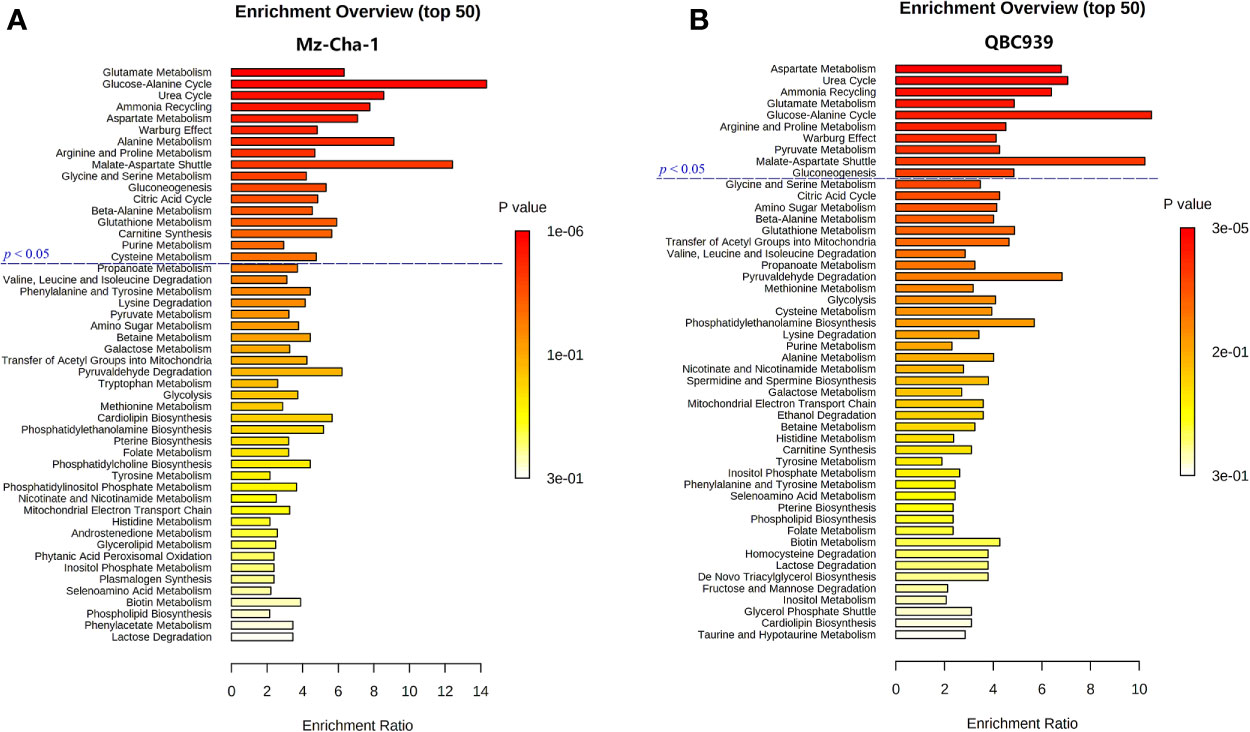
Figure 4 Metabolic pathways altered by metformin treatment in both CCA cells. (A, B) Top 50 metabolic pathways derived from metabolite sets enrichment analyses based on characteristic metabolites identified in MZ-ChA-1 cells (A) and QBC939 cells (B).
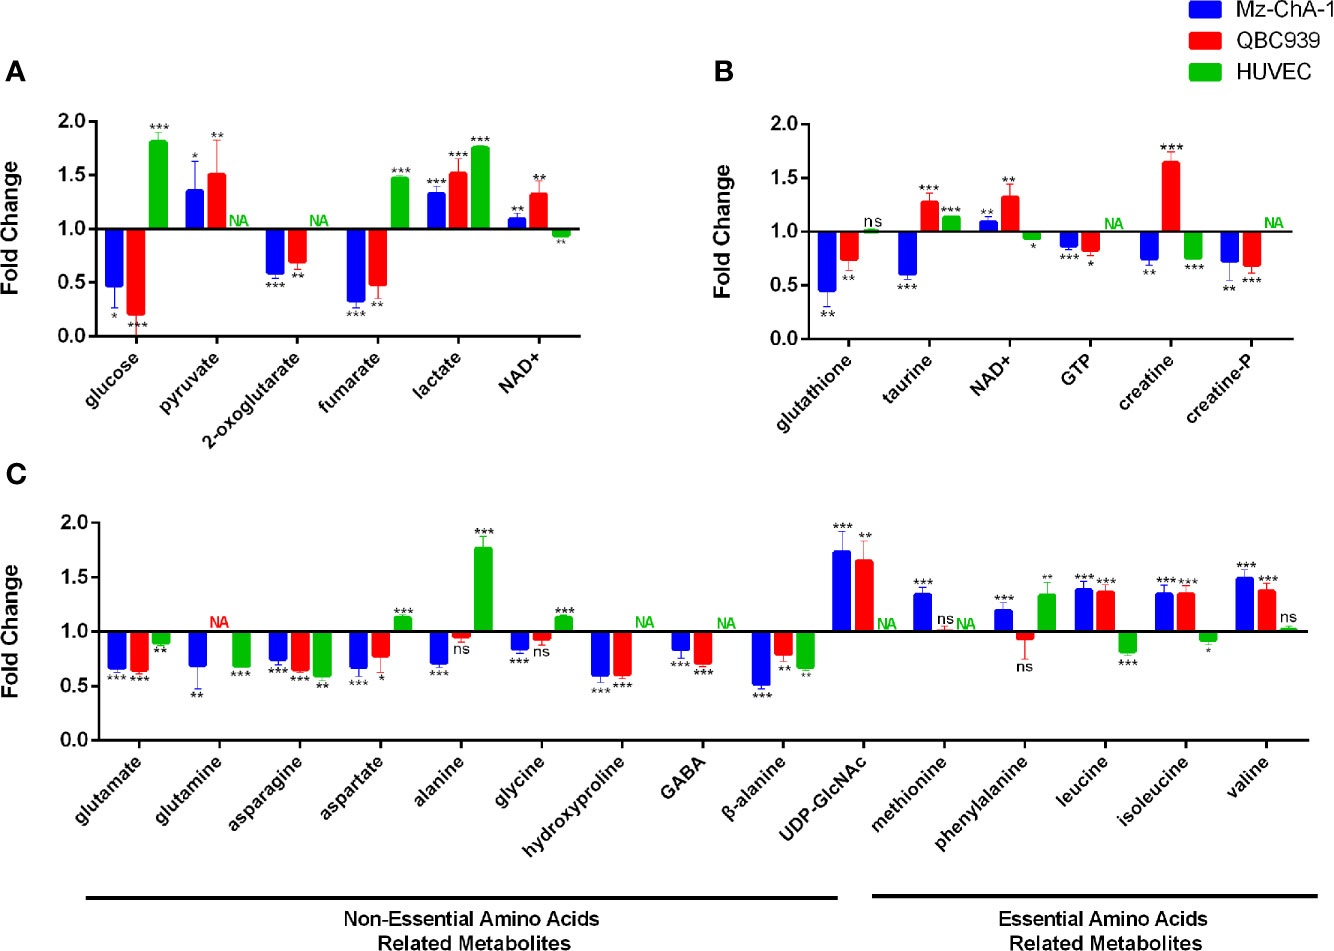
Figure 5 Metabolite levels in metformin-treated MZ-ChA-1, QBC939 and human umbilical vein endothelial cells (HUVEC) cells relative to their untreated controls. (A–C) Metabolites involved in glucose metabolism (A), energy metabolism and oxidative stress-related metabolism (B), and amino acids metabolism (C).
Metformin Differently Affected the Levels of Certain Metabolites in Cholangiocarcinoma Cells
To assert the unique effects of metformin treatment on CCA cells, we further assessed metformin-induced level alterations of metabolites involved in the four major metabolic pathway clusters in normal HUVEC cells (Figure 5). The HUVEC cells shared several metabolite levels with the two CCA cells, including the increased levels of lactate, decreased levels of glutamate, glutamine, asparagine, and β-alanine. After metformin treatment, glucose, fumarate, and alanine were remarkably decreased in CCA cells but increased in HUVEC cells, while NAD+, UDP-GlcNAc, and BCAAs were increased in CCA cells but either decreased or unchanged in HUVEC cells. To visualize the effects of metformin treatment on the metabolic pathways of the CCA cells, we projected the characteristic metabolites onto a metabolic map (Figure 6). Both the primarily changed characteristic metabolites and significantly altered metabolic pathways provide new insights into molecular mechanisms underlying the anticancer effect of metformin treatment on CCA cells.
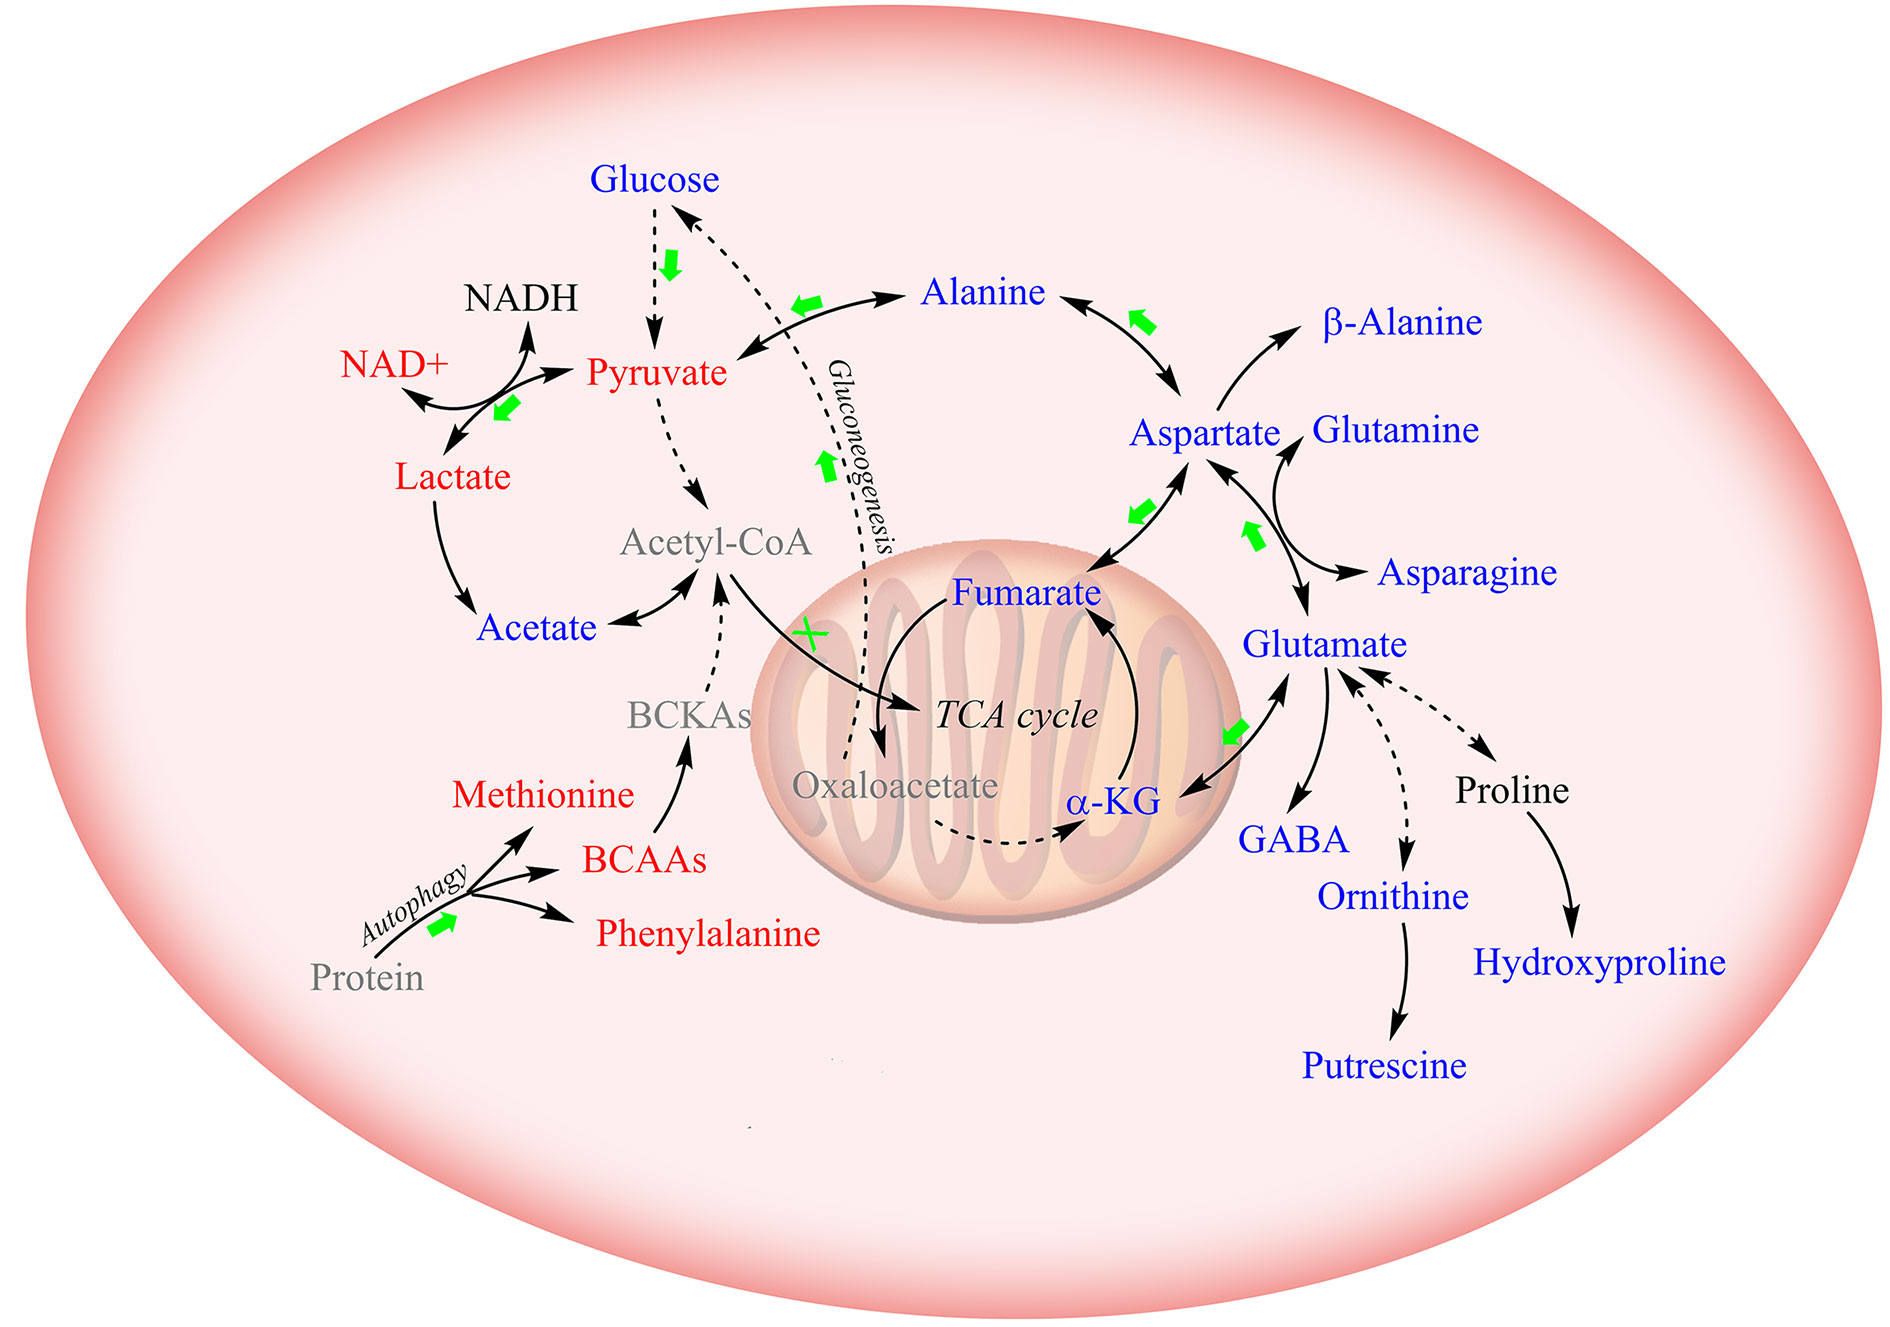
Figure 6 Schematic diagram for the effects of metformin treatment on metabolic pathways in CCA cells. Solid lines: direct conversion; dotted line: indirect conversion. Metabolites colored in red, blue, and black represent increased, decreased, and unchanged by metformin treatment in at least one CCA cell lines (MZ-ChA-1 and/or QBC939 cells), respectively. Metabolites displayed in grey were not detected by 1D 1H-NMR spectra. Green arrows and red crosses denote potentially promoted and inhibited metabolic pathways in metformin-treated CCA cells relative to their control counterparts, respectively.
Discussion
As reported previously, metformin is transported into hepatocytes through the organic cation transporter (OTC) family (29). Particularly, genetic variation in the OTC1 is well correlated to the therapeutic efficacy of metformin treatment (29). In this work, we observed an accumulation of metformin in both CCA cells, implying that metformin was transported into the cells and exhibited its effects.
Metformin treatment greatly inhibits the biosynthesis of acetyl CoA which is partly generated by pyruvate dehydrogenase complex (PDC) (30). Moreover, it has been demonstrated that metformin reduces the activity of mitochondrial complex I (12, 31) and causes alterations in the ETC. As a result, NADH-contained electrons are not effectively transported through the ETC, thus decreasing the NAD+ level (16, 32). Consistent with these studies, we detected increased glucose and fumarate, but decreased NAD+ in metformin-treated HUVEC cells. It seems that the accumulation of TCA cycle intermediates may facilitate the biosynthesis of alanine and aspartate for normal epithelial cells.
On the contrary, we observed raised levels of NAD+ and declined levels of TCA cycle intermediates in metformin-treated CCA cells. This discrepancy might result from the metabolic transformation of cancer cells. Cancer cells produce energy through the aerobic glycolysis, in which high rates of glycolysis and lactic acid fermentation occur in the cytosol regardless of the oxygen level (33, 34). Given the enhanced glucose consumption and lactate production, we assume that metformin treatment boosts glycolysis and drains the electrons from NADH for the conversion of pyruvate to lactate, thus aggravating the Warburg effect in cancer cells. It is well known that the regulation of glycolysis is highly associated with AMPK, which can be activated by metformin (19, 35, 36). Similarly, our results indicate that glycolysis is profoundly affected by metformin in CCA cells, providing independent support for the viewpoint that AMPK is vital for the anticancer effect of metformin treatment on CCA cells.
Biosynthesis of amino acids is tightly linked to the TCA cycle and glutamate metabolism. Our results show that metformin treatment decreases glutamate, glutamine, asparagine and β-alanine in both CCA cells and HUVECs, indicating that metformin has a significant effect on the synthesis of non-essential amino acids. The lack of substrates in metformin-treated cells potentially leads to insufficient glutathione, thus interrupting the oxidative stress.
We found that the levels of three BCAAs were basically unchanged in HUVEC cells but significantly enhanced in metformin-treated CCA cells. As essential amino acids, BCAAs cannot be synthesized endogenously, and they are catabolized by highly reversible enzymes using all three BCAAs as substrates. Therefore, levels of the three BCAAs display the same changing treads with similar variation amplitudes (37). Moreover, metformin suppresses expressions or activities of BCAAs catabolic enzymes (38, 39). Accordingly, we hypothesize that the accumulation of BCAAs in CCA cells might be due to autophagy-induced degradations of proteins. Previous works have well demonstrated that metformin can significantly contribute to the inhibition of mTOR (20, 21), directly leading to the activation of autophagy (40, 41). Consistently with these works, our results provide independent support for the viewpoint that metformin treatment may exert anticancer effect through activating the process of autophagy. It has been showed that BCAAs (particularly leucine) are potent activators of mTORC1 (42), implying the presence of negative feedback regulation from metformin to mTOR signaling. Future research is needed to better understand the correlation between metformin and BCAAs in CCA.
It was previously reported that metformin treatment can induce cell cycle arrest in several other cancer cell lines (43–45). Interestingly, we observed significantly increased levels of UDP-GlcNAc in metformin-treated CCA cells. To our knowledge, this observation represents the first report that the anticancer effect of metformin is related to UDP-GlcNAc. As is known, UDP-GlcNAc is a common donor substrate for the N-glycosylation of most cell-surface receptors and transporters in eukaryotes (46). Previous works indicate that glycoproteins with few N-glycans are significantly up-regulated in a switch-like response to the increased UDP-GlcNAc level, such as TβR, CTLA-4, and GLUT4 which mediate organogenesis, differentiation and cell cycle arrest (47, 48). Contrarily, glycoproteins with high numbers of N-glycans are slowly up-regulated with the increased UDP-GlcNAc level, including EGFR, IGFR, FGFR, and PDGFR which stimulate growth and proliferation of cells (47, 48). Thus, the increased levels of UDP-GlcNAc in the CCA cells could potentially induce enhanced surface levels of low-n glycoproteins, and eventually drive to arrest programs and suppress proliferation. Further studies should be conducted in future to mechanistically understand the relevance between metformin and cell cycle arrest.
Additionally, in order to identify as many metabolites as possible, we chose to record solution NMR spectra on aqueous extracts derived from the cells. Notably, other powerful NMR techniques are able to provide unique advantages in metabolomic analyses. In particular, the high resolution magic angle spinning (HRMAS) NMR spectroscopy offers a window for the observation of individual metabolites in intact tissues (49), which may facilitate the elucidation of molecular mechanisms underlying the anticancer effect of metformin on CCA in vivo.
Conclusions
In this work, we have performed comprehensive NMR-based metabolomic analyses to access the anticancer effects of metformin treatment on two CCA cell lines, and address the underlying molecular mechanisms. We identified characteristic metabolites and significantly altered metabolic pathways for metformin-treated CCA cells relative to untreated controls. Through comparing metformin-induced changes of metabolite levels between the CCA cells and normal HUVEC cells, we suggest that metformin profoundly promotes glycolysis and aggravate the Warburg effect in CAA cells. Moreover, metformin specifically increases BCAAs and UDP-GlcNAc, implying the occurrence of autophagy and cell cycle arrest in metformin-treated CAA cells. These results extend our understanding on the molecular mechanisms underlying the anticancer effect of metformin treatment on CCA cells, and shed light on the clinical use of metformin for CCA managements.
Data Availability Statement
The original contributions presented in the study are included in the article/Supplementary Materials. Further inquiries can be directed to the corresponding authors.
Authors Contributions
JZ conducted cell biology and NMR experiments and analyzed metabonomic data. CH, TJ, SY, and WS performed NMR analysis and cell culturing. WL was the initiator of this study. DL and JZ wrote the manuscript. All authors contributed to the article and approved the submitted version.
Funding
This work is supported by The National Science and Technology Major Project of China (No. 2017ZX10203206), the National Natural Science Foundation of China (No. 31971357), Scientific Research Foundation for Advanced Talents, Xiang’ an Hospital of Xiamen University (No. PM20180917008), and the Xiamen Ocean Economic Innovation and Development Demonstration Project (No.16PZP001SF16).
Conflict of Interest
The authors declare that the research was conducted in the absence of any commercial or financial relationships that could be construed as a potential conflict of interest.
Acknowledgments
This manuscript has been released as a pre-print at https://www.researchsquare.com/article/rs-12793/v1 (Jin Zhang et al.) (48).
Supplementary Material
The Supplementary Material for this article can be found online at: https://www.frontiersin.org/articles/10.3389/fonc.2020.570516/full#supplementary-material
Supplementary Figure 1 | 2D 1H-1H TOCSY and 1H-13C HSQC spectra of aqueous metabolites derived from the Mz-ChA-1 cells. (A) 1H-1H TOCSY spectra; (B–D) 1H-13C HSQC spectra. Resonance assignments are labeled in the spectra.
Supplementary Figure 2 | Multivariate statistical analyses of NMR spectral data derived from aqueous extracts of the Met and Ctrl groups of both CCA cells. (A, B) PLS-DA scores plots of the Met-Mz group vs. the Ctrl-Mz group (A), and the Met-939 group vs. the Ctrl-939 group (B); (C, D) PLS-DA cross-validation plots of Met-Mz vs. Ctrl-Mz (C), and Met-939 vs. Ctrl-939 (D); (E, F) Hierarchical cluster plots of Met-Mz vs. Ctrl-Mz (E), and Met-939 vs. Ctrl-939 (F).
References
1. Rizvi S, Gores GJ. Pathogenesis, diagnosis, and management of cholangiocarcinoma. Gastroenterology (2013) 145(6):1215–29. doi: 10.1053/j.gastro.2013.10.013
2. Razumilava N, Gores GJ. Cholangiocarcinoma. Lancet (2014) 383(9935):2168–79. doi: 10.1016/S0140-6736(13)61903-0
3. Doherty B, Nambudiri VE, Palmer WC. Update on the Diagnosis and Treatment of Cholangiocarcinoma. Curr Gastroenterol Rep (2017) 19(1):2. doi: 10.1007/s11894-017-0542-4
4. Brito AF, Abrantes AM, Encarnacao JC, Tralhao JG, Botelho MF. Cholangiocarcinoma: from molecular biology to treatment. Med Oncol (2015) 32(11):245. doi: 10.1007/s12032-015-0692-x
5. Tseng CH. Metformin and endometrial cancer risk in Chinese women with type 2 diabetes mellitus in Taiwan. Gynecol Oncol (2015) 138(1):147–53. doi: 10.1016/j.ygyno.2015.03.059
6. Evans JMM, Donnelly LA, Emslie-Smith AM, Alessi DR, Morris AD. Metformin and reduced risk of cancer in diabetic patients. Br Med J (2005) 330(7503):1304–5. doi: 10.1136/bmj.38415.708634.F7
7. DeCensi A, Puntoni M, Goodwin P, Cazzaniga M, Gennari A, Bonanni B, et al. Metformin and Cancer Risk in Diabetic Patients: A Systematic Review and Meta-analysis. Cancer Prev Res (2010) 3(11):1451–61. doi: 10.1158/1940-6207.CAPR-10-0157
8. Zhang ZJ, Bi YY, Li SY, Zhang QJ, Zhao GM, Guo Y, et al. Reduced Risk of Lung Cancer With Metformin Therapy in Diabetic Patients: A Systematic Review and Meta-Analysis. Am J Epidemiol (2014) 180(1):11–4. doi: 10.1093/aje/kwu124
9. Schuler KM, Rambally BS, DiFurio MJ, Sampey BP, Gehrig PA, Makowski L, et al. Antiproliferative and metabolic effects of metformin in a preoperative window clinical trial for endometrial cancer. Cancer Med (2015) 4(2):161–73. doi: 10.1002/cam4.353
10. Alimova IN, Liu B, Fan Z, Edgerton SM, Dillon T, Lind SE, et al. Metformin inhibits breast cancer cell growth, colony formation and induces cell cycle arrest in vitro. Cell Cycle (2009) 8(6):909–15. doi: 10.4161/cc.8.6.7933
11. Ling S, Feng T, Ke Q, Fan N, Li L, Li Z, et al. Metformin inhibits proliferation and enhances chemosensitivity of intrahepatic cholangiocarcinoma cell lines. Oncol Rep (2014) 31(6):2611–8. doi: 10.3892/or.2014.3151
12. Saengboonmee C, Seubwai W, Cha’on U, Sawanyawisuth K, Wongkham S, Wongkham C, et al. Metformin Exerts Antiproliferative and Anti-metastatic Effects Against Cholangiocarcinoma Cells by Targeting STAT3 and NF-kB. Anticancer Res (2017) 37(1):115–23. doi: 10.21873/anticanres.11296
13. Jiang XM, Ma N, Wang DY, Li FY, He RZ, Li DL, et al. Metformin inhibits tumor growth by regulating multiple miRNAs in human cholangiocarcinoma. Oncotarget (2015) 6(5):3178–94. doi: 10.18632/oncotarget.3063
14. Lord SR, Cheng W-C, Liu D, Gaude E, Haider S, Metcalf T, et al. Integrated Pharmacodynamic Analysis Identifies Two Metabolic Adaption Pathways to Metformin in Breast Cancer. Cell Metab (2018) 28(5):679–88.e674. doi: 10.1016/j.cmet.2018.08.021
15. Wheaton WW, Weinberg SE, Hamanaka RB, Soberanes S, Sullivan LB, Anso E, et al. Metformin inhibits mitochondrial complex I of cancer cells to reduce tumorigenesis. Elife (2014) 3:e02242. doi: 10.7554/eLife.02242
16. Janzer A, German NJ, Gonzalez-Herrera KN, Asara JM, Haigis MC, Struhl K. Metformin and phenformin deplete tricarboxylic acid cycle and glycolytic intermediates during cell transformation and NTPs in cancer stem cells. Proc Natl Acad Sci U S A (2014) 111(29):10574–9. doi: 10.1073/pnas.1409844111
17. Shi WY, Xiao D, Wang L, Dong LH, Yan ZX, Shen ZX, et al. Therapeutic metformin/AMPK activation blocked lymphoma cell growth via inhibition of mTOR pathway and induction of autophagy. Cell Death Dis (2012) 3:e275. doi: 10.1038/cddis.2012.13
18. Zakikhani M, Dowling R, Fantus IG, Sonenberg N, Pollak M. Metformin is an AMP kinase-dependent growth inhibitor for breast cancer cells. Cancer Res (2006) 66(21):10269–73. doi: 10.1158/0008-5472.CAN-06-1500
19. Zhang CS, Li M, Ma T, Zong Y, Cui J, Feng JW, et al. Metformin Activates AMPK through the Lysosomal Pathway. Cell Metab (2016) 24(4):521–2. doi: 10.1016/j.cmet.2016.09.003
20. Gwinn DM, Shackelford DB, Egan DF, Mihaylova MM, Mery A, Vasquez DS, et al. AMPK phosphorylation of raptor mediates a metabolic checkpoint. Mol Cell (2008) 30(2):214–26. doi: 10.1016/j.molcel.2008.03.003
21. Wu L, Zhou B, Oshiro-Rapley N, Li M, Paulo JA, Webster CM, et al. An Ancient, Unified Mechanism for Metformin Growth Inhibition in C. elegans and Cancer. Cell (2016) 167(7):1705–18.e13. doi: 10.1016/j.cell.2016.11.055
22. Morvan D. Functional metabolomics uncovers metabolic alterations associated to severe oxidative stress in MCF7 breast cancer cells exposed to ascididemin. Mar Drugs (2013) 11(10):3846–60. doi: 10.3390/md11103846
23. Liu X, Zhang CC, Liu Z, Wei L, Liu JY, Yu J, et al. LC-based targeted metabolomics analysis of nucleotides and identification of biomarkers associated with chemotherapeutic drugs in cultured cell models. Anticancer Drugs (2014) 25(6):690–703. doi: 10.1097/CAD.0000000000000096
24. Li Y, Man S, Li J, Chai H, Fan W, Liu Z, et al. The antitumor effect of formosanin C on HepG2 cell as revealed by 1H-NMR based metabolic profiling. Chem Biol Interact (2014) 220:193–9. doi: 10.1016/j.cbi.2014.06.023
25. Fan TWM, Lane AN. Applications of NMR spectroscopy to systems biochemistry. Prog Nucl Magn Reson Spectrosc (2016) 92-93:18–53. doi: 10.1016/j.pnmrs.2016.01.005
26. Markley JL, Brüschweiler R, Edison AS, Eghbalnia HR, Powers R, Raftery D, et al. The future of NMR-based metabolomics. Curr Opin Biotechnol (2017) 43:34–40. doi: 10.1016/j.copbio.2016.08.001
27. Baudin B, Bruneel A, Bosselut N, Vaubourdolle M. A protocol for isolation and culture of human umbilical vein endothelial cells. Nat Protoc (2007) 2(3):481–5. doi: 10.1038/nprot.2007.54
28. Xia J, Wishart DS. MSEA: a web-based tool to identify biologically meaningful patterns in quantitative metabolomic data. Nucleic Acids Res (2010) 38(Web Server issue):W71–7. doi: 10.1093/nar/gkq329
29. Shu Y, Sheardown SA, Brown C, Owen RP, Zhang S, Castro RA, et al. Effect of genetic variation in the organic cation transporter 1 (OCT1) on metformin action. J Clin Invest (2007) 117(5):1422–31. doi: 10.1172/JCI30558
30. Cuyas E, Fernandez-Arroyo S, Joven J, Menendez JA. Metformin targets histone acetylation in cancer-prone epithelial cells. Cell Cycle (Georgetown Tex.) (2016) 15(24):3355–61. doi: 10.1080/15384101.2016.1249547
31. Pryor R, Cabreiro F. Repurposing metformin: an old drug with new tricks in its binding pockets. Biochem J (2015) 471(3):307–22. doi: 10.1042/BJ20150497
32. Griss T, Vincent EE, Egnatchik R, Chen J, Ma EH, Faubert B, et al. Metformin Antagonizes Cancer Cell Proliferation by Suppressing Mitochondrial-Dependent Biosynthesis. PLoS Biol (2015) 13(12):e1002309. doi: 10.1371/journal.pbio.1002309
33. Sciacovelli M, Gaude E, Hilvo M, Frezza C. The metabolic alterations of cancer cells. Methods Enzymol (2014) 542:1–23. doi: 10.1016/B978-0-12-416618-9.00001-7
34. Wang Y, Xia Y, Lu Z. Metabolic features of cancer cells. Cancer Commun (Lond) (2018) 38(1):65. doi: 10.1186/s40880-018-0335-7
35. Stephenne X, Foretz M, Taleux N, van der Zon GC, Sokal E, Hue L, et al. Metformin activates AMP-activated protein kinase in primary human hepatocytes by decreasing cellular energy status. Diabetologia (2011) 54(12):3101–10. doi: 10.1007/s00125-011-2311-5
36. Meng S, Cao J, He Q, Xiong L, Chang E, Radovick S, et al. Metformin activates AMP-activated protein kinase by promoting formation of the alphabetagamma heterotrimeric complex. J Biol Chem (2015) 290(6):3793–802. doi: 10.1074/jbc.M114.604421
37. Sivanand S, Vander Heiden MG. Emerging Roles for Branched-Chain Amino Acid Metabolism in Cancer. Cancer Cell (2020) 37(2):147–56. doi: 10.1016/j.ccell.2019.12.011
38. Rivera ME, Lyon ES, Vaughan RA. Effect of metformin on myotube BCAA catabolism. J Cell Biochem (2020) 121(1):816–27. doi: 10.1002/jcb.29327
39. Sonnet DS, O‘Leary MN, Gutierrez MA, Nguyen SM, Mateen S, Hsu Y, et al. Metformin inhibits Branched Chain Amino Acid (BCAA) derived ketoacidosis and promotes metabolic homeostasis in MSUD. Sci Rep (2016) 6:28775. doi: 10.1038/srep28775
40. Melendez A, Talloczy Z, Seaman M, Eskelinen EL, Hall DH, Levine B, et al. Autophagy genes are essential for dauer development and life-span extension in C. elegans. Science (2003) 301(5638):1387–91. doi: 10.1126/science.1087782
41. Madeo F, Pietrocola F, Eisenberg T, Kroemer G. Caloric restriction mimetics: towards a molecular definition. Nat Rev Drug Discov (2014) 13(10):727–40. doi: 10.1038/nrd4391
42. Dunlop EA, Dodd KM, Seymour LA, Tee AR. Mammalian target of rapamycin complex 1-mediated phosphorylation of eukaryotic initiation factor 4E-binding protein 1 requires multiple protein-protein interactions for substrate recognition. Cell Signal (2009) 21(7):1073–84. doi: 10.1016/j.cellsig.2009.02.024
43. Queiroz EA, Puukila S, Eichler R, Sampaio SC, Forsyth HL, Lees SJ, et al. Metformin induces apoptosis and cell cycle arrest mediated by oxidative stress, AMPK and FOXO3a in MCF-7 breast cancer cells. PLoS One (2014) 9(5):e98207. doi: 10.1371/journal.pone.0098207
44. Cai X, Hu X, Tan X, Cheng W, Wang Q, Chen X, et al. Metformin Induced AMPK Activation, G0/G1 Phase Cell Cycle Arrest and the Inhibition of Growth of Esophageal Squamous Cell Carcinomas In Vitro and In Vivo. PLoS One (2015) 10(7):e0133349. doi: 10.1371/journal.pone.0133349
45. Jeong YK, Kim MS, Lee JY, Kim EH, Ha H. Metformin Radiosensitizes p53-Deficient Colorectal Cancer Cells through Induction of G2/M Arrest and Inhibition of DNA Repair Proteins. PLoS One (2015) 10(11):e0143596. doi: 10.1371/journal.pone.0143596
46. Mkhikian H, Mortales C-L, Zhou RW, Khachikyan K, Wu G, Haslam SM, et al. Golgi self-correction generates bioequivalent glycans to preserve cellular homeostasis. eLife (2016) 5:e14814. doi: 10.7554/eLife.14814
47. Dennis JW, Nabi IR, Demetriou M. Metabolism, Cell Surface Organization, and Disease. Cell (2009) 139(7):1229–41. doi: 10.1016/j.cell.2009.12.008
48. Lau KS, Partridge EA, Grigorian A, Silvescu CI, Reinhold VN, Demetriou M, et al. Complex N-glycan number and degree of branching cooperate to regulate cell proliferation and differentiation. Cell (2007) 129(1):123–34. doi: 10.1016/j.cell.2007.01.049
Keywords: cholangiocarcinoma, metformin, metabolomic, nuclear magnetic resonance (NMR), anticancer
Citation: Zhang J, Hang C, Jiang T, Yi S, Shao W, Li W and Lin D (2020) Nuclear Magnetic Resonance-Based Metabolomic Analysis of the Anticancer Effect of Metformin Treatment on Cholangiocarcinoma Cells. Front. Oncol. 10:570516. doi: 10.3389/fonc.2020.570516
Received: 27 July 2020; Accepted: 14 October 2020;
Published: 30 November 2020.
Edited by:
Egidio Iorio, National Institute of Health (ISS), ItalyReviewed by:
Marcos Lopez, University of Puerto Rico, Puerto RicoValeria Righi, University of Bologna, Italy
Copyright © 2020 Zhang, Hang, Jiang, Yi, Shao, Li and Lin. This is an open-access article distributed under the terms of the Creative Commons Attribution License (CC BY). The use, distribution or reproduction in other forums is permitted, provided the original author(s) and the copyright owner(s) are credited and that the original publication in this journal is cited, in accordance with accepted academic practice. No use, distribution or reproduction is permitted which does not comply with these terms.
*Correspondence: Donghai Lin, dhlin@xmu.edu.cn; Wengang Li, lwg11861@163.com