
- 1 Institute of Pathology, University of Bern, Bern, Switzerland
- 2 Institute for Pathology, University Hospital Basel, Basel, Switzerland
Background: The current proposed model of colorectal tumorigenesis is based primarily on CpG island methylator phenotype (CIMP), microsatellite instability (MSI), KRAS, BRAF, and methylation status of 0-6-Methylguanine DNA Methyltransferase (MGMT) and classifies tumors into five subgroups. The aim of this study is to validate this molecular classification and test its prognostic relevance. Methods: Three hundred two patients were included in this study. Molecular analysis was performed for five CIMP-related promoters (CRABP1, MLH1, p16INK4a, CACNA1G, NEUROG1), MGMT, MSI, KRAS, and BRAF. Methylation in at least 4 promoters or in one to three promoters was considered CIMP-high and CIMP-low (CIMP-H/L), respectively. Results: CIMP-H, CIMP-L, and CIMP-negative were found in 7.1, 43, and 49.9% cases, respectively. One hundred twenty-three tumors (41%) could not be classified into any one of the proposed molecular subgroups, including 107 CIMP-L, 14 CIMP-H, and two CIMP-negative cases. The 10 year survival rate for CIMP-high patients [22.6% (95%CI: 7–43)] was significantly lower than for CIMP-L or CIMP-negative (p = 0.0295). Only the combined analysis of BRAF and CIMP (negative versus L/H) led to distinct prognostic subgroups. Conclusion: Although CIMP status has an effect on outcome, our results underline the need for standardized definitions of low- and high-level CIMP, which clearly hinders an effective prognostic and molecular classification of colorectal cancer.
Introduction
Jass (2007) proposed a molecular classification of colorectal cancer based predominantly on five features: CpG island methylator phenotype (CIMP), microsatellite instability (MSI), KRAS, BRAF, and methylation status of 0-6-Methylguanine DNA Methyltransferase (MGMT). The new classification was composed of five molecular subtypes, with the largest group including mostly CIMP-negative, chromosomally instable (CIN), microsatellite stable (MSS) colorectal cancers (57% of cases). In addition, CIMP-low (CIMP-L), KRAS mutated, MGMT methylated, MSS/MSI-low (MSI-L) cancers were predicted in 20% of cases, while CIMP-H, BRAF mutated, MSI-H tumors in 12%, CIMP-H, BRAF mutated, chromosomally stable, MSS/MSI-L in 8%, and finally, the hereditary Lynch syndrome CIMP-negative, BRAF mutation-negative, chromosomally stable, and MSI-H cancers found in 3% of all cases. Indeed, these new subgroupings form the basis of the current model of colorectal tumorigenesis.
To date, the prognostic relevance of Jass’s proposed groupings, particularly those arising in the sporadic context, has not yet been tested. As single molecular entities, KRAS mutations and MSI have been intensively investigated, while mutations in BRAF and analysis of CIMP are fewer (Andreyev et al., 1998; Boland and Goel, 2010). Less than a handful of studies have evaluated the prognostic relevance of MGMT (Shima et al., 2011). CIMP-H and MSI-H colorectal cancers seem to share similar features including proximal tumor location, mucinous histological type, poorer tumor grade, and BRAF mutation, but they may be inter-dependent in terms of their prognostic effects (Ogino et al., 2009; Sanchez et al., 2009; Dahlin et al., 2010). Patients with MSI-H cancers may benefit from a decreased rate of distant metastasis and longer survival time when compared to their MSS counterparts (Kloor et al., 2010) whereas patients with CIMP-H cancers particularly in the MSS context seem to have a considerably more unfavorable outcome (Ward et al., 2003; Dahlin et al., 2010; Kloor et al., 2010). Also, BRAF mutated cancers may lead to poorer survival time in MSS cancers only (Samowitz et al., 2006).
The aim of this study was first to classify a cohort of 302 colorectal cancers according to the proposed molecular classification based on CIMP, MGMT methylation, KRAS and BRAF mutation, and MSI and then, to test its prognostic value.
Materials and Methods
Patients
About 1420 primary pre-operatively untreated, unselected sporadic colorectal cancer patients treated between the years 1987 and 1996 were initially included in this study. Hematoxylin and eosin (H&E) stained slides were retrospectively collected from the Institute of Pathology, University Hospital of Basel, the Institute of Clinical Pathology, Basel, Switzerland, and the Institute of Pathology, Stadtspital Triemli, Zürich, Switzerland. From this larger subgroup, only 600 paraffin-embedded tissue blocks could be retrieved. Histopathological criteria were reviewed by an experienced gastrointestinal pathologist. The tumor border configuration (pushing/expanding or infiltrating) as well as the presence of peritumoral lymphocytic inflammation at the invasive tumor front were scored according to Jass (1986). Clinical data including patient age at diagnosis, tumor location, and follow-up were retrieved from patient records. Clinical outcome of interest was cancer-specific survival time. Censored observations included patients who were alive at the last follow-up, died for reasons other than colorectal cancer or were lost to follow-up. Patient characteristics are summarized in Table 1. The use of material for this study was approved by the ethics committee of the University Hospital of Basel.
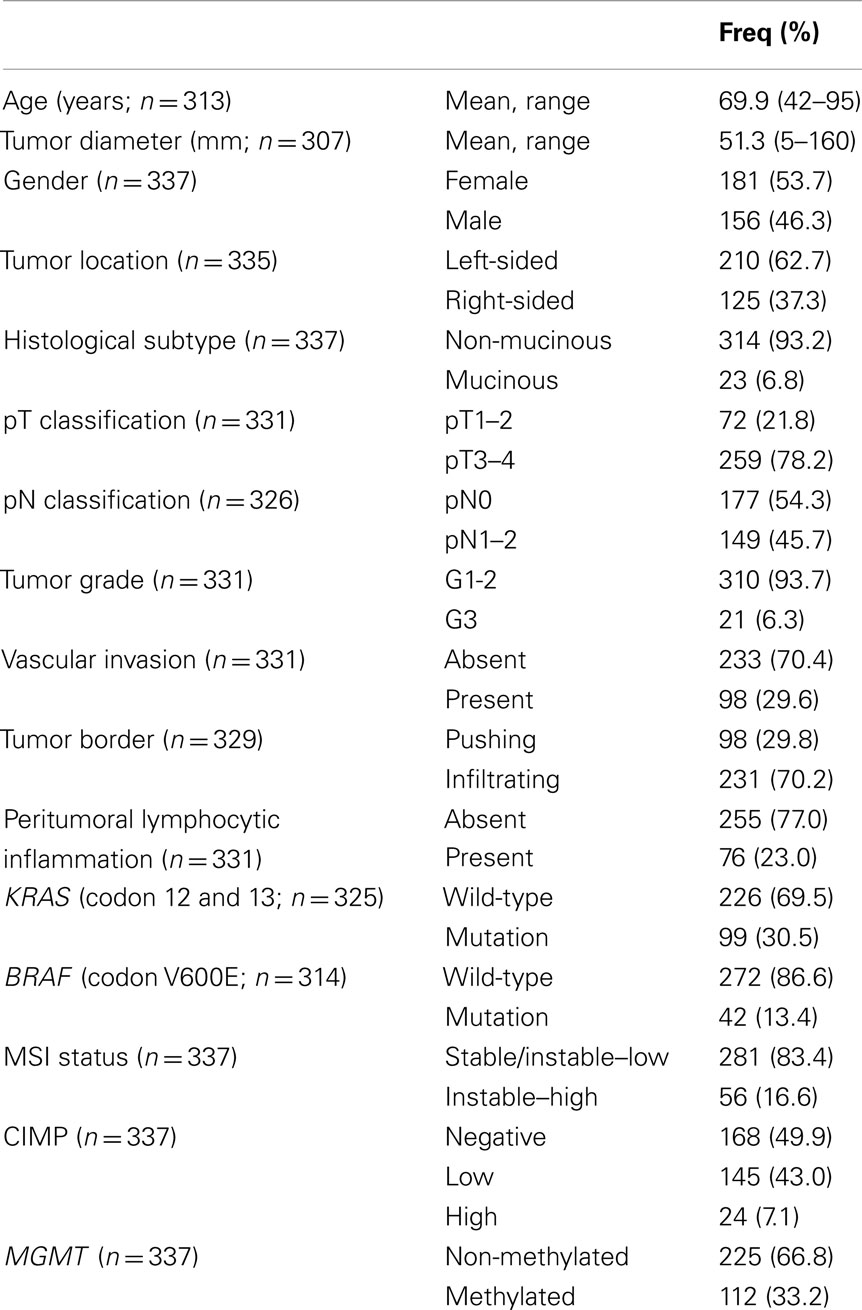
Table 1. Patient characteristics (n = 337).
Assay Methods
DNA isolation, mutation, and microsatellite instability analysis
In order to identify regions for punching and DNA extraction, neoplastic, and adjacent non-neoplastic tissue areas were marked on the H&E slide by an experienced pathologist (A.L) with pens of two different colors. Only blocks with >70% tumor content were used for this purpose.
Genomic DNA was obtained from both primary tumors and adjacent non-neoplastic tissues using NucleoMag 96 Tissue Kit (Macherey Nagel) protocol and processed in the Xiril X-100 robot (Xiril, Hombrechtikon, Switzerland). Briefly, punched tissue was lysed in proteinase K. B-beads and MB2 buffer were added to the cleared lysate, shaken for 5 min at RT. The supernatant was removed and MB3 buffer was added followed by shaking and supernatant removal. The genomic DNA was eluted with MB6 buffer. Genomic DNA was amplified by PCR using AmpliTaq Gold polymerase (Applied Biosystems). KRAS (exon 2 codon 12 and 13) and BRAF (exon 15 codon 600) were amplified by a first and a nested PCR. Residual primers were removed using the EXOSAPit (Amersham). Samples were then subjected to direct sequencing of single-stranded PCR products using the BigDye® Terminator v1.1 cycle sequencing kit (Applied Biosystems, Foster City, CA, USA) and the ABI Prism® 3130 genetic analyzer (Applied Biosystems). All products were sequenced bi-directionally. Analysis of MSI status was based on the multiplex amplification of the five microsatellites (BAT25, BAT26, D2S123, D5S346, D17S250). An initial denaturation step at 95°C for 10 min was followed by 42 cycles at 95°C for 40 s, 54°C for 40 s, and 72°C for 60 s. For the analysis, 1 μl of the DNA weight marker ROX 500 (Applied Biosystem) was added and 10 μl of deionized formamide in 3 μl of the PCR amplified solution. DNA was denaturated by incubation for 2 min at 95°C. The POP-7 polymer solution (Applied Biosystem) was used for the electrophoresis on the ABI Prism® 3130 genetic analyzer (Applied Biosystems). MSS and MSI-L status were defined as instability at zero and one microsatellite, respectively. MSI-H was characterized by the presence of instability in 40% (≥2 markers; Umar et al., 2004).
DNA bisulfite treatment
DNA denaturation and bisulfite conversion were processed into one-step using the EZ-96 DNA Methylation-GoldTM Kit (Cat. No. D5007, Zymo Research Corporation) according to manufacturer’s instructions. Briefly, 130 μl of the CT conversion reagent were added to 20 μl of each DNA sample in a conversion plate. The plates were sealed with the provided film and the conversion plate transferred to a thermal cycler running under the following steps: 98°C for 10 min, 53°C for 4 h, storage at 4°C. Four hundred microliters of M-Binding Buffer were added to the wells of a Silicon-A™ Binding Plate. The samples were transferred from the conversion plate to the wells of the Silicon-A™ binding plate and centrifuged at 3,000 × g for 5 min. Each well of the plate was washed using 400 μl of M-wash buffer. The samples were centrifuged at 3,000 × g for 5 min. 200 μl of M-Desulphonation buffer was added to each and the plate was placed at room temperature for 20 min followed by centrifugation (3,000 × g for 5 min). Two consecutive steps including washing (400 μl of M-wash Buffer) and centrifugation (3,000 × g for 5 min) were performed. The Silicon-A™ binding plate was placed onto an elution plate and 30 μl of M-Elution buffer was directly added to each well. 5 min later, the samples were centrifuged at 3,000 × g for 3 min to elute the DNA. For control of DNA methylation, Universal Methylated Human DNA Standard was used (Cat. No. D5011, Zymo Research Corporation).
Amplification of modified DNA
For the first and the nested PCR, 50 cycles of amplification was performed. Two microliters of the modified DNA was added in a volume of 25 μl containing the dNTPs (0.2 mM final), PCR Gold Buffer (1× final, Applied Biosystem), PCR primers (0.12 μM), and 0.2 μl of Taq polymerase (ampliTaq Gold, Applied Biosystem). The nested PCR is performed under the same condition by addition of 1 μl of the amplicon in 25 μl of master mix.
Promoter methylation was assayed for the five CIMP-related genes [CRABP1 (HGNC: 2338), MLH1, p16INK4a, CACNA1G, NEUROG1] as well as for MGMT. For the first and the nested PCR, 50 cycles of amplification were performed. Primer sequences are listed in Table 2.
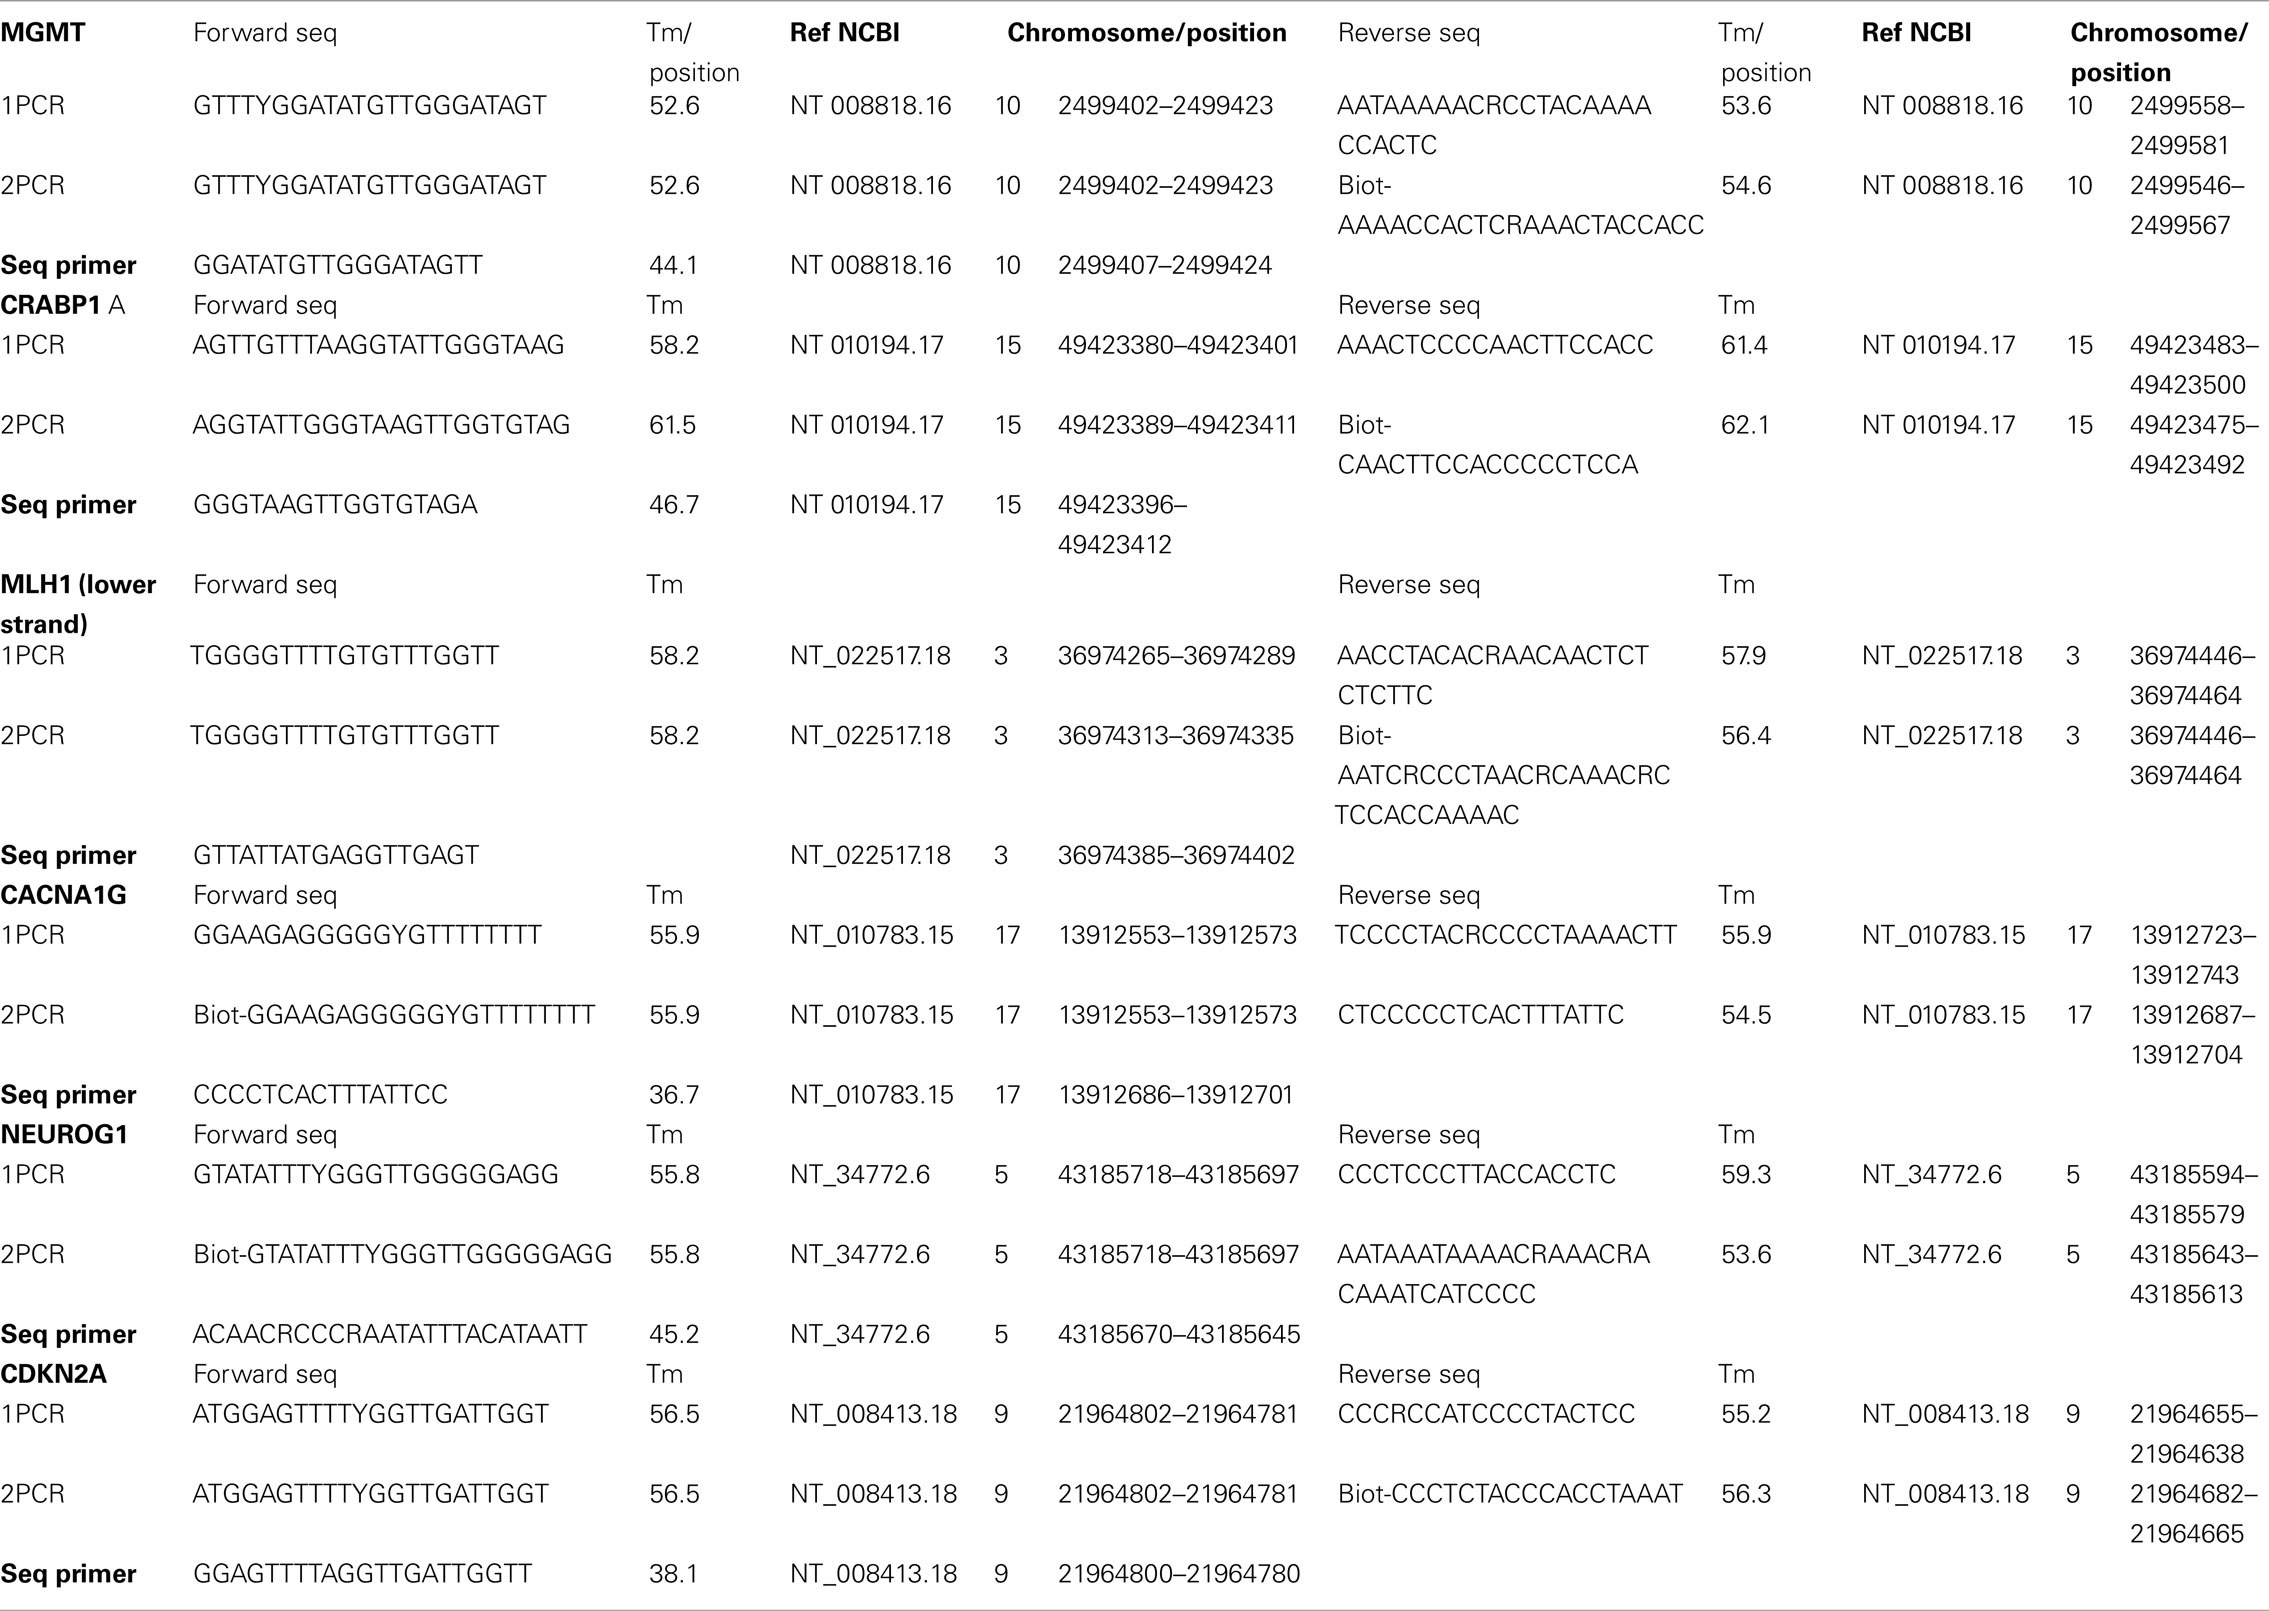
Table 2. Primer sequences.
Pyrosequencing and CpG site quantification
Three microliters of Sepharose beads were mixed together with 40 μl of binding buffer and 22 μl of water and mixed in an Eppendorf tube. Sixty microliters of this mix was added to 20 μl of PCR products in a 96 well plate and agitated at 1400 rpm for 5 min. The PyroMark Q96 Plate was filled with 0.3 μM of sequencing primer in 40 μl of annealing buffer. The washed were performed using the vacuum station according to the manufacturer instruction. For annealing the samples to sequencing primers, the temperature was increased to 80°C for 2 min and rapidly cooled to room temperature. Plates were then ready for processing in the PyroMarkQ96 instrument.
Pyrosequencing of the purified single-stranded PCR products and CpG site quantification was accomplished by the PyroMarkQ96 and related software (Qiagen). Four to six CpG sites were evaluated for each gene in both neoplastic and corresponding non-neoplastic tissue. Since this method is quantitative, each CpG site is assigned a percentage of methylation. The final CpG score for the tumor or non-neoplastic tissue is represented as the average percentage methylation across all CpG sites for that gene. A tumor-specific methylation score can then be assigned by subtracting out any background methylation from the adjacent non-neoplastic tissue from the tumor’s CpG score. This method for calculation is summarized in Figure 1. Although the non-neoplastic mucosa is expected to be non-methylated, age-related methylation, and background can still occur (Issa, 2000). The threshold tumor-specific methylation score for considering a case as methylation positive was >30% (minimal difference between tumor and non-neoplastic mucosa). This cut-off score was based on the measured and theoretical percentage of methylation observed at different numbers of PCR amplification cycles using commercially available DNA (unmethylated and 100% methylated, Qiagen) and combinations of the two, resulting in varying degrees of methylation (0, 0.1, 0.3, 1, 3, 10, 30, and 100%). According to these findings, background methylation can be 10% suggesting that a minimal difference in methylation of 20% (10% for tumor and 10% for non-neoplastic) should be used to define methylation-positivity above background. Here, we have used a more stringent criterion of 30% to ensure with even greater certainty a significant degree of methylation. CIMP-H was defined as methylation in ≥4/5 gene loci, while CIMP-L and CIMP-negative were defined as methylation in one to three genes and no gene methylation, respectively.
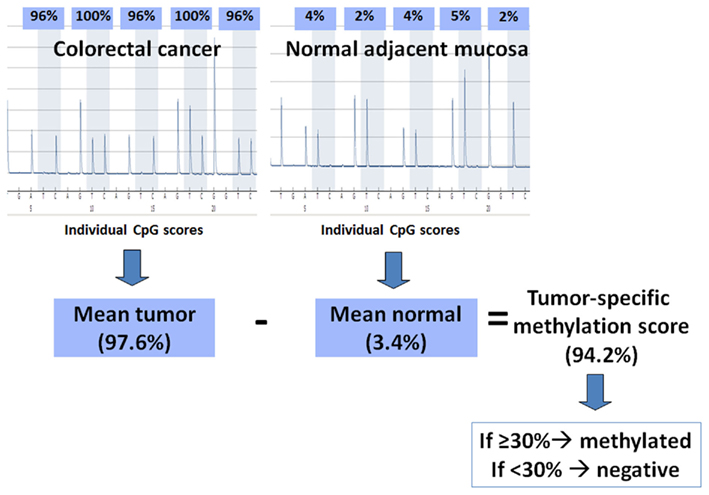
Figure 1. Method of calculation used for determining methylation status. The pyrograms show percent methylation at five CpG sites in a colorectal cancer and its corresponding normal mucosa; the individual CpG scores are averaged for each. The mean percent methylation from the normal tissue is subtracted from the mean percent methylation of the tumor to give a tumor-specific methylation score. If this final score is ≥30%, then the tumor is considered methylated, otherwise it is considered negative for methylation.
Statistical Analysis
Univariate survival analysis was performed using the Kaplan–Meier method and log-rank test (SAS V9.2; The SAS Institute, Cary, NC, USA). Re-classification of patients into prognostic molecular subgroups was performed using classification and regression tree (CART) analysis with survival status at 10 years follow-up as outcome of interest. To measure the classification error as a function of tree size, 10-fold cross-validation experiments were performed (DTREG Predictive Modeling Software, www.dtreg.com).
Results
Frequency of Molecular Features
From the 600 cases initially investigated, molecular characterization for CIMP was possible in 337 patients. This was due to the lower quality of DNA which could be extracted from older paraffin-embedded tissues. The frequency of methylation using the proposed criteria were 16% for CDKN2A, 14% for CACNA1G, 17% for MLH1, 18% for CRABP1, 22% for NEUROG1. Twenty-four patients (7.1%) were CIMP-H, 145 (43%) CIMP-L, and 168 (49.9%) CIMP-negative. KRAS and BRAF mutational analysis could be made in 325 and 314 patients, respectively while MGMT and MSI analysis was possible in all 337 cases. Thirty-three percent of patients were methylated for MGMT and 16.6% had MSI-H tumors. All molecular features could be analyzed in 304 cases. The frequencies of KRAS and BRAF mutation were 30.5 and 13.3%, respectively while of MSI and MGMT methylation was 16.6 and 33.2%.
Classification into Proposed Subgroups
Tumors were then classified into each of Jass Groups 1–5 (Figure 2). In Jass Group 1, only six patients (2%) were CIMP-H, BRAF mutated and MSI-H, compared to the predicted 12%. In Group 2, there were five patients (2%) with CIMP-H, BRAF mutated MSS/MSI-L cancers, compared to the predicted 8%. Next, 13 cases (4%) could be classified into Jass Group 3 containing CIMP-L, MSS/MSI-L, KRAS mutated, and MGMT methylated tumors, rather than the predicted 20%. Group 4 remained the largest group with 45% of patients (n = 137) showing CIMP-negativity, MSS/MSI-L. Finally, Group 5 contained 18 patients (6%) with CIMP-negative, BRAF WT, MSI-H cancers. Interestingly, 41% (n = 124) of tumors could not be classified into any of the proposed groupings including the remaining 107 (35.4%) CIMP-L cases, 14 CIMP-H, BRAF WT (4.6%), and four CIMP-negative, BRAF mutated, MSI-H (1.3%).
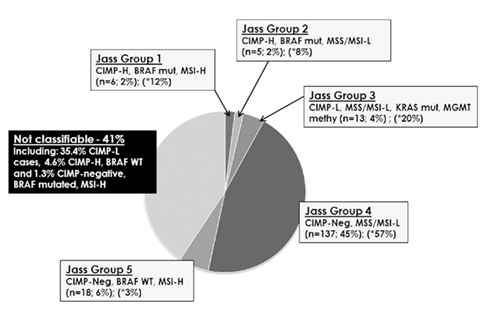
Figure 2. Attempt to classify 302 colorectal cancers into the proposed Jass Groups 1–5. Forty-one percent of all cases could not be assigned to any one of these subgroups. In parentheses, the asterisk identifies the predicted percentage of patients belonging to each group.
Prognostic Impact of CIMP and MGMT
The median survival time of the entire cohort was 63 (95%CI: 46–84) months. Patients with CIMP-H colorectal cancers were found to have a significantly lower 10 year survival rate [22.6% (95%CI): 7–43)] compared to both CIMP-L [34.8% (95%CI): 26–43] and CIMP-negative [43.4% (95%CI): 34–53] cancers (p = 0.0248; Figure 3A). This unfavorable prognostic effect occurred in MSS/MSI-L (p = 0.0532) and showed a trend in MSI-H (p = 0.2515; Figures 3B,C). In contrast, no difference in survival time was noted for patients with MGMT methylated or unmethylated tumors (p = 0.4966; Figure 3D).
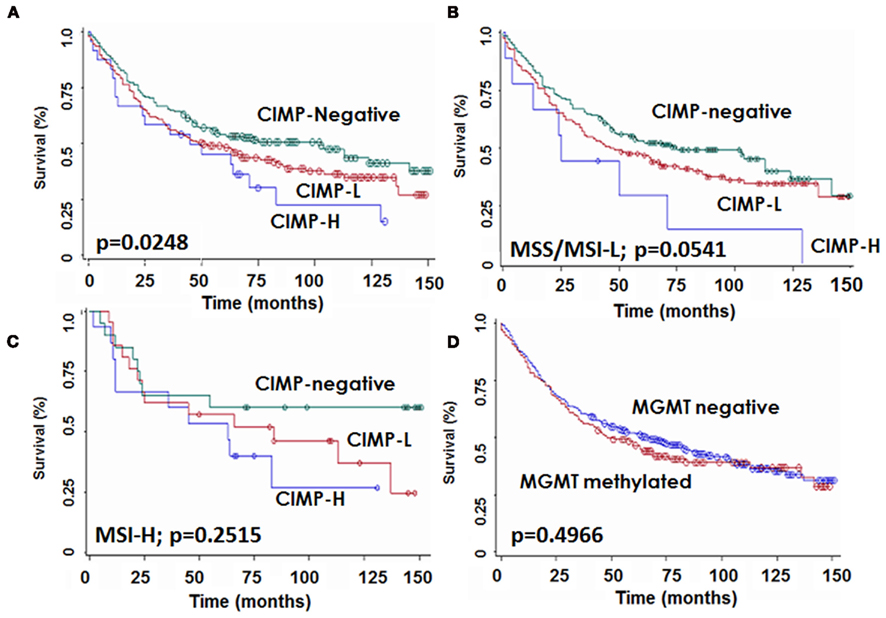
Figure 3. Kaplan–Meier survival curves showing survival time differences for patients with CIMP-H, CIMP-L, and -negative tumors (A) in the whole patient cohort, (B) in microsatellite stable or instable-low (MSS/MSI-L) and (C) in microsatellite instable-high (MSI-H) cases, and (D) for patients stratified by MGMT status.
Classification and Regression Tree Analysis
Of the 304 fully molecularly characterized patients, 302 had survival time information and were entered CART analysis. This approach was used to classify patients into prognostic groups using 10 year survival as the clinical endpoint (Figure 4A). BRAF gene mutation was identified as the most important parameter and classified as a single group. Patients with BRAF WT tumors were further discriminated based on CIMP status; patients with any methylation of CpG islands (CIMP-H and CIMP-L) formed a separate prognostic group. CIMP-negative patients were further subdivided by KRAS gene status. The remaining classification by MSI or MGMT methylation yielded little additional discrimination. The frequency of these subgroups is shown in Figure 4B. Ten year survival for the most important subgroups underline a rate of 10% (95% CI: 1–32; n = 30) for patients with BRAF mutated tumors, followed by 38% (95%CI: 29–47; n = 118) for BRAF WT, CIMP-H, or CIMP-L tumors, then 50% (95%CI: 32–62; n = 112) for BRAF WT, CIMP-negative, KRAS WT cases, and 55% (95%CI: 23–72; n = 42) for BRAF WT, CIMP-negative, KRAS mutated cases. Hence, three major groups of patients were identified: BRAF mutated, CIMP-H or CIMP-L, and CIMP-negative (p = 0.034).
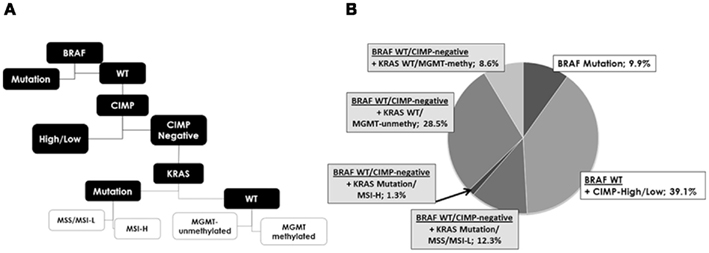
Figure 4. (A) Analysis of the five molecular features using classification and regression tree analysis shows the hierarchy of most discriminating alterations and prognostic subgroups, namely subgroup 1: BRAF mutation, subgroup 2: CIMP-high, and CIMP-low and subgroup 3: CIMP-negative. KRAS, MGMT, and MSI contribute only little additional prognostic information. (B) Frequencies of each new subgroup.
Discussion
Our results suggest that Jass’s model of colorectal cancer cannot effectively classify patients from the institutes included in this study into molecular subgroups. Here, we analyze the reasons for this discordance.
We used pyrosequencing rather than MethyLight or methylation-specific PCR (MSP) to quantify methylation at CpG islands. This is a novel yet validated method for investigating CpG site methylation from paraffin-embedded tissues (Colella et al., 2003; Tost et al., 2003; Potapova et al., 2011). In contrast to MethyLight and MSP, each CpG site is assigned a percentage of methylation. This has several advantages; among others, it allows us to take into consideration the background methylation of the adjacent non-neoplastic tissue and assign a tumor-specific methylation score by subtracting out this signal. This is particularly interesting in the case of CDKN2A where age-related methylation can occur more frequently (Toyota et al., 1999).
In this study we evaluated the following five CIMP genes: CACNA1G, NEUROG1, CDKN2A, CRABP1, and MLH1. Not only has this same panel been used in previous studies (Ogino et al., 2006), but a comparison study of the performance characteristics of these genes has shown them to be reliable for the detection of CIMP phenotype (Ogino et al., 2007). Although we used a stringent criterion for determining methylation-positivity of each gene (minimal 30% difference between tumor and non-neoplastic CpG methylation), we nonetheless obtain rates comparable to those published by others. Our frequency of 16% for CDKN2A is slightly lower than that of Ogino and Nosho using MethyLight assays (29, 30%) but similar to Ahn et al. (2011) and also Yu et al. (2008) using pyrosequencing (16 and 20%, respectively; Ogino et al., 2007; Nosho et al., 2008). Our finding of methylation in 33% MGMT, 22% for NEUROG1, and 14% for CACNA1G is similar to the 38, 32, and 13% reported by Nosho and Lee while the 17% obtained for MLH1 is also within the expected range documented by others (6–28%; Ogino et al., 2007; Lee et al., 2008; Nosho et al., 2008; Ahn et al., 2011).
We defined CIMP-H and CIMP-L as at least four/five and one to three methylated genes, respectively. Dahlin et al. (2010) characterized CIMP-L and CIMP-H as hypermethylation in one to five and six to eight genes using the MethyLight method. Jover et al. (2011) considered CIMP+ as aberrant methylation in at least three/five genes (25% CIMP+ rate). Kim et al. (2010), also using pyrosequencing show a CIMP+ rate of 35.8% when considering hypermethylation of at least two/seven genes while Van Rijnsoever et al. (2003) report a 32% CIMP + rate referring to at least two/three methylated sites. Finally, Ogino et al. (2009) used an eight-marker panel and defined CIMP-H as at least six/eight methylated promoters by MethyLight assays. There is to date no consensus regarding the number of methylated genes to be included in the definition of CIMP.
Our frequency of CIMP-H and -L is 7.1 and 43%, respectively. Dahlin et al. (2010) evaluated three prospective European population-based cohorts (together termed the Northern Sweden Health and Disease Study, NSHDS) followed by a second expanded series (Colorectal cancer in Umeo Study, CRUMS) including 190 and 414 patients. Stratifying by MSS status, they report a 7.4 and 6.8% CIMP-H rate in the MSS and MSI tumors of the NSHDS and 3.0 and 8.8% CIMP-H rate for MSS and MSI tumors, respectively in the larger CRUMS. Therefore, although the frequency of CIMP-H in this study is lower than expected, it is in accordance with these larger European studies. More importantly, the poor prognostic effect observed here in patients with CIMP-H and CIMP-L tumors in comparison to those showing CIMP-negativity agrees with several works from other authors (Ward et al., 2003; Kim et al., 2009; Dahlin et al., 2010). In addition, our findings show no association of MGMT methylation with prognosis, a result which was also recently observed by Shima et al. (2011).
A recent review by Curtin et al. (2011), stresses that in contrast to the relatively straightforward determination of MSI tumor status, a consensus panel of CpG sites for CIMP determination has not yet been made. To date, studies evaluating CIMP have shown considerable variability in the selection of CIMP-related promoters, definition of threshold values, and variation in the number of methylated genes to define CIMP-L and CIMP-H. In this study 41% of all cases could not be classified into any one of Jass’s five proposed molecular subgroups. Eighty-six percent of these unclassifiable cases were CIMP-L and 11% CIMP-H. This finding stresses again that the definition of CIMP status can significantly compromise the validation of a molecular classification of colorectal cancer based on three categories of CIMP. One possibility would be to evaluate CIMP-negative versus CIMP+ tumor, regardless of the degree of methylation. Supporting this further, our study here shows that in the case of BRAF wild-type patients, CIMP-L, and H cancers segregate together in CART analysis.
Although evidence suggests that CIMP not only plays a major role in the pathogenesis but also in the prognosis of patients with colorectal cancer, an effective classification is clearly hindered by the definition of high and low-level CIMP. The selection of promoter regions, number of CpG sites, analysis method and cut-off values leading to standardized definitions of CIMP status all warrant considerable investigation.
Conflict of Interest Statement
The authors declare that the research was conducted in the absence of any commercial or financial relationships that could be construed as a potential conflict of interest.
Acknowledgments
The authors would like to thank Dr. Andreas Papassotiropoulos, Biozentrum, University of Basel, for technical support on this project. This study was supported by the Krebsliga beider Basel (Gesuch 03-2007). The study sponsor did not have any role in the conception, carrying out or decision to publish this manuscript.
References
Ahn, J. B., Chung, W. B., Maeda, O., Shin, S. J., Kim, H. S., Chung, H. C., Kim, N. K., and Issa, J. P. (2011). DNA methylation predicts recurrence from resected stage III proximal colon cancer. Cancer 117, 1847–1854.
Andreyev, H. J., Norman, A. R., Cunningham, D., Oates, J. R., and Clarke, P. A. (1998). Kirsten ras mutations in patients with colorectal cancer: the multicenter “RASCAL” study. J. Natl. Cancer Inst. 90, 675–684.
Boland, C. R., and Goel, A. (2010). Microsatellite instability in colorectal cancer. Gastroenterology 138, 2073–2087, e3.
Colella, S., Shen, L., Baggerly, K. A., Issa, J. P., and Krahe, R. (2003). Sensitive and quantitative universal Pyrosequencing methylation analysis of CpG sites. Biotechniques 35, 146–150.
Curtin, K., Slattery, M. L., and Samowitz, W. S. (2011). CpG island methylation in colorectal cancer: past, present and future. Patholog. Res. Int. 2011, 902674.
Dahlin, A. M., Palmqvist, R., Henriksson, M. L., Jacobsson, M., Eklof, V., Rutegard, J., Oberg, A., and Van Guelpen, B. R. (2010). The role of the CpG island methylator phenotype in colorectal cancer prognosis depends on microsatellite instability screening status. Clin. Cancer Res. 16, 1845–1855.
Issa, J. P. (2000). CpG-island methylation in aging and cancer. Curr. Top. Microbiol. Immunol. 249, 101–118.
Jass, J. R. (1986). Lymphocytic infiltration and survival in rectal cancer. J. Clin. Pathol. 39, 585–589.
Jass, J. R. (2007). Classification of colorectal cancer based on correlation of clinical, morphological and molecular features. Histopathology 50, 113–130.
Jover, R., Nguyen, T. P., Perez-Carbonell, L., Zapater, P., Paya, A., Alenda, C., Rojas, E., Cubiella, J., Balaguer, F., Morillas, J. D., Clofent, J., Bujanda, L., Reñé, J. M., Bessa, X., Xicola, R. M., Nicolás-Pérez, D., Castells, A., Andreu, M., Llor, X., Boland, C. R., and Goel, A. (2011). 5-Fluorouracil adjuvant chemotherapy does not increase survival in patients with CpG island methylator phenotype colorectal cancer. Gastroenterology 140, 1174–1181.
Kim, J. C., Choi, J. S., Roh, S. A., Cho, D. H., Kim, T. W., and Kim, Y. S. (2010). Promoter methylation of specific genes is associated with the phenotype and progression of colorectal adenocarcinomas. Ann. Surg. Oncol. 17, 1767–1776.
Kim, J. H., Shin, S. H., Kwon, H. J., Cho, N. Y., and Kang, G. H. (2009). Prognostic implications of CpG island hypermethylator phenotype in colorectal cancers. Virchows Arch. 455, 485–494.
Kloor, M., Michel, S., and von Knebel Doeberitz, M. (2010). Immune evasion of microsatellite unstable colorectal cancers. Int. J. Cancer 127, 1001–1010.
Lee, S., Cho, N. Y., Yoo, E. J., Kim, J. H., and Kang, G. H. (2008). CpG island methylator phenotype in colorectal cancers: comparison of the new and classic CpG island methylator phenotype marker panels. Arch. Pathol. Lab. Med. 132, 1657–1665.
Nosho, K., Irahara, N., Shima, K., Kure, S., Kirkner, G. J., Schernhammer, E. S., Hazra, A., Hunter, D. J., Quackenbush, J., Spiegelman, D., Giovannucci, E. L., Fuchs, C. S., and Ogino, S. (2008). Comprehensive biostatistical analysis of CpG island methylator phenotype in colorectal cancer using a large population-based sample. PLoS ONE 3, e3698. doi:10.1371/journal.pone.0003698
Ogino, S., Cantor, M., Kawasaki, T., Brahmandam, M., Kirkner, G. J., Weisenberger, D. J., Campan, M., Laird, P. W., Loda, M., and Fuchs, C. S. (2006). CpG island methylator phenotype (CIMP) of colorectal cancer is best characterised by quantitative DNA methylation analysis and prospective cohort studies. Gut. 55, 1000–1006.
Ogino, S., Kawasaki, T., Kirkner, G. J., Kraft, P., Loda, M., and Fuchs, C. S. (2007). Evaluation of markers for CpG island methylator phenotype (CIMP) in colorectal cancer by a large population-based sample. J. Mol. Diagn. 9, 305–314.
Ogino, S., Nosho, K., Kirkner, G. J., Kawasaki, T., Meyerhardt, J. A., Loda, M., Giovannucci, E. L., and Fuchs, C. S. (2009). CpG island methylator phenotype, microsatellite instability, BRAF mutation and clinical outcome in colon cancer. Gut 58, 90–96.
Potapova, A., Albat, C., Hasemeier, B., Haeussler, K., Lamprecht, S., Suerbaum, S., Kreipe, H., and Lehmann, U. (2011). Systematic cross-validation of 454 sequencing and pyrosequencing for the exact quantification of DNA methylation patterns with single CpG resolution. BMC Biotechnol. 11, 6. doi:10.1186/1472-6750-11-6
Samowitz, W. S., Albertsen, H., Sweeney, C., Herrick, J., Caan, B. J., Anderson, K. E., Wolff, R. K., and Slattery, M. L. (2006). Association of smoking, CpG island methylator phenotype, and V600E BRAF mutations in colon cancer. J. Natl. Cancer Inst. 98, 1731–1738.
Sanchez, J. A., Krumroy, L., Plummer, S., Aung, P., Merkulova, A., Skacel, M., DeJulius, K. L., Manilich, E., Church, J. M., Casey, G., and Kalady, M. F. (2009). Genetic and epigenetic classifications define clinical phenotypes and determine patient outcomes in colorectal cancer. Br. J. Surg. 96, 1196–1204.
Shima, K., Morikawa, T., Baba, Y., Nosho, K., Suzuki, M., Yamauchi, M., Hayashi, M., Giovannucci, E., Fuchs, C. S., and Ogino, S. (2011). MGMT promoter methylation, loss of expression and prognosis in 855 colorectal cancers. Cancer Causes Control 22, 301–309.
Tost, J., Dunker, J., and Gut, I. G. (2003). Analysis and quantification of multiple methylation variable positions in CpG islands by Pyrosequencing. Biotechniques 35, 152–156.
Toyota, M., Ahuja, N., Ohe-Toyota, M., Herman, J. G., Baylin, S. B., and Issa, J. P. (1999). CpG island methylator phenotype in colorectal cancer. Proc. Natl. Acad. Sci. U.S.A. 96, 8681–8686.
Umar, A., Boland, C. R., Terdiman, J. P., Syngal, S., de la Chapelle, A., Ruschoff, J., Fishel, R., Lindor, N. M., Burgart, L. J., Hamelin, R., Hamilton, S. R., Hiatt, R. A., Jass, J., Lindblom, A., Lynch, H. T., Peltomaki, P., Ramsey, S. D., Rodriguez-Bigas, M. A., Vasen, H. F., Hawk, E. T., Barrett, J. C., Freedman, A. N., and Srivastava, S. (2004). Revised Bethesda guidelines for hereditary nonpolyposis colorectal cancer (Lynch syndrome) and microsatellite instability. J. Natl. Cancer Inst. 96, 261–268.
Van Rijnsoever, M., Elsaleh, H., Joseph, D., McCaul, K., and Iacopetta, B. (2003). CpG island methylator phenotype is an independent predictor of survival benefit from 5-fluorouracil in stage III colorectal cancer. Clin. Cancer Res. 9, 2898–2903.
Ward, R. L., Cheong, K., Ku, S. L., Meagher, A., O’Connor, T., and Hawkins, N. J. (2003). Adverse prognostic effect of methylation in colorectal cancer is reversed by microsatellite instability. J. Clin. Oncol. 21, 3729–3736.
Keywords: CpG island methylator phenotype, colorectal cancer, DNA methylation, BRAF, prognosis
Citation: Zlobec I, Bihl MP, Foerster A, Rufle A, Terracciano L and Lugli A (2012) Stratification and prognostic relevance of Jass’s molecular classification of colorectal cancer. Front. Oncol. 2:7. doi: 10.3389/fonc.2012.00007
Received: 29 November 2011;
Paper pending published: 20 December 2011;
Accepted: 16 January 2012;
Published online: 27 February 2012.
Edited by:
Michael Vieth, Klinikum Bayreuth, GermanyReviewed by:
Lothar Veits, Klinikum Bayreuth, GermanyRegine Schneider-Stock, University of Erlangen-Nürnberg, Germany
Copyright: © 2012 Zlobec, Bihl, Foerster, Rufle, Terracciano and Lugli. This is an open-access article distributed under the terms of the Creative Commons Attribution Non Commercial License, which permits non-commercial use, distribution, and reproduction in other forums, provided the original authors and source are credited.
*Correspondence: Inti Zlobec, Institute of Pathology, Translational Research, University of Bern, Murtenstrasse 31, CH-3010 Bern, Switzerland. e-mail: inti.zlobec@pathology.unibe.ch
†Inti Zlobec and Michel P. Bihl have contributed equally to this work.