Grain nutritional and antioxidant profiling of diverse lentil (Lens culinaris Medikus) genetic resources revealed genotypes with high nutritional value
 Fareeha Riaz
 Amjad Hameed
 Muhammad Jawad Asghar
- Nuclear Institute for Agriculture and Biology College, Pakistan Institute of Engineering and Applied Sciences (NIAB-C, PIEAS), Faisalabad, Pakistan
The lentil (Lens culinaris Medikus ssp. Culinaris) is a self-pollinating, diploid (2n = 2X = 14) crop with a genome size of 4 Gbp. The present study was conducted to provide a database for the evaluation of lentil antioxidant capacity, nutritional quality, and biochemical attributes. For these purposes, lentil germplasm, including 100 exotic and local genotypes from different agro-climatic zones of Pakistan, was collected. Significant variation (p < 0.05) was found among the genotypes under investigation using the Tukey HSD test. Ascorbate peroxidase was highest in ALTINOPARK (2,465 Units/g s. wt.), catalase in LPP 12110 (5,595 Units/g s. wt.), superoxide dismutase in LPP 12105 (296.75 Units/g s. wt.), and peroxidase in NIAB Masoor 2002 (3,170 Units/g s. wt.). Furthermore, NLM 15016 had a maximum total antioxidant capacity of 15.763 mg/g s. wt. The maximum values of total soluble sugars (83.93 mg/g. s. wt.) and non-reducing sugars (74.79 mg/g. s. wt.) were noticed in NLM 15015. The highest reducing sugars were detected in ILL 8006 (45.68 mg/g. s. wt.) ascorbic acid in LPP 12182 (706 μg/g s. wt.), total phenolic content in NLI 17003 (54,600 μM/g s. wt.), and tannins in NLI 17057 (24,563 μM/g s. wt.). The highest chlorophyll a (236.12 μg/g s. wt.), chlorophyll b (317 μg/g s. wt.), total chlorophyll (552.58 μg/g s. wt.), and lycopene (10.881 μg/g s. wt.) were found in NLH 12097. Maximum total carotenoids were revealed in the local approved variety Markaz 2009 (17.89 μg/g s. wt.). Principal component analysis (PCA), correlation analysis (Pearson’s test), and agglomerative hierarchical clustering (AHC) were performed to detect the extent of variation in genotypes. In cluster analysis, all genotypes were categorized into three clusters. Cluster II genotypes showed remarkable divergence with cluster III. According to PCA, the contribution of PC-I regarding tested nutritional parameters toward variability was the highest (39.75%) and indicated positive factor loading for the tested nutritional and biochemical parameters. In conclusion, genotype X 2011S 33–34-32 can be used by the food industry in making pasta, multigrain bread, and snacking foods due to its high protein content for meat alternative seekers. Identified genotypes with high nutritional attributes can be utilized to improve quality parameters in the respective lentil breeding lines.
Introduction
In recent years, grain legumes have acquired remarkable importance in the food industry and among consumers. This consumption pattern is primarily accelerated by consumers based on environment-supportable plant-based proteins (1, 2). The increased legume utilization and consumption are attributed to education levels and knowledge among consumers that significantly enhance the issues regarding food nutritional profile, health benefits, and food quality (3). The health benefits of legumes are clearly associated with certain antioxidants present in them. These antioxidants retard the oxidation of several oxidizable molecules and, hence, play crucial roles in preventing excessive production of reactive oxygen species (ROS) or free radicals. Free radicals are unstable, harmful molecules, which are produced as a result of an imbalance between antioxidant enzymes and reactive oxygen species. Furthermore, antioxidants are the crucial constituents of various diets that scavenge ROS, or free radicals, and thus impede oxidative mechanisms (2). Synthetic antioxidants are synthesized commercially and are further utilized in various industrial approaches. On the other hand, natural antioxidants are mainly found in various fruits and legumes, such as chickpeas, lentils, peas, and beans (4, 5). These natural antioxidants are continuously gaining enormous importance among food industry nutritionists due to their therapeutic and safety potential (6). In order to maintain regular biological activities and functions, a suitable balance is necessary between free radicals and antioxidants. Enzymatic antioxidants, for example, ascorbate peroxidase (APX) and superoxide dismutase (SOD), have the ability to eliminate hydrogen peroxide and other reactive oxygen species (ROS) (7, 8). Non-enzymatic antioxidants consist of two classes: membrane-bound (lipid-soluble), such as beta-carotene and alpha-tocopherol, and water-soluble reducing agents like phenolic compounds and ascorbic acid (9).
Pulses, including lentil (Lens culinaris Medikus), have attained immense popularity among food processors and consumers in recent times. The increasing demand for lentils is due to users opting for environmentally sustainable food resources and plant-based proteins. The global lentil production has increased 2-fold since 2001 (from 3.15 to 6.58 million metric tons in 2020), which reveals the commercial and domestic importance of this nutrient-rich legume (1).
The utilization of legumes, such as lentils, is gaining escalating recognition in multiple food applications. Because of their balanced protein and fat content, lentil flour represents the best option for the formation of novel and high-performing grain flour products (10–12). Overall, lentil flour can replace wheat flour with improved nutritional profile (13), reduced total carbohydrate content, significantly elevated protein, flavonoids, and antioxidant potential (14). Among legumes, lentil has gained immense importance in quality and production worldwide. Lentils are sown in more than 40 countries, with Canada, Turkey, Australia, the United States, and India being the largest producers (15). In the early 1980s, lentil was introduced to North America as a new crop to the preexisting crop rotation. Currently, lentil is considered as a major legume crop in both the United States and Canada (16). It is mainly cultivated in Southeast Asia and consumed as a soup made from split pulse (dhal) or as a whole grain. It is used in many culinary dishes in the Middle East and Southeast Asia and incorporated in broths and soups in North America and European countries (17). Lentil is the second largest cultivated legume (Rabi season) crop in Pakistan after chickpea (Cicer arietinum L.), both in quantity and quality (18). It is grown to 5% area under pulse production (19).
In addition to their remarkable nutritional profile, lentils also exhibit a number of phytochemicals, e.g., flavonoids, tocopherols, and carotenoids, and are well known to have the highest antioxidant properties (20, 21) given the existence of several bound and extractable phenolic compounds (22). The two major phenolic compounds present in lentils are phenolic acids and condensed tannins (20). Additionally, lentils contain several groups of phenolic compounds, which act as antioxidants. These antioxidant groups have the ability to suppress the formation of many reactive oxygen species (ROS) (23, 24).
However, the new trends in pulse consumption and their possible health benefits demand further investigation of certain antioxidant agents present in legumes, like lentils (25). There is a dire need to further investigate the possible antioxidant compounds present in lentils (2). To date, inadequate information is available for further evaluation of the nutritional, antioxidant capacity, and biochemical profiles of several diverse lentil genotypes. Keeping this in mind, the current study aimed to unveil the nutritional and biochemical attributes of Pakistani and exotic lentil genotypes. These explored genotypes with diverse nutraceutical properties can be utilized by nutraceuticals and lentil-based food industries for the development of lentil-based food byproducts. In the future, prospectively tested lentil varieties with high-quality parameters can be utilized by breeders with the idea of exploring high-quality lentil varieties.
Materials and methods
In the current study, lentil germplasm (100 genotypes), comprising local and exotic genotypes, was collected from different agro-morphological zones of Pakistan. These genotypes were studied for the assessment of different biochemical and nutritional parameters (Table 1). The two-field experiments were carried out at the Nuclear Institute for Agriculture and Biology (NIAB), Faisalabad, Pakistan (longitude 73.08969000 and latitude 31.41554000 with an average rainfall of 526 mm) field area during cropping seasons 2020 and 2021 in a duplicate manner under Randomized Complete Block Design (RCBD), following the same agronomic practices throughout the growth period. The size of the plot was 2 M × 0.30 M, and the plant-to-plant and row-to-row distances were 10 cm and 30 cm.
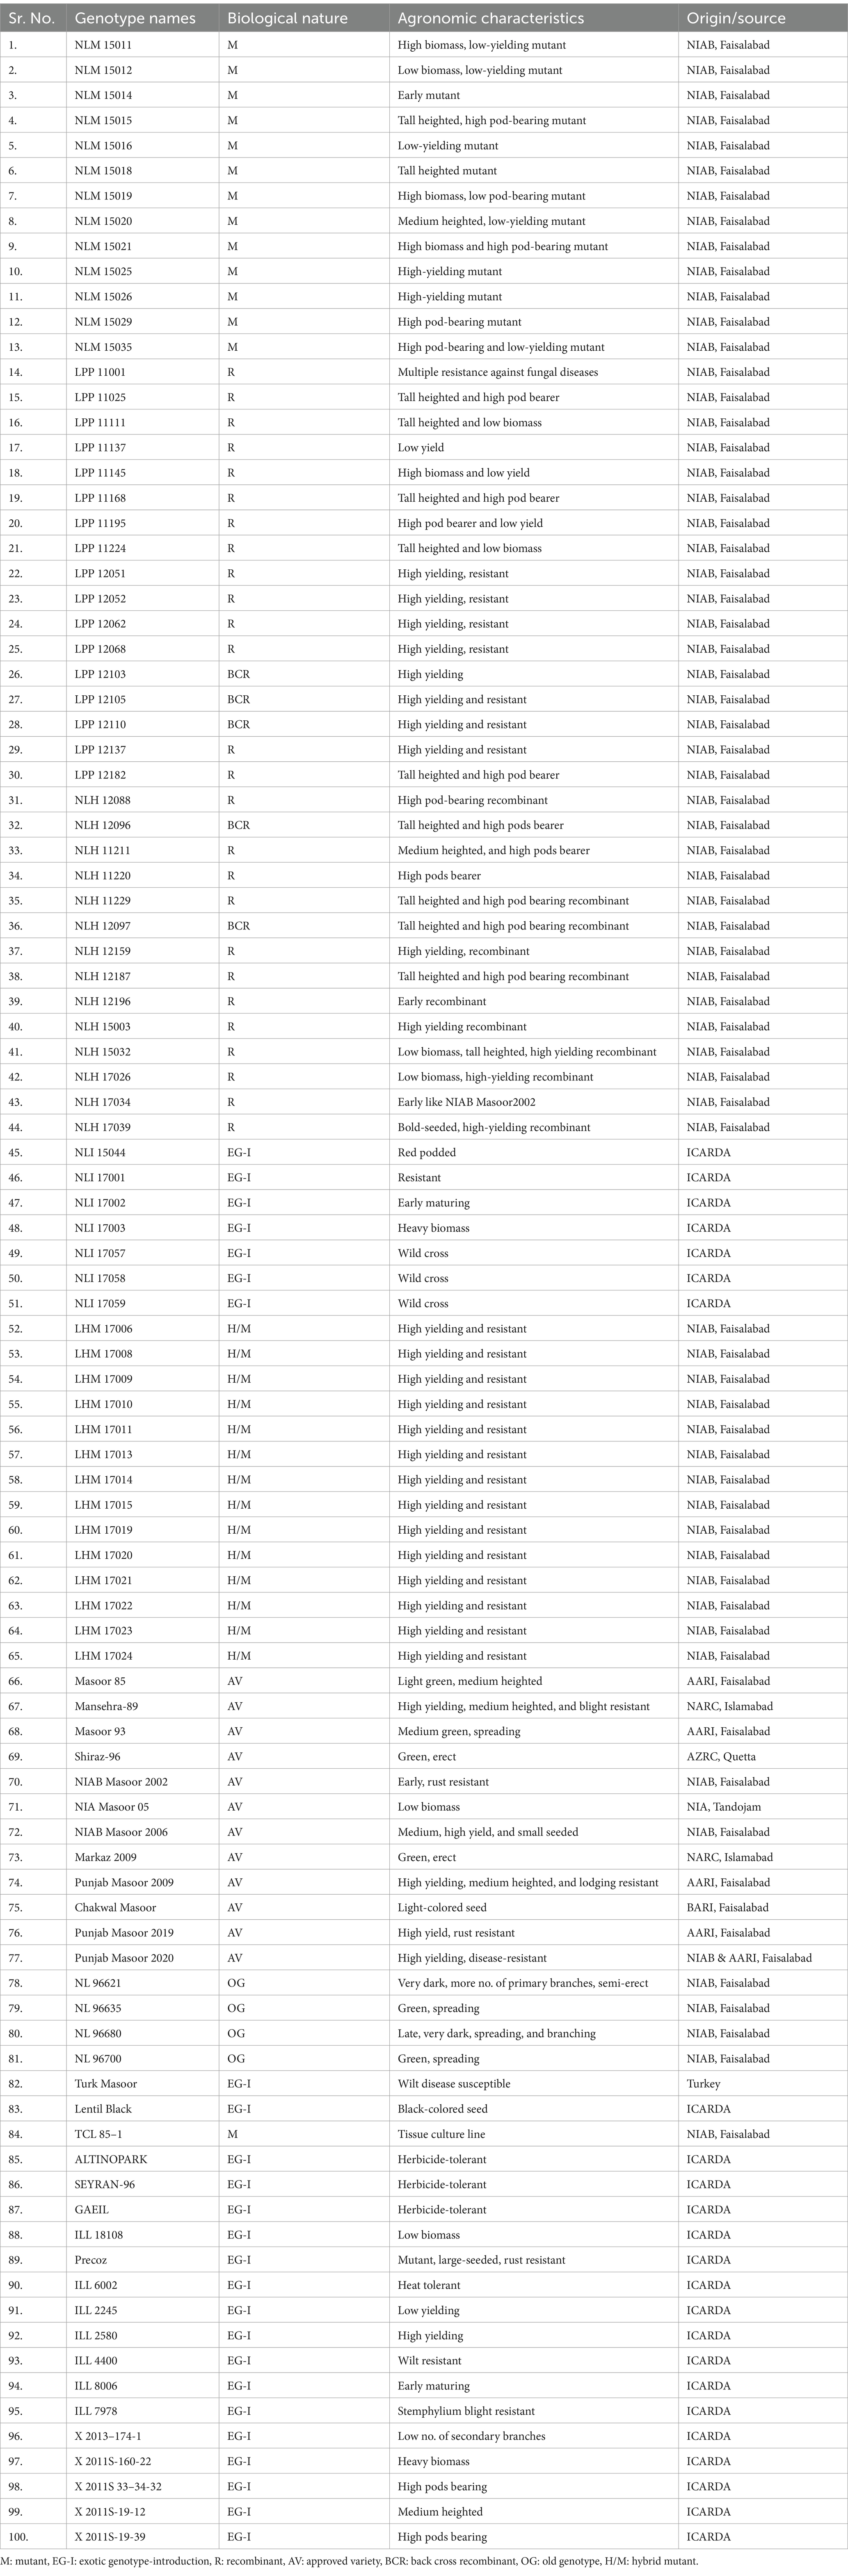
Table 1. List of lentil genotypes (100) used for biochemical analysis in the current study.
Lentil germplasm (100 genotypes) was harvested during 2020 and 2021 for biochemical and nutritional analysis (Table 1). The seed samples were packed in plastic bottles to ensure integrity. The seed analysis was performed in Marker-Assisted Breeding (MAB) Lab-1, Plant Breeding and Genetics Division (PBGD), Nuclear Institute of Agriculture and Biology (NIAB), Faisalabad, Pakistan.
Sample extraction and preparation
Lentil seeds were ground to a fine powder in a pestle mortar, and then 1 mL of 50 mM potassium phosphate buffer (KH2PO4) was added to the 0.1 g flour sample. Samples were vortexed and centrifuged at 14,462× g for 10 min at 4°C for homogenization. The supernatant was taken for evaluation of non-enzymatic and enzymatic antioxidant activities and other biochemical and nutritional parameters.
Non-enzymatic antioxidant
Ascorbic acid
For the determination of ascorbic acid content in lentil seed samples, the dichloroindophenol (DCIP) method was used as described by Hameed et al. (26). In this assay, the reaction mixture contained 110 μL of DCIP (0.2 mg DCIP per ml of distilled water), 110 μL of 0.1% meta phosphoric acid, 100 μL sample extract, and 900 μL distilled water.
We measured reduced ascorbic acid only with this method. Shortly, ascorbic acid converts the DCIP molecule to its reduced form, DCIPH2, which can be monitored by measuring the decrease in absorbance at 520 nm spectrophotometrically.
Total phenolic content
A colorimetric method was used to determine the total phenolic content, which was described by Ainsworth and Gillespie (27) with slight modifications. In this analysis, 0.45 g of ground seed samples were homogenized in 500 μL of ice-cold 95% methanol and then incubated at room temperature for 48 h in the dark. Then the samples were centrifuged at 14,462× g for 5 min at room temperature. The supernatant was used for measuring TPC content in samples. A 150 μL supernatant was mixed with 150 μL 10% (v/v) F-C reagent, vortexed, and then 1,200 μL of 700 mM Na2CO3 was added. The sample mixture was incubated at room temperature for 1 h. Then the blank corrected absorbance was noted at 765 nm.
Tannins
Tannins were calculated from seed samples by following the method of Ainsworth and Gillespie (27). Polyvinylpolypyrrolidone (PVPP) (0.1 g) was added to the ground sample and centrifuged at 14,462× g for 10 min. The absorbance of the supernatant was measured at 765 nm by using a spectrophotometer (Hitachi) model number U-2800.
Enzymatic antioxidants
Catalase (CAT) activity
Catalase activity of the samples was measured using the method of Beers and Sizer (28). In this method, ground seeds were homogenized in 50 mM potassium phosphate buffer (pH 7.0). The assay solution consisted of 2 mL of 50 mM phosphate buffer (pH 7.0), 100 μL of 59 mM H2O2, and 0.1 mL of enzyme extract. The decrease in absorbance pattern was recorded after every 20 s at 240 nm. 1 U of enzyme activity was expressed as 0.01 absorbance change min−1, and the activity of each enzyme was checked on the basis of seed weight.
Peroxidase activity
For the evaluation of peroxidase (POD) activity, ground seed samples were homogenized in 50 mM potassium phosphate buffer (pH 7.0). Peroxidase activity was determined by using the modified method of Chance and Maehly (29). For the preparation of the assay solution, distilled water (535 μL) was added to guaiacol (100 μL), H2O2 (100 μL), potassium phosphate buffer (pH 7.0), and enzyme extract (15 μL). The reaction was initiated after adding the enzyme extract to the sample solution. The increase in absorbance of the sample solution was noted every 20 s at 470 nm. 1 U of POD activity was termed as 0.01 absorbance change min−1, and enzyme activity was checked on the basis of seed weight.
Ascorbate peroxidase activity
For the determination of ascorbate peroxidase (APX) activity, ground seed samples were homogenized in 50 mM potassium phosphate buffer (pH 7.0). APX activity was recorded using the method described by Dixit et al. (30). Assay buffer was made by adding ascorbic acid (3.4 mL), 0.5 M EDTA (10 mL), and 0.2 M potassium phosphate buffer (pH 7.0). For the preparation of the reaction mixture, assay buffer (1 mL) was added to 4 M H2O2 (1 mL) and enzyme extract (50 μL). The rate of ascorbic acid oxidation was checked by measuring the decrease in absorbance at 290 nm every 30 s.
Superoxide dismutase activity
The activity of superoxide dismutase was measured by homogenizing ground seeds in 50 mM potassium phosphate buffer (pH 7.0) and 0.1 mM EDTA, as demonstrated by Dixit et al. (30). The assay buffer was prepared by mixing distilled water (400 μL), 200 mM potassium phosphate buffer pH 7.0 (250 μL), L-methane (100 μL), Triton X-100 (100 μL), NBT (50 μL), enzyme extract (50 μL), and riboflavin (50 μL). SOD activity was checked by measuring the photochemical reduction of nitroblue tetrazolium (NBT). 1 U of enzyme activity of SOD is expressed as the amount of enzyme responsible for the inhibition of photochemical reduction of NBT by 50%.
Hydrolytic enzymes
Alpha-amylase activity
The alpha-amylase activity of seed samples was determined using the method described by Varavinit (31). In this method, there are two reagents: 3,5 dinitrosalicylic acid (DNS) and 1% starch solution. The DNS solution was prepared by adding 96 mM DNS (1 g DNS in 50 mL of distilled water) + sodium potassium tartrate (30 g) + 2 N NaOH (20 mL) and making the final volume 100 mL by using distilled water. The reaction mixture contained 0.2 mL of sample, 1.8 mL of distilled water, and 1 mL of 1% starch solution. The reaction mixture was incubated for 3 min. Then 1 mL of DNS reagent was added to each sample mixture, placed in water for 15 min at 100°C, and allowed to cool to room temperature. Finally, 9 mL of distilled water was added to each sample mixture, and the absorbance was measured at 540 nm using a spectrophotometer.
Protease activity
To determine protease activity, seed samples were homogenized in 50 mM potassium phosphate buffer (pH 7.8). Protease activity was determined with the casein digestion assay elaborated by Drapeau (32). According to this method, 1 U of protease activity is the amount of enzyme that generates acid-soluble portions equivalent to 0.001 A280/min at 37°C with a pH of 7.8.
Other biochemical aspects
Malondialdehyde content (MDA)
Lipid peroxidation activity of an enzyme can be determined by the malondialdehyde content present in it. MDA activity was measured using the method of Heath and Packer, with slight modifications elaborated by Dhindsa (33). The seed sample (0.25 g) was added to 0.1% TCA. The sample mixture was centrifuged at 14,462× g for 5 min. Then 20% TCA and 0.05% TBA (solution) were added to the supernatant. The reaction mixture was heated at 95°C for 30 min and cooled down immediately in an ice bath. Now the samples were centrifuged for 10 min at 14,462× g. The absorbance of the supernatant was noted at 532 nm, and non-specific absorption values were checked at 632 nm and subtracted. The MDA content in seed samples was measured in terms of an MDA coefficient of 155 m/M/cm.
Total oxidant status
Total oxidant status of seed samples was measured using the method of Erel (34). The amount of oxidants present in the samples, which convert ferrous ions to ferric ions in an acidic medium, was measured by using xylenol orange. In this assay, reagent 1 + reagent 2 and sample extract were used. The reagent R1 was the stock xylene orange solution containing 75 μL xylenol orange dye (0.38 g xylenol orange in 500 μL of 25 mM H2SO4), 0.409 g of NaCl, 500 μL of glycerol, and the final volume was made up to 50 mL with 25 mM H2SO4. The reagent 2 (R2) contained 0.0317 g of o-dianisidine and 0.0196 g of ferrous ammonium sulfate in 10 mL of 25 mM H2SO4. After adding 900 μL of reagent 1, 140 μL of sample, and 44 μL of reagent 2, the reaction mixture was incubated for 5 min. Then the absorbance of the reaction mixture was measured at 560 nm by using a spectrophotometer. After that, a standard curve for H2O2 was prepared. The results for TOS were expressed in μM H2O2 eq/L.
Protein content
For protein content determination, seed samples were added to 50 mM potassium phosphate buffer at pH 7. Quantitative protein was determined by using the method of Bradford (35). To perform this assay, a sample mixture was prepared by adding the supernatant (5 μL) with 0.1 N NaCl and 1 mL Bradford dye and incubating them for 15 min to form a dye–protein complex. Then the absorbance was checked at 595 nm with a spectrophotometer.
Total soluble sugars (reducing and non-reducing sugars)
Total soluble sugars in seed samples were determined by using the method of Dubois et al. (36) with phenol–sulfuric acid reagent. The amount of reducing sugars present in the samples was determined by the method of dinitrosalicylic acid by Miller (37), and non-reducing sugars were calculated by the difference between total soluble sugars and reducing sugars.
Total antioxidant capacity
Total antioxidant capacity (TAC) of lentil seed samples was measured using the method of Erel (34) with some necessary modifications. Reagent 1 (sodium acetate trihydrate) 0.16 g/150 mL and reagent 2 were made by mixing 30 mM Na-acetate, glacial acetic acid, H2O2, and ABTS solution 2 mM/L. In this assay, the reduced molecule of ABTS is oxidized to ABTS•+ by using hydrogen peroxide in acidic medium. Reduced ABTS molecules are stable for a long time, but they change their color when diluted with more acetate solutions with high pH values. The strength of the reduced ABTS molecules was checked at 660 nm spectrophotometrically.
Total flavonoids
Total flavonoid content in lentil seed samples was determined by using the aluminum chloride colorimetric method of Lin and Tang (38). In this procedure, 0.1 mL of 10% aluminum chloride, 0.1 M potassium acetate, and 2.8 mL of deionized water were added to the 2 mL sample. Then the reaction mixture was incubated for 40 min at ambient temperature. After incubation, the absorbance of the reaction mixture was measured at 415 nm spectrophotometrically.
Pigment analysis
Seed samples (0.075 g) were ground in a pestle mortar, and 1.5 mL of 80% acetone was added. These sample mixtures were then placed in the dark for overnight. Samples were centrifuged at 14,462× g for 10 min at 4°C. Finally, absorbance for carotenoids, chlorophyll a, chlorophyll b, lycopene, and total chlorophyll were recorded at 663 nm, 645 nm, 505 nm, 470 nm, and 453 nm, respectively, on the HITACHI Spectrophotometer (U-2800). Pigments (lycopene, carotenoids, chl. a, chl. B, and total chlorophyll) were measured by the methods of Arnon (39) and Lichtenthaler and Wellburn (40).
Statistical analysis
The data obtained from the current study were subjected to different statistical analyses using XL-STAT software version 2020.5. In order to organize the resulting data, descriptive statistics were performed. Correlation study, analysis of variance (ANOVA) (41) and Tukey HSD test at p < 0.05 were done to check the significance of the resulting data. Mean ± standard errors were used to construct graphs. For the selection of reliable genotypes, principal component analysis (PCA) and cluster analysis were also performed by algometric hierarchical clustering of the tested genotypes with the help of XL-STAT software version 2020.5 (42).
Results
Classification of germplasm
A total of 100 lentil genotypes used in this study were divided into three categories (low, medium, and high). The classification of genotypes was performed on the basis of different comparative values obtained for each studied biochemical parameter (Supplementary Table S1). Descriptive statistics of the groups of genotypes in the current study were also performed (Supplementary Table S2). The groupwise comparison using analysis of variance (ANOVA) and the LSD test was mentioned in Tables 2A,B.
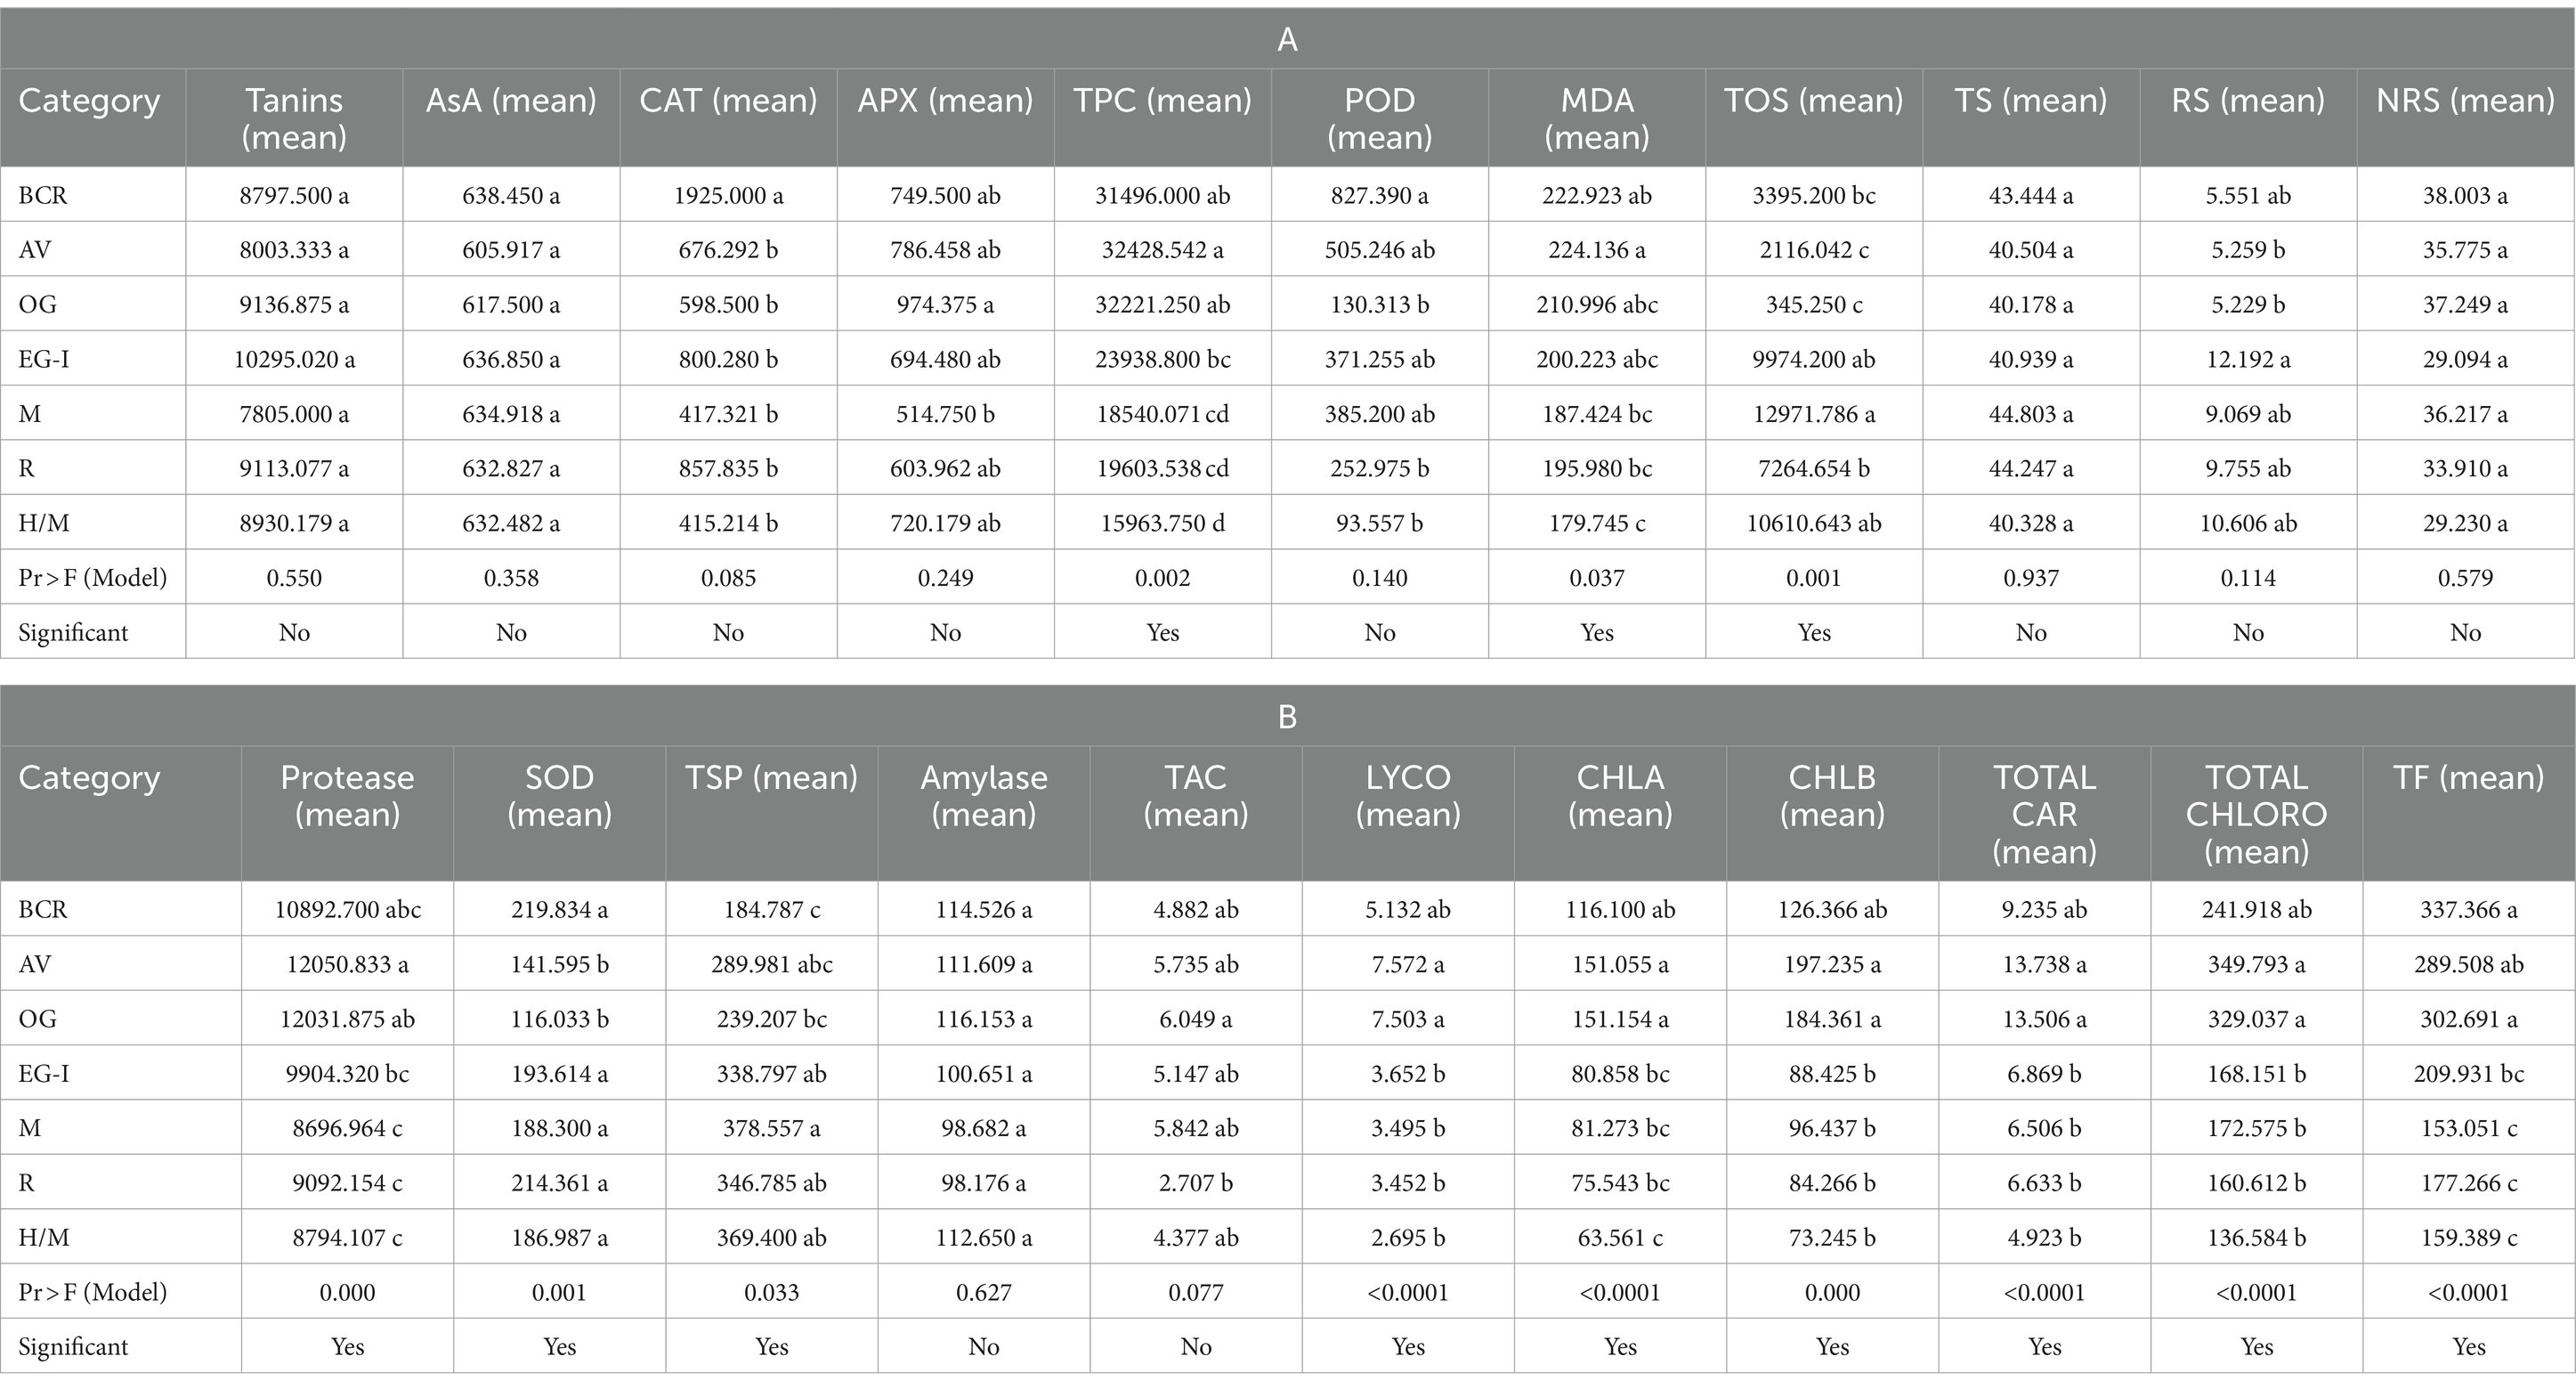
Table 2. Analysis of variance (ANOVA) and LSD for group-wise comparison of the lentil genotypes used in the current study.
Non-enzymatic antioxidants
Ascorbic acid
The high class of ascorbate ranged from 681 to 706 μg/g s. wt. and included only five genotypes, and the highest value of ascorbic acid was found in LPP 12182 (706 μg/g s. wt.). Twenty-eight genotypes were observed in the medium class, ranging from 641 to 680 μg/g s. wt., and 67 genotypes were grouped in the low class, having a low ascorbic acid content ranging from ≤640 μg/g s. wt. Among these genotypes, the lowest ascorbic acid content was found in Shiraz-96 (333 μg/g s. wt.) (Supplementary Figure S1A).
Total phenolic content
Genotypes with high class ranged from 30,001 to 54,600 μM/g s. wt. and included 31 genotypes. The highest TPC content was found in NLI 17003 (54,600 μM/g s. wt.). Fourteen genotypes were classified in the intermediate class, ranging from 15,001 to 30,000 μM/g s. wt. Low levels were recorded in 55 genotypes with values ≤15,000, and the lowest value was noticed in LHM 17010 (4,755 μM/g s. wt.) (Supplementary Figure S1B).
Tannins
High class of tannins included 42 genotypes, ranging from 10,000 to 25,000 μM/g s. wt., and NLI 17057 (24,563 μM/g s. wt.) acquired the higher tannin content. Furthermore, 44 genotypes were assembled in the medium class, ranging from 5,001 to 9,999 μM/g s. wt. Genotypes having tannin values ≤5,000 were placed in the low class and consisted of 14 genotypes, and the lowest value of tannins was noticed in LPP 11137 (257 μM/g s. wt.) (Supplementary Figure S2A).
Enzymatic antioxidants
Catalase (CAT) activity
For high-class catalase, only 10 genotypes were recorded, ranging from 2001 to 5,600, and the highest value was found in LPP 12110 (5,595 Units/g s. wt.). Eleven genotypes were classified in the medium class, ranging from 1,001 to 2000. Seventy-nine genotypes expressed low catalase activity, and NLM 15019 (30 Units/g s. wt.) showed the lowest catalase activity (Supplementary Figure S2B).
Ascorbate peroxidase activity
Fourteen genotypes were grouped in high class, ranging from 1,001 to 2,500 Units/g s. wt. and the highest activity was found in ALTINOPARK (2,465 Units/g s. wt.). Intermediate class included 26 genotypes, ranging from 701 to 1,000 Units/g s. wt. Low levels ≤700 Units/g s. wt. were observed in 60 genotypes, and the lowest value was noticed in NLM 15011 and X 2013-174-1 (41.500 Units/g s. wt.) (Supplementary Figure S3A).
Peroxidase activity
High levels were recorded in only six genotypes, ranging from 1,501 to 3,200 Units/g s. wt., and the highest activity was shown by NIAB Masoor 2002 (3,170 Units/g s. wt.). Twelve genotypes were assembled in the medium class, ranging from 501 to 1,500 Units/g s. wt. Moreover, low levels were observed in 82 genotypes, range ≤ 500 Units/g s. wt. Among the tested genotypes, the lowest activity was noticed in LPP 12062 (Supplementary Figure S3B).
Superoxide dismutase activity
High level comprised 43 genotypes, ranging from 201 to 296 Units/g s. wt., and the highest value was noticed in LPP 11195 (294.096 Units/g s. wt.). On the other hand, 33 genotypes were placed in the medium class, ranging from 141 to 200 Units/g s. wt. Twenty-four genotypes were assembled in low class for SOD content range ≤ 140 Units/g s. wt. and the least value was observed in LHM 17019 (66.97 Units/g s. wt.) (Supplementary Figure S4A).
Hydrolytic enzyme activity
Alpha-amylase activity
Only four genotypes showed high alpha-amylase content ranging from 151 to 273 mg/g s. wt., and the highest value was found in LPP 12137 (271.87 mg/g s. wt.). Furthermore, the medium class included 54 genotypes ranging from 101 to 150 mg/g s. wt. Low levels were noticed in 42 genotypes ranging ≤100 mg/g. s. wt., and NLM 15035 (60.54 mg/g. s. wt.) exhibited the lowest activity (Supplementary Figure S4B).
Protease activity
Among all tested genotypes, the high class included 40 genotypes ranging from 10,001 to 17,000 Units/g. s. wt., and Masoor 93 exhibited the highest value (16,050 Units/g. s. wt.). Thirty-three genotypes exhibited intermediate protease content ranging from 8,001 to 10,000 Units/g. s. wt. Low levels were recorded in 27 genotypes ranging ≤8,000 Units/g. s. wt., and LPP 11111 (6,125 Units/g. s. wt.) showed the lowest protease content (Supplementary Figure S5A).
Other biochemical parameters
Total oxidant status
High class included only 17 genotypes ranging from 15,001 to 48,000 μM/g. s. wt., and the highest value was observed in NLM 15029 (47,487 μM/g. s. wt.). Among all genotypes, 40 genotypes were assorted in the medium class, ranging from 5,001 to 15,000 μM/g. s. wt. Forty-three genotypes exhibited low levels ranging ≤5,000 μM/g. s. wt., and the lowest value of TOS was recorded in NLI 17057 (48 μM/g. s. wt.) (Supplementary Figure S5B).
Malondialdehyde content
Twenty-four genotypes were grouped into high class, ranging from 231 to 301 Units/g s. wt., and the highest value was found in the local Pakistani variety Punjab Masoor, 2009 (300.5 μM/g s. wt.). Medium class included a larger number of genotypes, and 60 genotypes were assembled in this group, ranging from 161 to 230 μM/g s. wt. On the other hand, low MDA content was noticed in 16 genotypes ranging ≤160 μM/g s. wt., and the lowest value was shown by NLH 17034 (97.82 μM/g s. wt.) (Supplementary Figure S6).
Protein content
High protein levels were found in 58 genotypes, ranging from 351 to 548 mg/g s. wt. Highest value was found in X 2011S-19-39 (546.33 mg/g s. wt.). Eighteen genotypes were placed at medium levels ranging from 201 to 350 mg/g s. wt. Low level was found in 24 genotypes under the range ≤ 5 mg/g s. wt., and ILL 18108 exhibited the lowest protein content (38.17 mg/g s. wt.) (Supplementary Figure S7A).
Total soluble sugars content
Twenty genotypes were included in the high class, ranging from 51 to 85 mg/g. s. wt., and NLM 15015 (83.9 mg/g. s. wt.) possessed the highest soluble sugar content. On the other hand, 64 genotypes were grouped in the medium class, ranging from 31 to 50 mg/g. s. wt. In the low class, 16 genotypes were found, and the lowest value was noticed in GAEIL (11.49 mg/g. s. wt.) (Supplementary Figure S7B).
Reducing sugar content
Only three genotypes were classified in the high class of reducing sugars, ranging from 30.1 to 46 mg/g. s. wt., and the highest content was found in ILL 8006 (45.68 mg/g. s. wt.). While 21 genotypes were categorized in the medium class, ranging from 10.1 to 30 mg/g. s. wt. Seventy-six genotypes were placed in the low class under the range ≤ 10 mg/g. s. wt., and the lowest RS value was noticed in Markaz 2009 (3.0 mg/g. s. wt.) (Supplementary Figure S8A).
Non-reducing sugars content
Only seven genotypes exhibited high NRS values, ranging from 50.1 to 75 mg/g. s. wt., and NLM 15015 (74.7 mg/g. s. wt.) exhibited the highest NRS values. Seventy-two genotypes were categorized in the medium class, ranging from 20.1 to 50 mg/g s. wt. Among all tested genotypes, low values were observed in 21 genotypes ranging ≤20 mg/g. s. wt., and X 2011S-160-22 (3.69 mg/g s. wt.) exhibited the least NRS content (Supplementary Figure S8B).
Total antioxidant capacity
In the high category, eight genotypes were observed, ranging from 10.1 to 16 μM/g. s. wt., and NLM 15016 showed the highest TAC value (15.76 μM/g. s. wt.). Thirty-seven genotypes were classified in the medium class, ranging from 5.01 to 10 μM/g. s. wt. Fifty-five genotypes were placed in the low class, ranging ≤5 μM/g. s. wt., and the lowest value was observed in LPP 11224 (0.331 μM/g s. wt.) (Supplementary Figure S9A).
Total flavonoid content
Thirty-four genotypes were assembled in high class, ranging from 300.01 to 367 μg/mL s. wt., and the highest value was noticed in NLI 17059 (366.42 μg/mL s. wt.). Medium class included 14 genotypes ranging from 150.01 to 300 μg/mL s. wt. Fifty-two genotypes were grouped in low class, ranging ≤150 μg/mL s. wt., and NLH 12187 showed the least TF value (57.36 μg/mL s. wt.) (Supplementary Figure S9B).
Pigments content
Thirty-four genotypes were assorted in high class, ranging from 10.01 to 18 μg/g s. wt., and the highest value was exhibited by Markaz 2009 (17.89 μg/g s. wt.). Medium class included 22 genotypes ranging from 5.01 to 10 μg/g s. wt. Low carotenoid content was observed in 44 genotypes ranging ≤5 μg/g s. wt., and the lowest value was found in ILL 6002 (1.31 μg/g s. wt.) (Supplementary Figure S10A).
Only three genotypes were grouped in high class, ranging from 200.01 to 240 μg/g s. wt., and the highest (chlorophyll a) content was observed in NLH 12097 (236.12 μg/g s. wt.). In the medium class, 40 genotypes were included, ranging from 100.01 to 200 μg/g s. wt. Among all tested genotypes, 57 genotypes were found in the low class, ranging ≤100 μg/g s. wt., and LHM 17010 (25.14 μg/g s. wt.) possessed the least value (Supplementary Figure S10B).
Sixteen genotypes are assembled in high class, ranging from 200.01 to 320 μg/g s. wt., and the highest chlorophyll b content was found in NLH 12097 (317 μg/g s. wt.). Medium class included 31 genotypes ranging from 100.01 to 200 μg/g s. wt. Low levels of chlorophyll b included 53 genotypes, and NLH 11211 (8.39 μg/g, s. wt.) showed the lowest chlorophyll b content (Supplementary Figure S11A).
The highest value of total chlorophyll was found in NLH 12097 (552.58 μg/g s. wt.). Medium class included 27 genotypes ranging from 150.01 to 250 μg/g s. wt. Furthermore, 41 genotypes were classified in the low class, ranging ≤150 μg/g s. wt., and the lowest value was noticed in NLH 11211 (35.19 μg/g s. wt.) (Supplementary Figure S11B).
Only three genotypes were placed in high class, ranging from 10.00 to 11.00 μg/g s. wt., and NLH 12097 (10.881 μg/g s. wt.) showed the highest lycopene content. In the medium class, 30 genotypes were assembled, ranging from 5.0 to 9.99 μg/g s. wt. On the other hand, low lycopene values were observed in 67 genotypes ranging ≤5 μg/g s. wt., and NLH 11211 (0.686 μg/g s. wt.) exhibited the least value (Supplementary Figure S12).
Principal component analysis
In order to analyze the variation among the tested genotypes, the data were transformed into principal factors. The analyzed data were subjected to principal component analysis (PCA) to investigate the interrelationship between variables. Out of 22 (Pc) principal components, five PCs: PC-1, PC-II, PC-III, PC-IV, and PC-V, showed Eigenvalues >1 and exhibited 69.23% cumulative variability among 100 lentil genotypes (Table 3). The contribution of PC-1 toward variability was highest (39.75%), followed by PC-II (9.43%), PC-III (8.15%), PC-IV (6.33%), PC-V (5.55%), PC-VI (4.48%), and PC-VII (3.69%). The biplot demonstrates the overall association of lentil genotypes for 22 traits (Figure 1). The first two principal components (PCs) that contributed (49.19%) toward the total variance were drawn as PC-1 (39.76%) on the x-axis and PC-II (9.43%) on the y-axis for the determination of association among different clusters. The genotype-by-trait (G-T) biplot demonstrated 49.19% of total variation. To show the interrelationship between different characters in a genotype by trait biplot, a vector was plotted from the origin toward every trait.
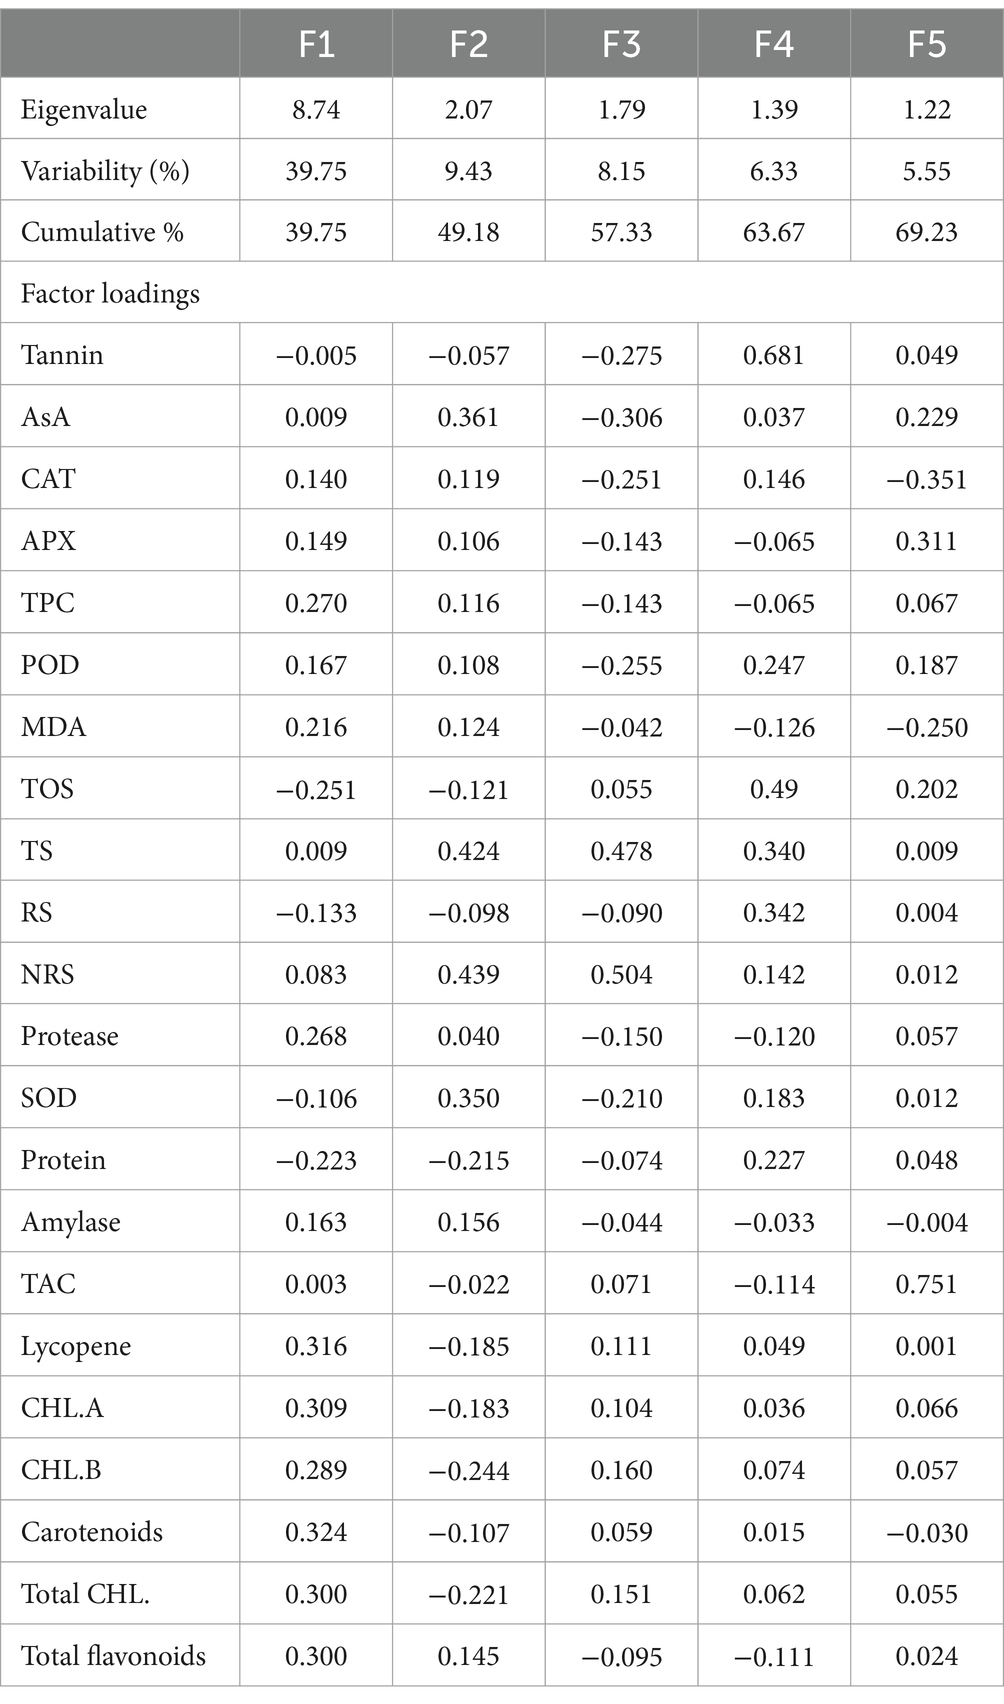
Table 3. Principal component analysis for biochemical traits in lentil genotypes.
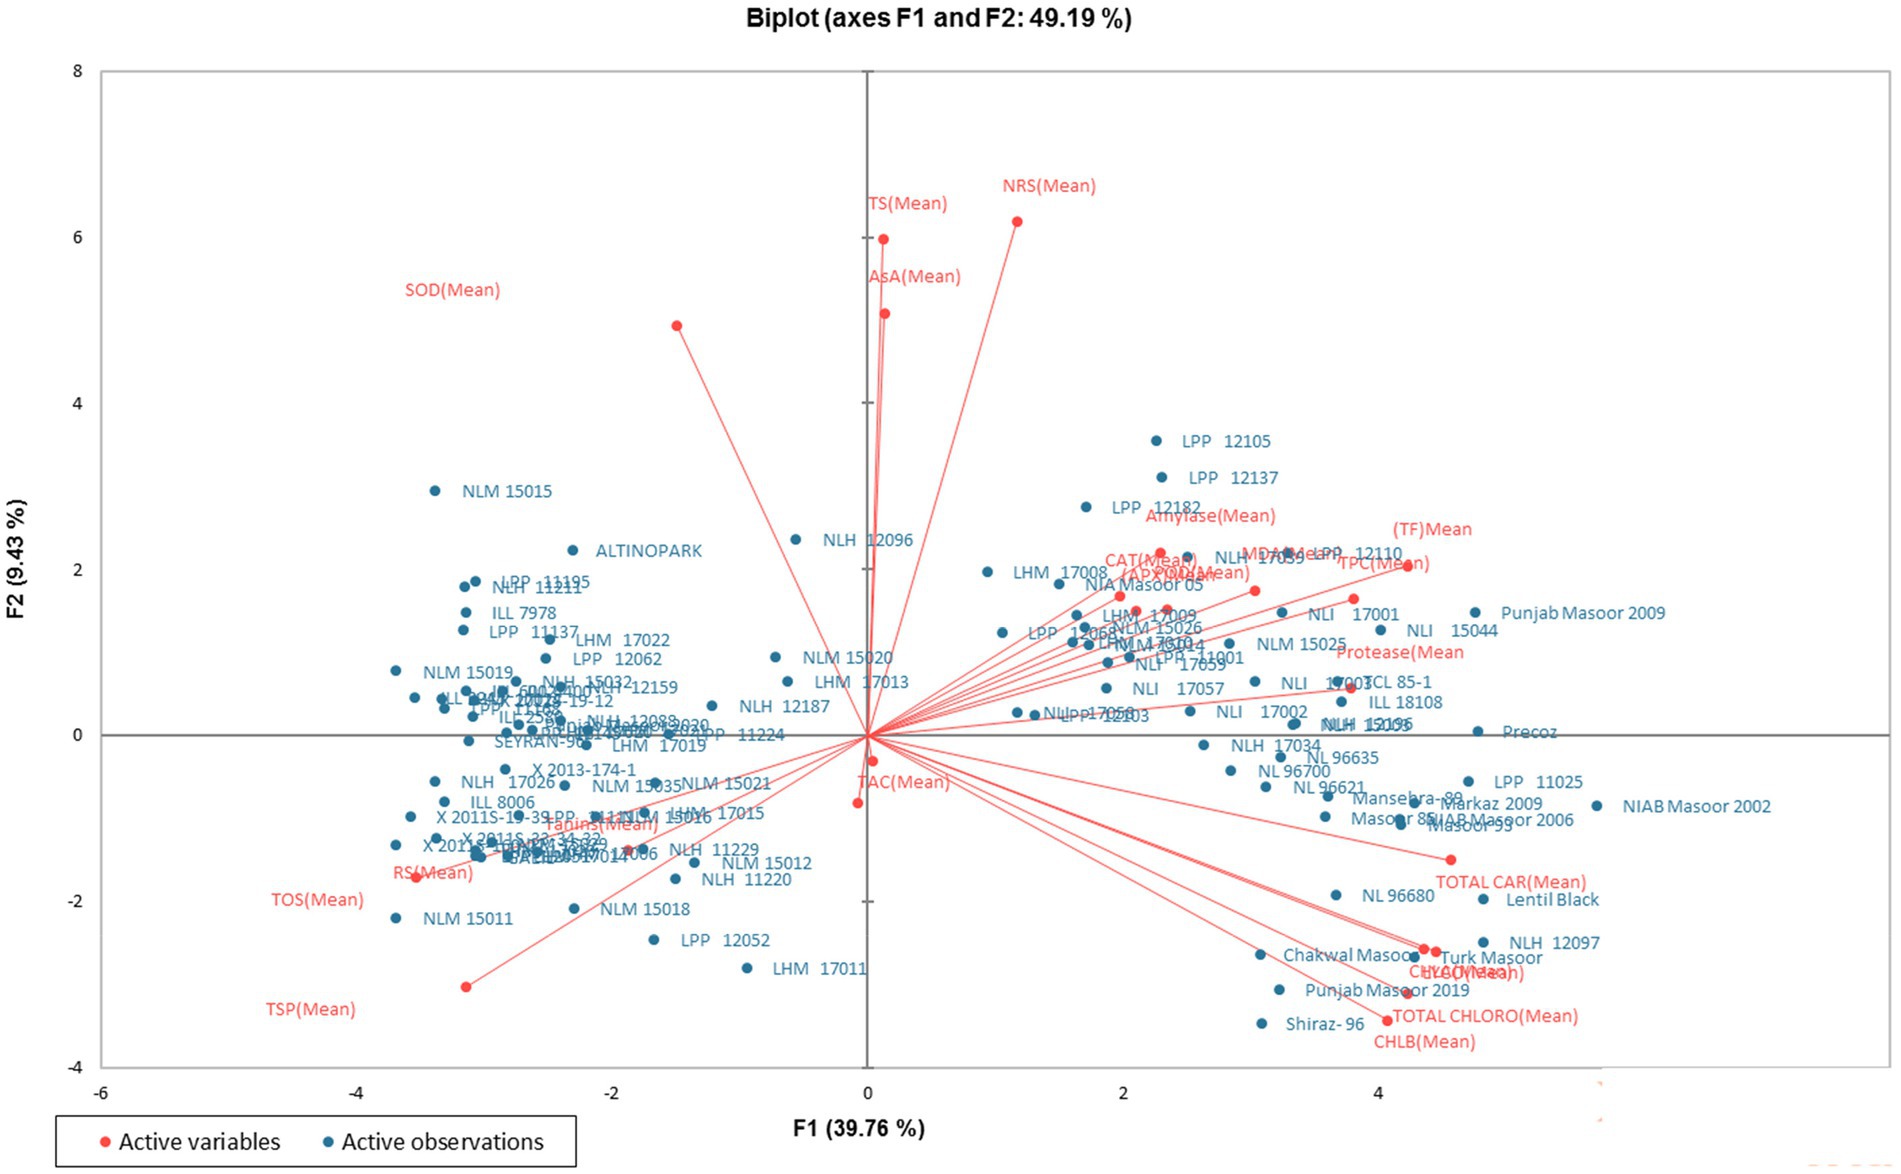
Figure 1. Genotype-by-trait biplot of lentil genotypes for the first two PCs (principal components).
Cluster analysis
Clustering of different studied genotypes based on various traits is shown in Table 4. A total of 100 lentil genotypes are divided into three clusters undergoing cluster analysis (Figure 2). Cluster I exhibited 52 genotypes, followed by cluster II, which encompassed 46 genotypes, and finally, cluster III included only two genotypes, which showed remarkable variability in the different studied traits.
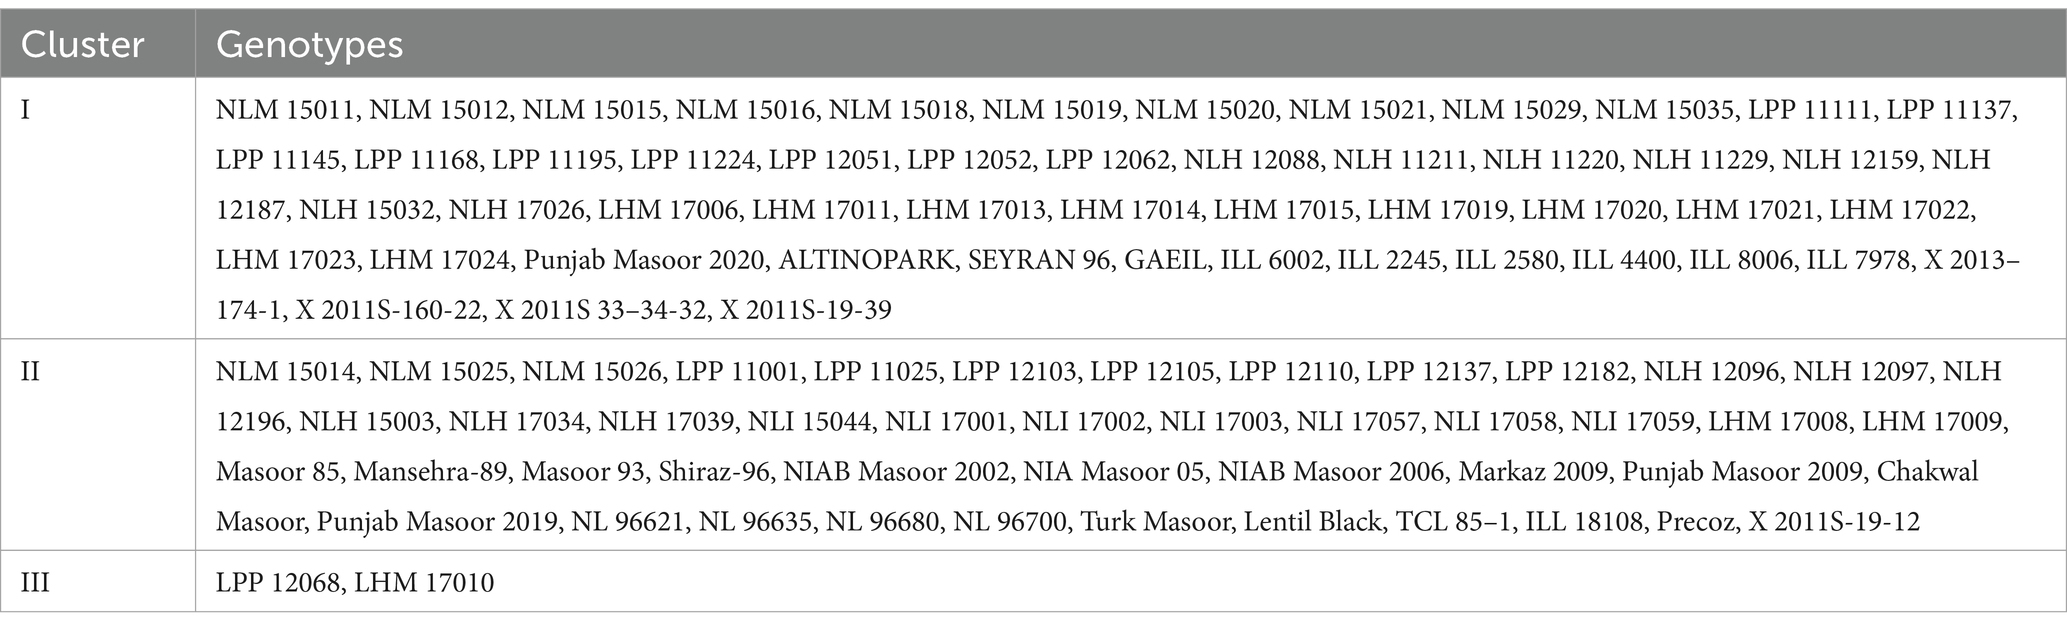
Table 4. Distribution of lentil genotypes regarding biochemical characteristics in various clusters.
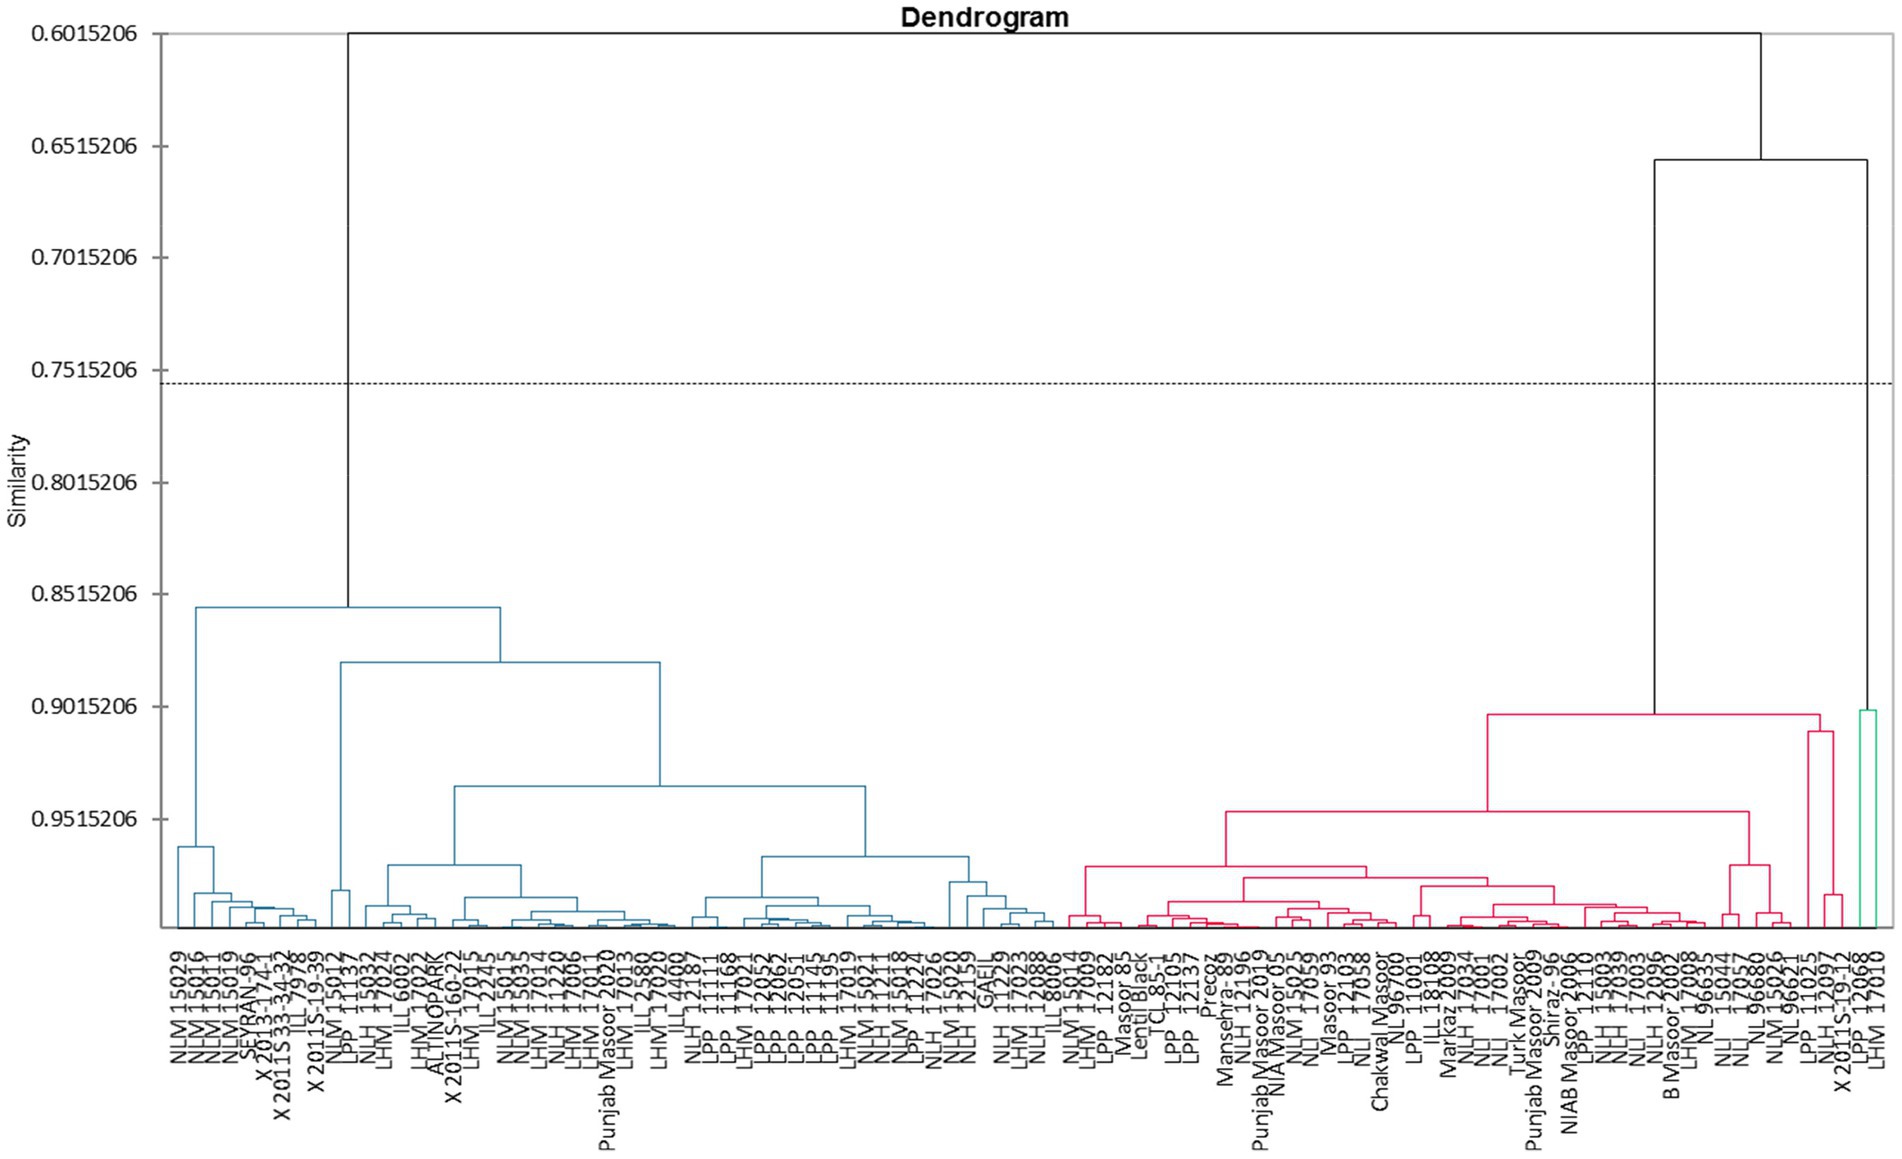
Figure 2. Tree diagram showing the clustering of 22 traits for different lentil genotypes.
Cluster I consisted of genotypes with high mean values of tannin, total oxidant status (TOS), reducing sugars (RS), and protein content. However, cluster II possessed genotypes with high mean values of total phenolic content (TPC), peroxidase (POD), malondialdehyde (MDA) content, total antioxidant capacity (TAC), protease, chlorophyll a, chlorophyll b, total chlorophyll, and carotenoids. Among all clusters, cluster three was comprised of ascorbate (AsA), catalase (CAT), ascorbic peroxidase (APX), alpha-amylase, total soluble sugars (TSS), non-reducing sugars (NRS), superoxide dismutase (SOD), and total flavonoids (Tables 5A,B). Moreover, LPP 12068 and LHM 17010 have been placed in cluster III, showing remarkable differences with cluster II regarding different biochemical traits in Figure 2. In this view, cluster analysis arranged genotypes together, showing similarities among different traits; the grouping of the clusters had not possibly included all genotypes of similar origin.
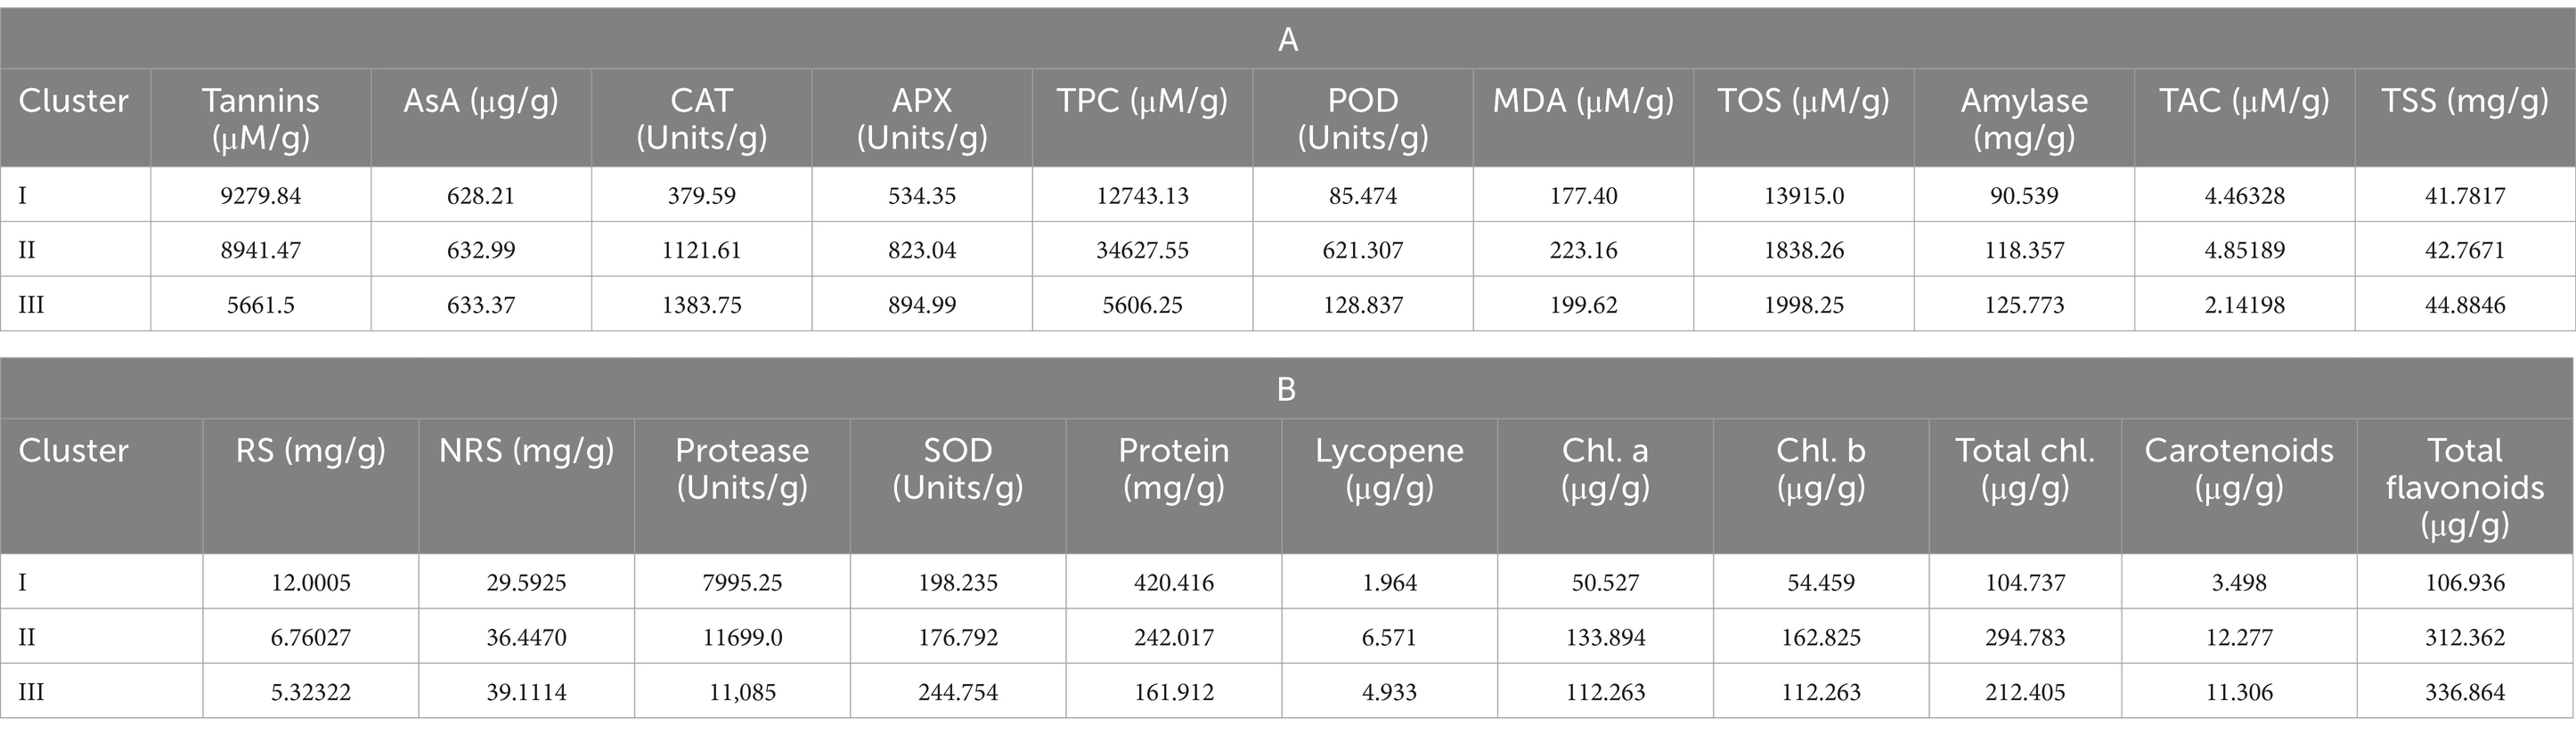
Table 5. Mean values of studied biochemical traits for different lentil genotypes in cluster analysis.
Correlation analysis (Pearson’s test)
Correlation analysis (Pearson’s test) was applied to all biochemical traits for lentil genotypes under investigation at 95% confidence interval. It is depicted that ascorbic acid (AsA) showed a significantly positive correlation with peroxidase (POD) and superoxide dismutase (SOD) and a negative correlation with total soluble proteins (TSP). Additionally, catalase (CAT) is positively correlated with total phenolic content (TPC), malondialdehyde content (MDA), protease (PROT), alpha-amylase (AMYL), lycopene, chlorophyll a, chlorophyll b, total chlorophyll, carotenoids, and total flavonoids (TF) and negatively correlated with total oxidant status (TOS) and total soluble proteins (TSP). Significant positive correlation was found between ascorbate peroxidase (APX), TPC, POD, MDA, protease, alpha-amylase, lycopene, chlorophyll a, chlorophyll b, total chlorophyll, carotenoids, and total flavonoids (TF) and a negative correlation with TOS and TSP. A significant positive association of TPC was noticed between CAT, APX, POD, MDA, NRS, protease, alpha-amylase, lycopene, chlorophyll a, chlorophyll b, total chlorophyll, carotenoids, and total flavonoids (TF) and a negative correlation with TOS, RS, and TSP. POD is positively correlated with AsA, APX, TPC, MDA, protease, alpha-amylase, lycopene, chlorophyll a, chlorophyll b, total chlorophyll, carotenoids, and total flavonoids (TF) and negatively correlated with TOS and TSP. Furthermore, MDA displayed a significant positive correlation with CAT, APX, TPC, POD, protease, alpha-amylase, lycopene, chlorophyll a, chlorophyll b, total chlorophyll, carotenoids, and total flavonoids (TF) and was negatively correlated with TOS, RS, and TSP. In case of TOS, a significant positive association is revealed between RS and TSP but a negative association with CAT, APX, TPC, POD, MDA, NRS, protease, alpha-amylase, lycopene, chlorophyll a, chlorophyll b, total chlorophyll, carotenoids, and total flavonoids (TF). For TS (total soluble sugars), a positive correlation is found between NRS (non-reducing sugars). Reducing sugars (RS) showed a significant positive correlation with TOS and TSP. In case of NRS, a significant positive association was noticed between TPC and TS, while a negative association was found among TOS, RS, and TSP. For protease, a significant positive correlation was detected with CAT, APX, TPC, POD, MDA, alpha-amylase, lycopene, chlorophyll a, chlorophyll b, total chlorophyll, carotenoids, and total flavonoids (TF) and a negative correlation with TOS, RS, and TSP. However, a significant positive correlation was inferred between SOD and AsA but depicted a negative correlation with lycopene, chlorophyll a, chlorophyll b, total chlorophyll, and carotenoids. For TSP, significant positive association was observed with TOS and RS and negative association with AsA, CAT, APX, TPC, POD, MDA, NRS, protease, alpha-amylase, lycopene, chlorophyll a, chlorophyll b, total chlorophyll, carotenoids, and total flavonoids (TF). Next, alpha-amylase showed a significant positive association with CAT, APX, TPC, POD, MDA, protease, lycopene, chlorophyll a, chlorophyll b, total chlorophyll, carotenoids, and total flavonoids (TF) and a negative association with TOS and TSP. The correlation analysis for TAC did not reveal any association with the rest of the studied biochemical parameters. In case of lycopene content, a significant positive association was observed between CAT, APX, TPC, POD, MDA, protease, alpha-amylase, chlorophyll a, chlorophyll b, total chlorophyll, carotenoids, and total flavonoids (TF), and a negative association was noticed with TOS, RS, SOD, and TSP. For chlorophyll a, a significant positive correlation was found between CAT, APX, TPC, POD, MDA, protease, amylase, lycopene, chlorophyll b, total chlorophyll, carotenoids, and total flavonoids (TF), and a negative correlation with TOS, RS, SOD, and TSP. Chlorophyll b showed a significant positive association with CAT, APX, TPC, POD, MDA, protease, amylase, lycopene, chlorophyll a, total chlorophyll, carotenoids, and total flavonoids (TF) and a negative correlation with TOS, RS, SOD, and TSP. In case of total chlorophyll content, a significant positive correlation was observed between CAT, APX, TPC, POD, MDA, protease, alpha-amylase, lycopene, chlorophyll a, chlorophyll b, carotenoids, and total flavonoids (TF). For carotenoids content, a significant positive association was observed between CAT, APX, TPC, POD, MDA, protease, alpha-amylase, lycopene, chlorophyll a, chlorophyll b, total chlorophyll, and total flavonoids (TF), but a significant negative correlation was observed with TOS, RS, SOD, and TSP. Total flavonoids (TF) showed a significant positive association with CAT, APX, TPC, POD, MDA, protease, alpha-amylase, lycopene, chlorophyll a, chlorophyll b, total chlorophyll, and NRS (non-reducing sugars) (Table 6).
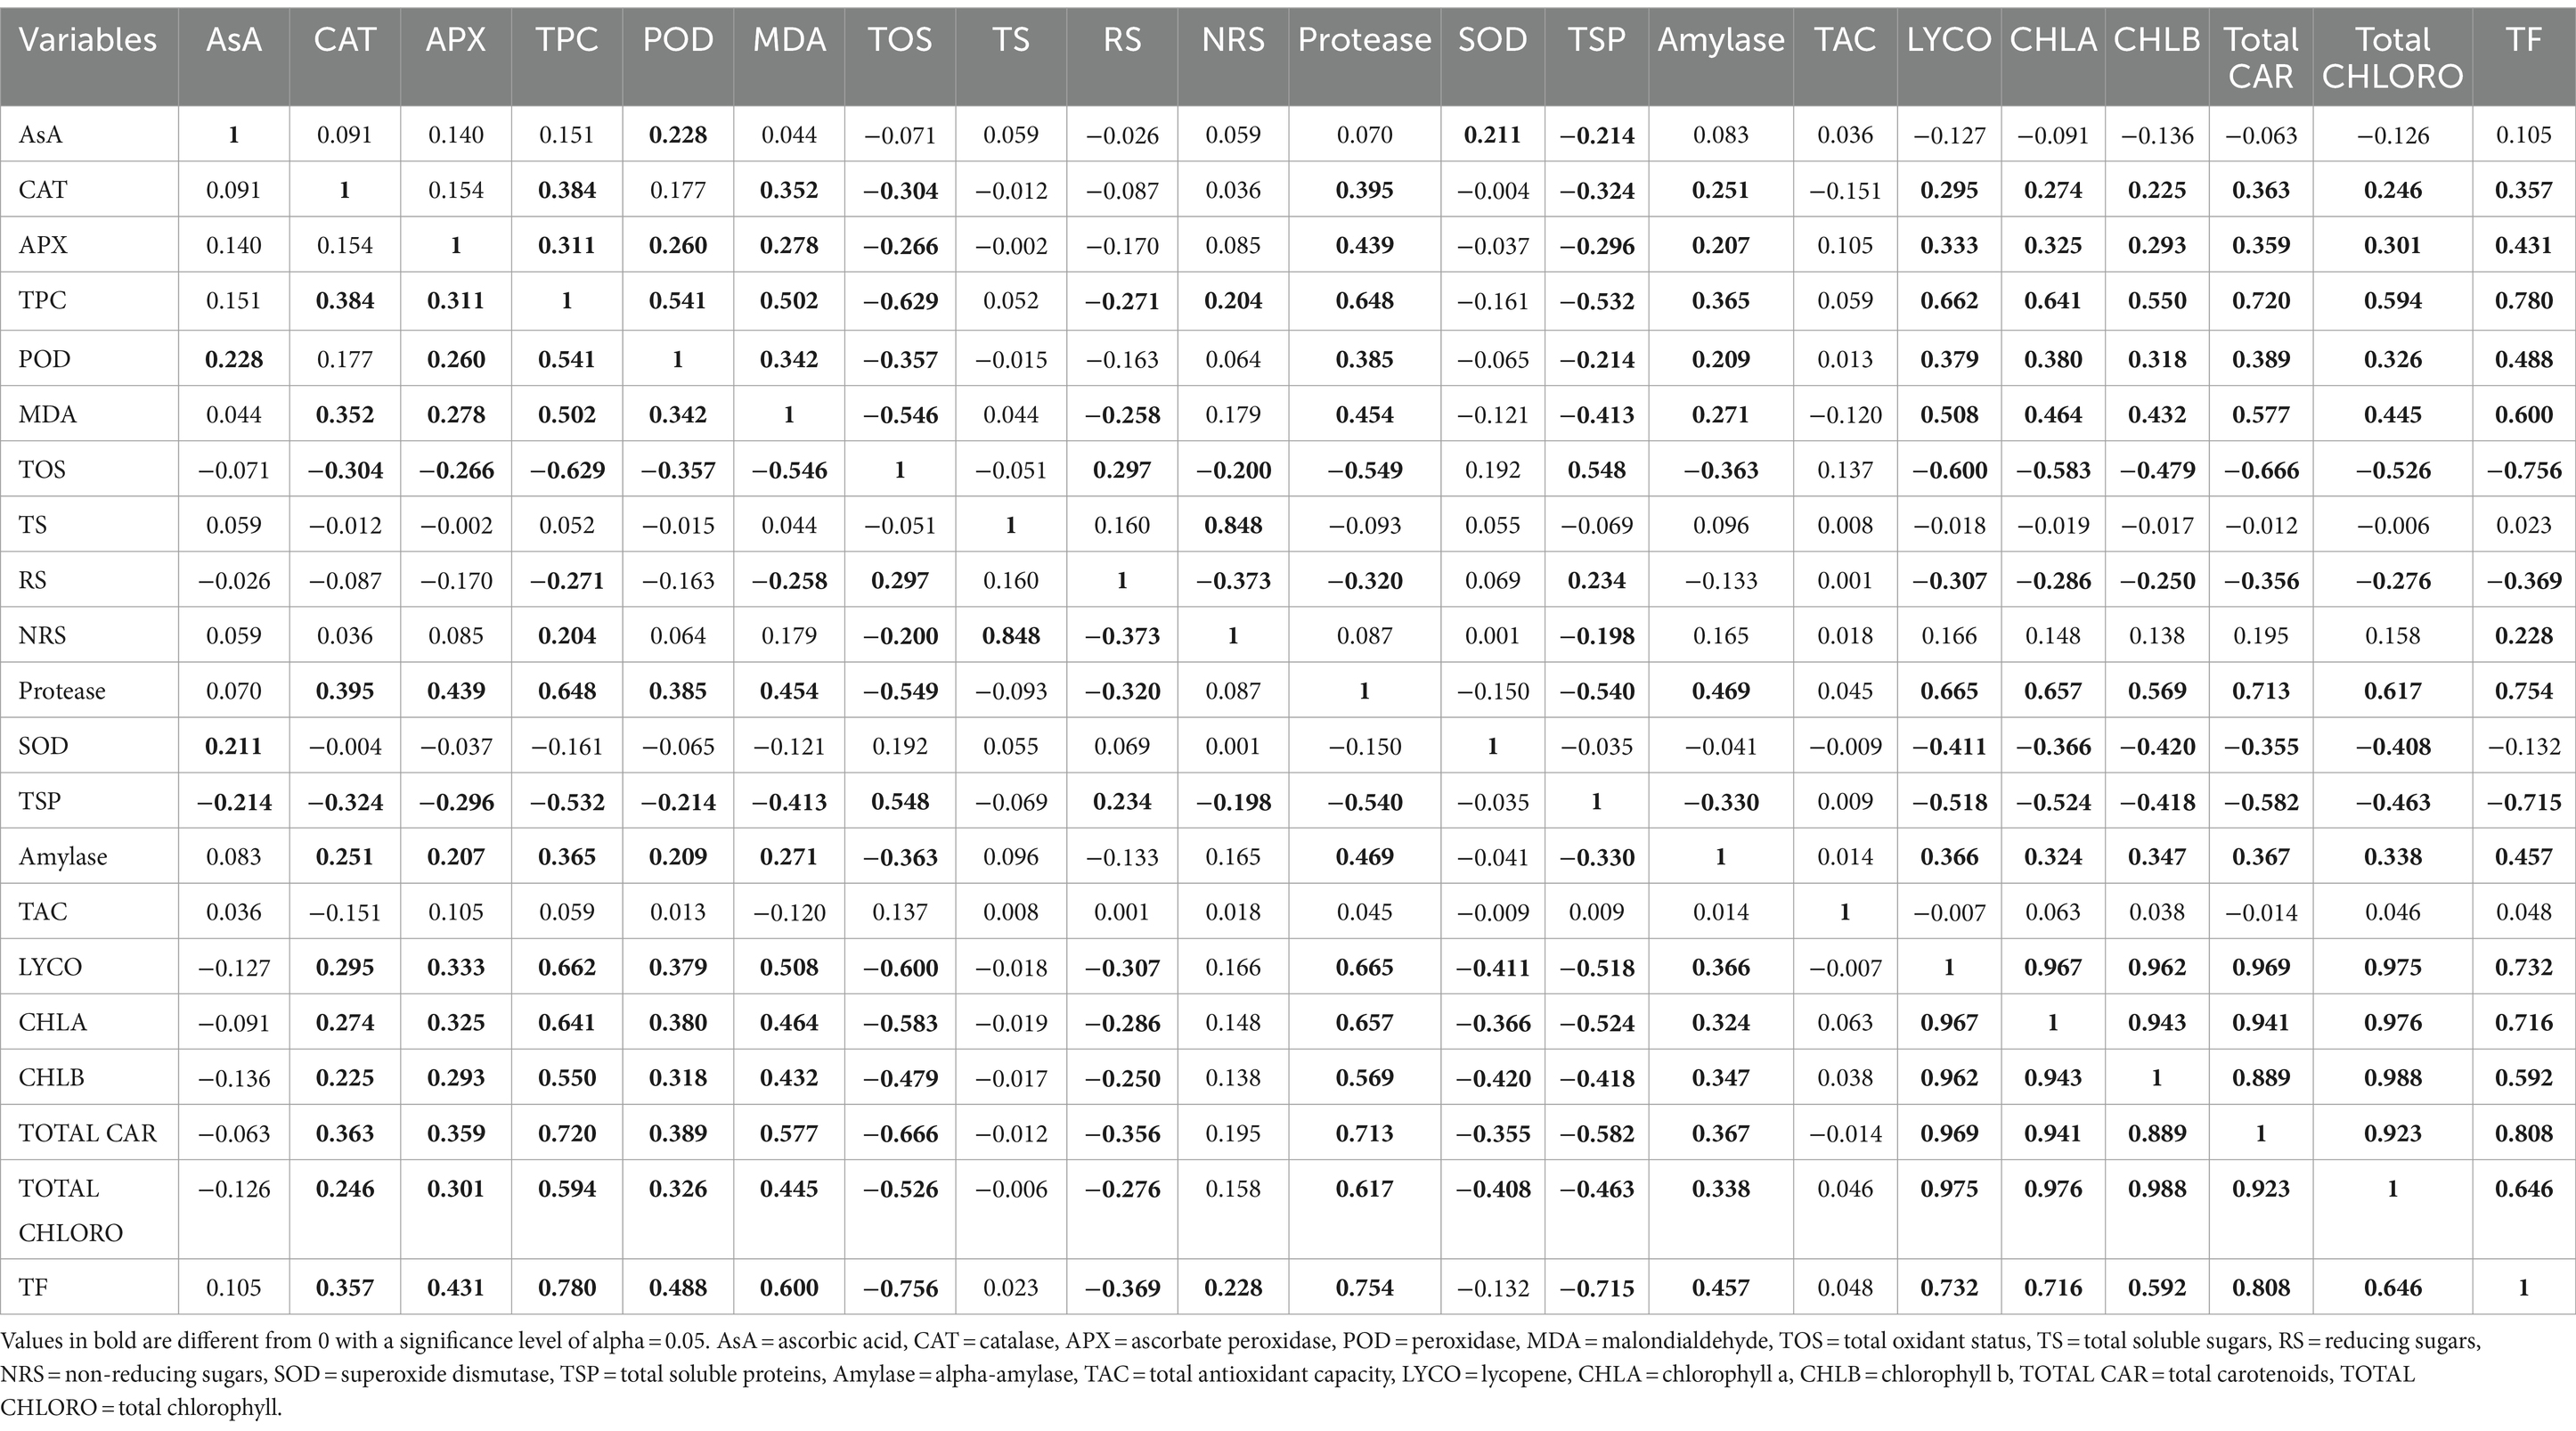
Table 6. Correlation analysis of the lentil genotypes for studied biochemical traits.
Discussion
Due to the excessive formation of cellular reactive oxygen species (ROS), the cascade of reactions occurring in the extracellular matrix and tissues causes the activation of the endogenous defense mechanisms. As a result of these defense mechanisms (enzymatic or non-enzymatic), inactivation of ROS takes place (43, 44). To explore the comprehensive nutritional and antioxidant potential of the lentil seeds, various biochemical analyses were conducted on the lentil seed flour in the current study.
Ascorbic acid (vitamin C) reacts directly with hydroxyl radicals and superoxide (an ion radical) in wheat and other crops (45). It helps in reducing the effects of lipid peroxidation (46). Ascorbic acid plays an important role as a plant growth regulator via the hormone signaling pathway. It also acts as a modulator in several physiological processes, i.e., flowering, membrane permeability, seed germination, photosynthesis, transport of ions from roots to the whole plant, respiration, and senescence (47). As germination time increases, ascorbic acid content in lentil sprouts increases, with no significant effect on temperature. In the current study, only five genotypes were placed in high class. The highest content of ascorbic acid was found in LPP 12182 (706 μg/g s. wt.), which demonstrates similar results as found in wheat genotype SH-2002 (713 μg/g s. wt.) in the previous study (45). Twenty-eight genotypes were categorized into medium class. In another study, mung bean seeds exhibited 490 μg/g s. wt. ascorbic acid content, which is slightly higher than the ascorbic acid content (333 μg/g s. wt.) observed in the present study (48).
In addition to carbohydrates, dietary fibers, and proteins, lentils contain many other bioactive compounds like peptides and phenolic compounds, which have several health benefits (21). Phenolic compounds are important components of lentils as well as an essential source of antioxidant compounds (20). Among the major non-enzymatic antioxidants, total phenolic compounds and total flavonoids possess the major bioactive compounds. They play crucial roles in the functional and structural roles of our body and are also constituents of parts of plants (49, 50). Among the tested genotypes, only 14 were included in the intermediate TF class, and 52 genotypes possessed low TF values. The highest TF value was observed in NLI 17059 (366.42 μg/mL sample), which is relatively similar to that reported in chickpea desi wild hybrid WH-1 (394 μg/mL sample) (51). Another study explained the highest TF values in lentil cultivars ranging from 0.96 to 1.93 mg CAE/g (52), which is relatively higher compared to the values detected in lentil genotypes ranging from 300.01 to 367 μg/mL sample in the current study. The genotypes with the highest TFs can be utilized by breeders to ameliorate the availability of micronutrients in various nutraceuticals.
For TPC values, 31 genotypes were grouped as high class, 14 as intermediate class, and 55 as low class. Generally, the highest TPC value was observed in NLI 17003 (54,600 μM/g s. wt.), which is higher than reported in the approved chickpea variety CM-98 (desi type) (34,725 μM/g s. wt.) (51). In another study, the TPC value noticed in lentil genotype IG129294 was 4.50 mg GAE/g (53) which is higher as compared to the TPC value depicted in the current study, LHM 17010 (4,755 μM/g sample).
The digestibility and biological utilization of legumes are adversely affected by antinutritional compounds such as phytates, tannins, and trypsin inhibitors (54). Tannins are hydrolyzable compounds that comprise glucose molecules condensed with simple phenolic chains like gallic acid. In a previous study, the lowest tannin value (0.54 mg/g) was detected in genotype NDL-1 (55) which is even higher than the tannin content found in LPP 11137 (257 μM/g s. wt.). In addition, lentil contains high flavonoids, condensed tannins, and phenolic contents (1.30, 5.97 mg catechin equivalents g−1, and 6.56 mg gallic acid equivalents g−1), respectively (56, 57) which is comparatively higher than the highest tannin value found in NLI 17057 (24,563 μM/g s. wt.) elaborated in the current study. In the context of the current findings, it is depicted that genotypes with low tannin values can be used for the development of genotypes with enhanced mineral bioavailability and better nutritional attributes.
Catalase is the most crucial enzyme that neutralizes hydrogen peroxide (H2O2) by using oxygen and water in the presence of magnesium and iron as cofactors. It has the highest Kcat value among all antioxidant enzymes (58). Catalase plays a crucial role in the oxidative reaction, occurring during bleaching and bread making, and prevents the harmful effects of H2O2 (59). Due to environmental stress, an oxidative stress condition occurs in plants, which is mitigated by the expression of certain catalase isozymes (60). In the present study, high levels of catalase ranged from 2001 to 5,600 Units/g s. wt., and 10 genotypes were found in this group. The highest value of catalase was found in LPP 12110 (5,595 Units/g s. wt.), which is comparatively higher than the amount of catalase in chickpea genotype ICC-4951 (893 ± 50 Units/g s. wt.) evaluated in other case studies (51). Genotypes were classified in the medium class, ranging from 1,001 to 2000 Units/g s. wt. which shares a similar range of catalase activity (15,240 Units/g s. wt.) found in black gram (61). As a result of the present study, three approved varieties, including Masoor 93, Shiraz-96, and Punjab Masoor 2009, exhibited a medium range of catalase activity. Furthermore, one exotic approved variety, Lentil black, was among the varieties with a higher level of catalase activity.
Ascorbate peroxidase (APX) plays a crucial role in the glutathione peroxidase cycle and is also used for the removal of hydrogen peroxide. It also performs an important function for plant cell protection from certain environmental stresses (62). It was noticed in the current study that high APX levels were found in 14 genotypes, ranging from 1,001 to 2,500 Units/g s. wt. Among the tested genotypes, the highest activity was found in ALTINOPARK (2,465 Units/g s. wt.), but the highest APX activity in the wheat genotype was observed in Pavon (1426.67 Units/g s. wt.) in the previous study (45), which is notably lower than lentils. The medium class included 26 genotypes ranging from 701 to 1,000 Units/g s. wt. Low levels were found in 60 genotypes, including ICARDA lines (ILL 6002, ILL 2245, ILL 2580, ILL 4400, ILL 8006, ILL 7978, X 2013–174-1, X 2011S-160-22, X 2011S 33–34-32, X 2011S-19-12, X 2011S-19-39), ranging ≤700 Units/g s. wt., and the lowest activity was observed in X-2013-174-1 and NLM 15011 (41.500 Units/g s. wt.).
Peroxidase (POD) helps in scavenging (ROS) reactive oxygen species, which results in oxidative cell damage (63). Several plant peroxidases have been recognized as biochemical markers for various biotic and abiotic types of stresses because they play essential roles in crucial physiological processes such as lignification of the cell wall, auxin catabolism, and cross-linkage of structural proteins and pectins in the cell wall (60). High levels of POD were found in six genotypes ranging from 1,501 to 3,200 Units/g s. wt., and the highest activity was shown by NIAB Masoor 2002 (3,170 Units/g s. wt.). LPP 12062 (63 Units/g s. wt.). Genotypes ranging ≤500 Units/g s. wt. were placed under a low category, and 82 genotypes were included in this group. Moreover, the local approved variety Shiraz-96 exhibited (142 Units/g) POD activity, which shares a similar range value with the lentil variety (154 μmol min−1 g−1) described in the previous study (48).
Superoxide dismutase (SOD) is important in preventing the spread of unstoppable free radicals and aids in the antioxidant activity of peroxidase and catalase. Elevated levels of POD, SOD, and CAT were observed during water stress conditions, which help in scavenging free radicals (64). In the current study, the highest level of SOD was found in LPP 11195 (294.096 Units/g s. wt.) as well as the highest SOD value elaborated in the wheat variety Manthar-2003 (278.93 Units/g s. wt.). In the present study, the lowest SOD activity was observed in LHM 17019 (66.97 Units/g s. wt.), which depicted nearly similar results (76.17 Units/g s. wt.) in the wheat variety Punjab-2011 (45).
Proteolytic enzymes show remarkable performance in developing and maintaining the physiology of plants and are known as a source of amino acids for various novel protein synthesis processes (65). Microorganisms are the key contributors to protease production, and plant-based proteases have not been well studied so far (66). Previously conducted studies reveal the occurrence of proteolytic enzymes in various beans and plant seeds, e.g., sorghum (67), potato tubers (68), barley (69), mung bean (70), rice (71), and moringa olifera seeds (72). In this study, Masoor 93 exhibited the highest protease value (16,050 Units/g. s. wt.). The lowest value was noticed in LPP 11111 (6,125 Units/g. s. wt.), which is comparatively higher as compared to the protease activity noticed in wheat seeds (1,000 Units/g sample) (73). Similarly, protease activity in the maize variety Golden Silks (22,488 Units/g sample) (74) was noteworthy higher than that evaluated in the approved lentil variety Masoor 93 (16,050 Units/g s. wt.) in the current study.
Hydrolytic enzymes, such as proteases, alpha-amylase, and esterase, specifically split larger biomolecules into smaller ones via hydrolysis. In this process, the addition of one or more water molecules takes place (75). Alpha-amylase is a hydrolyzing enzyme that catalyzes the hydrolysis of 4-glycosidic linkages in starch to yield products such as glucose and maltose. These products can be extracted from animals, plants, and microorganisms (76). Alpha-amylase plays an essential role in absorption mechanisms like the gassing ability of dough and in maintaining the properties of bread (77). In lentil seeds, amylases play an important role in providing utilizable substrates for growth and development (78). In this study, high levels of alpha-amylase were found in four genotypes ranging from 151 to 273 mg/g. s. wt., and the highest value was found in LPP 12137 (271.87 mg/g. s. wt.), which is comparatively higher than alpha-amylase activity in chickpea (kabuli advance line), i.e., CH74/08 (213.02 ± 3.20 mg/g s. wt.) (51). However, 54 genotypes were grouped at an intermediate level, ranging from 101 to 150 mg/g s. wt. LPP 12068 (112 mg/g s. wt.) showed similar alpha-amylase activity as reported in previously reported wheat seeds (112 mg/g sample) (79).
Malondialdehyde (MDA) is produced as a result of alterations in cell membrane characteristics like disability of enzymatic function and oxidative degradation of cell components (80). MDA level also shows the extent of damage to the plant cell (62). Lipid peroxidation is the major reason for seed injury for storage purposes and is also responsible for the initial biochemical changes in the seed for storage. Increased MDA content is due to accelerating aging and prolonged storage (81). In this study, high levels of MDA were noticed in 24 genotypes, ranging from 231 to 301 Units/g s. wt. Physiological analysis of different wheat genotypes revealed that the MDA content in wheat flour is much higher than in lentil flour. The highest level of MDA was noticed in wheat genotype Margalla-99 (679.23 μM/g s. wt.) (45) and lupine (Lupinus termis) seeds (380 μM/g sample) (82) which is much higher than the approved variety Punjab Masoor 2009 (300.5 μM/g s. wt.).
In essence, total oxidant status (TOS) in living organisms is referred to as the gross oxidation status of the body (83). Antioxidant capacity of a body can be determined by evaluating its total oxidant status (84). Oxidative stress is the consequence of the imbalance between the body’s immune system mechanisms and reactive oxygen species (ROS), resulting in cellular damage (85). Pulses revealed a significant relationship between antioxidant capacity and polyphenols (86, 87). Additionally, lentil is considered a beneficial and nutrient-rich food as it contains essential nutrients and phytochemicals (87). In the present study, it was observed that high levels of TOS were observed in 17 genotypes ranging from 15,001 to 48,000 μM/g. s. wt., and the highest TOS value was recorded in NLM 15029 (47,487 μM/g. s. wt.), which is much higher compared to the highest TOS value reported in CM3457/91 (356 ± 17.50 μM/g s. wt.) (51). The above-discussed results showed that the oxidation status in the studied lentil varieties is far higher than that noticed in chickpeas.
An increased interest has been developed for food security reasons and environmental stability in search of new sources of proteins as an alternative source to avoid animal proteins. Pulse proteins, especially lentil proteins, exhibit a wide range of functional properties (88). With enzymatic and thermal modifications, the nutritional attributes of lentil proteins are further improved (89). In another study, there was a considerable higher protein content in faba bean (330 mg/g s. wt.) than in red lentil (285 mg/g s. wt.), followed by yellow pea (257 mg/g s. wt.) (90). Like other legumes, lentil is a protein-rich crop with a protein content of 20.4–31.4% (91). In the present study, significant variation was observed among the tested lentil genotypes. Highest protein content was found in X 2011S-19-39 (546.33 mg/g s. wt.), which is comparatively lower than found in red lentil (285 mg/g s. wt.) (90). Another previous study demonstrated (314 mg/g s. wt. sample) protein content in lentil seed flour (92) which shows a similar range as depicted in NL 96635 (311.5 mg/g s. wt.) in the current investigation.
Total soluble sugar is an essential physiological parameter that plays a significant role in seed development and production (93–95). During germination, the stored insoluble nutrients present in the cotyledon are converted to soluble ones through the hydrolysis of any macromolecule (96). Moreover, total soluble sugars enhance stress tolerance in seeds with improved storability during stress conditions (97). In a previous study, total, non-reducing, and reducing sugar content in lentil seeds were 50.1, 34.9, and 15 mg/g s. wt., respectively (98). As a result of the current study, 20 lentil genotypes exhibited higher levels of total soluble sugars ranging from 51 to 85 mg/g. s. wt., and NLM 15015 (83.9 mg/g s. wt.) showed the highest value. Low levels were found in 16 genotypes, but the lowest value was noticed in GAEIL (11.49 mg/g. s. wt.). The previously reported total soluble sugar content in lentil seeds ranged from 34.5 to 70.5 mg/g s. wt. In a similar study, the lentil genotype LL-1277 (70 mg/g s. wt.) exhibited the highest TSS value (2) which is slightly lower than the TSS value observed in NLM 15015 (83.9 mg/g s. wt.) in the current study. Conversely, lower TSS content was observed in a cow pea genotype PI201498 (70.1 mg/g s. wt.) (99) than determined in NLM 15015 (83.9 mg/g s. wt.) in the present study. Pea (Pisum sativum) seeds demonstrated higher reducing and non-reducing sugar contents (100) compared to the values obtained in the current investigation.
Legume foods have gained utmost importance due to the presence of various micronutrients, macronutrients, and surplus amounts of phytochemicals. These phytochemicals exhibit various health-promoting effects for the prevention of chronic diseases (101, 102). Additionally, this positive health impact is caused by high antioxidant content of legumes (103). The production of free radicals is responsible for the destruction of micronutrients, DNA, carbohydrates, proteins, and unsaturated lipids (102). The pathogenicity caused by free radical production can be minimized by utilizing antioxidants from plants and plant-based products (104).
In comparison with other legumes, lentils exhibit an ample amount of phenolic compounds that are well known to have high antioxidant capacity (20, 21). In lentil, high antioxidant capacity (TAC) is attributed to the existence of several phenolic (bound and free) compounds. Moreover, extractable phytochemicals showed less antioxidant activity as compared to the bound phytochemicals in case of lentil (105). In another study, a higher total antioxidant capacity in lentil seeds was reported than in pea seeds. It has been reported in earlier studies that lentil consumption plays an important role in reduction of various diseases, such as diabetes, cancer, obesity, and other cardiovascular diseases, due to its polyphenolic properties, which are responsible for its anti-inflammatory, antioxidant, and nephroprotective properties (106). For instance, flavonoids in lentil have been shown to control alpha-lipases and glucosidases, resulting in maintaining blood glucose levels (107). The oxygen radical absorbing capacity (ORAC) in lentils (8.43 μM/g. s. wt.) was comparatively higher than yellow pea (1.17 μM/g. s. wt.) and chickpea (1.04 μM/g. s. wt.) (108). In the current investigation, lentil genotype NLM 15016 (15.76 μM/g. s. wt.) possessed similar TAC values as determined in lentil seeds (14 μM/g. s. wt.) in the previous study (109). In addition to a similar study, low TAC was noticed in pea seeds (1.9 μM/g. s. wt.) as compared to lentil seeds (109).
During germination, chlorophyll content is not completely deteriorated in ripening seeds, but appreciable quantities can be determined in mature seeds (110). The existence of chlorophyll in seeds was first demonstrated by Monteverde and Lubimenko in 1909 (111). Furthermore, seed quality is the measure of chlorophyll content present in it, and both are inversely related to each other. Hence, the seeds with increased chlorophyll content have a declining germination rate (112).
All types of seeds are prone to the process of aging as well as quality deterioration, which eventually leads to the loss of seed viability (113).
The green color of the plant and seed is due to the presence of a pigment called chlorophyll (114). There are two types of chlorophyll, such as chlorophyll a and b, present in green algae and terrestrial plants. Chlorophyll a exhibits a green-blue color, and chlorophyll b contains a green-yellow color (39). In the present study, the least (chlorophyll a and chlorophyll b) values were noticed in LHM 17010 (25.14 μg/g s. wt.) and NLH 11211 (8.39 μg/g s. wt.), respectively, which are higher than the values for chlorophyll a (11.83 μg/g s. wt.) and chlorophyll b (3.01 μg/g s. wt.) reported in soya bean seeds (115). Low and medium (chlorophyll a) content was noticed in 57 and 40 lentil genotypes, while two approved varieties (NIAB Masoor 2002, Turk Masoor) were among the high class, along with one local hybrid (NLH 12097). On the other hand, NLH 17010 possessed the least chlorophyll a content, and NLH 11211 possessed the least chlorophyll b and total chlorophyll content. Overall, NLH 12097 showed highest chlorophyll a, chlorophyll b, and total chlorophyll contents among all tested genotypes.
In addition, carotenoids are essential pigments present in many parts of plant organs and tissues and are also found in the seeds of higher plants. They have a key role as antioxidants and prevent the seeds from generating reactive oxygen species (ROS) from the process of aging (116, 117). Comparatively low, medium, and high levels of carotenoids were found in 44, 22, and 34 genotypes, respectively. Markaz 2009 was the approved variety with the highest carotenoid content. Moreover, in the current investigation, the least carotenoid content was found in ICARDA line ILL 6002 (1.31 mg/g s. wt.), which is slightly higher than found in lentil seeds (0.45 mg/g s. wt.) (118) in the previous study.
In case of lycopene content based on various studied attributes in this study, significant variation was observed. In total, 67 and 30 genotypes were included in low and intermediate classes, respectively. However, only three genotypes were assorted in high class, including one exotic variety (Turk Masoor), one local variety (Markaz 2009), and one local hybrid (NLH 12097).
Among all tested genotypes, NLH 12097 (10.881 μg/g s. wt.) showed the highest lycopene content and NLH 11211 (0.686 μg/g s. wt.) exhibited the least value as observed in case of chlorophyll as noticed in case of (chl. a, b and total chlorophyll). Furthermore, in recent studies, the highest lycopene content was present in chickpea (desi type) Sheenghar-2000 (12.579 μg/g s. wt.) (51), which is relatively higher as compared to NLH 12097 (10.881 μg/g sample) in this study.
Correlation is the study of an association between different variables. In correlation analysis, the variation in magnitude of one variable is directly linked with the change in magnitude of the other variable (either positive or negative correlation) (119). In the current investigation, it was depicted that CAT, APX, TPC, POD, and MDA showed similar trends in terms of significant positive and negative correlation. Similar negative correlation trend was observed for TOS, RS, SOD, and TSP with pigments in this study. Total antioxidant capacity (TAC) is not significantly correlated, either positively or negatively, with other studied biochemical attributes of the genotypes under the present study. Furthermore, it is noticed that lycopene, chlorophyll a, b, total chlorophyll, and total carotenoids, except total flavonoids (TF), followed similar trends in terms of positive and negative associations. In another study, a significant positive correlation was reported between total antioxidant activity and total flavonoids (120, 121) which is not similar to the current findings. The reason behind this difference is that antioxidant activity is not the result of one or more phytochemicals but is an interactive and synergistic effect of various bioactive compounds found within a plant at a particular time and stage (122).
Principal component analysis (PCA) is a multivariate technique, which is applied to simplify large data sets and to derive useful information from the analyzed data (123). In the current study, five principal components were responsible for 69.23% of the total variation. The most differential parameters in PC-I with positive vector loadings were AsA, CAT, APX, TPC, POD, MDA, TSS, NRS, protease, alpha-amylase, TAC, lycopene, chlorophyll a, b, total chlorophyll, carotenoids, and total flavonoids. Among all recognized parameters, a single variable is mostly selected (124). High factor loadings were noticed in carotenoids and lycopene, with values of 0.324 and 0.316, respectively. It is depicted that total carotenoids exhibited the best single-loading factor. Regarding PC-II, 12 traits showed positive factor loadings such as AsA, CAT, APX, TPC, POD, MDA, TSS, NRS, protease, SOD, alpha-amylase, and total flavonoids, while NRS exhibited the highest positive factor loading value (0.439), followed by TSS (0.424). The distance between the biplot origin and genotypes illustrates the genotypic variations from the total mean, so the short and long distances of all genotypes from the origin can be utilized to evaluate the poorest and excellent genotypes (125). The current findings revealed that the approved varieties, including Punjab Masoor 2009, NIAB Masoor 2002, Lentil Black, Turk Masoor, Shiraz-96, Punjab Masoor 2019, and one local genotype, NLH 12097, were spotted distant from the origin and hence declared as the best performers among the concerning genotypes regarding all traits in this investigation. The genotypes found near the biplot origin were bad performers compared to the distant ones.
Clustering is also a multivariate statistical technique, which combines diverse genotypes/traits into two subsequent groups on the basis of resemblance in their expression (126). Here, we concluded that various lentil genotypes showed significant divergence among different biochemical and nutritional attributes. Cluster I consisted of genotypes with higher mean values for tannins, reducing sugars (RS), and protein content, while cluster III comprised genotypes with maximum AsA, CAT, APX, alpha-amylase, TSS, NRS, and SOD mean values. Furthermore, it was observed that cluster II genotypes showed remarkable divergence with cluster III, as shown in Table 4. It is evident from the current findings that cluster analysis is considered one of the most important tools for the classification of germplasm. It also provides a consistent foundation for the classification of material to prepare breeding tactics for upcoming scientific research (127, 128). The subsequent results from the present study revealed that multivariate analysis helps in assembling genotypes into various clusters on the basis of their respective PCs.
Conclusion
The current findings revealed that local, exotic lentil genotypes and approved varieties have noteworthy potential for the studied nutritional and biochemical parameters. Most of the ICARDA lines used in the current study are proven to be the better source of plant-based proteins. Moreover, lentil genotypes, such as NLI 17003, NLI 17059, and NLM 15016, possess high total antioxidant capacities, which can be utilized by breeders to improve the antioxidant potential and nutraceutical value of lentil and lentil-based products. Additionally, the X 2011S 33–34-32 genotype can be used by the food industry in making pasta, multigrain bread, and snacking foods due to its high protein content for meat alternative seekers. One of the locally approved varieties, Markaz-2009, is considered to have the highest total carotenoid content among the studied genotypes. Lentil can be incorporated into staple foods due to its ability to provide nutraceutical and functional benefits to millions of consumers worldwide. The identified genotypes with high nutritional values can be utilized for improvement in the nutritional aspects of lentils.
Data availability statement
The original contributions presented in the study are included in the article/Supplementary material, further inquiries can be directed to the corresponding author.
Author contributions
FR: Data curation, Formal analysis, Methodology, Writing – original draft. AH: Conceptualization, Funding acquisition, Project administration, Resources, Supervision, Writing – review & editing. MA: Resources, Writing – review & editing.
Funding
The author(s) declare financial support was received for the research, authorship, and/or publication of this article. The research work funding was provided by Nuclear Institute of Agriculture and Biology, Jhang Road, Faisalabad, Pakistan.
Conflict of interest
The authors declare that the research was conducted in the absence of any commercial or financial relationships that could be construed as a potential conflict of interest.
Publisher’s note
All claims expressed in this article are solely those of the authors and do not necessarily represent those of their affiliated organizations, or those of the publisher, the editors and the reviewers. Any product that may be evaluated in this article, or claim that may be made by its manufacturer, is not guaranteed or endorsed by the publisher.
Supplementary material
The Supplementary material for this article can be found online at: https://www.frontiersin.org/articles/10.3389/fnut.2024.1344986/full#supplementary-material
References
1. Dhull, SB, Kinabo, J, and Uebersax, MA. Nutrient profile and effect of processing methods on the composition and functional properties of lentils (Lens culinaris Medik): a review. Legume Sci. (2022) 5:e156. doi: 10.1002/leg3.156
2. Ahuja, H, Kaur, S, Gupta, AK, Singh, S, and Kaur, J. Biochemical mapping of lentil (Lens culinaris Medik) genotypes for quality traits. Acta Physiol Plant. (2015) 37:1–16. doi: 10.1007/s11738-015-1928-2
3. Ariyawardana, A, Govindasamy, R, and Lisle, A. Capturing the consumer value: the case of red lentils. Br Food J. (2015) 117:1032–42. doi: 10.1108/BFJ-11-2013-0319
4. Diniyah, N, Alam, MB, and Lee, S-H. Antioxidant potential of non-oil seed legumes of Indonesian’s ethnobotanical extracts. Arab J Chem. (2020) 13:5208–17. doi: 10.1016/j.arabjc.2020.02.019
5. Swallah, MS, Sun, H, Affoh, R, Fu, H, and Yu, H. Antioxidant potential overviews of secondary metabolites (polyphenols) in fruits. Int J Food Sci. (2020) 2020:1–8. doi: 10.1155/2020/9081686
6. Sreeramulu, D., Reddy, C., and Raghunath, M., "Antioxidant activity of commonly consumed cereals, millets, pulses and legumes in India," (2009). Available at: https://www.csir.res.in/.
7. Lee, S-H, Ahsan, N, Lee, KW, Kim, DH, Lee, DG, Kwak, SS, et al. Simultaneous overexpression of both CuZn superoxide dismutase and ascorbate peroxidase in transgenic tall fescue plants confers increased tolerance to a wide range of abiotic stresses. J Plant Physiol. (2007) 164:1626–38. doi: 10.1016/j.jplph.2007.01.003
8. Hameed, A, Bibi, N, Akhter, J, and Iqbal, N. Differential changes in antioxidants, proteases, and lipid peroxidation in flag leaves of wheat genotypes under different levels of water deficit conditions. Plant Physiol Biochem. (2011) 49:178–85. doi: 10.1016/j.plaphy.2010.11.009
9. Jaleel, CA, Riadh, K, Gopi, R, Manivannan, P, Inès, J, al-Juburi, HJ, et al. Antioxidant defense responses: physiological plasticity in higher plants under abiotic constraints. Acta Physiol Plant. (2009) 31:427–36. doi: 10.1007/s11738-009-0275-6
10. Carcea, M. Nutritional value of grain-based foods, vol. 9 MDPI. Kraków: Franciszek Górski Institute of Plant Physiology, Polish Academy of Sciences. (2020). 504 p.
11. Ciudad-Mulero, M, Fernández-Ruiz, V, Cuadrado, C, Arribas, C, Pedrosa, MM, de Berrios, J, et al. Novel gluten-free formulations from lentil flours and nutritional yeast: evaluation of extrusion effect on phytochemicals and non-nutritional factors. Food Chem. (2020) 315:126175. doi: 10.1016/j.foodchem.2020.126175
12. Di Cairano, M, Condelli, N, Caruso, MC, Marti, A, Cela, N, and Galgano, F. Functional properties and predicted glycemic index of gluten free cereal, pseudocereal and legume flours. LWT. (2020) 133:109860. doi: 10.1016/j.lwt.2020.109860
13. Joshi, M, Timilsena, Y, and Adhikari, B. Global production, processing and utilization of lentil: a review. J Integr Agric. (2017) 16:2898–913. doi: 10.1016/S2095-3119(17)61793-3
14. Chávez-Murillo, CE, Veyna-Torres, JI, Cavazos-Tamez, LM, de la Rosa-Millán, J, and Serna-Saldívar, SO. Physicochemical characteristics, ATR-FTIR molecular interactions and in vitro starch and protein digestion of thermally-treated whole pulse flours. Food Res Int. (2018) 105:371–83. doi: 10.1016/j.foodres.2017.11.029
15. F. F. a. A. Organization). "Crop production and trade data." Available at: http://www.fao.org/faostat/en/#home (Accessed September 18, 2021).
16. Siva, N, Johnson, CR, Duckett, S, Jesch, ED, and Thavarajah, P. Can lentil (Lens culinaris Medikus) reduce the risk of obesity? J Funct Foods. (2017) 38:706–15. doi: 10.1016/j.jff.2017.02.017
17. Williams, P, and Singh, U. Quality screening and evaluation in pulse breeding In: World crops: Cool season food legumes : Springer (1988). 445–57.
18. Ayub, K, Rahim, M, and Khan, A. Performance of exotic lentil varieties under rainfed conditions in Mingora (NWFP) Pakistan. J Bio Sci. (2001) 1:343–4. doi: 10.3923/jbs.2001.343.344
19. I. National coordinated pulses programme NARC. "National coordinated pulses programme " Available at: https://www.parc.gov.pk/index.php/en/csi/137narc/cropsciences-institue/712-national-coordainated-pulses-programme. (accessed).
20. Zhang, B, Peng, H, Deng, Z, and Tsao, R. Phytochemicals of lentil (Lens culinaris) and their antioxidant and anti-inflammatory effects. J Food Bioact. (2018) 1:93–103. doi: 10.31665/JFB.2018.1128
21. Bautista-Expósito, S, Peñas, E, Silván, JM, Frias, J, and Martínez-Villaluenga, C. pH-controlled fermentation in mild alkaline conditions enhances bioactive compounds and functional features of lentil to ameliorate metabolic disturbances. Food Chem. (2018) 248:262–71. doi: 10.1016/j.foodchem.2017.12.059
22. Grela, ER, Kiczorowska, B, Samolińska, W, Matras, J, Kiczorowski, P, Rybiński, W, et al. Chemical composition of leguminous seeds: part I—content of basic nutrients, amino acids, phytochemical compounds, and antioxidant activity. Eur Food Res Technol. (2017) 243:1385–95. doi: 10.1007/s00217-017-2849-7
23. Xu, B, and Chang, SK. Effect of soaking, boiling, and steaming on total phenolic contentand antioxidant activities of cool season food legumes. Food Chem. (2008) 110:1–13. doi: 10.1016/j.foodchem.2008.01.045
24. Kiran, S, Johnson, JB, Mani, JS, Portman, A, Mizzi, T, and Naiker, M. Commercial lentils (Lens culinaris) provide antioxidative and broad-spectrum anti-cancerous effects. Legume Res. Int. J. (2021) 44, no. OF:202–6. doi: 10.18805/LR-557
25. Zhang, B, Deng, Z, Tang, Y, Chen, P, Liu, R, Ramdath, DD, et al. Fatty acid, carotenoid and tocopherol compositions of 20 Canadian lentil cultivars and synergistic contribution to antioxidant activities. Food Chem. (2014) 161:296–304. doi: 10.1016/j.foodchem.2014.04.014
26. Hameed, A, Iqbal, N, Malik, SA, Syed, H, and Ahsanul-Haq, M. Age and organ specific accumulation of ascorbate in wheat (Triticum aestivum L.) seedlings grown under etiolation alone and in combination with oxidative stress. Serie Biol. (2005) 17:51–63.
27. Ainsworth, EA, and Gillespie, KM. Estimation of total phenolic content and other oxidation substrates in plant tissues using Folin–Ciocalteu reagent. Nat Protoc. (2007) 2:875–7. doi: 10.1038/nprot.2007.102
28. Beers, RF, and Sizer, IW. A spectrophotometric method for measuring the breakdown of hydrogen peroxide by catalase. J Biol Chem. (1952) 195:133–40. doi: 10.1016/S0021-9258(19)50881-X
29. Chance, B., and Maehly, A., "Methods in Enzymol," by SP Colowick and NO Kaplan, Academic Press, Inc., New York, vol. 4, p. 273, (1957).
30. Dixit, V, Pandey, V, and Shyam, R. Differential antioxidative responses to cadmium in roots and leaves of pea (Pisum sativum L. cv. Azad). J Exp Bot. (2001) 52:1101–9. doi: 10.1093/jexbot/52.358.1101
31. Varavinit, S, Chaokasem, N, and Shobsngob, S. Immobilization of a thermostable alpha-amylase. Sci Asia. (2002) 28:247–51. doi: 10.2306/scienceasia1513-1874.2002.28.247
32. Drapeau, G. Protease from Staphylococcus aureus In: L Lorand, editor. Method of enzymology. ed. ed. New York, NY: Academic Press (1974)
33. Dhindsa, RS, Plumb-Dhindsa, P, and Thorpe, TA. Leaf senescence: correlated with increased levels of membrane permeability and lipid peroxidation, and decreased levels of superoxide dismutase and catalase. J Exp Bot. (1981) 32:93–101. doi: 10.1093/jxb/32.1.93
34. Erel, O. A new automated colorimetric method for measuring total oxidant status. Clin Biochem. (2005) 38:1103–11. doi: 10.1016/j.clinbiochem.2005.08.008
35. Bradford, N. A rapid and sensitive method for the quantitation microgram quantities of a protein isolated from red cell membranes. Anal Biochem. (1976) 72:e254:248–54. doi: 10.1006/abio.1976.9999
36. Dubois, M, Gilles, K, Hamilton, J, Rebers, P, and Smith, F. Phenol sulphuric acid method for total carbohydrate. Anal Chem. (1956) 28:350–6. doi: 10.1021/ac60111a017
37. Miller, GL. Use of dinitrosalicylic acid reagent for determination of reducing sugar. Anal Chem. (1959) 31:426–8. doi: 10.1021/ac60147a030
38. Lin, J-Y, and Tang, C-Y. Determination of total phenolic and flavonoid contents in selected fruits and vegetables, as well as their stimulatory effects on mouse splenocyte proliferation. Food Chem. (2007) 101:140–7. doi: 10.1016/j.foodchem.2006.01.014
39. Arnon, DI. Copper enzymes in isolated chloroplasts. Polyphenoloxidase in Beta vulgaris. Plant Physiol. (1949) 24:1–15. doi: 10.1104/pp.24.1.1
40. Lichtenthaler, HK, and Wellburn, AR. Determinations of total carotenoids and chlorophylls a and b of leaf extracts in different solvents. London, United Kingdom: Portland Press Ltd. (1983).
41. Steel, RGD, and Torrie, JH. Principles and procedures of statistics, a biometrical approach, vol. no. Ed. 2. New York, Toronto, London: McGraw-Hill Kogakusha, Ltd. (1980).
42. XLSTAT. Available at: http://www.xlstat.com (accessed).
43. Birben, E, Sahiner, UM, Sackesen, C, Erzurum, S, and Kalayci, O. Oxidative stress and antioxidant defense. World Allerg Org J. (2012) 5:9–19. doi: 10.1097/WOX.0b013e3182439613
44. Fernández-Mejía, C. Oxidative stress in diabetes mellitus and the role of vitamins with antioxidant actions, Ed. Morales-González JA. In: Oxidative stress and chronic degenerative diseases-a role for antioxidants, United Kingdom: IntechOpen Limited. vol. 209 (2013). doi: 10.5772/51788
45. Khalid, A, and Hameed, A. Seed biochemical analysis based profiling of diverse wheat genetic resource from Pakistan. Front Plant Sci. (2017) 8:1276. doi: 10.3389/fpls.2017.01276
46. Gupta, V. K., and Sharma, S. K., "Plants as natural antioxidants," (2006). Available at: http://nopr.niscpr.res.in/handle/123456789/7962.
47. Çavuşoğlu, K, and Bilir, G. Effects of ascorbic acid on the seed germination, seedling growth and leaf anatomy of barley under salt stress. J Agric Biolog Sci. (2015) 10:124–9.
48. Naz, A, Razzaq, K, Raza, N, Hussain, M, Mujtaba, A, Afzal, MI, et al. Evaluation of enzymatic and non-enzymatic antioxidant potential of sprouted indigenous legumes from Pakistan. Int J Food Prop. (2023) 26:1230–43. doi: 10.1080/10942912.2023.2207778
49. Asif, M. Chemistry and antioxidant activity of plants containing some phenolic compounds. Chem Int. (2015) 1:35–52.
50. de Camargo, AC, Favero, BT, Morzelle, MC, Franchin, M, Alvarez-Parrilla, E, de la Rosa, LA, et al. Is chickpea a potential substitute for soybean? Phenolic bioactives and potential health benefits. Int J Mol Sci. (2019) 20:2644. doi: 10.3390/ijms20112644
51. Jameel, S, Hameed, A, and Shah, TM. Biochemical profiling for antioxidant and therapeutic potential of Pakistani chickpea (Cicer arietinum L.) genetic resource. Front Plant Sci. (2021) 12:663623. doi: 10.3389/fpls.2021.663623
52. Talukdar, D. Total flavonoids, phenolics, tannins and antioxidant activity in seeds of lentil and grass pea. Int J Phytomed. (2012) 4:537.
53. Gupta, S, Singh, A, Dikshit, H, Aski, M, Mishra, G, and Kumar, J. Assessment of total phenol content, total flavonoid content and anti-oxidant capacity in exotic lentil germplasm. Chem Sci Rev Lett. (2018) 7:459–63.
54. Salunkhe, D. K., and Kadam, S., "CRC handbook of world food legumes: nutritional chemistry, processing technology, and utilization," Boca Raton, FL (USA): CRC Press. (1989). Available at: https://agris.fao.org/search/en/providers/122621/records/6473a53f2437ad1e5b922ba5.
55. Prajapati, A, Singh, R, Kumar, B, Kewat, R, and Bahadur, R. Biochemical studies and anti-nutritional factors of lentil (Lens culinaris medik) varieties. J Pharm Phytochem. (2020) 9:1490–3.
56. Campos-Vega, R, Loarca-Piña, G, and Oomah, BD. Minor components of pulses and their potential impact on human health. Food Res Int. (2010) 43:461–82. doi: 10.1016/j.foodres.2009.09.004
57. Yeo, J, and Shahidi, F. Effect of hydrothermal processing on changes of insoluble-bound phenolics of lentils. J Funct Foods. (2017) 38:716–22. doi: 10.1016/j.jff.2016.12.010
58. Singh, R, Haukka, M, McKenzie, CJ, and Nordlander, E. High turnover catalase activity of a mixed-valence MnIIMnIII complex with terminal carboxylate donors. Eur J Inorg Chem. (2015) 2015:3485–92. doi: 10.1002/ejic.201500468
59. Kruger, J, and Leberg, D. Changes in catalase activity of wheat during kernel growth and maturation. Cereal Chem. (1974) 51:820–6.
60. Bakalova, S, Nikolova, A, and Nedeva, D. Isoenzyme profiles of peroxidase, catalase and superoxide dismutase as affected by dehydration stress and ABA during germination of wheat seeds. J Plant Physiol. (2004) 30:64–77.
61. Kandukuri, SS, Noor, A, Ranjini, SS, and Vijayalakshmi, M. Purification and characterization of catalase from sprouted black gram (Vigna mungo) seeds. J Chromatogr B. (2012) 889-890:50–4. doi: 10.1016/j.jchromb.2012.01.029
62. Zhang, Y. Biological role of ascorbate in plants, Ed. Zhang Y. In: Ascorbic acid in plants : New York, NY: Springer (2013). 7–33. doi: 10.1007/978-1-4614-4127-4_2
63. Vicuna, D., “The role of peroxidases in the development of plants and their responses to abiotic stresses,” Dublin: Doctoral thesis. Technological University. (2005). doi: 10.21427/D7CW2B
64. Shah, W, Ullah, S, Ali, S, Idrees, M, Khan, MN, Ali, K, et al. Effect of exogenous alpha-tocopherol on physio-biochemical attributes and agronomic performance of lentil (Lens culinaris Medik.) under drought stress. PLoS One. (2021) 16:e0248200. doi: 10.1371/journal.pone.0248200
65. Schaller, A. A cut above the rest: the regulatory function of plant proteases. Planta. (2004) 220:183–97. doi: 10.1007/s00425-004-1407-2
67. Garg, GK, and Virupaksha, TK. Acid protease from germinated sorghum: 1. Purification and characterization of the enzyme. Eur J Biochem. (1970) 17:4–12. doi: 10.1111/j.1432-1033.1970.tb01124.x
68. Kitamura, N, and Maruyama, Y. Cysteine endopeptidase activity in sprouting potato tubers. Agric Biol Chem. (1985) 49:1591–7.
69. Burger, W. Multiple forms of acidic endopeptidase from germinated barley. Plant Physiol. (1973) 51:1015–21. doi: 10.1104/pp.51.6.1015
70. Baumgartner, B, and Chrispeels, MJ. Purification and characterization of vicilin peptidohydrolase, the major endopeptidase in the cotyledons of mung-bean seedlings. Eur J Biochem. (1977) 77:223–33. doi: 10.1111/j.1432-1033.1977.tb11661.x
71. Arm, S, Hosoyama, H, and Abe, K. Gibberellin-induced cysteine proteinase occurring in germinating rice seeds and its specificity for digesting oxidized insulin B-chain. Agric Biol Chem. (1988) 52:2957–9. doi: 10.1080/00021369.1988.10869154
72. Dahot, M, Ali, S, and Memon, A. Proteolytic enzymes of Moringa oleifera seeds. J Pharm. (1985) 6:1–10. doi: 10.5829/idosi.wasj.2012.18.01.46
73. Ahmed, Z, Sheikh, MA, Hameed, A, and ud Din, S. Investigation of antioxidant enzymes and biochemical changes in the wheat seeds (freed) induced by different pre-sowing treatments. World Appl Sci J. (2012) 18:31–6.
74. Shahzadi, H, Sheikh, MA, Hameed, A, and Jamil, A. Comparative antioxidant potential and bioactivity of maize (Zea mays) ear tissues from different genotypes. Int J Agric Biol. (2015) 17:539–46. doi: 10.17957/IJAB/17.3.14.572
75. Wong, F-C, Xiao, J, Wang, S, Ee, K-Y, and Chai, T-T. Advances on the antioxidant peptides from edible plant sources. Trends Food Sci Technol. (2020) 99:44–57. doi: 10.1016/j.tifs.2020.02.012
76. Sundarram, A, and Murthy, TPK. α-Amylase production and applications: a review. J Appl Environ Microbiol. (2014) 2:166–75. doi: 10.12691/jaem-2-4-10
77. Freeman, H, and Ford, W. The evaluation of malt products for use in tile breadmakmg industry. J Soc Chem Indus. (1941) 60:6–11. doi: 10.1002/jctb.5000600102
78. Sidari, M, Santonoceto, C, Anastasi, U, Preiti, G, and Muscolo, A. Variations in four genotypes of lentil under NaCl-salinity stress. Am J Agric Biol Sci. (2008) 3:410–6. doi: 10.3844/ajabssp.2008.410.416
79. Farooq, T, Nisa, ZU, Hameed, A, Ahmed, T, and Hameed, A. Priming with copper-chitosan nanoparticles elicit tolerance against PEG-induced hyperosmotic stress and salinity in wheat. BMC Chem. (2022) 16:23. doi: 10.1186/s13065-022-00813-1
80. Sharma, P, Jha, AB, Dubey, RS, and Pessarakli, M. Reactive oxygen species, oxidative damage, and antioxidative defense mechanism in plants under stressful conditions. J Bot. (2012) 2012:1–26. doi: 10.1155/2012/217037
81. Maryam, GG, Elahe, G, Mohsen, S, and Zeinab, HK. The effect of accelerated aging on germination characteristics, seed reserve utilization and malondialdehyde content of two wheat cultivars. J Stress Physiol Biochem. (2014) 10:15–23.
82. Nessim, A, and Kasim, W. Physiological impact of seed priming with CaCl2 or carrot root extract on Lupinus termis plants fully grown under salinity stress. Egypt J Bot. (2019):763–77. doi: 10.21608/ejbo.2019.8026.1289
83. Vaiserman, A, Koliada, A, Zayachkivska, A, and Lushchak, O. Nanodelivery of natural antioxidants: an anti-aging perspective. Front Bioeng Biotechnol. (2020) 7:447. doi: 10.3389/fbioe.2019.00447
84. Sevindik, M. Investigation of oxidant and antioxidant status of edible mushroom Clavariadelphus truncatus. Mantar Dergisi. (2018) 9:165–8. doi: 10.30708/mantar.427457
85. Pizzino, G., Irrera, N, Cucinotta, M, Pallio, G, Mannino, F, Arcoraci, V, et al., "Oxidative stress: Harms and benefits for human health. Oxidative Medicine and Cellular Longevity, London, United Kingdom: Hindawi 2017, 1–13," ed, 2017. doi: 10.1155/2017/8416763
86. Padhi, EM, Liu, R, Hernandez, M, Tsao, R, and Ramdath, DD. Total polyphenol content, carotenoid, tocopherol and fatty acid composition of commonly consumed Canadian pulses and their contribution to antioxidant activity. J Funct Foods. (2017) 38:602–11. doi: 10.1016/j.jff.2016.11.006
87. Faris, MEAIE, Takruri, HR, and Issa, AY. Role of lentils (Lens culinaris L.) in human health and nutrition: a review. Mediterr J Nutr Metab. (2013) 6:3–16. doi: 10.3233/s12349-012-0109-8
88. Jarpa-Parra, M. Lentil protein: a review of functional properties and food application. An overview of lentil protein functionality. Int J Food Sci Technol. (2018) 53:892–903. doi: 10.1111/ijfs.13685
89. Nosworthy, MG, Medina, G, Franczyk, AJ, Neufeld, J, Appah, P, Utioh, A, et al. Effect of processing on the in vitro and in vivo protein quality of red and green lentils (Lens culinaris). Food Chem. (2018) 240:588–93. doi: 10.1016/j.foodchem.2017.07.129
90. Skylas, DJ, Johnson, JB, Kalitsis, J, Richard, S, Whiteway, C, Wesley, I, et al. Optimised dry processing of protein concentrates from Australian pulses: a comparative study of faba bean, yellow pea and red lentil seed material. Legume Sci. (2022) 5:e161. doi: 10.1002/leg3.161
91. Urbano, G, Porres, JM, Frías, J, and Vidal-Valverde, C. Nutritional value In: Lentil : United States: Springer Dordrecht (2007). 47–93. doi: 10.1007/978-1-4020-6313-8
92. El-Adawy, T, Rahma, E, El-Bedawey, A, and El-Beltagy, A. Nutritional potential and functional properties of germinated mung bean, pea and lentil seeds. Plant Foods Hum Nutr. (2003) 58:1–13. doi: 10.1023/B:QUAL.0000040339.48521.75
93. Tchiagam, JN, Youmbi, E, Njintang, N, Bell, J, and Maina, AN. Generation means analysis of seed sucrose content in cowpea ("Vigna unguiculata" L. Walp.). Asian J Agric Sci. (2011) 3:475–80.
94. Basha, SM. Soluble sugar composition of peanut seed. J Agric Food Chem. (1992) 40:780–3. doi: 10.1021/jf00017a015
95. Hou, A, Chen, P, Shi, A, Zhang, B, and Wang, Y-J. Sugar variation in soybean seed assessed with a rapid extraction and quantification method. Int J Agron. (2009) 2009:1–8. doi: 10.1155/2009/484571
96. Enujiugha, VN, Badejo, AA, Iyiola, SO, and Oluwamukomi, MO. Effect of germination on the nutritional and functional properties of African oil bean (Pentaclethra macrophylla Benth) seed flour. J Food Agric Environ. (2003) 1:72–5.
97. Teixeira, AI, Ribeiro, LF, Rezende, ST, Barros, EG, and Moreira, MA. Development of a method to quantify sucrose in soybean grains. Food Chem. (2012) 130:1134–6. doi: 10.1016/j.foodchem.2011.07.128
98. Fouad, AA, and Rehab, F. Effect of germination time on proximate analysis, bioactive compounds and antioxidant activity of lentil (Lens culinaris Medik.) sprouts. Acta Sci Pol Technol Aliment. (2015) 14:233–46. doi: 10.17306/J.AFS.2015.3.25
99. Weng, Y, Ravelombola, WS, Yang, W, Qin, J, Zhou, W, Wang, YJ, et al. Screening of seed soluble sugar content in cowpea (Vigna unguiculata (L.) Walp). Am J Plant Sci. (2018) 9:1455–66. doi: 10.4236/ajps.2018.97106
100. Pongener, A, and Deb, CR. Analysis of certain nutritional parameters of some edible lesser known legumes of Nagaland, India. J Food Chem Nanotechnol. (2021) 7:47–53. doi: 10.17756/jfcn.2021-112
101. Messina, MJ. Legumes and soybeans: overview of their nutritional profiles and health effects. Am J Clin Nutr. (1999) 70:439s–50s. doi: 10.1093/ajcn/70.3.439s
102. Meenu, M, Sharma, A, Guha, P, and Mishra, S. A rapid high-performance liquid chromatography photodiode array detection method to determine phenolic compounds in mung bean (Vigna radiata L.). Int J Food Prop. (2016) 19:2223–37. doi: 10.1080/10942912.2015.1121396
103. Meenu, M, Kamboj, U, Sharma, A, Guha, P, and Mishra, S. Green method for determination of phenolic compounds in mung bean (Vigna radiata L.) based on near-infrared spectroscopy and chemometrics. Int J Food Sci Technol. (2016) 51:2520–7. doi: 10.1111/ijfs.13232
104. Zheng, J, Yu, X, Maninder, M, and Xu, B. Total phenolics and antioxidants profiles of commonly consumed edible flowers in China. Int J Food Prop. (2018) 21:1524–40. doi: 10.1080/10942912.2018.1494195
105. Amarowicz, R, Estrella, I, Hernández, T, Dueñas, M, Troszyńska, A, Kosińska, A, et al. Antioxidant activity of a red lentil extract and its fractions. Int J Mol Sci. (2009) 10:5513–27. doi: 10.3390/ijms10125513
106. Ganesan, K, and Xu, B. Polyphenol-rich lentils and their health promoting effects. Int J Mol Sci. (2017) 18:2390. doi: 10.3390/ijms18112390
107. Zhang, B, Deng, Z, Ramdath, DD, Tang, Y, Chen, PX, Liu, R, et al. Phenolic profiles of 20 Canadian lentil cultivars and their contribution to antioxidant activity and inhibitory effects on α-glucosidase and pancreatic lipase. Food Chem. (2015) 172:862–72. doi: 10.1016/j.foodchem.2014.09.144
108. Xu, M, Jin, Z, Peckrul, A, and Chen, B. Pulse seed germination improves antioxidative activity of phenolic compounds in stripped soybean oil-in-water emulsions. Food Chem. (2018) 250:140–7. doi: 10.1016/j.foodchem.2018.01.049
109. Han, H, and Baik, BK. Antioxidant activity and phenolic content of lentils (Lens culinaris), chickpeas (Cicer arietinum L.), peas (Pisum sativum L.) and soybeans (Glycine max), and their quantitative changes during processing. Int J Food Sci Technol. (2008) 43:1971–8. doi: 10.1111/j.1365-2621.2008.01800.x
110. Smolikova, G, Laman, N, and Boriskevich, O. Role of chlorophylls and carotenoids in seed tolerance to abiotic stressors. Russ J Plant Physiol. (2011) 58:965–73. doi: 10.1134/S1021443711060161
111. Monteverde, N, and Lyubimenko, V. Green pig ment in the inner seed coat and its relationships to chlorophyll, Izv. Bot Sada. (1909) 9:2–3.
112. Jalink, H, van der Schoor, R, Frandas, A, van Pijlen, JG, and Bino, RJ. Chlorophyll fluorescence of Brassica oleracea seeds as a non-destructive marker for seed maturity and seed performance. Seed Sci Res. (1998) 8:437–43. doi: 10.1017/S0960258500004402
113. McDonald, M. Seed deterioration: physiology, repair and assessment. Seed Sci Technol. (1999) 27:177–237.
114. Aminot, A, and Rey, F. Standard procedure for the determination of chlorophyll a by spectroscopic methods. Int Council Explor Sea. (2000) 112:25.
115. Gebregziabher, BS, Sheng-rui, ZH, Muhammad, AZ, Jie, QI, Agyenim-boateng, KG, Yue, FE, et al. Natural variations and geographical distributions of seed carotenoids and chlorophylls in 1 167 Chinese soybean accessions. J Integr Agric. (2023) 22:2632–47. doi: 10.1016/j.jia.2022.10.011
116. Goodwin, T. Nature and distribution of carotenoids. Food Chem. (1980) 5:3–13. doi: 10.1016/0308-8146(80)90061-8
117. Howitt, CA, and Pogson, BJ. Carotenoid accumulation and function in seeds and non-green tissues. Plant Cell Environ. (2006) 29:435–45. doi: 10.1111/j.1365-3040.2005.01492.x
118. Mishra, GP, Ankita,, Aski, MS, Tontang, MT, Choudhary, P, Tripathi, K, et al. Morphological, molecular, and biochemical characterization of a unique lentil (Lens culinaris medik.) genotype showing seed-coat color anomalies due to altered anthocyanin pathway. Plan Theory. (2022) 11:1815. doi: 10.3390/plants11141815
119. Schober, P, Boer, C, and Schwarte, LA. Correlation coefficients: appropriate use and interpretation. Anesth Analg. (2018) 126:1763–8. doi: 10.1213/ANE.0000000000002864
120. Shao, Y, Tang, F, Huang, Y, Xu, F, Chen, Y, Tong, C, et al. Analysis of genotype× environment interactions for polyphenols and antioxidant capacity of rice by association mapping. J Agric Food Chem. (2014) 62:5361–8. doi: 10.1021/jf500951e
121. Shao, Y, Xu, F, Chen, Y, Huang, Y, Beta, T, and Bao, J. Analysis of genotype, environment, and their interaction effects on the phytochemicals and antioxidant capacities of red rice (Oryza sativa L.). Cereal Chem. (2015) 92:204–10. doi: 10.1094/CCHEM-06-14-0126-R
122. Gupta, S, Kushwah, A, Singh, A, Dikshit, HK, Mishra, GP, Aski, MS, et al. Nutritional profiling and antioxidant assessment of Indian and exotic lentil accessions. Indian J Gen Plant Breed. (2021) 81:440–9.
123. Rathinavel, K. Principal component analysis with quantitative traits in extant cotton varieties (Gossypium hirsutum L.) and parental lines for diversity. Curr Agric Res J. (2018) 6:54–64. doi: 10.12944/CARJ.6.1.07
124. Mishra, C, Tiwari, V, Satish-Kumar, VG, Kumar, A, and Sharma, I. Genetic diversity and genotype by trait analysis for agromorphological and physiological traits of wheat (Triticum aestivum L.). Sabrao J Breed Genet. (2015) 47:40–8.
125. Hagos, HG, and Abay, F. AMMI and GGE biplot analysis of bread wheat genotypes in the northern part of Ethiopia. J Plant Breed Genet. (2013) 1:12–8.
126. Ghaed-Rahimi, L, and Heidari, B. Genetic advance prediction and multivariate analysis for antioxidants and agronomic traits in wheat. Ann Res Rev Biol. (2014) 4:2427–49. doi: 10.9734/ARRB/2014/8987
127. Jin, F, Xue, J, Jia, Y, and Liu, Z. The cluster analysis on tomato germplasms. Acta Agri Boreali Sin. (2006) 21:49–54.
Keywords: lentil, biochemical profiling, nutritional traits, principal component analysis, cluster analysis, antioxidants, correlation
Citation: Riaz F, Hameed A and Asghar MJ (2024) Grain nutritional and antioxidant profiling of diverse lentil (Lens culinaris Medikus) genetic resources revealed genotypes with high nutritional value. Front. Nutr. 11:1344986. doi: 10.3389/fnut.2024.1344986
Edited by:
Miryam Amigo-Benavent, University of Limerick, IrelandReviewed by:
Emmanuel Anyachukwu Irondi, Kwara State University, NigeriaC. Parameswaran, Indian Council of Agricultural Research (ICAR), India
Copyright © 2024 Riaz, Hameed and Asghar. This is an open-access article distributed under the terms of the Creative Commons Attribution License (CC BY). The use, distribution or reproduction in other forums is permitted, provided the original author(s) and the copyright owner(s) are credited and that the original publication in this journal is cited, in accordance with accepted academic practice. No use, distribution or reproduction is permitted which does not comply with these terms.
*Correspondence: Amjad Hameed, amjad46pk@yahoo.com