BMI and plasma lipid levels with risk of proliferative diabetic retinopathy: a univariable and multivariable Mendelian randomization study
 Yiyang Shu
 Qi Zhou2*
  Yuting Shao
 Shen Qu
 Wenting Han
 Xiao Lv
 Yanlong Bi
- 1Department of Ophthalmology, Tongji Hospital, School of Medicine, Tongji University, Shanghai, China
- 2Exam Center, School of Medicine, Tongji University, Shanghai, China
- 3School of Medicine, Tongji Eye Institute, Tongji University, Shanghai, China
Background: The study aimed to determine whether a causal effect exists between body mass index (BMI) or plasma lipid levels and proliferative diabetic retinopathy (PDR) risk in humans.
Methods: We utilized univariable (UVMR) and multivariable two-sample Mendelian randomization (MVMR) analyses to confirm the effects of BMI and plasma lipid levels on the risk of PDR. Genetic variants associated with BMI and three plasma lipids were obtained from GWAS summary datasets generated by many different consortia and were deposited in the MR-Base database. The GWAS summary data for PDR from the FinnGen biobank included 2,12,889 participants of European ancestry (8,681 cases and 2,04,208 controls). Inverse variance weighted (IVW) was applied as the main MR analysis. Sensitivity analysis was used to evaluate the robustness of our findings.
Results: In the UVMR analysis, the causal associations of genetically predicted BMI with PDR presented a positive association (OR = 1.120, 95% CI = 1.076–1.167, P < 0.001), and the lower HDL-C level was associated with a higher risk of PDR (OR = 0.898, 95% CI = 0.811–0.995, P = 0.040). No evidence of an association between LDL-C or TG levels (P > 0.05) and PDR risk was found. In the MVMR analysis controlling for the HDL-C level, there was strong evidence for a direct causal effect of BMI on the risk of PDR (OR = 1.106, 95%CI = 1.049, 1.166, P < 0.001, IVW). After adjusting for BMI, there was no evidence for a direct causal effect of the HDL-C level on the risk of PDR (OR = 0.911, 95% CI = 0.823, 1.008, P = 0.072). Sensitivity analyses confirmed that the results were reliable and stable.
Conclusion: Robust evidence was demonstrated for an independent, causal effect of BMI in increasing the risk of PDR. Further studies are required to understand the potential biological mechanisms underlying this causal relationship.
Introduction
Diabetes mellitus (DM) is a serious and increasing global health burden. From the 2019 Global Burden of Disease (GBD) study, we found that the all-age prevalence number of DM increased significantly from 1990 to 2019 (1.60 × 10⁸ vs. 4.60 × 10⁸). The increased prevalence of DM worldwide has led diabetic retinopathy (DR) to be a leading cause of vision loss in many countries (1). Among the global 33.6 million adults aged 50 years and older who were blind in 2020, the number of cases of blindness caused by DR was 0.9 million (95% CI 0.6–1.2) (2). DR is a chronic progressive disease caused by damage to the microvasculature of the retina. Proliferative diabetic retinopathy (PDR) is the later stage of DR and is characterized by neovascularization of the retina, which can lead to irreversible vision loss, and its damage cannot be completely cured.
Hyperglycemia is the strongest modifiable risk factor, and people with optimal glycemic control also develop DR. Thus, exploring the role of other modifiable risk factors has become increasingly important in the development and progression of DR, and obesity is one such important factor (3). Some studies (4–7) have shown that dyslipidemia is a risk factor for the development of DR. The Fenofibrate Intervention and Event Lowering in Diabetes (FIELD) study and the Action to Control Cardiovascular Risk in Diabetes (ACCORD) study showed a beneficial effect of fenofibrate on the progression of DR although the mechanism of this effect does not seem to be related to the level of plasma lipids (8, 9). However, the relationship between BMI, plasma lipid level, and PDR may be subject to confounding by unknown factors. Therefore, it is difficult to clarify causal risk factors. Given the lack of evidence, more studies are still needed to clarify the relationship between them.
In general, the gold standard to determine causality is the randomized control trial (RCT); however, RCTs are time-consuming and require a large amount of manpower and resources; moreover, sometimes it is almost impossible to conduct an RCT due to ethical issues (10). Mendelian randomization (MR) is an alternative approach to make inferences about the causal effect between exposures and outcomes by using genetic variants as instrumental variables (IVs) (11). The single nucleotide polymorphisms (SNPs) used as IVs in the MR analysis must meet the following three basic assumptions: (1) the IVs must be associated with the exposure; (2) the IVs must only affect the outcome via the exposure; and (3) there is no factor that can cause both the IVs and the outcome.
To the best of our knowledge, no MR study has investigated the causal relationship between BMI, plasma lipid level, and PDR. The study comprehensively explored whether genetically predicted BMI and plasma lipid levels are risk factors for PDR outcomes to further examine these associations using the MVMR method to rule out pleiotropy. This study aimed to help clarify the risk factors underlying the PDR and assist in the development of future prevention and intervention strategies.
Materials and methods
Study design
To investigate the causal relationship between BMI, plasma lipid levels, and risk of PDR, we applied the two-sample MR, an approach to determine causal effects using GWAS summary statistics for exposure and outcome from separate GWASs. The MR study design is illustrated in Figure 1.
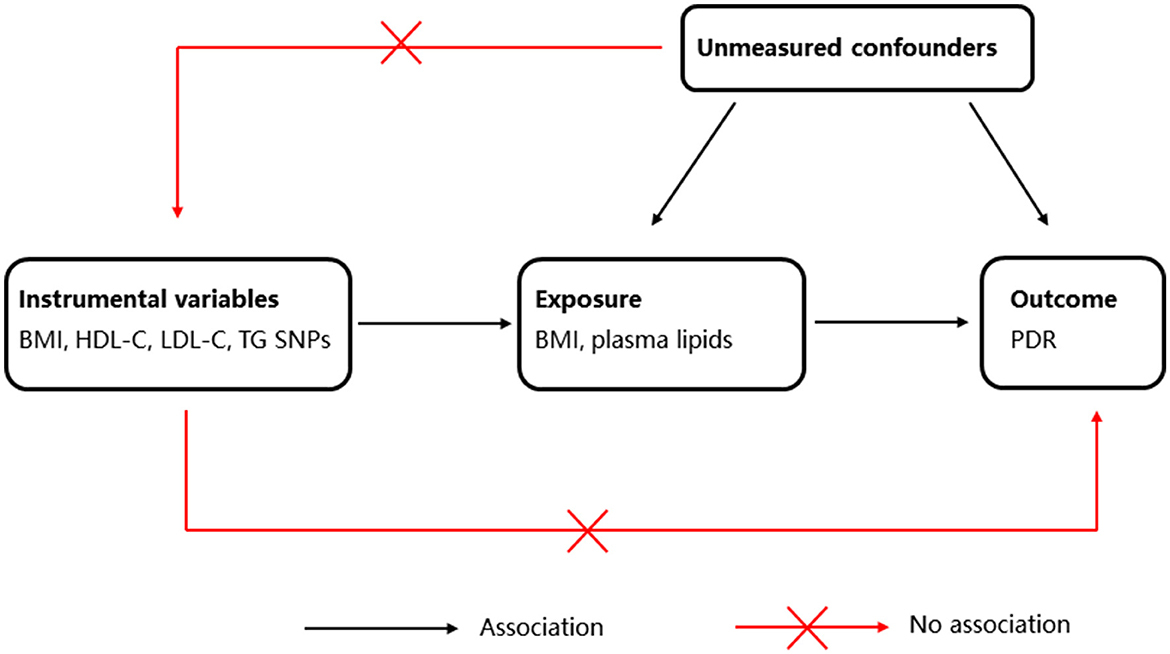
Figure 1. Schematic representation of Mendelian randomization (MR) analysis. BMI, body mass index; HDL-C, high-density lipoprotein cholesterol; LDL-C, low-density lipoprotein cholesterol; TG, triglyceride; PDR, proliferative diabetic retinopathy.
The data and information we used in this article were all searched and downloaded from the public database. No ethical review was required for this study.
Genetic instruments
Two-sample MR analyses were performed using GWAS summary data. BMI and three plasma lipids—high-density lipoprotein cholesterol (HDL-C), low-density lipoprotein cholesterol (LDL-C), and triglyceride (TG)—were included in this study as the exposure variables. Publicly accessible data for genetic variants associated with BMI and three plasma lipids were obtained from GWAS summary datasets generated by many different consortia and were deposited in the MR-Base database (https://gwas.mrcieu.ac.uk/). The FinnGen Biobank for PDR is available at https://r5.finngen.fi/.
The datasets included 99,998 European participants and the number of included SNPs was 7,191,606 for BMI, 77,409 participants and 7,892,377 SNPs for HDL-C, 70,814 participants and 7,892,997 SNPs for LDL-C, and 78,700 participants and 7,892,037 SNPs for TG. The GWAS summary data for PDR from the FinnGen biobank included 2,12,889 participants of European ancestry (8,681 cases and 204,208 controls). The number of SNPs included in the study was 16,380,460 (Supplementary Table 1).
All SNPs with p-values ≤ 5.0 × 10⁻⁸ were extracted, and then we used linkage disequilibrium (LD) to minimize the impact. We set the threshold of statistical significance as “distance> 10,000 kb, r2 < 0.001” to identify the SNPs associated with exposure. These SNPs were used as instrumental variables (IVs) in the MR analysis.
Mendelian randomization
We performed UVMR analyses for BMI and plasma lipid levels on PDR risk separately to estimate the total causal effects of BMI on PDR and plasma lipid levels on PDR. To assess the causal effect of BMI on PDR, the inverse variance-weighted (IVW) method was used as the main MR analysis, and other methods, such as MR–Egger, weighted median, simple mode, and weighted mode, were also used as complementary analyses. A P-value of <0.05 was considered to be statistically significant.
To explore whether PDR had any causal effect on the BMI, we also performed a reverse MR analysis using the SNPs associated with PDR as IVs (i.e., PDR as exposure and the identified causal BMI as outcome).
To investigate the direct effects of each, we applied MVMR to identify whether the effect of BMI and HDL-C is independent of each other on PDR risks. The SNPs used to conduct MVMR were combinations of IVs of each exposure (duplicates were excluded). The SNP for each exposure has been described in the methods of genetic instruments. We used the IVW method to estimate causal effects in MVMR analysis.
According to Bonferroni correction analysis, a P-value of <0.025 was considered to be statistically significant in MVMR analyses.
Sensitivity analysis
Instrument strength for each candidate SNP in MR was estimated using the F-statistic. We evaluated the SNP power using the F statistics (12) (F = Beta2/SE2) for each SNP, and F > 10 was viewed as a strong instrument.
Heterogeneity was tested by Cochran's Q test and I2 statistics (13) (I2 = 100%*(Q-df)/Q, where Q represents the quantitative value of Cochran's Q test and df represents the degree of freedom which equals to the number of instrumental variables used minus one) to evaluate the stability and reliability of MR results. A p-value of < 0.05 or an I2 value of >50% was regarded as statistically significant (14). The intercept of the Egger model can be used for the statistical test of pleiotropy (15), where deviation from 0 denotes the presence of directional pleiotropy. In addition, the MR-PRESSO test can detect possible outliers, and the MR-PRESSO global test can be used to identify the potential horizontal pleiotropic effects of the SNPs (16). A leave-one-out sensitivity test was utilized to examine the effect of individual SNPs on the causal inference. We removed the single SNPs one by one and calculated the effect of the remaining SNPs by the IVW method (17).
UVMR and MVMR analyses were performed in R (version 4.2.1) using the “TwoSampleMR” version 0.5.6 and “MR-PRESSO” package (18) (https://mrcieu.github.io/TwoSampleMR/). A P-value <0.05 was considered to indicate nominal significance.
Results
MR analysis of BMI and risk of PDR
In total, 35 SNPs for BMI (Supplementary Table 2) were selected as the genetic instruments. We calculated F-statistics to evaluate the strength of the instrumental variable effect. The rule-of-thumb of F was set as 10 to avoid bias.
The causal associations of genetically predicted BMI with PDR presented a positive result, which means that higher BMI was associated with a higher risk of PDR [odds ratio (OR) = 1.120, 95% confidence interval (CI) = 1.076–1.167, P < 0.001, using the IVW method] (Table 1) (Figure 2A). The sensitivity analysis showed that there were no heterogeneities (IVW: Q-value = 39.657; df = 34; P = 0.232; I2 = 14.26%; MR Egger: Q-value = 39.656; df = 33; P = 0.198; I2 = 16.78%) and no directional pleiotropies (MR–Egger intercept = 2.942 × 10⁻⁴; SE = 0.010; P = 0.976).
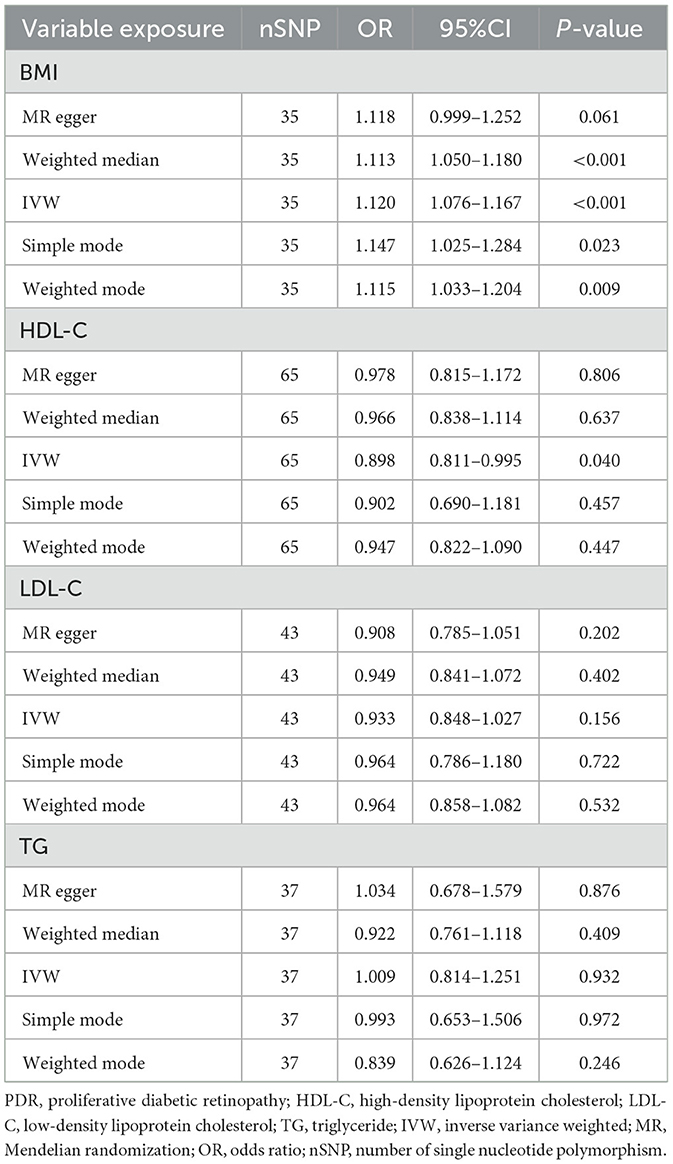
Table 1. Five MR results of BMI and plasma lipids on risk of PDR.
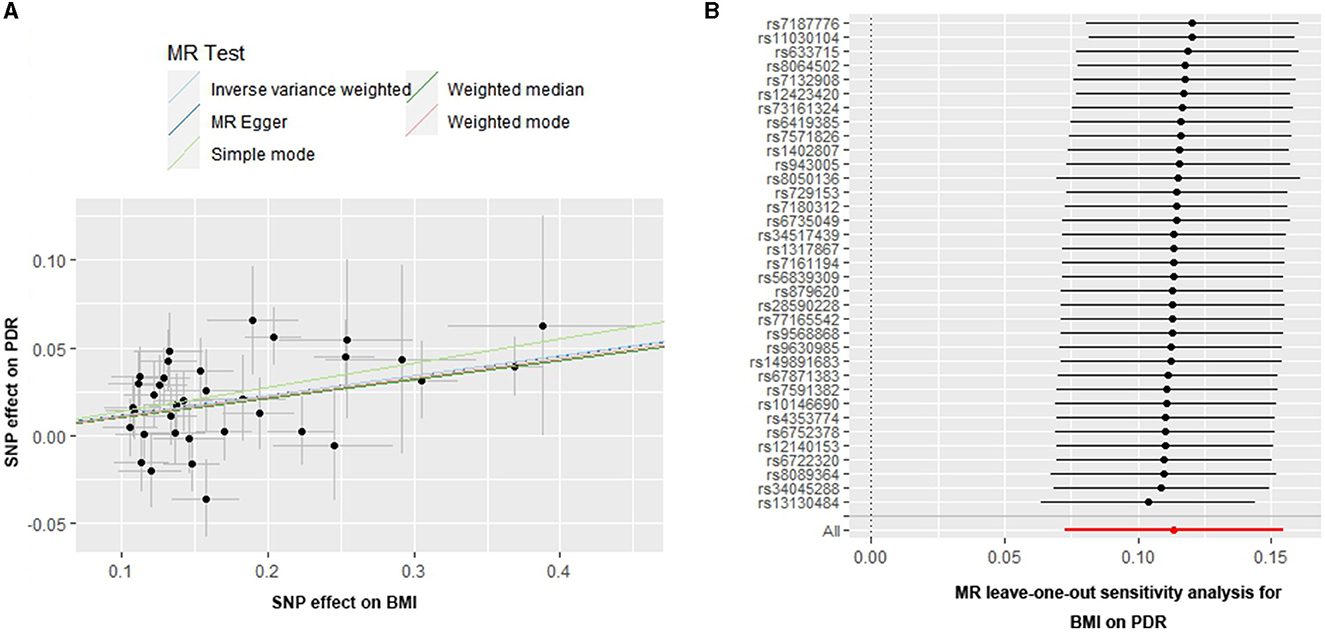
Figure 2. Scatter and leave-one-out plots for BMI on the risk of PDR. (A) Scatter plots of the genetic associations of BMI-associated SNPs against the genetic associations of PDR. The slopes of each line represent the causal association for each method. (B) Leave-one-out analysis plots for BMI on PDR risk.
In addition, the MR-PRESSO global test (P for global test = 0.355) supports this result. Moreover, the leave-one-out test suggested that the observed associations may not be driven by any single SNP (Figure 2B), indicating that the results were reliable and stable.
In reverse MR analysis, there was no evidence of a causal effect of PDR on BMI (OR = 0.91, 95%CI = 0.79–1.05, P = 0.18, using the IVW method).
MR analysis of plasma lipid levels and risk of PDR
We further investigated the relationship between plasma lipid levels and the risk of PDR (Table 1). In total, 65 SNPs for HDL-C (Supplementary Table 3), 43 SNPs for LDL-C, and 37 SNPs for TGs were selected as the genetic instruments.
The causal associations of genetically predicted HDL-C levels with PDR based on the IVW method showed that the lower HDL-C levels were associated with a higher risk of PDR (OR = 0.898, 95% CI = 0.811–0.995, P = 0.040) (Table 1, Figure 3A). The MR-Egger intercept test suggested a low probability of directional pleiotropy for HDL-C (intercept = −6.249 × 10⁻³; SE = 5.691 × 10⁻³; P = 0.276). Although the results of Cochran's Q (Q-value = 100.583; df = 63; P = 0.0024, by IVW) showed there was heterogeneity, I2 = 37.37% suggested that it did not have significant heterogeneity. We still used the random effects IVW MR analysis (P = 0.040), Bowden et al. (19) indicating that a higher HDL-C level was associated with a lower risk of PDR. The result of the MR analysis was driven by potentially influential SNPs identified in the “leave one out” analysis, and we should carefully interpret the result and draw a cautious conclusion (Figure 3B).
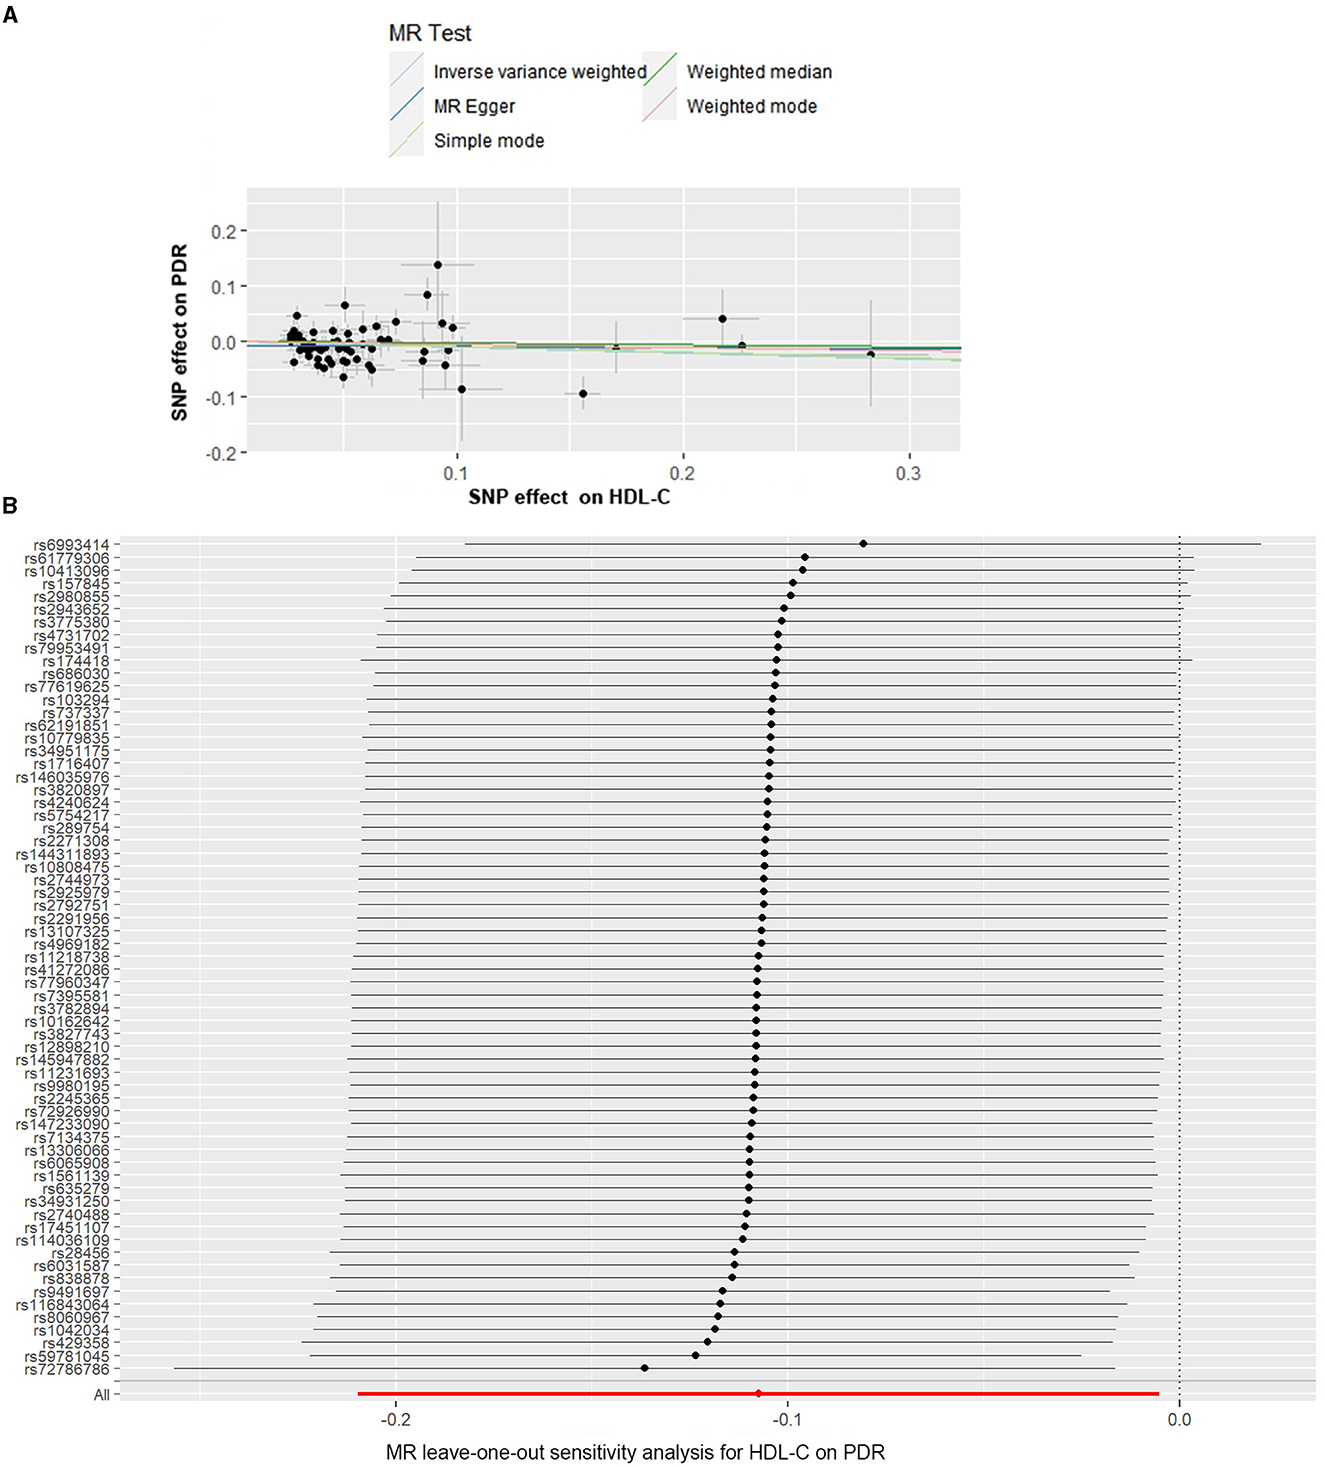
Figure 3. Scatter and leave-one-out plots for HDL-C on the risk of PDR. (A) Scatter plots of the genetic associations of HDL-C-associated SNPs against the genetic associations of PDR. The slopes of each line represent the causal association for each method. (B) Leave-one-out analysis plots for HDL-C on PDR risk.
When we assessed the causal relationship between LDL-C and PDR, no evidence of an association was detected using the IVW analysis method (P = 0.156) (Table 1; Supplementary Figure 1). The MR-Egger intercept test did not reveal signs of horizontal pleiotropy for LDL-C (intercept = 2.884 × 10⁻³, SE = 5.910 × 10⁻³, P = 0.628). Non-significant heterogeneity was detected across the instrument SNP effects (Q = 57.027; P = 0.061, by IVW). Furthermore, in the leave-one-out sensitivity analysis, we found that no single SNP significantly influenced the overall effect of LDL-C on PDR (Supplementary Figure 2).
In the UVMR analysis of TG and PDR, the causal effect estimated from five methods all suggested a negative result (P > 0.05) (Table 1; Supplementary Figure 3). No statistical evidence of horizontal pleiotropy was found across TGs (intercept = −1.673 × 10⁻³, SE = 0.013, P = 0.895). Furthermore, no significant distortion was observed in the causal estimates before and after outlier removal (MR-PRESSO distortion test, p = 0.855). Although heterogeneity in the SNP effects was indicated by the Cochran's Q test (Q = 134.209, P = 3.053 × 10⁻¹³), plots of leave-one-out analysis that are shown in Supplementary Figure 4 demonstrated no consistent causal relationship between genetically predicted TG and PDR. Thus, this suggests that there is stability in our results.
MVMR analysis
Moreover, we carried out IVW MVMR analyses to estimate the direct causal effect of genetically predicted BMI and HDL-C levels on PDR risk. In the MVMR analysis controlling for BMI, there was no evidence for a direct causal effect of the HDL-C level on the risk of PDR (IVW OR = 0.911, 95% CI = 0.823, 1.008, P = 0.072). After adjusting for the HDL-C level, there was strong evidence for a direct causal effect of BMI on the risk of PDR (IVW OR = 1.106, 95% CI = 1.049, 1.166, P < 0.001) (Supplementary Table 4).
Discussion
In the present study, we utilized both UVMR and MVMR analyses to estimate a causal and independent effect of BMI and plasma lipid level on PDR risk. Our study provided robust evidence that BMI was responsible for deleterious effects on higher PDR risk, and BMI may account for the protective effects of HDL-C against the risk of PDR, whereas no clear evidence for an independent causal effect of HDL-C on the risk of PDR. By using MVMR analysis, we found that BMI can still directly influence PDR after adjustment for HDL-C. The results of reverse MR analysis showed no evidence of reverse causality from PDR to BMI. Moreover, several sensitivity analyses of our results are essentially robust, including heterogeneity tests, pleiotropy tests, and leave-one-out sensitivity tests.
The appearance of retinal neovascularization means a critical change in the progression of DR, the sight-threatening endpoint (PDR). Visual loss can occur suddenly because of vitreous hemorrhage (VH) or tractional retinal detachment (TRD) due to progressive fibrosis (1). In this stage, it is necessary to intervene with some treatments, such as laser photocoagulation and intraocular injection of anti-VEGF agents, and even vitreoretinal surgery may occasionally be needed. Therefore, it is crucial to explore the modifiable risk factors for PDR, which is why we chose PDR rather than DR as the outcome of our study.
It is widely acknowledged that obesity correlates with an increased risk for hypertension, stroke, coronary atherosclerotic heart disease, and diabetes. Moreover, the influence of obesity on eye diseases has been widely confirmed, such as primary open-angle glaucoma (20), age-related maculopathy (21), and cataracts (22). In the study, obesity was judged by BMI, and three kinds of plasma lipid levels were included for analysis simultaneously. To date, various studies have focused on the mechanism between BMI and DR. Miyazawa- Miyazawa-Hoshimoto et al. (23) found that VEGF concentrations were positively correlated with BMI, while VEGF has been shown to be involved in the pathogenesis of PDR. This is consistent with our results that a higher BMI was associated with a greater risk of PDR. Considine et al. (24) found that there was a strong positive correlation between serum leptin concentrations and BMI. Some studies have suggested that serum leptin plays a role in the pathogenesis of DR. Uckaya et al. (25) found that the plasma level of leptin was significantly higher in PDR than that in patients with non-PDR or without retinopathy. In addition, the result that vitreous leptin concentrations were especially higher in patients with PDR supports the conclusions above (26). This phenomenon may be involved in the mechanism of leptin-induced promotion of angiogenesis and neovascularization (27). In addition, BMI is often correlated with hypertension and dyslipidemia, which are correlated with DR. All the results have supported a relationship between BMI and PDR. Moreover, central obesity was defined by waist circumference (WC) or waist-to-hip ratio (WHR). Zhou et al. (28) found that WC is associated with the risk of DR in the Chinese population. Man et al. (29) found that a higher WHR was associated with the presence and severity of DR in women. Ranganathan et al. (30) also supported this finding, and they found that increased waist circumference was a risk factor for diabetic retinopathy in type 2 diabetes patients older than 45 years.
The role of dyslipidemia in DR has now attracted increasing attention although the results remain controversial. Previous studies have shown an association between dyslipidemia and DR, but the causal effect remains unclear. Yau et al. (31) found that higher total serum cholesterol was associated with a higher risk of DME and confirmed the importance and influence of dyslipidemia, hyperglycemia, and hypertension as major modifiable risk factors for the risk of all DR, whereas Wong et al. (32) published the conflicting reports about this risk factor, showing that higher total cholesterol levels were associated with reduced odds of DR. The study by Zhang et al. (33) provided strong evidence that dyslipidemia promotes the development of DR by increased secretion of VEGF-A, VEGF-C, VEGF-D, and PlGF in patients with DR. On the other hand, elevated lipids are associated with endothelial dysfunction, causing hemodynamic changes, retinal tissue hypoxia, and microcirculatory disorders, and with breakdown of the blood-retinal barrier, which causes the development of DR (4). Although our results did not show a clear causal relationship between plasma lipids and PDR, the mechanism behind them still deserves further investigation.
MR was first proposed and used in 1991 (34), and then it became a greatly powerful approach to identify the causal effect of exposure on the outcome in epidemiology. The core of MR is the use of IVs, which must be associated with the exposure and only affect the outcome via the exposure, while there is no factor that can cause both the IVs and the outcome (35). Our study had some strengths as follows: First, we used GWAS summary data to extract SNPs for exposure and selected the latest studies and the largest SNP database, which means that the results were reliable. Second, the law of independent assortment means that the genetic variations related to exposure are randomly distributed among the population at birth and, thus, compared with traditional observational research and RCTs, the causal association of BMI, plasma lipids, and PDR was not distorted by confounding factors. Third, our results were robust according to the results of sensitivity analysis. However, there are several limitations in our study. First, only participants of European ancestry were included in our study; thus, it is unclear whether our results are also applicable to other populations. Further investigation is needed in other ethnic groups. Second, although several sensitivity analyses of our results are essentially robust, there may be unidentified pleiotropic effects in these datasets, so future investigators should analyze more MR methods and collect more data to minimize and avoid bias. Finally, although our results indicated that BMI is associated with an increased risk of PDR, the mechanisms are not entirely clear.
In summary, our results suggested a significant influence of BMI on PDR risks, providing genetic evidence that higher BMI is related to a higher risk of PDR. No clear evidence was found for an independent causal effect of HDL-C on PDR risk. Moreover, further studies are needed to investigate the underlying mechanism of BMI for prevention and therapeutic treatment in PDR. Our results provide a new research field for the effective screening and management of PDR risk factors.
Data availability statement
The original contributions presented in the study are included in the article/Supplementary material, further inquiries can be directed to the corresponding authors.
Author contributions
YShu, QZ, and YShao designed the study and drafted the manuscript. HL and SQ analyzed the data. WH and XL reviewed and edited the manuscript. YB led and funded the project and overall supervised the project. YB and QZ discussed, revised, and finalized the manuscript. All authors approved the final version of the manuscript to be published.
Funding
This study was supported by grants from the National Natural Science Foundation of China (Grant No. 82070920), project supported by the Clinical Research Project of Tongji Hospital of Tongji University [ITJ(ZD)2101], and the Excellent Personnel Training Plan for the Shanghai Health System (SHDC2022CRD008). The sponsor or funding organization had no role in the design or conduct of this research.
Acknowledgments
The authors thank all researchers and participants from the FinnGen consortium for sharing the genetic association estimates. We also thank all the researchers who contributed to MR-Base and IEU OpenGWAS project.
Conflict of interest
The authors declare that the research was conducted in the absence of any commercial or financial relationships that could be construed as a potential conflict of interest.
Publisher's note
All claims expressed in this article are solely those of the authors and do not necessarily represent those of their affiliated organizations, or those of the publisher, the editors and the reviewers. Any product that may be evaluated in this article, or claim that may be made by its manufacturer, is not guaranteed or endorsed by the publisher.
Supplementary material
The Supplementary Material for this article can be found online at: https://www.frontiersin.org/articles/10.3389/fnut.2023.1099807/full#supplementary-material
References
1. Cheung N, Mitchell P, Wong TY. Diabetic retinopathy. Lancet. (2010) 376:124–36. doi: 10.1016/S0140-6736(09)62124-3
2. Blindness GBD, Vision Impairment C, Vision Vision Loss Expert Group of the Global Burden of Disease S. Causes of blindness and vision impairment in 2020 and trends over 30 years, and prevalence of avoidable blindness in relation to VISION 2020: the Right to Sight: an analysis for the Global Burden of Disease Study. Lancet Glob Health. (2021) 9:e144–e60. doi: 10.1016/S2214-109X(20)30489-7
3. Dirani M, Xie J, Fenwick E, Benarous R, Rees G, Wong TY, et al. Are obesity and anthropometry risk factors for diabetic retinopathy? The diabetes management project. Invest Ophthalmol Vis Sci. (2011) 52:4416–21. doi: 10.1167/iovs.11-7208
4. Li T, Wu Y. Correlation of glucose and lipid metabolism levels and serum uric acid levels with diabetic retinopathy in type 2 diabetic mellitus patients. Emerg Med Int. (2022) 2022:9201566. doi: 10.1155/2022/9201566
5. Liu Z, Shao M, Ren J, Qiu Y, Li S, Cao W. Association between increased lipid profiles and risk of diabetic retinopathy in a population-based case-control study. J Inflamm Res. (2022) 15:3433–46. doi: 10.2147/JIR.S361613
6. Rema M, Srivastava BK, Anitha B, Deepa R, Mohan V. Association of serum lipids with diabetic retinopathy in urban South Indians–the Chennai Urban Rural Epidemiology Study (CURES) Eye Study−2. Diabet Med. (2006) 23:1029–36. doi: 10.1111/j.1464-5491.2006.01890.x
7. Sachdev N, Sahni A. Association of systemic risk factors with the severity of retinal hard exudates in a north Indian population with type 2 diabetes. J Postgrad Med. (2010) 56:3–6. doi: 10.4103/0022-3859.62419
8. Keech AC, Mitchell P, Summanen PA, O'Day J, Davis TME, Moffitt MS, et al. Effect of fenofibrate on the need for laser treatment for diabetic retinopathy (FIELD study): a randomised controlled trial. Lancet. (2007) 370:1687–97. doi: 10.1016/S0140-6736(07)61607-9
9. Chew EY, Ambrosius WT. Update of the ACCORD eye study. N Engl J Med. (2011) 364:188–9. doi: 10.1056/NEJMc1011499
10. Serra-Aracil X, Pascua-Sol M, Badia-Closa J, Navarro-Soto S, en nombre del grupo del Comite C, Seccion de F, et al. How to start and develop a multicenter, prospective, randomized, controlled trial. Cir Esp (Engl Ed). (2020) 98:119–26. doi: 10.1016/j.cireng.2020.03.002
11. Burgess S, Thompson SG. Mendelian Randomization Methods for Causal Inference Using Genetic Variants Second Edition. Boca Raton, FL: CRC Press (2021).
12. Xie J, Huang H, Liu Z, Li Y, Yu C, Xu L, et al. The associations between modifiable risk factors and nonalcoholic fatty liver disease: A comprehensive Mendelian randomization study. Hepatology. (2022) 77:949–964. doi: 10.1002/hep.32728
13. Bowden J, Del Greco MF, Minelli C, Davey Smith G, Sheehan NA, Thompson JR. Assessing the suitability of summary data for two-sample Mendelian randomization analyses using MR-Egger regression: the role of the I2 statistic. Int J Epidemiol. (2016) 45:1961–74. doi: 10.1093/ije/dyw220
14. Huedo-Medina TB, Sanchez-Meca J, Marin-Martinez F, Botella J. Assessing heterogeneity in meta-analysis: Q statistic or I2 index? Psychol Methods. (2006) 11:193–206. doi: 10.1037/1082-989X.11.2.193
15. Bowden J, Davey Smith G, Burgess S. Mendelian randomization with invalid instruments: effect estimation and bias detection through Egger regression. Int J Epidemiol. (2015) 44:512–25. doi: 10.1093/ije/dyv080
16. Verbanck M, Chen CY, Neale B, Do R. Detection of widespread horizontal pleiotropy in causal relationships inferred from Mendelian randomization between complex traits and diseases. Nat Genet. (2018) 50:693–8. doi: 10.1038/s41588-018-0099-7
17. Mikshowsky AA, Gianola D, Weigel KA. Assessing genomic prediction accuracy for Holstein sires using bootstrap aggregation sampling and leave-one-out cross validation. J Dairy Sci. (2017) 100:453–64. doi: 10.3168/jds.2016-11496
18. Hemani G, Zheng J, Elsworth B, Wade KH, Haberland V, Baird D, et al. The MR-Base platform supports systematic causal inference across the human phenome. Elife. (2018) 7:e34408. doi: 10.7554/eLife.34408
19. Bowden J, Del Greco MF, Minelli C, Davey Smith G, Sheehan N, Thompson J, et al. framework for the investigation of pleiotropy in two-sample summary data Mendelian randomization. Stat Med. (2017) 36:1783–802. doi: 10.1002/sim.7221
20. Lin Y, Zhu X, Luo W, Jiang B, Lin Q, Tang M, et al. The causal association between obesity and primary open-angle glaucoma: a two-sample mendelian randomization study. Front Genet. (2022) 13:835524. doi: 10.3389/fgene.2022.835524
21. Schaumberg DA, Christen WG, Hankinson SE, Glynn RJ. Body mass index and the incidence of visually significant age-related maculopathy in men. Arch Ophthalmol. (2001) 119:1259–65. doi: 10.1001/archopht.119.9.1259
22. Glynn RJ, Christen WG, Manson JE, Bernheimer J, Hennekens CH. Body mass index. An independent predictor of cataract. Arch Ophthalmol. (1995) 113:1131–7. doi: 10.1001/archopht.1995.01100090057023
23. Miyazawa-Hoshimoto S, Takahashi K, Bujo H, Hashimoto N, Saito Y. Elevated serum vascular endothelial growth factor is associated with visceral fat accumulation in human obese subjects. Diabetologia. (2003) 46:1483–8. doi: 10.1007/s00125-003-1221-6
24. Considine RV, Sinha MK, Heiman ML, Kriauciunas A, Stephens TW, Nyce MR, et al. Serum immunoreactive-leptin concentrations in normal-weight and obese humans. N Engl J Med. (1996) 334:292–5. doi: 10.1056/NEJM199602013340503
25. Uckaya G, Ozata M, Bayraktar Z, Erten V, Bingol N, Ozdemir IC. Is leptin associated with diabetic retinopathy? Diabetes Care. (2000) 23:371–6. doi: 10.2337/diacare.23.3.371
26. Gariano RF, Nath AK, D'Amico DJ, Lee T, Sierra-Honigmann MR. Elevation of vitreous leptin in diabetic retinopathy and retinal detachment. Invest Ophthalmol Vis Sci. (2000) 41:3576–81.
27. Sierra-Honigmann MR, Nath AK, Murakami C, Garcia-Cardena G, Papapetropoulos A, Sessa WC, et al. Biological action of leptin as an angiogenic factor. Science. (1998) 281:1683–6. doi: 10.1126/science.281.5383.1683
28. Zhou JB, Yuan J, Tang XY, Zhao W, Luo FQ, Bai L, et al. Is central obesity associated with diabetic retinopathy in Chinese individuals? An exploratory study. J Int Med Res. (2019) 47:5601–12. doi: 10.1177/0300060519874909
29. Man RE, Sabanayagam C, Chiang PP Li LJ, Noonan JE, Wang JJ, et al. Differential association of generalized and abdominal obesity with diabetic retinopathy in asian patients with type 2 diabetes. JAMA Ophthalmol. (2016) 134:251–7. doi: 10.1001/jamaophthalmol.2015.5103
30. Ranganathan RS, Ezhil Vendhan K, Shanmugasundaram R, Manimozhian N. High fasting blood sugar and increased waist circumference as risk factors for diabetic retinopathy in type 2 diabetes patients older than 45 years. Cureus. (2022) 14:e28291. doi: 10.7759/cureus.28291
31. Yau JW, Rogers SL, Kawasaki R, Lamoureux EL, Kowalski JW, Bek T, et al. Global prevalence and major risk factors of diabetic retinopathy. Diabetes Care. (2012) 35:556–64. doi: 10.2337/dc11-1909
32. Wong TY, Cheung N, Tay WT, Wang JJ, Aung T, Saw SM, et al. Prevalence and risk factors for diabetic retinopathy: the Singapore Malay Eye Study. Ophthalmol. (2008) 115:1869–75. doi: 10.1016/j.ophtha.2008.05.014
33. Zhang X, Qiu B, Wang Q, Sivaprasad S, Wang Y, Zhao L, et al. Dysregulated serum lipid metabolism promotes the occurrence and development of diabetic retinopathy associated with upregulated circulating levels of VEGF-A, VEGF-D, and PlGF. Front Med (Lausanne). (2021) 8:779413. doi: 10.3389/fmed.2021.779413
34. Gray R, Wheatley K. How to avoid bias when comparing bone-marrow transplantation with chemotherapy. Bone Marrow Transpl. (1991) 7:9–12.
Keywords: proliferative diabetic retinopathy (PDR), body mass index (BMI), dyslipidemia, Mendelian randomization, causal effect
Citation: Shu Y, Zhou Q, Shao Y, Lin H, Qu S, Han W, Lv X and Bi Y (2023) BMI and plasma lipid levels with risk of proliferative diabetic retinopathy: a univariable and multivariable Mendelian randomization study. Front. Nutr. 10:1099807. doi: 10.3389/fnut.2023.1099807
Received: 16 November 2022; Accepted: 24 August 2023;
Published: 13 September 2023.
Edited by:
Manja Zec, University of Arizona, United StatesReviewed by:
Zhipeng Wang, Northeast Agricultural University, ChinaOlufunke Olorundare, University of Ilorin, Nigeria
Copyright © 2023 Shu, Zhou, Shao, Lin, Qu, Han, Lv and Bi. This is an open-access article distributed under the terms of the Creative Commons Attribution License (CC BY). The use, distribution or reproduction in other forums is permitted, provided the original author(s) and the copyright owner(s) are credited and that the original publication in this journal is cited, in accordance with accepted academic practice. No use, distribution or reproduction is permitted which does not comply with these terms.
*Correspondence: Yanlong Bi, biyanlong@tongji.edu.cn; Qi Zhou, zhouqi2003@tongji.edu.cn